Recoil lineshapes in hard X-ray photoelectron spectra of large molecules – free and anchored-on-surface 10-aminodecane-1-thiol†
Edwin
Kukk
 *a,
Ralph
Püttner
 b and
Marc
Simon
 c
c
aDepartment of Physics and Astronomy, University of Turku, FI-20014 Turku, Finland. E-mail: edwin.kukk@utu.fi
bFachbereich Physik, Freie Universität Berlin, D-14195 Berlin, Germany
cSorbonne Université, CNRS, UMR 7614, Laboratoire de Chimie Physique-Matière et Rayonnement, F-75005 Paris, France
First published on 30th March 2022
Abstract
Core-level photoelectron spectroscopy of molecules presents unique opportunities but also challenges in the Hard X-ray Spectroscopy (HAXPES) realm. Here we focus on the manifestation of the photoelectron recoil effects in core-level photoemission spectra, using the independent normal-mode oscillators approach that allows to model and investigate the resulting recoil lineshapes for molecules of large sizes with only a slight computational effort. We model the recoil lineshape for N 1s and C 1s photoemission using the 10-aminodecane-1-thiol molecule as an example. It represents also a class of compounds commonly used in creating self-assembled monolayers (SAMs) on surfaces. Attachment of the -SH head group to the surface is modelled here in a simplified way by anchoring the sulfur atom of a single molecule. The effects of the orientation of photoemission in the molecular frame on the recoil lineshape of such anchored molecules are illustrated and discussed as a possible geometry probe. Time-evolution of the recoil excitations from the initial emission site across the entire molecule is also visualized.
1 Introduction
Since the invention of the ESCA (Electron Spectroscopy for Chemical Analysis) methodology,1 detailed analysis of the line shapes in photoelectron energy spectra has played a key part in extracting physically and chemically relevant information on molecules, adsorbates and surfaces. Accurate determination of the core-level binding energies depends on proper accounting of all the factors affecting the electron energy, including the contributions not related to the intrinsic electronic properties of the sample. One example of such effects is the Doppler shift, arising when the emitter atom is in motion in relation to the laboratory-frame observer. The core-level photoemission lineshape from molecular targets is determined not only by the transitions between the electronic but also the vibrational and rotational levels. The Franck–Condon excitations accompanying the photoemission2 are a valuable probe into the changes of the geometry upon core ionization and, more generally, into the shapes of the potential energy surfaces of the states involved.3,4 Franck–Condon excitation analysis relies on decomposition of the observed vibrational envelope and on accurate determination of the intensities and energies of the individual transitions, for which a reliable and accurate model of the photoelectron lineshape is an essential prerequisite.In recent years, advances in instrumentation have allowed to extend high-resolution core-level photoelectron spectroscopy of very dilute, gas-phase molecular targets into the HAXPES (Hard X-ray Photoelectron Spectroscopy) realm.5–11 The high kinetic energy of the photoelectrons in HAXPES offers new opportunities such as allowing to tune the probing depth of the solid targets or, in gas-phase species, to extend the accessible regions of the potential energy surfaces. However, the photoelectron lineshape in the HAXPES regime should receive special scrutiny due to the new contributing factors that could safely be neglected in the near-threshold spectra. Here, we concentrate on two effects that gain prominence in the HAXPES regime – the recoil12–25 and Doppler22,23,25–28 effects in electron emission, either by direct photoemission or as Auger electrons.
2 Photoelectron recoil and Doppler effect in photoemission
2.1 Recoil model
In 1978, Domcke and Cederbaum12 predicted that the recoil momentum in molecular photoemission can induce significant vibrational and rotational excitations, depending on the kinetic energy of the outgoing electron. For the common excitation sources of the time, such as AlKα, the spectral modifications due to recoil were predicted to be quite noticeable. Development of synchrotron-based high-resolution electron spectroscopy, especially in the HAXPES regime, has allowed to directly investigate the recoil-induced effects in the molecular core-level photoemission of single gas-phase molecules and to model them at various levels of precision.14,25,29,30 These and other experimental studies have uniformly confirmed the validity of the fundamental assumptions in the recoil models, which can be summarized as follows:(i) Perhaps the most basic assumption of the used photoelectron recoil models is that the initial recoil momentum is entirely confined to the emitter atom.12,29,30 In core-level photoemission, the electron is emitted from a tightly localized, atomic-like orbital. (ii) The emitter atom acquires the recoil momentum near-instantaneously compared to the nuclear motion timescales. This is understood when considering that, in the HAXPES regime, the momentum of the photon is still negligible compared to the momentum of the photoelectron. Therefore, the electron must already have a suitable momentum before being emitted, in its orbital motion in atom. In a bonded nucleus-electron system, the nucleus always has the opposing momentum to electron, and when the bond is severed in photoemission (which is a much faster process than vibrational motion), the nucleus is near-instantaneously left with the unbalanced momentum – the recoil momentum. (iii) The recoil momentum of the emitter atom is then represented as a combination of translational recoil of the whole molecule, its rotations and excitations of the vibrational degrees of motion. This mapping is most straightforward in the momentum-space representation of the normal modes of motion, in which the emitter atom's momentum contribution to each mode is explicitly evident. More advanced descriptions such as by generalized Franck–Condon factors,13 combine these recoil excitations with the Franck–Condon excitations that are due to the change of the molecular potential upon ionization.
The above assumptions (i)–(iii) are by no means valid only for isolated molecular species, but can be applied to the photoemission from solids as well. The difference is in the vibrational modes onto which the recoil momentum of the emitter atom is mapped, and how it shapes the photoelectron spectrum. In solids, the vibrational frequency spectrum is in much lower range, and recoil results in phonon excitations. For adsorbed molecules, the situation is intermediate and dependent on the strength of adsorbate-surface interaction. Again, the underlying assumptions for treating recoil remain the same as in gas phase, the difference is (i) the molecular orientation on surface is anisotropic (sometimes very well aligned) as opposed to isotropic molecules in gas, and (ii) the normal modes of the free molecule become modified by the interaction with the substrate and can couple to the low-frequency modes of the substrate.31 Here, we will apply the universal recoil model to the case of a large molecular system which is also of interest from practical aspects, first as gas-phase species and then as attached to a surface. In the latter case, adaptations of the recoil model are required to account for the oriented molecules, as developed below. Secondly, the changes in the normal modes must be considered and we use a simple approximation based on gas-phase analysis and present its justification.
2.2 Recoil lineshape – from atoms to molecules
Let us first review briefly how the recoil and Doppler effect influence the energy balance in the photoemission event. When a free atom emits a photoelectron, energy in the amount of| Eem = hν − Eb | (1) |
where me and mA are the masses of the electron and the emitter atom, respectively, we obtain the kinetic energy of the electron Eelkin and the recoil energy Eatr of the emitter atom as
 | (2) |
![[v with combining right harpoon above (vector)]](https://www.rsc.org/images/entities/i_char_0076_20d1.gif) A:
A: | (3) |
As seen from eqn (3), both the recoil and Doppler contributions to the Eatr increase with the photoelectron energy – the first linearly and the second as  – making them much more prominent in the HAXPES regime than in near-threshold spectroscopy.
The Doppler shift is dependent on the atomic velocity vectors that are randomly and isotropically oriented in a gas in thermal equilibrium. The Doppler shift then becomes the Doppler broadening of the recoil energy distribution Fr (Er) which is directly reflected in broadining of the observed photoemission lineshape. Using the Maxwell–Boltzmann distribution of vA,e at a given temperature T, we obtain the distribution Fr (Er) that follows Gaussian (normal) distribution:
 | (4) |
For the purposes of obtaining the recoil lineshape, one can treat the three degrees of freedom of an atomic gas as separate and independent “oscillators”, each receiving one third of the recoil energy, with their own recoil energy distributions. The final recoil lineshape is then a convolution of all three independent contributions.25 Such a definition is useful, as it allows for a systematic extension to molecular targets. In the molecular case, the motion of the emitter atom must be considered not in three, but in 3N degrees of freedom (N – number of atoms in molecule). Each of the 3N degrees of freedom is now modelled as an independent oscillator receiving a fraction of the recoil energy and making a contribution to the total recoil lineshape, which is obtained as a 3N-fold convolution of the individual contributions. Such recoil lineshape model can be quite easily extended to molecular systems of large size.
Next, we describe briefly, how is the lineshape obtained and what are the characteristics of the individual oscillators.
2.3 Recoil lineshape for molecules of arbitrary size
The 3N oscillators receiving the photoelectron recoil in a molecule correspond to the normal modes, including the translational, rotational and vibrational motions. Each of these categories gives a contribution to the total recoil lineshape, but these individual contributions Fr,n (Er) now have distinct characteristics depending on the type of motion described by the oscillator n. The overall recoil lineshape (as convolution) is characterized by the recoil-induced energy shift, broadening and asymmetry. Note that as the origin of the model still lies in eqn (3) and involves the translational and rotational thermal motion by the respective oscillators, the lineshape includes the translational32–34 and rotational26,27 Doppler broadening.In a classical normal-mode molecular model, where the quantization of the vibrational levels is not taken into account, the recoil lineshape contribution by the vibrational oscillators would be very similar to that of the translational and rotational ones. It would display a recoil shift of the mean value and, at temperatures T > 0, a Gaussian Doppler broadening. However, since the typical recoil energy is comparable to, and often smaller than the vibrational quantum, quantum effects must be included in vibrational normal-mode oscillators. A major consequence of that comes from the zero-point energy contained by the quantum oscillators, which means that there is Doppler effect in the photoemission from the vibrational oscillators even at T = 0 K. But whereas in a classical oscillator any Doppler energy shift is possible, in a quantum oscillator it is quantized as transitions to upper vibrational levels. Thus, the zero-point energy of the molecules is reflected in the recoil lineshape as recoil-induced vibrational progressions of various normal modes. The other consequences of the quantum nature of the vibrational recoil are:
(i) The distribution of the recoil-excited vibrational levels in each vibrational oscillator in a zero-point motion is given by Poisson, not the normal (Gaussian) distribution. This results in an asymmetric recoil lineshape from the vibrational oscillators.
(ii) The ability of the vibrational oscillators to contain thermal energy (related to the specific heat) is diminished due to the quantization. Thermal vibrational energy is added to the zero-point energy, but the added amount is smaller than the corresponding thermal energy would be in a classical vibrational oscillator. In quantum oscillators, the added energy is seen as hot-band recoil excitations from thermally populated higher vibrational levels. These hot-band transitions are approximated in our independent oscillator model by an additional Gaussian broadening.
In polyatomic molecules, all vibrational modes combine as the recoil-excited vibrational profile in the photoemission spectrum. Combining many vibrational normal mode excitations in larger molecules often renders the individual transitions unresolvable. However, the total recoil lineshape still retains the asymmetry that arose from the quantization of each individual oscillator.
The overall description of the lineshape is given by its first (average recoil shift), second (variance, or broadening of the profile) and third (skewness, or asymmetry) statistical moments:
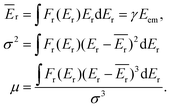 | (5) |
Since the emitter atom is the initial recipient of the recoil momentum and energy, the mean recoil shift Ēr of the lineshape is independent of the total size of the system, and is only determined by the mass of the emitter atom (eqn (2)). The overall width of the recoil lineshape σ is dependent on the system's size and geometry.
3 Distribution of recoil amongst the normal modes
In order to model the recoil lineshape for a particular system, it is necessary to know the contributions from each normal mode oscillator to the total recoil lineshape. These are obtained from the normal-mode analysis. When the normal-mode vectors are expressed in the coordinate displacement (x, y, z)i, i = 1, 2… N basis, the energy fractions of atom i = A in each mode n are given by: | (6) |
Knowing the coefficients fn, the Poisson distributions of recoil-induced vibrational excitations in each vibrational oscillator n at T = 0 K can be obtained.25 They have the mean (average recoil energy), variance and skewness as
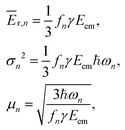 | (7) |
The application of the above-described model to the experiment as well as the strength of the recoil excitations in the HAXPES regime is illustrated by Fig. 1, reproducing the C 1s spectrum of CF4 measured at 330 eV29 and 8.5 keV.18 It is apparent from the figure that in the HAXPES regime, the recoil effects are a major and integral part of the photoemission process and also, that the recoil modeling is able to reproduce the spectrum with very good accuracy. Since there is almost no Franck–Condon excitations in this spectrum29 (the asymmetry of the peak is due to the post-collision-effect (PCI)), population of the individual vibrational levels (blue bars) in the HAXPES spectrum is entirely a recoil effect. The total recoil energy in this case is 0.375 eV, which is the shift of the centroid of the HAXPES profile relative to the low-energy one. The shift of the ν = 0 level, 51 meV, is due to the recoil in the translational degrees of freedom.
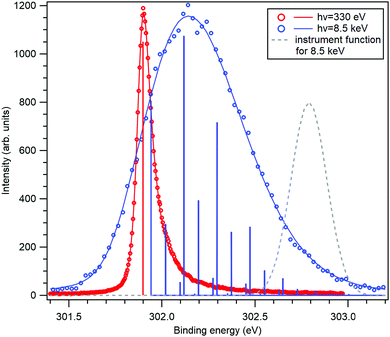 | ||
| Fig. 1 The C 1s photoelectron spectrum from gas-phase CF4 molecule, measured near the ionization threshold29 (red) and in the HAXPES regime18 (blue). The HAXPES spectrum is fitted using the recoil lineshape model. Excitations of vibrational levels are shown by vertical bars. The near-threshold spectrum shows no vibrational excitations, while the HAXPES spectrum is strongly modified by the recoil. Dashed curve shows the instrument function for the HAXPES measurement. | ||
3.1 Recoil in gas-phase 10-aminodecane-1-thiol
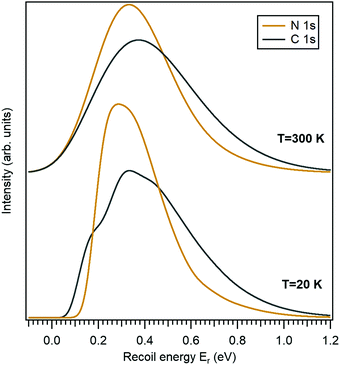
In this work we use the 10-aminodecane-1-thiol (SH-C10H20-NH2) molecule, where the thiol and amine groups are terminating the decane chain, as an example. The only molecule-specific part of the recoil excitation and the lineshape analysis is obtaining the normal mode vectors. Geometry optimization and normal mode analysis was done using the GAMESS quantum chemistry package36 as a self-consistent-field (SCF) restricted Hartree–Fock (RHF) calculation, using the 6-31G basis set.37 It provided the normal-mode vectors as coordinate displacements and the normal-mode frequencies.Fig. 2 shows the recoil lineshape simulations for the electron emission energy of 10 keV for both the N 1s and the C 1s photoelectrons. Since the molecule contains 10 C atoms, the lineshape shown for the C 1s is sum of their individual recoil lineshapes. The lower curves correspond to a low temperature of 20 K, where the contributions from the translational and rotational Doppler broadening are minor. The molecule has 35 atoms and 105 degrees of freedom, and the resulting lineshape at 20 K is essentially defined by the 99-fold convolution of the discrete excitations in the individual vibrational quantum oscillators, resulting in a very large number of vibrational overtones. The broadening and asymmetry arise from these excitations. The recoil lineshape has the mean energy of 392 meV for N 1s and 457 meV for C 1s, equal to the recoil energy in a free N and C atom emitting a 10 keV photoelectron (eqn (2)), correspondingly.
The upper curves show the same recoil lineshapes but at room temperature. The additional Gaussian broadening now arises because of the translational and rotational thermal motion and also because of the hot bands in vibrational excitations.
The recoil lineshape represents a loss of electron kinetic energy in experimental photoelectron spectra. When applying the recoil lineshape to the experimental photoelectron spectra, further broadenings due to core–hole lifetime and instrumental resolution must be added. Also, core-level photoionization typically exhibits Franck–Condon vibrational excitations due to the changes in the molecular potential energy surfaces upon core ionization. Each vibrational peak in the Frack–Condon profile is represented by one recoil lineshape.
4 Photoemission and recoil in self-assembled monolayers
Although the above model was presented for single molecules in gas phase, the photoelectron recoil effect is much more general and is an integral part of surface photoemission, for example.6,16,38,39 It could yield valuable additional information on molecular species, adsorbed on surfaces. Next, we explore the recoil lineshapes for photoemission from a single, oriented molecule anchored to a surface, as the simplest representation of molecules in self-assembled monolayers (SAMs).Creating SAMs of molecules on surfaces is a very efficient way of tailoring surface properties.40–43 Common molecules used in SAMs consist of a linear chain of various length, terminated by a head group that will chemically bond to the substrate and a tail group at the other end, that is modified to functionalize the surface. A large variety of molecules can be used to form SAMs, with different head and tail group, and the connecting chain. Typically these are fairly large molecules, making them a suitable target for the application of the recoil lineshape model. The molecule in the example above, 10-aminodecane-1-thiol, represents a very common group of molecules forming SAMs.41,44–47 The -SH head group bonds to a typically metallic substrate.41,44 Various tail groups of can used in functionalizing the thiol SAMs, the amine group being one of the most common.46
Core-level photoelectron spectroscopy (XPS) has been often used as a method to characterize SAMs, typically using home lab equipment and characteristic X-ray excitation.46,48,49 Analysis of the C 1s, S 2p and N 1s photolines, for example, provides valuable information about chemical bonding.48 Using synchrotron radiation for the characterization of SAMs44,45,50 allows for superior resolution in revealing the details of the photoelectron lineshape; it also offers tunable photon energy extending into the HAXPES regime where the recoil excitations are efficiently created.
There are particular advantages in exploring the photoelectron recoil effects in SAMs as opposed to gas-phase targets:
(i) Strong recoil effects are observed in the HAXPES regime, particularly for core-ionization of light elements (C,N,O) where the emitted electrons have high kinetic energy. This, however, comes at the cost of much reduced photoabsorption cross-sections compared to the near-threshold ionization. Consequently, the low target densities of gas-phase molecules present a challenge in obtaining spectra of sufficient quality and the high target density of SAMs helps to overcome it.
(ii) As described above, in the gas phase the recoil lineshape incorporates thermal Doppler broadening of the translational and rotational motion of the molecules, which increases proportionally to the square root of the electron kinetic energy. This broadening contains little useful information on the molecule's structure but can obscure the more interesting recoil features. When a molecule in anchored on surface, it eliminates the translational and rotational Doppler broadening. Furthermore, since the recoil momentum is still initially fully contained in the emitter atom as in the gas phase, but as the translational degrees of freedom are now unable the receive recoil energy, correspondingly more vibrational excitations are created.
(iii) The amount of rotational Doppler and hot-band broadening can be greatly reduced by cooling the surface, as lower temperatures than in gas phase – as low as 2 K, see Ref. 51 – can be more easily reached.
(iv) The orientation of the molecules in gas phase is typically isotropic and unknown for each photoionization event, although in some cases for small molecules, the orientation could be determined in an electron–ion coincidence measurement. In SAM's, control over the photoemission direction in the molecular frame is much more easily achieved by altering the surface orientation with respect to the electron detection direction.
4.1 Photoelectron recoil in SAMs of 10-aminodecane-1-thiol
In extending the recoil lineshape model from gas phase to SAMs and adsorbates in general, the attachment of the head group to the surface must be taken into account and the orientation of the electron emission in the molecular frame must be specified. In this first exploration of recoil effects in the HAXPES spectra of molecules-on-surface, our focus is not in the adsorbate chemistry but on the changes that arise when the molecule becomes fixed in space. In chosing the simplest yet physically reasonable – for the purpose of recoil analysis – method of modeling the attachment to the substrate, we relied on studies of molecular geometry and vibrations in adsorbates. The closest to our case is a vibrational analysis by Gale of SC18H37 on Au[111],52 but most insight is provided by the vibrational analysis of thiophenolate on silver.31 They found that for 11 of the high-frequency modes, the change of frequency between the free molecule and adsorbate is between 30 and 50 cm−1 (3.7–6.2 meV); for the rest, the change is smaller The authors conclude that “the vibrational normal modes of the thiophenolate, except modes 7, 11, and 28, are not changed qualitatively by the adsorption.”The most direct transition from isotropically oriented gas-phase molecules to oriented, fixed-on-space molecules on surfaces is given by “anchoring” the atom that bonds to the substrate by assigning it a very large mass. This utilizes the vibrational analysis of the isolated molecule to a large extent. After the geometry optimization and obtaining the Hessian force constant matrix for a free molecule, the attachment to the substrate in SAM was effectively created (for recoil purposes) by replacing the sulfur atom in the head group of 10-aminodecane-1-thiol by a large mass of M = 10![[thin space (1/6-em)]](https://www.rsc.org/images/entities/char_2009.gif) 000 μ. The normal-mode eigenvalue analysis was then repeated, leaving the geometry and the force constants unchanged. Calculating the recoil normal-mode energy fraction coefficients fn for a chosen emitter atom (other than the surface-bonded atom) now effectively removes the contribution from the translational modes and modified the rotational modes so that the molecule rotates around the attachment point. The new normal mode vectors and eigenvalues also reflect the immobility of the S atom.
000 μ. The normal-mode eigenvalue analysis was then repeated, leaving the geometry and the force constants unchanged. Calculating the recoil normal-mode energy fraction coefficients fn for a chosen emitter atom (other than the surface-bonded atom) now effectively removes the contribution from the translational modes and modified the rotational modes so that the molecule rotates around the attachment point. The new normal mode vectors and eigenvalues also reflect the immobility of the S atom.
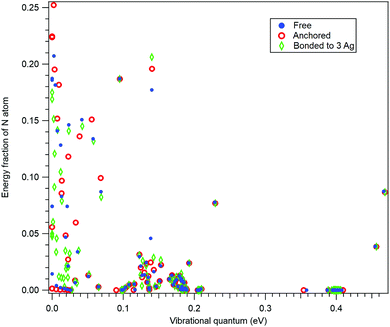
In order to further confirm the suitability of the simple anchoring approach for the recoil study purposes, we performed normal mode analysis for three scenarios: (i) for isolated 10-aminodecane-1-thiol molecule, (ii) by anchoring the S atom and (iii) with the S atom bonded to a rudimentary cluster of three Ag atoms. As for (i), also for case (iii) the geometry optimization was performed at the restricted Hartree–Fock (RHF) level of theory using the 6-31G basis set.37Fig. 3 shows a comparison between these three cases as the fractions the N atom contributes to the vibrational energy of each normal mode, plotted against the eigenenergies of the modes. In other words, it shows how recoil-active (for N 1s emission) is each mode, and what are the vibrational quanta of the modes – this is all the information needed to calculate the recoil lineshape for core-level photoemission from the N atom. As seen, neither the anchoring nor adding the rudimentary Ag substrate significantly affects the high-frequency modes. The high-frequency modes are the ones that mostly define the features of the recoil lineshape that are particular to the given molecule, emitter atom and orientation.
The low-energy modes are, as expected, much more strongly affected in Fig. 3 by the substrate or anchoring. However, the recoil excitations of low-frequency modes do not result in distinct features in the recoil lineshape, but mainly contribute to the broadening of the profile. Although the recoil that goes to the low-frequency modes in a free molecule is distributed over a larger number of normal modes of the adsorbate-substrate system, the expected effect on the recoil lineshape would be practically indistinguishable from a free molecule. We therefore conclude that the simple anchoring approach is suitable when recoil momentum is received by the atoms not directly involved in bonding to the substrate.
The primary difference in the recoil from oriented (anchored) and isotropic (free) ensemble of molecules comes from accounting for the directionality of the emission in the molecular frame. A N 1s photoelectron emitted along the x-axis, e.g., recoil excites only the normal modes where the N atom moves along the x-axis. The photoemission orientation from the anchored molecules is easily accounted for, since the 3N normal modes are separated in the three spatial dimensions and in modeling photoemission along a certain axis, only the corresponding modes (oscillators) receive any weight.
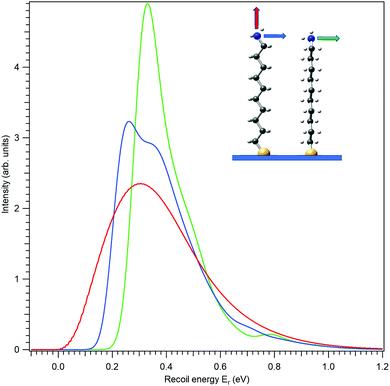
First, let us investigate recoil in the N 1s photoemission from the amino-group tail. Fig. 4 shows three modelled recoil lineshapes for the N 1s photoemission from 10-aminodecane-1-thiol molecules anchored on surface by the thiol group, for the photoelectron kinetic energy of 10 keV. A low surface temperature of 20 K was used for the simulation, minimizing the rotational Doppler broadening and the contributions by the hot vibrational bands. The three curves differ by the emission direction of the electron, as shown in the inset.
All three recoil lineshapes in Fig. 4 have the same mean energy value of 392 meV, same as for the isotropic N 1s emission in gas phase. However, the shapes of the three curves are very different. The broad and smooth profile from along-the-chain photoemission (red curve) is in fact very well described by the shifted gamma distribution that was proposed as the analytical approximate model shape for recoil excitations in HAXPES.25 The perpendicular recoil, in contrast, exhibits more distinct vibrational structures. These cannot be assigned to one particular normal mode, but to a number of modes excited by recoil, that have the vibrational quantum in the order of 150 meV. In the case of the blue curve in Fig. 4, for example, one of such modes can be described as the asymmetric stretching of the C–C–N bonds near the tail group.
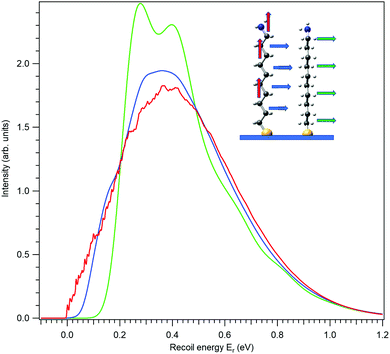
In our chosen molecule, the total photoionization cross section for C 1s photoemission is much larger than for N 1s simply because of the larger number of the C atoms. Therefore it is worthwhile to explore also the recoil lineshape for C 1s. A practically relevant recoil linehape would be created by adding up the lineshapes from each of the ten carbon atoms, as done in Fig. 5. Here, all the curves have the mean recoil energy of 457 meV, corresponding to a carbon atom emitting a 10 keV photoelectron. In the case of vertical emission (red curve) one notices a “noisy” region in the left-hand part. It appears in the simulated shape, since the discrete vibrational excitations, although there is a very large number of them, are not completely smoothed out by the Gaussian components in the recoil lineshape. In particular, there is almost no rotational recoil excitation in the combined C 1s photoemission of all atoms in vertical emission, while in horizontal emission the rotational recoil with its associated Gaussian broadening is the largest factor for obtaining a smooth lineshape. Individual C atoms all exhibit different recoil lineshapes and the summation over those as in Fig. 5 naturally smoothes out the individual features in the combined profile. In ESI,† these individual profiles are shown separately, also adding the chemical shift of each carbon as obtained at the level of Koopman's theorem from our calculations.
We thus saw that the recoil presents a very different excitation pattern depending on the photoemission direction in the molecular frame, more clearly so for the single-atom photoemission of N 1s.
4.2 Time-evolution of recoil excitations
The differences in recoil lineshapes for the different photoemission direction indicate that quite different manifolds of vibrational excitations are created by recoil. Investigating the recoil-energy-sharing coefficients fn confirms these differences and also shows that a large number of normal modes are excited. It would be illustrative in terms of the types of vibrational modes excited to visualize the recoil excitations and to follow in time, how the recoil momentum that is initially located at the emitter atom spreads across the molecule. Such time-evolution study is also based on the normal mode analysis, but is conveniently carried out in the momentum space. Representing the normal-mode vectors in momentum space allows to consider them directly together with the initial recoil vector: the latter is represented as a unique linear combination of the normal modes. First, the initial recoil vector is defined on the emitter atom only, and is antiparallel to the photoemission direction. This vector is then represented in the normal-vector basis by solving the matrix equation: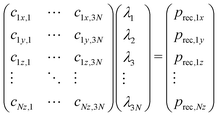 | (8) |
The solution vector λ gives the amplitudes and initial phases of the recoil-induced vibrational excitations in momentum representation. Each oscillator n has its own oscillation frequency ωn and therefore, although at t = 0 they combine to give exactly the recoil vector prec, they move out of phase, quickly spreading the recoil momentum across the molecule.
The three video animations in the ESI,† show a 500 fs period following the photoemission along and perpendicular to the decane chain. The animations show the initial momentum localized at the N atom. As it spreads across the molecule, the S atom remains anchored in place due to the assignment of a very large mass to it. Vertical photoemission (‘Aminodecanethiol anchor X.mp4’) excites notably the bending, but also stretching modes along the C10 chain. Also vibrations involving the N–H bonds in the amino group are strongly excited. In contrast, photoemission perpendicular to the C10 chain, but on the C–C–C bending plane (‘Aminodecanethiol anchor Y.mp4’), excites a very different set of normal modes. In particular, one can consider which vibrational motion can be associated with the vibrational structure seen in Fig. 4 for perpendicular emission (blue curve) in the ‘Aminodecanethiol anchor Y.mp4’ animation. We can identify its origin as the C–C–N asymmetric stretching motion near the tail group.
As the emitter atom is at the extreme distance RN from the center-of-mass (the anchoring point, S atom), the initial recoil ![[P with combining right harpoon above (vector)]](https://www.rsc.org/images/entities/i_char_0050_20d1.gif) N has a large angular momentum
N has a large angular momentum ![[L with combining right harpoon above (vector)]](https://www.rsc.org/images/entities/i_char_004c_20d1.gif) N =
N = ![[P with combining right harpoon above (vector)]](https://www.rsc.org/images/entities/i_char_0050_20d1.gif) N ×
N × ![[R with combining right harpoon above (vector)]](https://www.rsc.org/images/entities/i_char_0052_20d1.gif) N. This results in recoil excitation of a rotational normal mode, but the rotation is combined with a strong low-frequency bending excitation of the C10 chain. In this case also, the N–H excitations in the amino group are strong. In the third animation ‘Aminodecanethiol anchor Z.mp4’, the emission is also perpendicular to the C10 chain, but now also perpendicular to the C–C–C bending plane excites rotational recoil accompanied by strong torsional excitations of the C–C–C bend.
N. This results in recoil excitation of a rotational normal mode, but the rotation is combined with a strong low-frequency bending excitation of the C10 chain. In this case also, the N–H excitations in the amino group are strong. In the third animation ‘Aminodecanethiol anchor Z.mp4’, the emission is also perpendicular to the C10 chain, but now also perpendicular to the C–C–C bending plane excites rotational recoil accompanied by strong torsional excitations of the C–C–C bend.
5 Discussion
The above simulations of the recoil lineshape demonstrates that the recoil can be distinctly orientation-dependent even in photoemission from large molecules. In principle, analysis of the recoil lineshape in HAXPES spectra could provide information on the geometry, arrangement and surroundings of the molecules in SAMs or adsorbates in general, in addition to the chemical information from the traditional ESCA approach. One can point out a few questions that are closely linked to the properties of the recoil lineshape:(i) What is the orientation of the molecules on the surface and has the geometry of the molecule changed upon adsorption?
(ii) How do the neighboring molecules interact with the molecule receiving the photoelectron recoil? As noted before, the attachment of the molecule to the surface is modelled here in the simplest possible fashion, which allows rotational motion around the anchoring point (the sulfur atom) and thus also rotational Doppler broadening. Full rotational motion is, of course, not possible in a SAM. Instead, the interaction with the neighboring molecules would replace it with different types of motion, which can in general be described as collective vibrational modes. In a further in-depth analysis such motions can be added as additional oscillators to the recoil model. For example, Gale performed a force-field-based normal-mode analysis of thiols, SC18H37 on gold surface52 and obtained 672 normal modes of motion in the SAM, as compared to 168 in an isolated molecule. These additional modes can be accommodated by the recoil model and would represent collective recoil excitations in a SAM. However, as discussed earlier, the additional modes appear in the low-frequency range of the vibrations, which collectively contribute to the lineshape broadening, but not increasing the total broadening as the same recoil momentum will be subdivided between a larger number of vibrations.
(iii) How is the photoemission defined in the molecular frame of reference? The recoil model assumes that there is a single event in which momentum is divided between the photoelectron and the emitter atom (ion). However, the photoelectron can also scatter on other atoms of the molecule – more generally described as scattering of the electron wave on the molecular potential.53–55 The scattering effects have mostly been investigated for relatively low outgoing electron energies (below ≈100 eV), where the recoil effects are minor. Recently, however, the interaction of the outgoing photoelectron with the molecular environment has be studied also for kinetic energies approaching 1 keV and thus the HAXPES regime.56 Considering our example of Fig. 5, one can speculate that there could be significant scattering effects also in HAXPES regime, for example when the C 1s photoelectrons are emitted along the decane chain. The recoil model used here does not account for events beyond the initial atomic photoemission, nor are we aware of recoil studies that include post-emission scattering. It would be an interesting and possibly, in some cases necessary, extension of the recoil models.
At extremely high kinetic energies of the photoelectron, such as about 40 keV,24 new aspects of the interplay between the recoil, molecular dissociation and photoemission appear, again possibly requiring refinements to the recoil lineshape model.
The present exploration of the recoil effects in the HAXPES spectra and their dependency on the emission angle is at a conceptual level. In practical applications, resolving the relevant features are limited because of other broadening in the spectra – the lifetime width, instrumental resolution, chemical shifts in case of chemically nonequivalent atoms. Also, Franck–Condon excitations must be added to the recoil lineshape, requiring good-quality near-threshold reference data.
6 Conclusions
Photoelectron recoil effects in the HAXPES regime are a prominent and integral part of the photoemission process, significantly contributing to the observed lineshape. They can also bring new opportunities for probing the molecular properties and intermolecular interactions. An interesting and hitherto unexplored avenue is molecules as adsorbates on surfaces, particularly as self-assembled monolayers (SAMs). Recoil lineshape modeling can predict, with relatively little computational effort, recoil-related features in the HAXPES spectra of molecules consisting of tens and even hundreds of atoms. Even for such large systems, the recoil-induced lineshape effects in photoemission can be specific and distinct enough to provide useful insights for example into molecular geometry and orientation. Furthermore, by probing the recoil on specific atoms could shed light on whether it is involved on forming a chemical bond with the subtrate, complementing the chemical shifts information from X-ray photoelectron spectra. That potential is enhanced if the recoil lineshape and the underlying internal ro-vibrational excitations can be studied at different emission directions in the molecular frame, such as observing photoemission at variable angles from SAMs. Experimentally however, such investigations are likely to be highly demanding on the instrumentation, requiring for example high-resolution monochromators and high-transmission and -resolution electron energy analyzers covering an extended energy range.Here we have presented simulations that are based on the simplest (from the recoil aspect) model of molecules on surfaces. Numerous additional interactions due to the chemical bonding to the surface and inter-molecular interactions between molecules in SAMs are likely to modify the recoil effects, which could be a topic of future experimental and theoretical works.
Conflicts of interest
There are no conflicts to declare.Notes and references
- K. Siegbahn, Electron spectroscopy for atoms, molecules, and condensed matter, 1982 Search PubMed.
- E. Condon, Phys. Rev., 1928, 32, 858 CrossRef CAS.
- T. X. Carroll, J. Hahne, T. D. Thomas, L. J. Saethre, N. Berrah, J. Bozek and E. Kukk, Phys. Rev. A: At., Mol., Opt. Phys., 2000, 61, 042503 CrossRef.
- J. D. Bozek, N. Berrah, E. Kukk, T. D. Thomas, T. X. Carroll, L. J. Saethre, J. A. Sheehy and P. W. Langhoff, High-Resolution Molecular Inner-Shell Electron Spectroscopies, AIP Conference Proceedings, Chicago, Illinois, USA, 2000, pp. 188–204 Search PubMed.
- D. Céolin, J. Ablett, D. Prieur, T. Moreno, J.-P. Rueff, T. Marchenko, L. Journel, R. Guillemin, B. Pilette, T. Marin and M. Simon, J. Electron Spectrosc. Relat. Phenom., 2013, 190, 188–192 CrossRef.
- A. Sekiyama, Compendium of Surface and Interface Analysis, The Surface Science Society of Japa, Springer Singapore, Singapore, 2018, pp. 229–238 Search PubMed.
- M. Oura, T. Gejo, K. Nagaya, Y. Kohmura, K. Tamasaku, L. Journel, M. N. Piancastelli and M. Simon, New J. Phys., 2019, 21, 043015 CrossRef CAS.
- M. N. Piancastelli, T. Marchenko, R. Guillemin, L. Journel, O. Travnikova, I. Ismail and M. Simon, Rep. Prog. Phys., 2020, 83, 016401 CrossRef CAS.
- W. Drube, Synchrotron Radiation News, 2018, 31, 2–3 CrossRef.
- J.-P. Rueff, J. E. Rault, J. M. Ablett, Y. Utsumi and D. Céolin, Synchrotron Radiation News, 2018, 31, 4–9 CrossRef.
- C. Schlueter, A. Gloskovskii, K. Ederer, S. Piec, M. Sing, R. Claessen, C. Wiemann, C. Schneider, K. Medjanik, G. Schönhense, P. Amann, A. Nilsson and W. Drube, Synchrotron Radiation News, 2018, 31, 29–35 CrossRef.
- W. Domcke and L. Cederbaum, J. Electron Spectrosc. Relat. Phenom., 1978, 13, 161–173 CrossRef CAS.
- P. Sałek, F. Gel’mukhanov, H. Ågren, O. Björneholm and S. Svensson, Phys. Rev. A: At., Mol., Opt. Phys., 1999, 60, 2786–2791 CrossRef.
- E. Kukk, K. Ueda, U. Hergenhahn, X.-J. Liu, G. Prümper, H. Yoshida, Y. Tamenori, C. Makochekanwa, T. Tanaka, M. Kitajima and H. Tanaka, Phys. Rev. Lett., 2005, 95, 133001 CrossRef CAS PubMed.
- T. Fujikawa, R. Suzuki and L. Kövér, J. Electron Spectrosc. Relat. Phenom., 2006, 151, 170–177 CrossRef CAS.
- Y. Takata, Y. Kayanuma, M. Yabashi, K. Tamasaku, Y. Nishino, D. Miwa, Y. Harada, K. Horiba, S. Shin, S. Tanaka, E. Ikenaga, K. Kobayashi, Y. Senba, H. Ohashi and T. Ishikawa, Phys. Rev. B: Condens. Matter Mater. Phys., 2007, 75, 233404 CrossRef.
- F. Gel’mukhanov, P. Sałek and H. Ågren, Phys. Rev. A: At., Mol., Opt. Phys., 2001, 64, 012504 CrossRef.
- E. Kukk, T. Thomas, D. Céolin, S. Granroth, O. Travnikova, M. Berholts, T. Marchenko, R. Guillemin, L. Journel, I. Ismail, R. Püttner, M. Piancastelli, K. Ueda and M. Simon, Phys. Rev. Lett., 2018, 121, 073002 CrossRef CAS PubMed.
- J.-C. Liu, V. Vaz da Cruz, S. Polyutov, A. Föhlisch and F. Gel'mukhanov, Phys. Rev. A, 2019, 100, 053408 CrossRef CAS.
- Y. Krivosenko and A. Pavlychev, Chem. Phys. Lett., 2016, 233–236 CrossRef CAS.
- Y. Krivosenko and A. Pavlychev, Chem. Phys. Lett., 2013, 575, 107–111 CrossRef CAS.
- M. Simon, R. Püttner, T. Marchenko, R. Guillemin, R. K. Kushawaha, L. Journel, G. Goldsztejn, M. N. Piancastelli, J. M. Ablett, J.-P. Rueff and D. Céolin, Nat. Commun., 2014, 5, 4069 CrossRef CAS.
- D. Céolin, J.-C. Liu, V. Vaz da Cruz, H. Ågren, L. Journel, R. Guillemin, T. Marchenko, R. K. Kushawaha, M. N. Piancastelli, R. Püttner, M. Simon and F. Gel’mukhanov, Proc. Natl. Acad. Sci. U. S. A., 2019, 116, 4877–4882 CrossRef PubMed.
- M. Kircher, J. Rist, F. Trinter, S. Grundmann, M. Waitz, N. Melzer, I. Vela-Pérez, T. Mletzko, A. Pier, N. Strenger, J. Siebert, R. Janssen, L. Schmidt, A. Artemyev, M. Schöffler, T. Jahnke, R. Dörner and P. Demekhin, Phys. Rev. Lett., 2019, 123, 243201 CrossRef CAS.
- E. Kukk, D. Céolin, O. Travnikova, R. Püttner, M.-N. Piancastelli, R. Guillemin, L. Journel, T. Marchenko, I. Ismail, J. Martins, J.-P. Rueff and M. Simon, New J. Phys., 2021, 063077 CrossRef CAS.
- Y.-P. Sun, C.-K. Wang and F. Gel’mukhanov, Phys. Rev. A: At., Mol., Opt. Phys., 2010, 82, 052506 CrossRef.
- T. Thomas, E. Kukk, K. Ueda, T. Ouchi, K. Sakai, T. Carroll, C. Nicolas, O. Travnikova and C. Miron, Phys. Rev. Lett., 2011, 106, 193009 CrossRef CAS.
- Q. Miao, O. Travnikova, F. Gel’mukhanov, V. Kimberg, Y.-P. Sun, T. D. Thomas, C. Nicolas, M. Patanen and C. Miron, J. Phys. Chem. Lett., 2015, 6, 1568–1572 CrossRef CAS PubMed.
- T. D. Thomas, E. Kukk, R. Sankari, H. Fukuzawa, G. Prümper, K. Ueda, R. Püttner, J. Harries, Y. Tamenori, T. Tanaka, M. Hoshino and H. Tanaka, J. Chem. Phys., 2008, 128, 144311 CrossRef.
- E. Kukk, T. D. Thomas, K. Ueda, D. Céolin, S. Granroth, K. Kooser, O. Travnikova, D. Iablonsky, P. Decleva, D. Ayuso, R. Püttner, H. Levola, G. Goldsztejn, T. Marchenko, M. N. Piancastelli and M. Simon, Phys. Rev. A, 2017, 95, 042509 CrossRef.
- C. Herrmann and M. Reiher, Surf. Sci., 2006, 600, 1891–1900 CrossRef CAS.
- J. A. R. Samson, Rev. Sci. Instrum., 1969, 40, 1174–1177 CrossRef CAS.
- F. Gel’mukhanov, H. Ågren and P. Sałek, Phys. Rev. A: At., Mol., Opt. Phys., 1998, 57, 2511–2526 CrossRef.
- M. Patanen, S. Svensson and N. Martensson, J. Electron Spectrosc. Relat. Phenom., 2015, 200, 78–93 CrossRef CAS.
- E. Kukk, T. Thomas and K. Ueda, J. Electron Spectrosc. Relat. Phenom., 2011, 183, 53–58 CrossRef CAS.
- G. M. J. Barca, C. Bertoni, L. Carrington, D. Datta, N. De Silva, J. E. Deustua, D. G. Fedorov, J. R. Gour, A. O. Gunina, E. Guidez, T. Harville, S. Irle, J. Ivanic, K. Kowalski, S. S. Leang, H. Li, W. Li, J. J. Lutz, I. Magoulas, J. Mato, V. Mironov, H. Nakata, B. Q. Pham, P. Piecuch, D. Poole, S. R. Pruitt, A. P. Rendell, L. B. Roskop, K. Ruedenberg, T. Sattasathuchana, M. W. Schmidt, J. Shen, L. Slipchenko, M. Sosonkina, V. Sundriyal, A. Tiwari, J. L. Galvez Vallejo, B. Westheimer, M. Wloch, P. Xu, F. Zahariev and M. S. Gordon, J. Chem. Phys., 2020, 152, 154102 CrossRef CAS.
- M. M. Francl, W. J. Pietro, W. J. Hehre, J. S. Binkley, M. S. Gordon, D. J. DeFrees and J. A. Pople, J. Chem. Phys., 1982, 77, 3654–3665 CrossRef CAS.
- S. Suga and A. Sekiyama, Eur. Phys. J. Spec. Top., 2009, 169, 227–235 CrossRef.
- Y. Kayanuma, in Hard X-ray Photoelectron Spectroscopy (HAXPES), ed. J. Woicik, Springer International Publishing, Cham, 2016, vol. 59, pp. 175–195 Search PubMed.
- A. Ulman, Chem. Rev., 1996, 96, 1533–1554 CrossRef CAS PubMed.
- C. Vericat, M. E. Vela, G. Corthey, E. Pensa, E. Cortés, M. H. Fonticelli, F. Ibañez, G. E. Benitez, P. Carro and R. C. Salvarezza, RSC Adv., 2014, 4, 27730–27754 RSC.
- T. Moldt, D. Brete, D. Przyrembel, S. Das, J. R. Goldman, P. K. Kundu, C. Gahl, R. Klajn and M. Weinelt, Langmuir, 2015, 31, 1048–1057 CrossRef CAS.
- M. Singh, N. Kaur and E. Comini, J. Mater. Chem. C, 2020, 8, 3938–3955 RSC.
- H. Rensmo, K. Westermark, D. Fitzmaurice and H. Siegbahn, Langmuir, 2002, 18, 10372–10378 CrossRef CAS.
- T. Laiho, J. Leiro, M. Heinonen, S. Mattila and J. Lukkari, J. Electron Spectrosc. Relat. Phenom., 2005, 142, 105–112 CrossRef CAS.
- J. Baio, T. Weidner, J. Brison, D. Graham, L. J. Gamble and D. G. Castner, J. Electron Spectrosc. Relat. Phenom., 2009, 172, 2–8 CrossRef CAS.
- S. D. Techane, L. J. Gamble and D. G. Castner, Biointerphases, 2011, 6, 98–104 CrossRef CAS PubMed.
- A.-S. Duwez, J. Electron Spectrosc. Relat. Phenom., 2004, 134, 97–138 CrossRef CAS.
- D. R. Baer, J. Vac. Sci. Technol., A, 2020, 38, 031201 CrossRef CAS.
- F. Chesneau, J. Zhao, C. Shen, M. Buck and M. Zharnikov, J. Phys. Chem. C, 2010, 114, 7112–7119 CrossRef CAS.
- B. Schrunk, L. Huang, Y. Wu, D. Mou, K. C. Lee, N. H. Jo and A. Kaminski, Rev. Sci. Instrum., 2019, 90, 093105 CrossRef.
- E. M. Gale, Self-assembled monolayer molecule dynamics are perturbed by surface- and surrounding monolayer-derived geometrical confinement, 2017 Search PubMed.
- U. Becker, O. Gessner and A. Rüdel, J. Electron Spectrosc. Relat. Phenom., 2000, 108, 189–201 CrossRef CAS.
- E. Kukk, D. Ayuso, T. D. Thomas, P. Decleva, M. Patanen, L. Argenti, E. Plésiat, A. Palacios, K. Kooser, O. Travnikova, S. Mondal, M. Kimura, K. Sakai, C. Miron, F. Martín and K. Ueda, Phys. Rev. A: At., Mol., Opt. Phys., 2013, 88, 033412 CrossRef.
- F. Ota, K. Yamazaki, D. Sébilleau, K. Ueda and K. Hatada, J. Phys. B: At., Mol. Opt. Phys., 2021, 54, 024003 CrossRef CAS.
- I. Vela-Peréz, F. Ota, A. Mhamdi, Y. Tamura, J. Rist, N. Melzer, S. Uerken, G. Nalin, N. Anders, D. You, M. Kircher, C. Janke, M. Waitz, F. Trinter, R. Guillemin, M. N. Piancastelli, M. Simon, V. T. Davis, J. B. Williams, R. Dörner, K. Hatada, K. Yamazaki, K. Fehre, P. V. Demekhin, K. Ueda, M. S. Schöffler and T. Jahnke, High-Energy Molecular-Frame Photoelectron Angular Distributions: A Molecular Bond-Length Ruler, 2021 Search PubMed.
Footnote |
| † Electronic supplementary information (ESI) available. See DOI: https://doi.org/10.1039/d1cp05777d |
| This journal is © the Owner Societies 2022 |


