Pressure tunable adhesion of rough elastomers†
Naomi
Deneke‡
,
Allison L.
Chau‡
and
Chelsea S.
Davis
 *
*
School of Materials Engineering, Purdue University, West Lafayette, Indiana 47906, USA. E-mail: chelsea@purdue.edu
First published on 18th November 2020
Abstract
The ability to control adhesion is critical in various technologies including wearable electronics, pressure sensitive adhesives, and robotic systems. Biomimetic fibrillar structures, random surface roughness, and chemical surface treatments have been employed to modify the adhesion energy of materials used in these applications. However, polymer thin film dewetting has not been investigated as a surface modification tool to control adhesion. In this work, polystyrene thin films are thermally annealed on a polydimethylsiloxane substrate, causing them to dewet and form stiff, microscopic asperities on the soft substrate. The size of the asperities increases with increasing pre-annealing film thickness. Adhesion is quantified by flat-punch normal indentation testing. The largest asperities exhibited a decrease in adhesion to below the sensitivity of the instrument. More interestingly, the surfaces covered with the smallest asperities displayed a pressure-dependent adhesive response. By increasing the normal compressive stress applied prior to separation, the total debonding energy increased monotonically on the smallest asperity-covered surfaces.
1. Introduction
1.1 Adhesion control via surface topography
The adhesive response of surfaces can be controlled by altering a material's surface topography; this tuneability is important in applications like soft robotics and pick-and-place microelectronics handling. Various patterning techniques such as microcontact printing, photolithography,1,2 plasma deposition,3 and inkjet printing4 have been used to alter surface properties. While these techniques are common, there are several disadvantages that can hinder industrial scaleup. For example, several complicated processing steps or costly equipment are often required to produce these patterns. One solution that addresses these problems is polymer thin film dewetting which quickly produces small scale roughness over large surface areas with minimal processing.5,6It has long been observed that, for the same material, a rough surface will exhibit a different adhesive response compared to a smooth surface. By changing the topography of a surface, its adhesion strength can be altered.7 Surface roughness can be random, where asperity size varies over several length scales, or ordered, where patterned surface features have a uniform geometry and size. Random surfaces are often characterized by surface roughness parameters such as center line average,7 lateral correlation length,8 root-mean-square,9 and power spectral density8,10–12 while ordered surfaces are often characterized by the average dimensions of surface features like wrinkle amplitude or wavelength,13,14 fibrillar post height or diameter,15 and asperity spacing.16 Adhesion can be enhanced or reduced by both random and ordered surface roughness depending on the modulus of the substrate and size of the asperities.17–20
Most surfaces are not perfectly flat; they are likely textured with peaks and troughs that make them rough. Surfaces with asperity sizes varying over multiple length scales are defined as randomly rough. While there appears to be total contact at the macroscopic length scale (apparent contact), magnification of the contact line reveals that contact often only occurs at the peaks of each asperity, significantly reducing the actual amount of interfacial contact (true contact). True contact is dependent on the modulus and degree of roughness of the adhered materials. Increasing asperity height or the distribution of asperity heights inhibits full contact as the material surface must deform more to contact the troughs between asperity peaks.21 Alternatively, decreasing the modulus of a soft solid enhances contact formation as it is easier to deform.22 While randomly rough surfaces are often associated with decreased adhesion relative to an analogous smooth interface, Fuller and Robert's experiments of smooth rubber spheres of various moduli rolling on roughened Perspex showed that enhanced adhesion can be achieved for low moduli and nano-scale surface roughness due to fast stress relaxation times allowing the rubber to conform to the rough surface and increase interfacial contact area.18 More recently, surface roughness of biomedical implants have been manipulated to increase soft, biological tissue adhesion to the devices.23–25
In contrast to random roughness, surfaces can be fabricated with control of surface features to have ordered roughness. Patterned surfaces have an ordered roughness that can affect adhesion strength. Wrinkles,13,14,26–28 fibrillar posts,15,29–31 and pancakes32 are similar in that they have a discrete, repeating topological pattern. These patterned surfaces have been shown to significantly impact adhesion. For instance, low amplitudes and wavelengths have been shown to enhance adhesion, while high amplitude and wavelength wrinkles have led to a reduction in adhesion.14 Chan et al. posited that this enhanced adhesion was due to increased contact line as opposed to contact area.13
Biomimetic structures, specifically fibrillar posts that replicate gecko setae, can greatly enhance adhesion relative to smooth, continuous surfaces of the same material33 and have even displayed switchable adhesion due to buckling.34 While these patterned surfaces have been shown to alter the adhesion of soft materials, they are often difficult or expensive to fabricate over large surface areas.14
1.2 Thin film dewetting
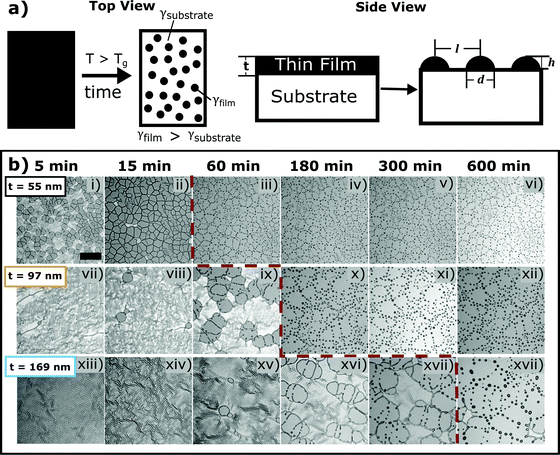
In the present study, dewetted polymer asperities on an elastomeric substrate are employed to tune adhesion. Polymer thin film dewetting is a phenomenon that arises from surface energy differences between a polymer thin film and substrate. By thermally annealing this bilayer system above the glass transition temperature of the polymer, the film will dewet from the substrate to form droplets with characteristic sizes and spacings. The droplets solidify to form axisymmetric, spherical cap-shaped asperities on the substrate surface upon quenching. Fig. 1(a) displays a schematic of the dewetting process.The mechanism and physics behind polymer thin film dewetting was first studied by Gunter Reiter, who characterized the resulting patterns.5,35–38 This complex phenomenon is not only influenced by intermolecular forces but is also affected by the viscoelastic properties of the polymer thin film, the fluid dynamics at the film/substrate interface, and the surface energy of the substrate, all of which affect the resulting dewetting patterns.
Reiter observed a power law relationship between asperity diameter and film thickness.5 Subsequent works investigated rupture and various dewetting mechanisms as well as dewetting pattern formation.39,40 The ability to control dewetting patterns utilizing heterogeneous substrates and chemically patterned substrates has also been rigorously studied in the past and has been shown to be an effective strategy.41–43
Dewetting of polymer thin films begin through three rupture mechanisms that initiate the dewetting process—spinodal decomposition, heterogeneous nucleation, and homogeneous (thermal) nucleation.44 Dewetting mechanisms vary depending on film thickness. Spinodal dewetting occurs for unstable films, which are usually thinner than 100 nm.45 In spinodal dewetting, van der Waals forces dominate, and holes are initiated by Laplace and disjoining pressures.35 This type of nucleation leads to a characteristic polygon pattern of asperities. Homogeneous nucleation, also known as thermal nucleation, requires external energy provided by thermal energy while heterogeneous nucleation relies on external contaminates such as particles, dust asperities or some other defect to act as a nucleation site for dewetting.44 Film thickness also plays a part in the resulting asperity formation pattern. Once a hole is initiated, it will continue to grow with a dewetting velocity that depends on a variety of factors including polymer viscosity and thermal annealing temperatures.45,46 As the holes grow, they eventually run into each other to form ribbons of polymer that eventually break up due to Rayleigh–Plateau rim instabilities,46 forming asperities on the surface. By altering film thickness, polymer viscosity, and surface energy differences between the substrate and polymer, the resulting asperity diameter, height, and areal density vary.
Little research has been performed utilizing polymer thin film dewetting to directly pattern flexible, elastomeric substrates. Past research has focused on utilizing silicon wafers coated with a hydrophobic coating. Han et al. concurrently utilized wrinkling and dewetting mechanics to precisely pattern an elastomeric substrate47 and Song et al. utilized poly(dimethyl siloxane) as a substrate and a liquid crystalline polymer as the film.48
In the present work, we explore the use of polymer (polystyrene) thin film dewetting on an elastic substrate (poly(dimethyl siloxane)) to create patterned surfaces with the intent of altering the substrate adhesion to develop a pressure tunable adhesive (PTA). We first characterize the surface topography followed by an in depth study of the adhesion of the substrate to a rigid surface observed by flat-punch indentation normal contact adhesion experiments.49 We show that the size scale of the dewetted asperities on the silicone surface has a dramatic impact on the adhesive response of the interface. More interestingly, we observe a monotonic pressure-dependent adhesive response for the smaller asperities where higher compressive loads prior to debonding result in greater separation forces.
2. Experimental methods and materials
To investigate dewetted thin films for adhesion modification, substrates were prepared by thermally annealing a glassy thin film to initiate dewetting from a silicone elastomer surface. Normal contact adhesion experiments were then performed.2.1 Dewetted asperity surface preparation
2.2 Pressure tunable adhesive surface characterization
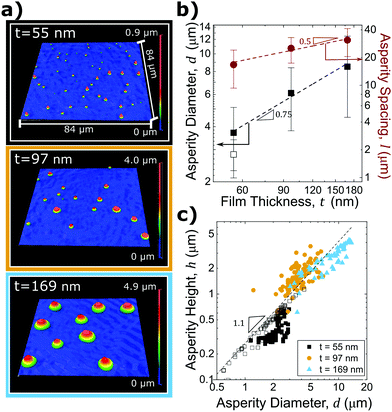
As noted previously, substrate topography can significantly impact adhesion. Therefore, analyzing the size, shape, and spatial distribution of dewetted asperities is essential for understanding and predicting adhesion of these rough surfaces. The asperity height, diameter, and spacing were measured to determine the relationship of asperity geometry with film thickness, t.The final asperity shape varies with t. As film thickness increases, asperity height also increases. PTA fabrication using film thicknesses of t = 55 nm, t = 97 nm, and t = 169 nm yield average asperity heights of h = 0.5 ± 0.1 μm, h = 1.6 ± 0.5 μm, and h = 2.9 ± 0.9 μm respectively; this surface topography is shown in Fig. 2(a). All samples have varying asperity heights that are likely the result of heterogeneous nucleation due to thermally-induced wrinkles (seen in images (i), (vii), and (xiii) of Fig. 1(b)), defects in the film, or contaminants such as dust on the substrate that serve as nucleation sites for dewetting.44,47 The standard distribution in asperity height increases with increasing film thickness, most likely due to fingering instabilities. Fingering instabilities as seen for the t = 97 nm and t = 169 nm films in images (ix), (xvi), and (xvii) of Fig. 1(b) have been shown to lead to varying asperity sizes due to irregularities or “flower-like” rim formations during the dewetting process.50
The asperity diameter, d, is determined by measuring the longest distance between two points on the PDMS-asperity contact perimeter; this is known as the Feret diameter. Fig. 2(b) displays the relationship between d and t, showing that d also increases with film thickness (d ∼ t0.75). Additionally, Fig. 2(c) displays h as a function of d and has a power law relationship between asperity height and diameter, h ∼ dx, where x is approximately 1.1 (indicating that asperities of various sizes are self-similar). The average asperity aspect ratio (h/d) is 0.24 ± 0.4.
As shown for the individual asperity geometry, the lateral spacing of the asperities also depends on the initial film thickness. Asperity spacing, l, is taken as the center-to-center distance between neighboring asperities in the characteristic polygonal asperity pattern. Smaller satellite asperities are accounted for by determining the distance from each asperity to the two nearest neighbors. Fig. 2(b) shows asperity spacing as a function of film thickness. As film thickness increases, asperity spacing increases as l ∼ t0.5. Due to the lateral resolution limits of the optical profilometer (OP) used to characterize asperity diameters, atomic force microscopy (AFM) scans were obtained on the smallest asperity PTA surfaces to confirm the average asperity dimensions. While the OP height measurements were in good agreement with the AFM-determined asperity heights, the asperity diameters were dramatically different than those measured with OP. Open symbols plotted in Fig. 2(b and c) signify data collected by AFM. AFM images for t = 55 nm samples are provided in the ESI.†
By altering film thickness and utilizing our understanding of polymer thin film dewetting physics, the resulting asperity geometry can be tuned, facilitating control over the topography of the substrate. This tunable asperity size and spacing can subsequently be utilized to alter the surface properties and geometry of the substrate to create a pressure tunable adhesive.
2.3 Contact adhesion testing apparatus
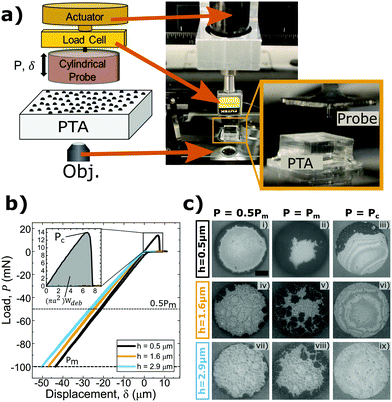
The contact adhesion tester (CAT) is a custom-built indentation device that vertically translates a probe towards and away from a substrate mounted over an optical microscope. This design allows the simultaneous measurement of the displacement, load, and interfacial contact images over the course of each experiment. The CAT is equipped with a linearly encoded actuator (PI N-381 NEXACT), a load cell with a 100 g capacity (Futek LSB200 S-Beam), and an uncoated aluminosilicate cylindrical flat punch probe (a = 0.5 mm, Edmund Optics) attached in series as shown in Fig. 3(a). The probe approaches the sample surface at a rate of 1 μm s−1 to make normal contact, indents the surface until a specified maximum compressive load, Pm, is reached, and finally retracts until full separation of the probe and sample occurs. The device is positioned over an optical microscope (Leica DMi8) to monitor the interfacial contact during testing. Fig. 3(b) displays representative experimental load values as a function of applied displacement for three different asperity sizes. Here, Pm of 100 mN was used for each test. Negative load and displacement values are compressive and positive values are associated with tensile or adhesive loads and vertical positions above the neutral plane of the substrate surface.3. PTA adhesion results and discussion
3.1 Normal contact adhesion testing
By using a flat punch indenter, or “probe”, to perform indentation testing, the energy of debonding between the probe and substrate can readily be determined. In flat punch indentation experiments, a probe is vertically displaced into the substrate until the desired compression of the substrate is achieved and then retracted until separation occurs. Throughout the course of each test, the displacement of the probe is controlled and the normal force acting on the probe is measured. Separation of the probe and substrate occurs when the energy of debonding, Udeb, required to separate the two surfaces is equivalent to the stored elastic deformation energy, Udef.49 Therefore, since Udef and Udeb are equivalent, Udeb may be found by integrating the tensile or adhesive portion of the load versus displacement curve, (shaded gray in Fig. 3(b)). An apparent work of debonding, Wdeb, is found by normalizing Udeb by the projected contact area so that
 | (1) |
3.2 Pressure tunability
Conventional flat punch adhesion tests between two smooth surfaces exhibit full, nearly instantaneous, interfacial contact formation upon approach and rapid, unstable interfacial failure and subsequent separation during retraction. The mechanism by which the probe contacts dewetted PS–PDMS surfaces is quite different. The probe initially contacts the tops of the largest PS asperities on the PDMS surface across the entire projected area of the probe face. Instead of deforming, the glassy polymer asperities are pushed into the more compliant elastomeric substrate as the displacement of the probe continues to indent the surface. Eventually, the asperities are pushed far enough into the PDMS sample for the probe to contact the exposed, dewetted areas of the PDMS surface surrounding the rigid asperities. Contact between the probe and PDMS occurs first around the outer perimeter of the circular probe face, and as the applied compressive load increases further, this interfacial contact area grows radially inward as seen in Fig. 3(c). Boussinesq's solution for the pressure distribution under a flat punch during compression can be used to understand this phenomenon as the pressure is known to be highest at the edge of the contact and lowest at the center for an axisymmetric cylinder indenting an elastic halfspace.51The size of the asperities affects the debonding energy required to separate the probe from the PTA. There is a marked decrease in Wdeb with increasing asperity size, as shown in Fig. 3(b). For the smallest asperity size (h = 0.5 μm), the sample undergoes tensile deformation due to adhesive forces between the probe and PDMS that keep the interface intact as the probe retracts from the surface. Once a critical pull-off load, Pc, is reached, separation occurs. However, the intermediate (h = 1.6 μm) and largest (h = 2.9 μm) asperity size PTAs do not display similar adhesive responses. Representative contact videos for each of the adhesion tests shown in Fig. 3 are provided in the ESI.† Increasingly larger asperity sizes must be displaced deeper into the PDMS substrate in order to achieve PDMS–probe interfacial contact. Therefore, larger asperities have greater localized stresses at the perimeter of each asperity where localized separation can initiate.
For a more complete analysis of the patterned substrates, multiple adhesion tests were performed on each surface, varying Pm. Fig. 4(a) displays the load versus displacement curves for indentation tests on the smallest asperity size sample (h = 0.5 μm) at each compressive load. The areal density, ρA, of asperities within the projected contact area is 0.33. The pressure-dependent adhesive response is shown by the increasing tensile responses of the curves where a higher Pm was applied. As Pm increases, Pc also increases, indicating that a greater work of debonding is required to separate the materials. From the images in Fig. 4(b), it is evident that as Pm increases, the maximum PDMS–probe interfacial contact, grows. Hence, pressure tunability is controlled by changes in the amount of interfacial contact that was initially formed. The work of debonding for an identical cylindrical probe in contact with smooth, uncoated PDMS is 32 mJ m−2 and independent of Pm. The presence of PS asperities on the surface results in a reduction in Wdeb ranging from 72% to 98% depending on the pre-load.
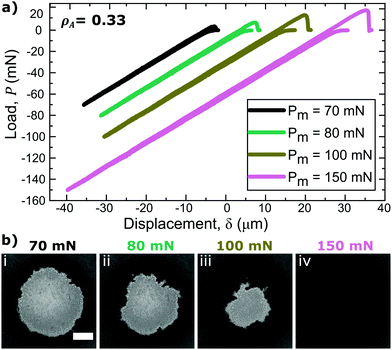 | ||
| Fig. 4 Load–displacement curves for indentation tests performed on h = 0.5 μm asperity size samples at various Pm (a) and the respective images of PDMS–probe interfacial contact at Pm (b) for surfaces with ρA ≈ 0.33 (similar plots and respective contact images for ρA ≈ 0.41 are presented in the ESI†). Increasing applied loads results in increased interfacial contact apparent full contact is achieved at 150 mN. The scale bar is 250 μm and applies to all images. | ||
Interestingly, it was shown that probing a surface with a different areal density of asperities, ρA, while holding the asperity size distribution constant, alters the adhesive response. Fig. 5(a and b) present magnified adhesion curves during adhesive deformation of surfaces of the smallest asperity size (h = 0.5 μm) and with a ρA of 0.33 and 0.41, respectively. It is evident from the presented data that a larger ρA results in a decreased adhesive response (Fig. 5(c)). Upon compression, the dewetted PS asperities are pushed into the PDMS substrate, forming a circumferential depression around each asperity where there is no contact between the probe and any part of the PTA material. The size of the depression is dependent on the size of the asperity and applied load. These depressions are essentially cracks where debonding can initiate. For a region of interest with a higher ρA, there will be more of these cracks and more regions of localized stress that can aid in separation. Still, the pressure tunability, taken as the slope of Wdeb as a function of Pm in Fig. 5(c), is unchanged as ρA differs. Therefore, the absolute value of Wdeb is dependent on the applied load and ρA while the pressure tunability is independent of ρA for a given asperity size. These results show that multiple adhesive responses can be achieved for a single material by application of rigid, axisymmetric surface asperities, and further control is attainable by changing the areal density of the asperities. From this information, a range of surface topographies can be fabricated with various bilayer material systems to design and obtain a desired PTA response.
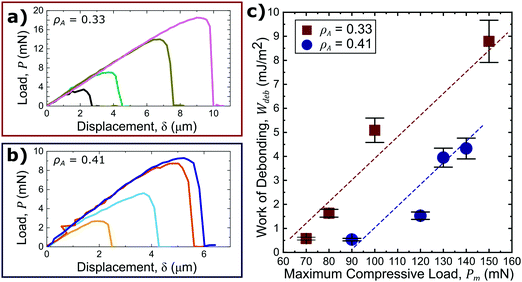 | ||
| Fig. 5 Insets of the tensile portion of each load–displacement curve plotted for surface with h = 0.5 sized asperities and ρA ≈ 0.33 (a) and ρA ≈ 0.41 (b) outlined in Fig. 4(a) and Fig. S3(a) (ESI†) respectively. Increasingly greater compressive loads result in a greater adhesive response. Integration of each tensile load–displacement curves normalized by the projected contact area to yield Wdeb (c). Wdeb is lower for higher ρA, but the pressure tuneability remains unchanged. Error bars are 10% error. | ||
4. Conclusion
In this work, the surface of a bulk elastomer, poly(dimethyl siloxane), was patterned by thermally annealing and dewetting a glassy polymer thin film to form rigid, microscopic asperities of polystyrene. Several trends were observed relating the initial film thickness to asperity geometry, enabling control of the size scale of the surface roughness. These dewetted asperities resulted in altered adhesive behavior. A total loss in adhesion strength was observed for the intermediate and largest asperity sizes. However, for the smallest asperity sizes, the separation strength increased with increasing compressive load. This “pressure-tunable” adhesive response is a significant observation in normal contact adhesion science and opens the door for the development of advanced adhesive systems with several levels of adhesive performance attainable with the same surface. For precisely controlled “pick and place” manufacturing applications, the observations presented in this work could form the basis for a new generation of specialty adhesives. Future work will further explore the tuneability of these PTAs and investigate the scaling of Pc with Pm for various surface pattern types. Additionally, the microscopic mechanisms governing the contact formation and separation around individual asperities will be investigated to understand the underlying mechanics that lead to this unique interfacial behavior.Conflicts of interest
There are no conflicts to declare.Acknowledgements
We thank E. P. Chan of NIST for interesting discussions that motivated this work. Purdue University provided financial support. ND acknowledges funding support from the George Washington Carver Fellowship (Grant 7100060). AC was supported by the Purdue Office of Undergraduate Research Scholarship.References
- D. Tian, Y. Song and L. Jiang, Chem. Soc. Rev., 2013, 42, 5184–5209 RSC.
- B. Päivänranta, A. Langner, E. Kirk, C. David and Y. Ekinci, Nanotechnology, 2011, 22, 375302 CrossRef.
- L. Dai, H. J. Griesser and A. W. H. Mau, J. Phys. Chem. B, 2002, 101, 9548–9554 CrossRef.
- L. Zhang, J. Wu, M. N. Hedhili, X. Yang and P. Wang, J. Mater. Chem. A, 2015, 3, 2844–2852 RSC.
- G. Reiter, Am. Phys. Soc., 1992, 68, 75–78 CAS.
- Z. Zhang, Z. Wang, R. Xing and Y. Han, Polymer, 2003, 44, 3737–3743 CrossRef CAS.
- K. N. G. Fuller and D. Tabor, Proc. R. Soc. A, 1975, 345, 327–342 Search PubMed.
- H.-C. Kim and T. P. Russell, J. Polym. Sci., Part B: Polym. Phys., 2001, 39, 1848–1854 CrossRef CAS.
- L. Pastewka and M. O. Robbins, Proc. Natl. Acad. Sci. U. S. A., 2014, 111, 3298–3303 CrossRef CAS.
- A. Pogačnik and M. Kalin, Wear, 2013, 300, 143–154 CrossRef.
- V. B. Svetovoy and G. Palasantzas, Adv. Colloid Interface Sci., 2015, 216, 1–19 CrossRef CAS.
- B. N. J. Persson, O. Albohr, U. Tartaglino, A. I. Volokitin and E. Tosatti, J. Phys.: Condens. Matter, 2005, 17, R1–R62 CrossRef CAS.
- E. P. Chan, E. J. Smith, R. C. Hayward and A. J. Crosby, Adv. Mater., 2008, 20, 711–716 CrossRef CAS.
- C. S. Davis and A. J. Crosby, Soft Matter, 2011, 7, 5373–5381 RSC.
- L. F. Boesel, C. Greiner, E. Arzt and A. del Campo, Adv. Mater., 2010, 22, 2125–2137 CrossRef CAS.
- K. Kargupta and A. Sharma, Langmuir, 2002, 18, 1893–1903 CrossRef CAS.
- G. A. D. Briggs and B. J. Briscoe, J. Phys. D: Appl. Phys., 1977, 10, 2453–2466 CrossRef.
- N. G. Fuller and A. D. Roberts, J. Phys. D: Appl. Phys., 1981, 14, 221 CrossRef.
- H. K. Minsky and K. T. Turner, Appl. Phys. Lett., 2015, 106, 201604 CrossRef.
- G. Carbone, E. Pierro and S. N. Gorb, Soft Matter, 2011, 7, 5545–5552 RSC.
- B. N. J. Persson and E. Tosatti, J. Chem. Phys., 2001, 115, 5597–5610 CrossRef CAS.
- B. N. J. Persson, Eur. Phys. J. E: Soft Matter Biol. Phys., 2002, 8, 385–401 CrossRef CAS.
- G. J. Price and P. F. Smith, Polym. Int., 1991, 24, 159–164 CrossRef CAS.
- A. Thapa, T. J. Webster and K. M. Haberstroh, J. Biomed. Mater. Res., 2003, 67A, 1374–1383 CrossRef CAS.
- A. Thapa, D. C. Miller, T. J. Webster and K. M. Haberstroh, Biomaterials, 2003, 24, 2915–2926 CrossRef CAS.
- M. Kato, Y. Tsuboi, A. Kikuchi and T.-A. Asoh, J. Phys. Chem. B, 2016, 120, 5042–5046 CrossRef CAS.
- P.-C. Lin, S. Vajpayee, A. Jagota, C.-Y. Hui and S. Yang, Soft Matter, 2008, 4, 1830 RSC.
- G. Lin, P. Chandrasekaran, C. Lv, Q. Zhang, Y. Tang, L. Han and J. Yin, ACS Appl. Mater. Interfaces, 2017, 9, 26510–26517 CrossRef CAS.
- R. D. O’Rorke, T. W. J. Steele and H. K. Taylor, J. Adhes. Sci. Technol., 2016, 30, 362–391 CrossRef.
- S. Vajpayee, A. Jagota and C.-Y. Hui, J. Adhes., 2010, 86, 39–61 CrossRef CAS.
- N. Nadermann, J. Ning, A. Jagota and C.-Y. Hui, Langmuir, 2010, 26, 15464–15471 CrossRef CAS.
- A. J. Crosby, M. Hageman and A. Duncan, Langmuir, 2005, 21, 11738–11743 CrossRef CAS.
- N. A. Fleck, S. N. Khaderi, R. M. McMeeking and E. Arzt, J. Mech. Phys. Solids, 2017, 101, 30–43 CrossRef CAS.
- V. Tinnemann, E. Arzt and R. Hensel, J. Mech. Phys. Solids, 2019, 123, 20–27 CrossRef CAS.
- G. Reiter, Langmuir, 1993, 9, 1344–1351 CrossRef CAS.
- G. Reiter, Macromolecules, 1994, 27, 3046–3052 CrossRef CAS.
- G. Reiter, Phys. Rev. Lett., 2001, 87, 186101 CrossRef.
- G. Reiter, M. Hamieh, P. Damman, S. Sclavons, S. Gabriele, T. Vilmin and E. Raphaël, Nat. Mater., 2005, 4, 754–758 CrossRef CAS.
- T. G. Stange, D. F. Evans and W. A. Hendrickson, Langmuir, 1997, 13, 4459–4465 CrossRef CAS.
- K. Jacobs, S. Herminghaus and K. R. Mecke, Langmuir, 1998, 14, 965–969 CrossRef CAS.
- J. C. Meredith, A. P. Smith, A. Karim and E. J. Amis, Macromolecules, 2000, 33, 9747–9756 CrossRef CAS.
- L. Xue and Y. Han, Prog. Polym. Sci., 2011, 36, 269–293 CrossRef CAS.
- A. M. Telford, S. C. Thickett and C. Neto, J. Colloid Interface Sci., 2017, 507, 453–469 CrossRef CAS.
- K. Jacobs, R. Seemann and S. Herminghaus, in Soft Condensed Matter, ed. O. K. C. Tsui and T. P. Russell, World Scientific Publishing Co. Pvt. Ltd, 2008, vol. 1, pp. 243–265 Search PubMed.
- T. G. Stange, D. F. Evans and W. A. Hendrickson, Langmuir, 1997, 13, 4459–4465 CrossRef CAS.
- O. Bäumchen, L. Marquant, R. Blossey, A. Münch, B. Wagner and K. Jacobs, Phys. Rev. Lett., 2014, 113, 014501 CrossRef.
- X. Han, J. Hou, J. Xie, J. Yin, Y. Tong, C. Lu and H. Möhwald, ACS Appl. Mater. Interfaces, 2016, 8, 16404–16411 CrossRef CAS.
- S. E. Song, G. H. Choi, G. R. Yi and P. J. Yoo, Soft Matter, 2017, 13, 7753–7759 RSC.
- K. R. Shull, Mater. Sci. Eng., R, 2002, 36, 1–45 CrossRef.
- S.-H. Choi Bi-min Zhang Newby and B. Zhang, J. Chem. Phys., 2006, 124, 054702 CrossRef.
- J. Boussinesq, Application des potentiels à l’étude de l’équilibre et du mouvement des solides élastiques, Gauthier-Villars, France, 1885 Search PubMed.
Footnotes |
| † Electronic supplementary information (ESI) available. See DOI: 10.1039/d0sm01754j |
| ‡ These authors contributed equally to this work. |
| This journal is © The Royal Society of Chemistry 2021 |

