 Open Access Article
Binding selectivity of inhibitors toward the first over the second bromodomain of BRD4: theoretical insights from free energy calculations and multiple short molecular dynamics simulations†
Yan Wanga,
Shiliang Wua,
Lifei Wang *a,
Zhiyong Yang
 *b,
Juan Zhaoa and
Lulu Zhanga
aSchool of Science, Shandong Jiaotong University, Jinan 250357, China. E-mail: wanglf@sdjtu.edu.cn
bDepartment of Physics, Jiangxi Agricultural University, Nanchang 330045, China. E-mail: zhiyongyang2009@163.com
First published on 24th December 2020
Abstract
Bromodomain-containing protein 4 (BRD4) plays an important role in mediating gene transcription involved in cancers and non-cancer diseases such as acute heart failure and inflammatory diseases. In this work, multiple short molecular dynamics (MSMD) simulations are integrated with a molecular mechanics generalized Born surface area (MM-GBSA) approach to decipher binding selectivity of three inhibitors 8NS, 82Y, and 837 toward two domains BD1 and BD2 of BRD4. The results demonstrate that the enthalpy effects play critical roles in selectivity identification of inhibitors toward BD1 and BD2, determining that 8NS has better selectivity toward BD2 than BD1, while 82Y and 837 more favorably bind to BD1 than BD2. A residue-based free-energy decomposition method was used to calculate an inhibitor–residue interaction spectrum and unveil contributions of separate residues to binding selectivity. The results identify six common residues, containing (P82, P375), (V87, V380), (L92, L385), (L94, L387), (N140, N433), and (I146, V439) individually belonging to (BD1, BD2) of BRD4, and yield a considerable binding difference of inhibitors to BD1 and BD2, suggesting that these residues play key roles in binding selectivity of inhibitors toward BD1 and BD2 of BRD4. Therefore, these results provide useful dynamics information and a structure affinity relationship for the development of highly selective inhibitors targeting BD1 and BD2 of BRD4.
1. Introduction
Lysine acetylation plays an important role in the control of gene transcriptional regulation in chromatin with an ordered fashion.1 Bromodomain-containing proteins (BRDs), being evolutionarily conserved protein–protein interaction modules that are selectively recognized by acetylated lysine sequences, are of essential biological interest in gene expression.2–4 Bromodomains contain left-handed four-helix bundles that specifically recognize acetylation of lysine side chains on histones, and have two hydrophobic loops linking αB and αC, αZ and αA helices.5,6 To date, a total of 61 human bromodomains have been detected in 46 cytoplasmic or nuclear proteins in the human proteome, which are divided into eight protein families,7,8 moreover BRDs have been functionally involved in disease processes, including inflammation, viral replication and cancer.9,10 BRD4 is a representative member of the bromodomain and extra-terminal domain (BET) family of proteins and composed of two tandem bromodomains BD1 and BD2 individually performing different functions in regulation of ordered gene transcription.11–14Recent experimental studies show promising benefit of selective BRD4 inhibitors in disrupting myofibroblast transition and epithelial mesenchymal transition in diverse models of lung injury.15 The Proteolysis Targeting Chimeras (PROTACs) technology16,17 has been used to investigate binding selectivity of small-molecule inhibitors toward BRD4 proteins and inhibit tumor growth.18 And Gacias et al. employed a structure-guided design strategy to develop selective small molecule inhibitors on BD1 over BD2 of the BET bromodomains in favor of oligodendrocyte lineage progression.19 Andrews et al. demonstrated that the dual-activity inhibitor 82Y and 837 blocked PI3K and BRD4 signaling in vivo and in vitro and were highly potent in controlling spontaneous lymph node metastasis and tumor growth.20 Furthermore, many studies suggest that water molecules play a significant role in binding selectivity of the bromodomain inhibitors.21,22
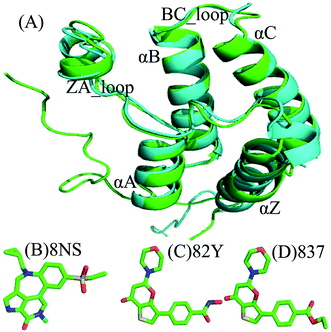
Currently, conventional molecular dynamics (cMD) simulations23–31 and binding free energy prediction32–37 have been extensively used to investigate inhibitor–protein, protein–protein interactions and binding selectivity of receptors at atomic levels.38–44 Moreover, these methods have been wielded to successfully uncover molecular basis concerning binding selectivity of different BRD members toward inhibitors. For instance, Zhou et al. adopted MD simulations and binding free energy calculations to study binding selectivity of Olinone toward the first over the second bromodomain of BRD4.45 Su et al. applied MD simulations and molecular mechanics Poisson Boltzmann surface area (MM/PBSA) calculations to investigate binding selectivity of inhibitors toward two domains of BRD4.46 However, the conformations sampled by cMD simulations possibly fall into a local minimum space, resulting in an insufficient sampling of protein conformations. For this issue, multiple short molecular dynamics (MSMD) simulations can implement sufficient conformational sampling and gain rational results.47–55 Recently, multiple short MD (MSMD) simulations and free-energy predictions were also employed to study binding selectivity of inhibitors toward BRD2 and BRD4, showing 87D can more favorably bind to BRD2 over BRD4, while 88M prefer bind to BRD4 than BRD2.56 To further unveil molecular mechanism of binding selectivity, in this work three inhibitors 8NS, 82Y, and 837 were chosen to investigate binding selectivity of BD1 and BD2 of BRD4 using MSMD simulations and binding free energy calculations. The superimposed structures of BD1 and BD2 are depicted in Fig. 1A, and the structures of three inhibitors are displayed in stick mode in Fig. 1B–D. Despite similar structure shared by 82Y and 837, their structures are quite different from 8NS. In this work, MSMD simulations, principal component analysis (PCA),57 and free energy landscapes were integrated to decode molecular mechanism of binding selectivity of inhibitors towards BD1 and BD2 of BRD4. Meanwhile, this work is also expected to provide theoretical contributions for designing highly selective drugs targeting BD1 and BD2 of BRD4.
2. Materials and methods
2.1 System preparation
The starting coordinates of BD1 of BRD4 coupled with inhibitors 82Y and 837 used in MD simulations, separately corresponding to 5U2F and 5U2E, were obtained from Protein Data Bank (PDB), while the ones of BD2 of BRD4 complexed with inhibitors 8NS and 82Y were taken from 5UVV and 5U2C, respectively.20 However, due to lack of crystal structures of the 8NS-BD1 and 837-BD2 complexes, the crystal structure of 5UVV (the 8NS-bound BD2) is superimposed together with 5U2F (the 82Y-associated BD1) using the PyMol software (https://www.pymol.org) and then the structure of the 8NS-BD1 complex is produced by removing 82Y and BD2. Similarly, the crystal structures of the 837-BD1 (5U2E) and 82Y-BD2 (5U2C) complexes are aligned together to generate the structure of the 837-BD2 complex by deleting BD1 and 82Y. Due to the difference in the number of residues between BD1 and BD2, the residues 58-164 in BD1 and the residues 349-457 in BD2 were used to construct the starting models of MD simulations. All crystal water molecules were kept in the starting model, while the missing hydrogen atoms were added by means of the LEAP module in Amber 18.0. The TIP3P water model58 and the force field ff14SB59,60 were employed to produce the force field parameters of BRD4, water molecules, and counterions. The protonation states of residues in BD1 and BD2 were assigned at PH 7.0 by applying the available online website of the program PROPKA (https://nbcr-222.ucsd.edu/pdb2pqr_2.0.0).61,62 The structures of the three inhibitors 8NS, 82Y, and 837 were optimized using the AM1 method, and subsequently, the bond charge correction (BCC) charges were assigned to atoms of inhibitors using the Antechamber module in Amber.63,64 The general amber force field (GAFF)65 was utilized to produce the force field parameters of the three inhibitors for MSMD simulations. Two Cl− counterions were added to neutralize the BD1 and BD2 systems.2.2 Multiple short molecular dynamics simulations
To eliminate bad contacts between atoms and highly repulsive orientations of protein-solvent systems caused by the initialization of systems, all systems endure two stage minimizations, including 2500 steps of steepest descent minimization and 2500 steps of conjugate gradient minimization. Each system was softly heated from 0 to 300 K in 2 ns. Subsequently, 2 ns equilibrium simulations were accomplished at 300 K level. To fully relax the complexes generated by structural superimpositions, MSMD simulations of ten replicas were carried out as below. Finally, 100 ns cMD simulation was employed at constant pressure (1 bar) and temperature (300 K) with periodic boundary conditions and the smooth particle mesh Ewald (PME) method.66,67 Nine different conformations randomly taken from the previous 100 ns cMD simulation were adopted as the initial coordinates for running nine new cMD simulations, in which the initial atomic velocity of each conformation was generated with Maxwell distribution. The initial structures of ten replicas for MSMD simulations are aligned together (ESI Fig. S1†) and the results suggest that inhibitors are well kept in binding pocket of BD1 and BD2, which shows that the initial conformations used for MSMD simulations are rational. The equilibrated trajectories of ten replicas were integrated into a single joined trajectory for the post-processing analysis. Through MSMD simulations, the chemical bonds linking hydrogen atoms to heavy atoms were restricted using the SHAKE algorithm68 so that a time step of 2 fs is utilized. The Langevin thermostat with a collision frequency of 2.0 ps−1 was put use to control the temperature of each simulated system.69 The particle mesh Ewald (PME) approach with an appropriate cut-off value of 10 Å was wielded to calculate the long-range electrostatic interactions. Furthermore, this cutoff value was also applied to compute van der Waals interactions. In the current work, all MSMD simulations were executed by making use of the program pmemd.cuda implemented in Amber.70,712.3 Calculations of MM-GBSA
Molecular mechanics combined with the generalized Born or Poisson–Boltzmann and surface area continuum solvation (MM-GBSA and MM-PBSA) methods are recognized as two efficient approaches to estimate binding free energies.72–76 The Hou's group evaluates the performance of MM-GBSA and MM-PBSA methods77–81 by calculating ligand-binding affinities based on different molecular systems, MM-GBSA method can generate attractive results. Therefore, in this current work, MM-GBSA method was utilized to estimate binding free energies of 8NS, 82Y, and 837 to BD1 and BD2 of BRD4 using the eqn (1):| ΔGbind = Gcomp − Gpro − Ginh |
| = ΔEele + ΔEvdW + ΔGgb + ΔGnonpol − TΔS | (1) |
| ΔGnonpol = γ × ΔSASA + β | (2) |
3. Results and discussion
3.1 Dynamics equilibrium and structural properties of BRD4BD1 and BRD4BD2
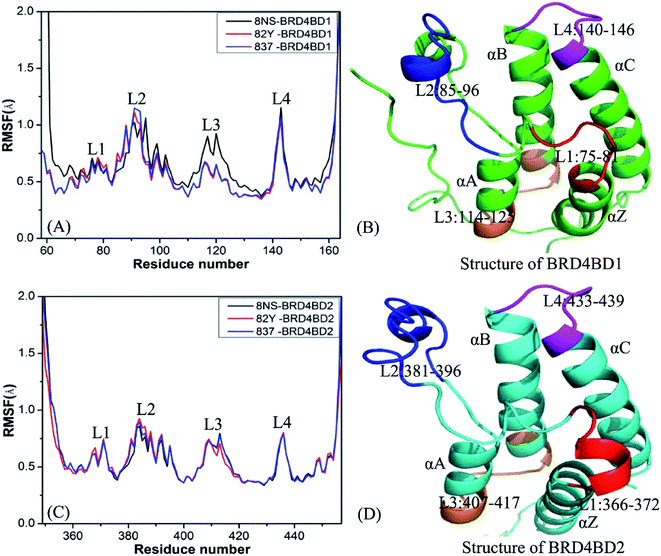
To evaluate rational and reliable conformational samplings of BD1 and BD2 of BRD4, MSMD simulations, consisting of 100 ns MD simulations of 10 replicas with the total simulated time of 1 μs, were implemented on six complexes of BD1 and BD2 of BRD4 with three inhibitors 8NS, 82Y, and 837. The evolution of root-mean-square-deviations (RMSDs) of backbone atoms in BD1 and BD2 of BRD4 with respect to the crystal structures as the simulated time was calculated to evaluate the stability of MSMD simulations (ESI Fig. S2†). The results indicate that RMSDs of ten replicas for six simulated systems are convergent after 40 ns of MSMD simulations. Therefore, the equilibrium portions (40–100 ns) from simulations of 10 replicas were connected together to obtain a single joined trajectory of 600 ns, which is used to perform the post-process analyses.To probe influences of inhibitor bindings on structural flexibility of BD1 and BD2 of BRD4, root-mean-square fluctuations (RMSFs) of Cα atoms in BD1 and BD2 were computed by using the single joined trajectories. The results of RMSFs and the domains corresponding to the obvious changes of RMSFs are displayed in Fig. 2. One can find that BD1 and BD2 produce similar RMSF fluctuations on the whole during MSMD simulations, demonstrating that BD1 and BD2 should share the same flexible regions. The most obvious differences in the structural flexibility of BD1 and BD2 mainly take place in the three regions (Fig. 2), including L2 (residues 85-96 for BD1 and 381-396 for BD2), L3 (residues 114-125 for BD1 and 407-417 for BD2), and L4 (residues 140-146 for BD1 and 433-439 for BD2). The RMSF values of 8NS-, 82Y-, and 837-BD1 complexes in the two regions L2 and L4 are highly bigger than the corresponding regions of 8NS-, 82Y-, and 837-BD2, which implies that some residues in these regions may appear in the hot interaction spots of inhibitors with BD1 and BD2. Moreover, the RMSF values of the region L3 in the 8NS-BD1 compound are bigger than the corresponding region in the 8NS-BD2 compound, which demonstrates that the region L3 is also involved in the hot interaction spots of inhibitors with BD1 and BD2. By comparing Fig. 2A with Fig. 2C, the RMSF values of the most parts in BD1 are bigger than that of BD2, indicating that the total structural flexibility of the most parts in BD1 is stronger than that in BD2.
3.2 Internal dynamics of BD1 and BD2
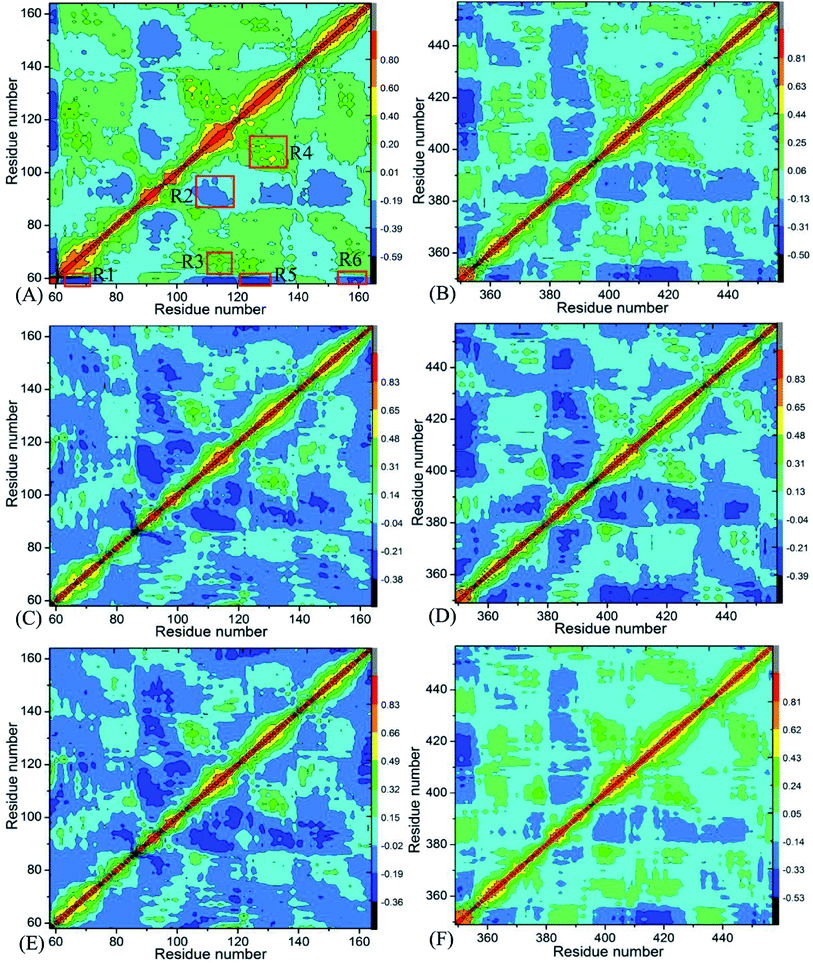
Insight into the changes in internal dynamics of targeting proteins due to inhibitor bindings can play key roles in drug development.85 In order to better reveal the difference in internal dynamics of BD1 and BD2 caused by inhibitor bindings, the cross-correlation maps86 between residues were calculated based on the single joined trajectories of MSMD simulations and the results were shown in Fig. 3. The diagonal regions embody the movement of a certain residue with respect to itself, while the off-diagonal regions characterize the correlated motions between different residues. In this figure, color-coded modes are applied to display the correlated extents of relative motions between residues of targeting proteins. The yellow and red signify strongly positively correlated motions between residues, while blue and dark blue indicate the strongly anticorrelated motions between residues. As shown in Fig. 3, inhibitor bindings exert momentous effect on motion modes of BD1 and BD2.Fig. 3A, C and E respectively show the correlated movements between residues of the 8NS-, 82Y- and 837-BD1 complexes, while Fig. 3B, D and F individually display the correlated motions between residues of the 8NS-, 82Y- and 837-BD2 compounds. Compared with the 8NS-BD1 complex (Fig. 3A), the presence of 8NS in the binding pocket of BD2 weakens not only the positive correlated motions in the regions R3 and R4 but also the anticorrelated motion in the regions R1 and R6. Differently, the binding of 8NS to BD2 strengthens the anticorrelated movements of the regions R2 and R5 (Fig. 3B). By comparison with the 82Y-BD1 complex (Fig. 3C), the binding of 82Y to BD2 strengthens the negative correlated movements of the regions R5 and R6 (Fig. 3D). By referencing with the 837-BD1 compound (Fig. 3E), the binding of 837 to BD2 weakens the anticorrelated motions of the region R2, but strengthens the anticorrelated movements of the regions R5 and R6 in the BD2 (Fig. 3F). On the basis of the above discussions, the bindings of the same inhibitors induce various dynamics behavior between BD1 and BRD4BD2, which demonstrates that some certain residues located at the regions R1–R6 of BD1 and BD2 can lead to different interaction intensity with three inhibitors, producing significant impact on binding selectivity of inhibitors toward BD1 and BD2.
3.3 Conformational changes of BD1 and BD2 detected by principal component analysis
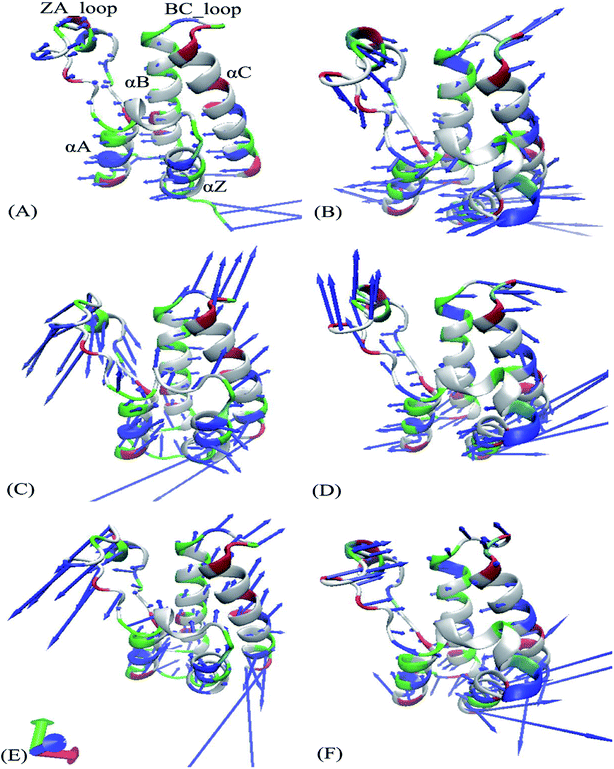
It is well known that principal component analysis (PCA) is an effective approach to reveal conformational changes of receptors induced by inhibitor bindings and mutations. For our aims, PCA is executed to obtain eigenvalues and eigenvectors by implementing a diagonalization on a covariance matrix constructed with atom coordinate recorded in the single joined trajectories of MSMD simulations. Fig. S3† depicts the eigenvalues versus the corresponding eigenvector indices, which is utilized to describe internal motion strength of BD1 and BD2. The eigenvalues of the first six principal components respectively account for 82.96%, 54.68%, and 56.42% of the total motions observed in the last 600 ns of the joined trajectories for the 8NS-, 82Y-, and 837-BD1. While that of the first six principal components of the three inhibitors binding to the 8NS-, 82Y-, and 837-BD2 occupy 61.05%, 55.14%, and 59.59% of the total movements, separately. The results demonstrate that the presence of the identical inhibitors in the binding pocket of BD1 and BD2 makes different effects on motion strength of two domains of BRD4. The binding of 8NS distinctly strengthens the motion of BD1 compared to that of BD2, but the other two inhibitors 82Y and 837 slightly strengthen the internal movement of BD2 relative to BD1.Fig. 4 exhibits motion directions of two domains BD1 and BD2 along the first eigenvector derived from PCA, in which Fig. 4A, C and E display the concerted movements of the 8NS-, 82Y- and 837-BD1, individually, while Fig. 4B, D and F show the concerted motions of the 8NS-, 82Y- and 837-BD2, independently. As shown in Fig. 4, the bindings of inhibitors 8NS, 82Y, and 837 not only distinctly strengthen the motion of the ZA_loop and BC_loop in BD1 relative to BD2, but also change the movement direction of the two loops in BD1 by referencing with BD2. Furthermore, the helix αC of the 8NS-BD1 complex moves toward left (Fig. 4A), while Fig. 4B shows that the motion direction of BC_loop and αC in 8NS-BRD4BD2 complex are changed toward right and moves outward. According to the aforementioned analyses, despite the same inhibitor bindings, there are still distinct differences in motion direction and intensity of the ZA_loop and BC_loop between BD1 and BD2. This result demonstrates that the differences in the conformational changes between BD1 and BD2 during the MSMD simulations may induce different binding selectivity of inhibitors toward BD1 and BD2.
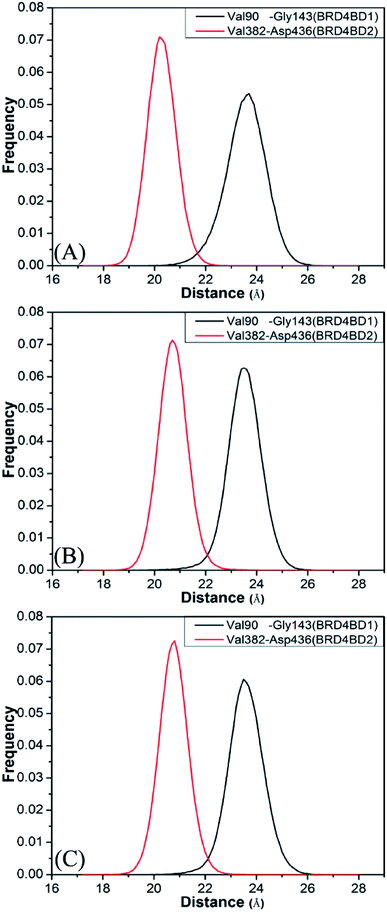
To further understand effect of structural changes on binding selectivity of inhibitors toward BD1 and BD2, the distances between the two Cα atoms of Val90 and Gly143 located at the ZA_loop and BC_loop of BD1 and that between the Cα atoms of Val382 and Asp436 in two loops of BD2 are computed by the aid of the CPPTRAJ module in Amber and the results are displayed in Fig. 5. According to the frequency distribution in Fig. 5, the peak values are located at 23.7 and 20.2 Å for the 8NS-BD1 and 8NS-BD2 (Fig. 5A), the peak values are 23.5 and 20.7 Å for the 82Y-4BD1 and 82Y-BD2 (Fig. 5B) and the peak values of the 837-BD1 and 837-BD2 complexes are sited in 23.5 and 20.8 Å (Fig. 5C), respectively. These results imply that the distances between the Cα atoms of Val90 and Gly143 in BD1 are larger than that of Val382 and Asp436 in BD2, which indicates that there is an open movement of the ZA_loop and BC_loop in BD1 compared to that in BD2 and probably produces a bigger binding pocket of BD1 than that of BD2.
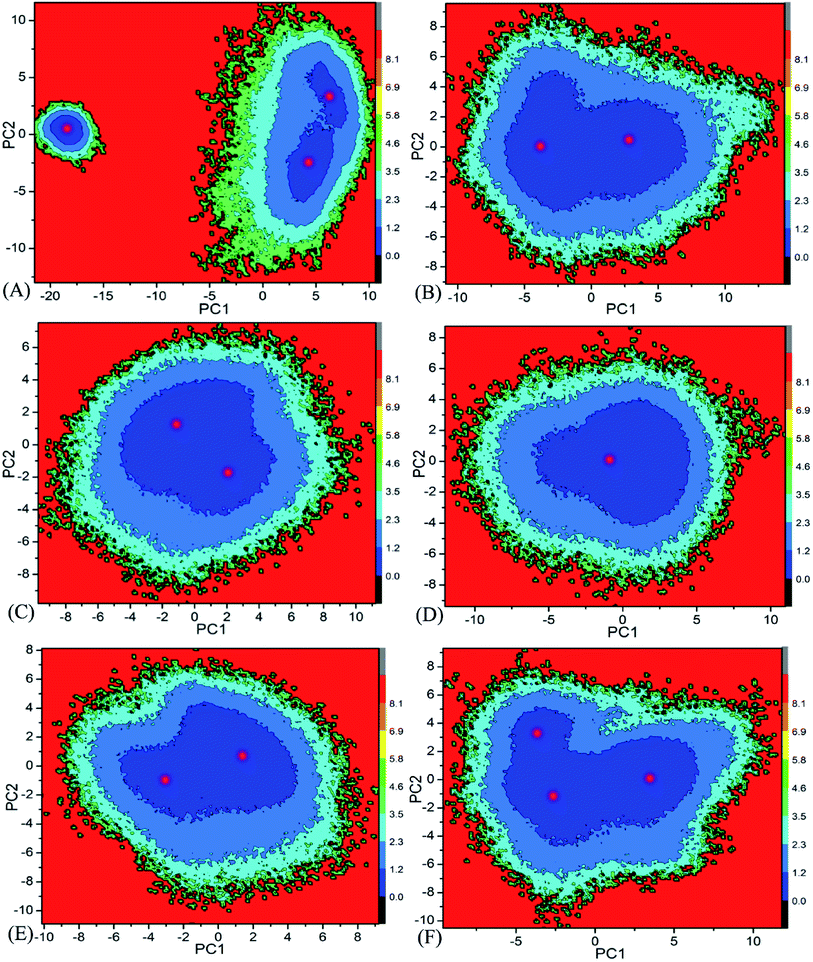
Free energy landscape is also an effective approach for insight into conformational changes of proteins induced by inhibitor bindings.87 In the current work, free energy landscape was constructed by using projections of the single joined trajectories on the first two eigenvectors as reaction coordinates to reveal the distributions of conformational samplings for BD1 and BD2 in Fig. 6. It is found that inhibitor bindings induce different energy basins. In the case of the 8NS-BD1 complex, three free energy basins are detected, while the binding of 8NS to BD2 leads to two energy basins (Fig. 6A and B). Although bindings of 82Y and 837 to BD1 and BD2 result in a main free energy basin, the shape of free energy landscapes of BD1 is different from that of BD2 (Fig. 6C–F). The above analyses imply that bindings of three inhibitors produce different conformational changes between BD1 and BD2 of BRD4.
3.4 Binding abilities of inhibitors to BD1 and BD2 of BRD4
To reveal energetic basis with regard to binding selectivity of inhibitors to BD1 and BD2, MM-GBSA approach was used to calculate binding free energies of three inhibitors 8NS, 82Y, and 837 to BD1 and BD2 of BRD4. A total of 300 snapshots were extracted from 600 ns single joined trajectory with a time interval of 2 ns. Binding free energies and separate free energy components are listed in Table 1. It is observed that binding ability of three inhibitors to BD1 is different from that of inhibitors to BD2. The energies with negative values contribute favorable factors to inhibitor associations, while the positive terms supply unfavorable forces for inhibitor bindings.| Terms | 8NS-BD1 | 8NS-BD2 | 82Y-BD1 | 82Y-BD2 | 837-BD1 | 837-BD2 | ||||||
|---|---|---|---|---|---|---|---|---|---|---|---|---|
| Mean | SEMb | Mean | SEMb | Mean | SEMb | Mean | SEMb | Mean | SEMb | Mean | SEMb | |
| a All components of free energies are in kcal mol−1.b Standard errors of means.c ΔGele+gb = ΔEele + ΔGgb.d ΔGvdW+nonpol = ΔEvdW + ΔGnonpol.e The experimental values were generated from the experimental IC50 values in ref. 20 using the equation ΔGexp = −RTlnIC50.f The experimental binding data is not available. | ||||||||||||
| ΔEele | −30.02 | 0.37 | −20.37 | 0.25 | −24.67 | 0.44 | −26.61 | 0.54 | −15.89 | 0.22 | −18.64 | 0.25 |
| ΔEvdW | −40.74 | 0.19 | −42.89 | 0.17 | −36.32 | 0.17 | −34.82 | 0.17 | −36.44 | 0.18 | −35.95 | 0.18 |
| ΔGgb | 42.11 | 0.30 | 33.78 | 0.21 | 35.21 | 0.38 | 37.20 | 0.47 | 26.92 | 0.21 | 29.99 | 0.23 |
| ΔGnonpol | −3.75 | 0.01 | −4.00 | 0.01 | −3.30 | 0.01 | −3.36 | 0.02 | −3.29 | 0.01 | −3.43 | 0.01 |
| ΔGele+gbc | 12.09 | 0.33 | 13.41 | 0.23 | 10.54 | 0.41 | 10.59 | 0.50 | 11.03 | 0.21 | 11.35 | 0.24 |
| ΔGvdW+nonpold | −44.49 | 0.10 | −46.89 | 0.09 | −39.62 | 0.09 | −38.18 | 0.09 | −39.73 | 0.10 | −39.38 | 0.10 |
| ΔH | −32.40 | 0.20 | −33.48 | 0.17 | −29.08 | 0.18 | −27.59 | 0.20 | −28.70 | 0.17 | −28.03 | 0.17 |
| −TΔS | 20.04 | 0.31 | 20.52 | 0.30 | 17.70 | 0.29 | 18.14 | 0.30 | 16.69 | 0.31 | 17.47 | 0.33 |
| ΔGbind | −12.36 | — | −12.96 | — | −11.38 | — | −9.45 | — | −12.01 | — | −10.56 | — |
| ΔGexpe | —f | — | —f | — | −9.18 | — | −9.06 | — | −8.97 | — | −8.48 | — |
According to Table 1, favorable electrostatic interaction energies (ΔEele) in the gas phase are completely screened by unfavorable polar solvation energies (ΔGgb) to induce the balance of these two contributions (ΔGele+gb), an unfavorable force for inhibitor bindings. The entropy changes (−TΔS) also weaken bindings of inhibitors to BD1 and BD2. van der Waals interactions (ΔEvdW) and nonpolar solvation energies (ΔGnonpol) make favorable force (ΔEvdW+nonpol) for inhibitor-BD1/BD2 bindings. According to Table 1, the strengths of ΔGele+gb and ΔEvdW+nonpol for the 8NS-BD1 are strengthened by 1.32 and 2.40 kcal mol−1 compared with the 8NS-BD2, which produces to a decrease of 1.08 kcal mol−1 in the binding enthalpy (ΔH) of the 8NS-BD1 relative to BD2. Furthermore, compared with the 8NS-BD2, the values of −TΔS for the 8NS-BD1 are reduced by 0.48 kcal mol−1. As a whole, the binding ability of 8NS-BD2 is strengthened by 0.6 kcal mol−1, indicating that 8NS has better selectivity toward BD2 than BD1. For the inhibitor 82Y, an increase of 1.44 kcal mol−1 in the ΔEvdW+nonpol of the 82Y-BD1 relative to the 82Y-BD2 are totally responsible for the enhancement the binding enthalpy of the 82Y-BD1 compared to that of the 82Y-BD2. Moreover, the −TΔS of the 82Y-BD1 is reduced by 0.44 kcal mol−1 relative to that of the 82Y-BD2. Based on these two causes, binding ability of 82Y to BD1 is enhanced by 1.93 kcal mol−1 relative to BD2, demonstrating that 82Y prefers binding to BD1 to associating with BD2. In the case of 837, the value of ΔGele+gb for the 837-BD1 is reduced by 0.32 kcal mol−1 compared with the 837-BD2, and the favorable factor ΔEvdW+nonpol of the 837-BD1 is strengthened by 0.35 kcal mol−1 relative to the 837-BD2, which result in an overall increase of 0.67 kcal mol−1 in the binding enthalpy of the 837-BD1 relative to the 837-BD2. The −TΔS of the 837-BD1 is reduced by 0.78 kcal mol−1 relative to that of the 837-BD2, which finally leads to an increase of 1.45 kcal mol−1 in binding free energy of the 837-BD1 compared to that of the 837-BD2. Therefore, binding ability of 837 to BD1 is higher than BD2.
3.5 Selectivity revealed by inhibitor–residue interaction analysis
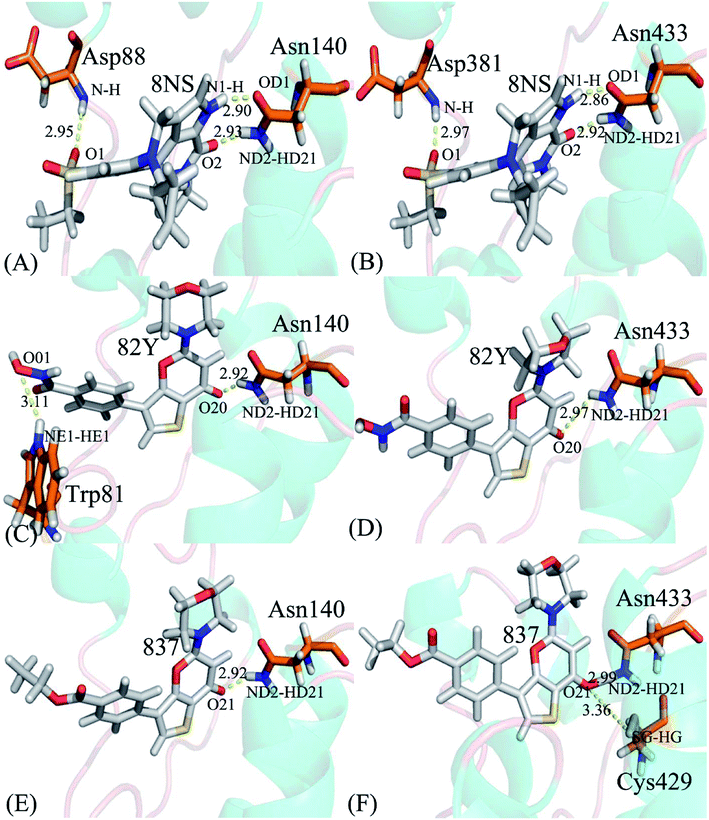
To probe binding selectivity of inhibitors to BD1 and BD2, inhibitor–residue interaction spectrum is calculated by using residue-based free-energy decomposition method. The important residues involved in bindings of inhibitors to these two BD1 and BD2 are shown in Fig. 7. Meanwhile, hydrogen-bonding interactions of inhibitors with BD1 and BD2 are revealed through the CPPTRAJ program in Amber, and the corresponding results are listed in Table 2. The geometric positions of ligands relative to key residues in binding pockets of BD1 and BD2 are shown in Fig. 8 and 9 by using the lowest-energy structure extracted from the single joined trajectories of MSMD trajectory.| Inhibitor | Hydrogen bonds | Distancea/Å | Anglea/° | Occupancyb/% |
|---|---|---|---|---|
| a The hydrogen bonds are determined by the acceptor–donor atom distance of <3.5 Å and acceptor-H-donor angle of >120°.b Occupancy is used to evaluate the stability and strength of the hydrogen bond. | ||||
| 8NS-BD1, DBRD | Asn140-ND2-HD21⋯8NS-O2 | 2.93 ± 0.0022 | 160.42 ± 0.41 | 99.85 ± 0.05 |
| Asn140-OD1⋯8NS-N1-H | 2.90 ± 0.0025 | 154.83 ± 0.66 | 99.68 ± 0.11 | |
| Asp88-N-H⋯8NS-O1 | 2.95 ± 0.0029 | 164.17 ± 1.67 | 83.07 ± 11.7 | |
| 8NS-BD2 | Asn433-ND2-HD21⋯8NS-O2 | 2.92 ± 0.0042 | 160.31 ± 0.21 | 99.96 ± 0.01 |
| Asn433-OD1⋯8NS-N1-H | 2.86 ± 0.0022 | 155.72 ± 0.28 | 99.95 ± 0.01 | |
| Asp381-N-H⋯8NS-O1 | 2.97 ± 0.0029 | 161.86 ± 0.12 | 98.12 ± 1.19 | |
| 82Y-BD1 | Asn140-ND2-HD21⋯82Y-O20 | 2.92 ± 0.0055 | 154.16 ± 0.65 | 99.70 ± 0.04 |
| Trp81-NE1-HE1⋯82Y-O01 | 3.11 ± 0.019 | 150.06 ± 0.71 | 24.33 ± 18.5 | |
| 82Y-BD2 | Asn433-ND2-HD21⋯82Y-O20 | 2.97 ± 0.0044 | 153.10 ± 0.71 | 98.38 ± 0.22 |
| 837-BD1 | Asn140-ND2-HD21⋯837-O21 | 2.92 ± 0.0029 | 153.74 ± 0.09 | 99.56 ± 0.23 |
| 837-BD2 | Asn433-ND2-HD21⋯837-O21 | 2.99 ± 0.0032 | 151.34 ± 0.25 | 97.99 ± 0.16 |
| Cys429-SG-HG⋯837-O21 | 3.36 ± 0.0012 | 152.55 ± 0.16 | 23.30 ± 0.35 | |
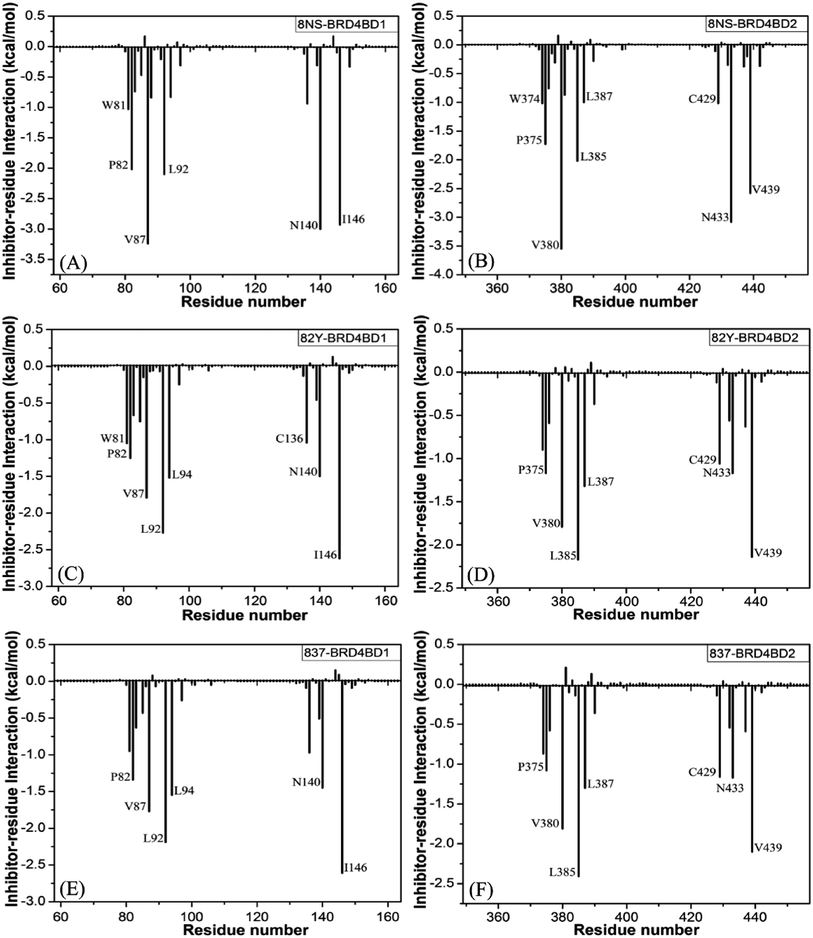
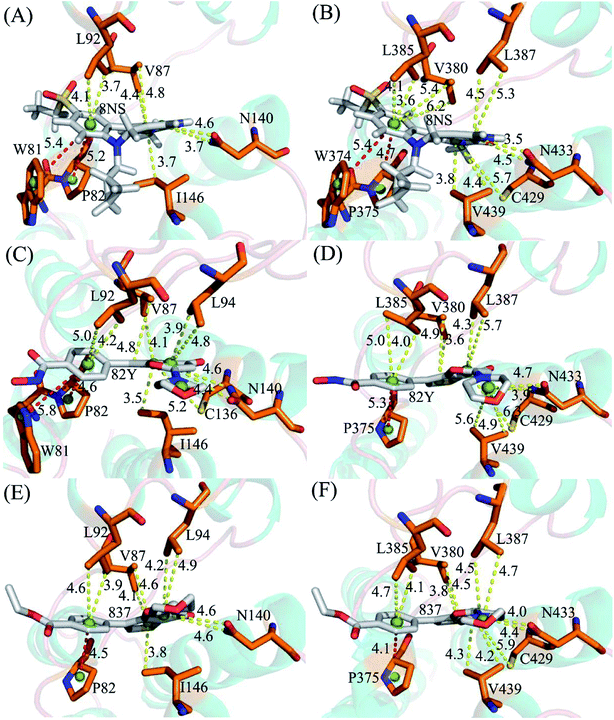
Binding of 8NS to BD1 versus BD2. As shown in Fig. 7A, 8NS makes favorable interactions stronger than 1.0 kcal mol−1 with six residues in BD1, including W81, P82, V87, L92, N140 and I146. The interaction energies of W81, P82, V87, L92, N140 and I146 with BD1 are −1.03, −2.02, −3.24, −2.10, −3.00, and −2.93 kcal mol−1, respectively, which structurally agrees well with the π–π interactions of the hydrophobic rings of W81 and P82 with that of 8NS and the CH–π interactions of the alkyls of V87, L92, N140 and I146 with the hydrophobic ring of 8NS (Fig. 8A). Moreover, 8NS forms three hydrogen bonding interactions with BD1, including Asn140-ND2-HD21⋯8NS-O2, Asn140-OD1⋯8NS-N1-H, and Asp88-N-H⋯8NS-O1 with the occupancies are 99.85%, 99.68%, and 83.07%, respectively (Table 2, and Fig. 9A). By referencing with the 8NS-BD1, the binding modes and hydrogen-bonding interactions of 8NS with BD2 are similar to BD1 (Fig. 7B, 8B, and 9B). It is observed that the difference in the interactions of 8NS with residues (W81, W374), (L92, L385) and (N140, N433) corresponding to (BD1, BD2) is less than 0.08 kcal mol−1, implying that these residues do not play pivotal roles in the binding selectivity of 8NS toward BD1 and BD2. The interaction energies of 8NS with P375 and V439 in BD2 are respectively weakened by 0.29, and 0.35 kcal mol−1 relative to that of 8NS with the corresponding residues in BD1, but that of 8NS with V380 in BD2 is strengthened by 0.31 kcal mol−1 compared to the corresponding residue in BD1, which suggests that these three residues are responsible for the main selectivity of 8NS toward BD1 over BD2.
Binding of 82Y to BD1 over BD2. As seen in Fig. 7C, 82Y produces favorable interactions stronger than −1.0 kcal mol−1 with eight residues in BD1, containing W81, P82, V87, L92, L94, C136, N140 and I146. The interaction energies of W81 and P82 in BD1 are −1.05 and −1.25 kcal mol−1, respectively, which is in structural consistence with the π–π interactions of their hydrophobic rings with that of 82Y. It is noted that the CH groups of V87, L92, L94, C136, N140 and I146 in BD1 are located near the ring of 82Y and incline to produce the CH–π interactions between them, and their interaction energies are −1.79, −2.27, −1.52, −1.04, −1.50, and −2.62 kcal mol−1, respectively. By comparison with the 82Y-BD1, the binding mode of 82Y to BD2 is similar to that of 82Y to BD1 (Fig. 7D, 8D and 9D and Table 2). The interaction energies of L387, N433, and V439 in BD2 are respectively weakened by 0.20, 0.33 and 0.48 kcal mol−1 relative to the corresponding residues in BD1, demonstrating that these three residues are mainly responsible for binding selectivity of 82Y toward BD1 and BD2.
Binding of the inhibitor 837 to BD1 over BD2. As shown in Fig. 7E and 8E, six residues P82, V87, L92, L94, N140, and I146 in BD1 produce the interaction energies of −1.34, −1.77, −2.19, −1.55, −1.45, and −2.61 kcal mol−1 with the inhibitor 837. Compared to the 837-BD1, 837 produces similar binding modes and hydrogen-bonding interactions with BD2 (Fig. 7F, 8F and 9F and Table 2). The difference in the interactions of 837 with the residues (P82, P375), (L92, L385), (L94, L387), (N140, N433), and (I146, V439) is large, indicating that these residues play important roles in binding selectivity of 837 on BD1 versus BD2 (Fig. 7E and F). In the 837-BD1 complex, the oxygen atoms O21 of the inhibitor 837 form a hydrogen bond with the ND2 of Asn140 in Fig. 9E. For the 837-BD2 complex, the oxygen atom O21 of the inhibitor 837 form two hydrogen bonds with the ND2 of Asn433 and SG of Cys429 in Fig. 9F, respectively. Combined with binding free energy in Table 1, these two hydrogen bonds may play critical roles in binding selectivity of 837 on BD1 and BD2.
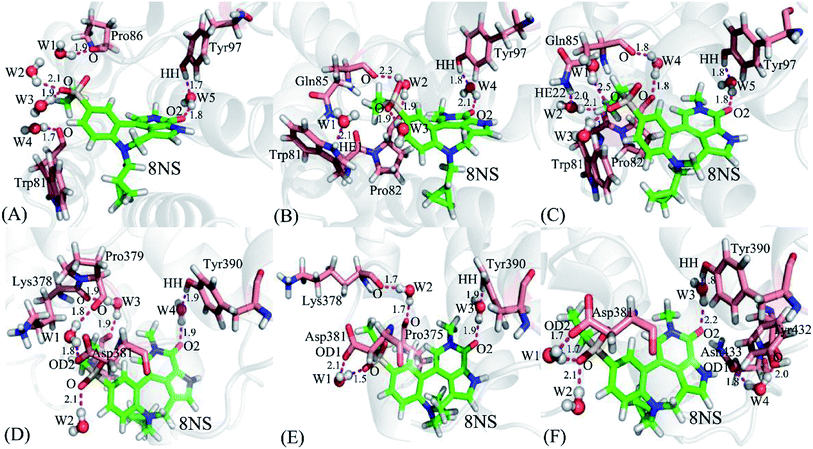
It is well known that water molecules play significant roles in bindings of inhibitors to BRD proteins. To shed light on this issue, the water molecules in the binding pockets of BD1 and BD2 are examined by using the snapshots extracted from 200, 300 and 500 ns of MSMD simulations (Fig. 10, S4 and S5†). In general, the water molecules in the binding pocket of two proteins are instable during molecular dynamics simulations and they frequently exchange with the solvent water molecules. As for the inhibitor 8NS, in the snapshot 200 ns (Fig. 10A), it is clear that five water molecules form six hydrogen bonds with the inhibitor 8NS, and important residues W81, P86, and Y97. In particular, the water molecule W5 builds a bridge of the hydrogen bonding interactions between Y97 and 8NS, which is favorable for the binding of 8NS to BD1. With the time evolution, there are some changes in the conformation of the 8NS-BD1 complex, which is shown in the snapshot of 300 ns (Fig. 10B). At this stage, the residues P82 and Q85 form two new hydrogen bonds with water molecules, while the hydrogen bond of residue P86 and water molecular disappear. However, in the snapshot of 500 ns (Fig. 10C), five water molecules generate eight hydrogen bonding interactions with 8NS and four residues W81, P82, Q85, and Y97. As shown in the aforementioned analysis, although the water molecules in the binding pocket of 8NS to BD1 are changeable, a bridging water molecule and different water molecules always appear in the binding pocket of 8NS to BD1, which verifies that water molecules are indispensable for the binding of 8NS. Similar to the 8NS-BD2, water molecules also form different hydrogen bonds with 8NS and BD2 and the water molecules change distinctly as time evolution as shown in Fig. 10D–F. However, in the three snapshots of the 8NS-BD2, a bridging water molecule and different water molecules also present at the binding pocket of 8NS to BD2, indicating that water molecules are required for the binding to BD2. The similar roles of water molecules in bindings of 82Y and 837 to BD1 and BD2 are also observed in Fig. S4 and S4.† The above analysis suggest that t water molecules play an important role in the bindings of inhibitors to BD1 and BD2, which is further supported by the previous works.88,89 Therefore, water molecules, in particular for the bridging water molecules, should be paid special attentions in future drug design targeting BRD proteins.
4. Conclusions
In this work, MSMD simulations and binding free energy predictions were combined to reveal binding selectivity of inhibitors toward BD1 and BD2. MSMD simulations of 1 μs, containing ten separate replicas of 100 ns, were performed on six systems of BD1 and BD2 associated with three inhibitors 8NS, 82Y, and 837 to obtain effectively conformational sampling on BD1 and BD2. The results indicate that the structural flexibility of BD1 is higher than that of BD2 in L2 and L4 loop and two domains display different internal dynamics behavior. Binding free energies of three inhibitors to BD1 and BD2 computed by MM-GBSA method demonstrate that although the binding entropy of 8NS, 82Y, and 837 to BRD4BD2 is obviously enhanced compare to that of three inhibitors to BRD4BD1, the enthalpy changes are the pivotal factor driving binding selectivity of inhibitors toward BRD4BD1 and BRD4BD2. Accordingly, 8NS shows better selectivity toward BD2 over BD1, while 82Y and 837 can more favorably bind to BD1 than BD2. Furthermore, residue-based free energy decomposition computations also signify that 6 common residues (P82, P375), (V87, V380), (L92, L385), (L94, L387), (N140, N433), and (I146, V439) belonging to (BD1, BD2), make considerable binding difference of inhibitors to BD1 and BD2, implying that these residues are responsible for the main binding selectivity of inhibitors towards BD1 and BD2. This study is also expected to provide useful dynamics information and structure affinity relationship for designing highly selective inhibitors targeting BD1 and BD2.Conflicts of interest
No potential conflict of interest was reported by the authors.Acknowledgements
This work is supported by the National Natural Science Foundation of China (No 21863003 and 61762048). The authors sincerely thank Prof. Jianzhong Chen (School of Science, Shandong Jiaotong University, Jinan 250357, China) for useful discussions and invaluable comments.References
- A. Reverdy, Y. Chen, E. Hunter, K. Gozzi and Y. Chai, PLoS One, 2018, 13, e0204687 CrossRef.
- A. Dey, A. Nishiyama, T. Karpova, J. McNally and K. Ozato, Mol. Biol. Cell, 2009, 20, 4899–4909 CrossRef CAS.
- A. G. Cochran, A. R. Conery and R. J. Sims, Nat. Rev. Drug Discovery, 2019, 18, 609–628 CrossRef CAS.
- F. D. Prieto-Martínez, E. F.-d. Gortari, O. Méndez-Lucio and J. L. Medina-Franco, RSC Adv., 2016, 6, 56225–56239 RSC.
- N. Zaware and M.-M. Zhou, Nat. Struct. Mol. Biol., 2019, 26, 870–879 CrossRef CAS.
- E. Ferri, C. Petosa and C. E. McKenna, Biochem. Pharmacol., 2016, 106, 1–18 CrossRef CAS.
- C. H. Arrowsmith, C. Bountra, P. V. Fish, K. Lee and M. Schapira, Nat. Rev. Drug Discovery, 2012, 11, 384–400 CrossRef CAS.
- P. Filippakopoulos, S. Picaud, M. Mangos, T. Keates, J. P. Lambert, D. Barsyte-Lovejoy, I. Felletar, R. Volkmer, S. Müller, T. Pawson, A. C. Gingras, C. H. Arrowsmith and S. Knapp, Cell, 2012, 149, 214–231 CrossRef CAS.
- B. Donati, E. Lorenzini and A. Ciarrocchi, Mol. Cancer, 2018, 17, 164 CrossRef CAS.
- Y. Duan, Y. Guan, W. Qin, X. Zhai and B. Yu, MedChemComm, 2018, 9, 1779–1802 RSC.
- O. Gilan, I. Rioja, K. Knezevic, M. J. Bell, M. M. Yeung, N. R. Harker, E. Y. N. Lam, C.-w. Chung, P. Bamborough, M. Petretich, M. Urh, S. J. Atkinson, A. K. Bassil, E. J. Roberts, D. Vassiliadis, M. L. Burr, A. G. S. Preston, C. Wellaway, T. Werner, J. R. Gray, A.-M. Michon, T. Gobbetti, V. Kumar, P. E. Soden, A. Haynes, J. Vappiani, D. F. Tough, S. Taylor, S.-J. Dawson, M. Bantscheff, M. Lindon, G. Drewes, E. H. Demont, D. L. Daniels, P. Grandi, R. K. Prinjha and M. A. Dawson, Science, 2020, 368, 387–394 CrossRef CAS.
- J. Su, X. Liu, S. Zhang, F. Yan, Q. Zhang and J. Chen, J. Biomol. Struct. Dyn., 2018, 36, 1212–1224 CrossRef CAS.
- R. Tumdam, A. Kumar, N. Subbarao and B. S. Balaji, SAR QSAR Environ. Res., 2018, 29, 975–996 CrossRef CAS.
- S. L. Wu, L. F. Wang, H. B. Sun, W. Wang and Y. X. Yu, SAR QSAR Environ. Res., 2020, 31, 547–570 CrossRef CAS.
- A. R. Brasier and J. Zhou, Drug Discovery Today, 2020, 25, 126–132 CrossRef CAS.
- J. Lu, Y. Qian, M. Altieri, H. Dong, J. Wang, K. Raina, J. Hines, J. D. Winkler, A. P. Crew, K. Coleman and C. M. Crews, Chem. Biol., 2015, 22, 755–763 CrossRef CAS.
- J. Yang, Y. Li, A. Aguilar, Z. Liu, C.-Y. Yang and S. Wang, J. Med. Chem., 2019, 62, 9471–9487 CrossRef CAS.
- J. Zhang, P. Chen, P. Zhu, P. Zheng, T. Wang, L. Wang, C. Xu, J. Zhou and H. Zhang, Bioorg. Chem., 2020, 99, 103817 CrossRef CAS.
- M. Gacias, G. Gerona-Navarro, A. N. Plotnikov, G. Zhang, L. Zeng, J. Kaur, G. Moy, E. Rusinova, Y. Rodriguez, B. Matikainen, A. Vincek, J. Joshua, P. Casaccia and M.-M. Zhou, Chem. Biol., 2014, 21, 841–854 CrossRef CAS.
- F. H. Andrews, A. R. Singh, S. Joshi, C. A. Smith, G. A. Morales, J. R. Garlich, D. L. Durden and T. G. Kutateladze, Proc. Natl. Acad. Sci. U. S. A., 2017, 114, E1072–E1080 CrossRef CAS.
- N. Bharatham, P. J. Slavish, W. R. Shadrick, B. M. Young and A. A. Shelat, J. Mol. Graphics Modell., 2018, 81, 197–210 CrossRef CAS.
- H. Zhong, Z. Wang, X. Wang, H. Liu, D. Li, H. Liu, X. Yao and T. Hou, Phys. Chem. Chem. Phys., 2019, 21, 25276–25289 RSC.
- S. Moradi, A. Nowroozi and M. Shahlaei, RSC Adv., 2019, 9, 4644–4658 RSC.
- F. Yan, X. Liu, S. Zhang, J. Su, Q. Zhang and J. Chen, RSC Adv., 2018, 8, 39797–39810 RSC.
- J. Zeng, W. Li, Y. Zhao, G. Liu, Y. Tang and H. Jiang, J. Phys. Chem. B, 2008, 112, 2719–2726 CrossRef CAS.
- L. L. Duan, G. Q. Feng and Q. G. Zhang, Sci. Rep., 2016, 6, 31488 CrossRef CAS.
- M. Yang, X. Zhang and K. Han, Proteins, 2010, 78, 2222–2237 CrossRef CAS.
- L. Wang, Y. Wang, H. Sun, J. Zhao and Q. Wang, Chem. Phys. Lett., 2019, 736, 136785 CrossRef CAS.
- R. Han and S. Luber, Mol. Phys., 2020, 1–14 Search PubMed.
- W. Cheng, Z. Liang, W. Wang, C. Yi, H. Li, S. Zhang and Q. Zhang, Mol. Phys., 2016, 114, 128–140 CrossRef CAS.
- J. Chen, X. Wang, J. Z. H. Zhang and T. Zhu, ACS Omega, 2018, 3, 18052–18064 CrossRef CAS.
- T. Hou, W. Zhang, J. Wang and W. Wang, Proteins, 2009, 74, 837–846 CrossRef CAS.
- L. Duan, X. Liu and J. Z. H. Zhang, J. Am. Chem. Soc., 2016, 138, 5722–5728 CrossRef CAS.
- J. Zhao, H. Sun, W. Wang, L. Zhang and J. Chen, Chem. Phys. Lett., 2020, 759, 138042 CrossRef CAS.
- Y. Gao, T. Zhu and J. Chen, Chem. Phys. Lett., 2018, 706, 400–408 CrossRef CAS.
- R. Kumar, R. Kumar, P. Tanwar, S. V. S. Deo, S. Mathur, U. Agarwal and S. Hussain, RSC Adv., 2020, 10, 39640–39653 RSC.
- Y. Wang, L. F. Wang, L. L. Zhang, H. B. Sun and J. Zhao, SAR QSAR Environ. Res., 2020, 31, 149–170 CrossRef CAS.
- D. Shi, Q. Bai, S. Zhou, X. Liu, H. Liu and X. Yao, Proteins, 2018, 86, 43–56 CrossRef CAS.
- F. Yan, X. Liu, S. Zhang, J. Su, Q. Zhang and J. Chen, Int. J. Mol. Sci., 2018, 19, 2496 CrossRef.
- E. L. Wu, K. Han and J. Z. H. Zhang, Chem.–Eur. J., 2008, 14, 8704–8714 CrossRef CAS.
- M. Aldeghi, A. Heifetz, M. J. Bodkin, S. Knapp and P. C. Biggin, J. Am. Chem. Soc., 2017, 139, 946–957 CrossRef CAS.
- G. Hu and J. Wang, Eur. J. Med. Chem., 2014, 74, 726–735 CrossRef CAS.
- S. Tian, J. Zeng, X. Liu, J. Chen, J. Z. H. Zhang and T. Zhu, Phys. Chem. Chem. Phys., 2019, 21, 22103–22112 RSC.
- J. Devillers, Computational Design of Chemicals for the Control of Mosquitoes and Their Diseases, CRC Press Taylor & Francis Group 6000, Broken Sound Parkway NW, Suite 300 Boca Raton, 2018 Search PubMed.
- Y. Rodríguez, G. Gerona-Navarro, R. Osman and M.-M. Zhou, Proteins, 2020, 88, 414–430 CrossRef.
- J. Su, X. Liu, S. Zhang, F. Yan, Q. Zhang and J. Chen, Chem. Biol. Drug Des., 2018, 91, 828–840 CrossRef CAS.
- P. Auffinger and E. Westhof, J. Mol. Biol., 1997, 269, 326–341 CrossRef CAS.
- L. S. Caves, J. D. Evanseck and M. Karplus, Protein Sci., 1998, 7, 649–666 CrossRef CAS.
- B. Knapp, L. Ospina and C. M. Deane, J. Chem. Theory Comput., 2018, 14, 6127–6138 CrossRef CAS.
- P. Auffinger, S. Louise-May and E. Westhof, J. Am. Chem. Soc., 1995, 117, 6720–6726 CrossRef CAS.
- J. Chen, J. Wang, B. Yin, L. Pang, W. Wang and W. Zhu, ACS Chem. Neurosci., 2019, 10, 4303–4318 CrossRef CAS.
- J. Chen, X. Liu, S. Zhang, J. Chen, H. Sun, L. Zhang and Q. Zhang, Phys. Chem. Chem. Phys., 2020, 22, 2262–2275 RSC.
- J. Wang and Y. Miao, J. Phys. Chem. B, 2019, 123, 6462–6473 CrossRef CAS.
- J. Wang and Y. Miao, J. Chem. Phys., 2020, 153, 154109 CrossRef.
- J. Chen, W. Wang, H. Sun, L. Pang and B. Yin, J. Comput.-Aided Mol. Des., 2020, 34, 1289–1305 CrossRef CAS.
- L. Wang, Y. Wang, Z. Y. Yang, J. Zhao, H. B. Sun and S. L. Wu, SAR QSAR Environ. Res., 2020, 31, 373–398 CrossRef CAS.
- J. Chen, W. Wang, L. Pang and W. Zhu, Phys. Chem. Chem. Phys., 2020, 22, 21238–21250 RSC.
- W. L. Jorgensen, J. Chandrasekhar, J. D. Madura, R. W. Impey and M. L. Klein, J. Chem. Phys., 1983, 79, 926–935 CrossRef CAS.
- J. A. Maier, C. Martinez, K. Kasavajhala, L. Wickstrom, K. E. Hauser and C. Simmerling, J. Chem. Theory Comput., 2015, 11, 3696–3713 CrossRef CAS.
- D. Song, R. Luo and H.-F. Chen, J. Chem. Inf. Model., 2017, 57, 1166–1178 CrossRef CAS.
- H. Li, A. D. Robertson and J. H. Jensen, Proteins, 2005, 61, 704–721 CrossRef CAS.
- D. C. Bas, D. M. Rogers and J. H. Jensen, Proteins: Struct., Funct., Bioinf., 2008, 73, 765–783 CrossRef CAS.
- A. Jakalian, B. L. Bush, D. B. Jack and C. I. Bayly, J. Comput. Chem., 2000, 21, 132–146 CrossRef CAS.
- A. Jakalian, D. B. Jack and C. I. Bayly, J. Comput. Chem., 2002, 23, 1623–1641 CrossRef CAS.
- J. Wang, R. M. Wolf, J. W. Caldwell, P. A. Kollman and D. A. Case, J. Comput. Chem., 2004, 25, 1157–1174 CrossRef CAS.
- T. Darden, D. York and L. Pedersen, J. Chem. Phys., 1993, 98, 10089–10092 CrossRef CAS.
- U. Essmann, L. Perera, M. L. Berkowitz, T. Darden, H. Lee and L. G. Pedersen, J. Chem. Phys., 1995, 103, 8577–8593 CrossRef CAS.
- J.-P. Ryckaert, G. Ciccotti and H. J. C. Berendsen, J. Comput. Phys., 1977, 23, 327–341 CrossRef CAS.
- J. A. Izaguirre, D. P. Catarello, J. M. Wozniak and R. D. Skeel, J. Chem. Phys., 2001, 114, 2090–2098 CrossRef CAS.
- A. W. Götz, M. J. Williamson, D. Xu, D. Poole, S. Le Grand and R. C. Walker, J. Chem. Theory Comput., 2012, 8, 1542–1555 CrossRef.
- R. Salomon-Ferrer, A. W. Götz, D. Poole, S. Le Grand and R. C. Walker, J. Chem. Theory Comput., 2013, 9, 3878–3888 CrossRef CAS.
- W. Wang and P. A. Kollman, J. Mol. Biol., 2000, 303, 567–582 CrossRef CAS.
- J. Wang, P. Morin, W. Wang and P. A. Kollman, J. Am. Chem. Soc., 2001, 123, 5221–5230 CrossRef CAS.
- S. Genheden and U. Ryde, Expert Opin. Drug Discovery, 2015, 10, 449–461 CrossRef CAS.
- K. Al-Khafaji, D. Al-Duhaidahawi and T. Taskin Tok, J. Biomol. Struct. Dyn., 2020, 1–9 Search PubMed.
- J. Zhao, B. Yin, H. Sun, L. Pang and J. Chen, Chem. Phys. Lett., 2020, 747, 137329 CrossRef CAS.
- T. Hou, J. Wang, Y. Li and W. Wang, J. Comput. Chem., 2011, 32, 866–877 CrossRef CAS.
- T. Hou, J. Wang, Y. Li and W. Wang, J. Chem. Inf. Model., 2011, 51, 69–82 CrossRef CAS.
- J. Chen, X. Wang, L. Pang, J. Z. H. Zhang and T. Zhu, Nucleic Acids Res., 2019, 47, 6618–6631 CrossRef CAS.
- J. Chen, X. Wang, T. Zhu, Q. Zhang and J. Z. H. Zhang, J. Chem. Inf. Model., 2015, 55, 1903–1913 CrossRef CAS.
- J. Chen, J. Wang, F. Lai, W. Wang, L. Pang and W. Zhu, RSC Adv., 2018, 8, 25456–25467 RSC.
- A. Onufriev, D. Bashford and D. A. Case, Proteins, 2004, 55, 383–394 CrossRef CAS.
- H. Gohlke, C. Kiel and D. A. Case, J. Mol. Biol., 2003, 330, 891–913 CrossRef CAS.
- B. R. Miller 3rd, T. D. McGee Jr, J. M. Swails, N. Homeyer, H. Gohlke and A. E. Roitberg, J. Chem. Theory Comput., 2012, 8, 3314–3321 CrossRef.
- Y. Zhou, X. Liu, Y. Zhang, L. Peng and J. Z. H. Zhang, Mol. Phys., 2018, 116, 2633–2641 CrossRef CAS.
- J. Chen, B. Yin, W. Wang and H. Sun, ACS Chem. Neurosci., 2020, 11, 1811–1826 CrossRef CAS.
- Y. Yonetani, Mol. Phys., 2017, 115, 2987–2998 CrossRef CAS.
- T. D. Crawford, V. Tsui, E. M. Flynn, S. Wang, A. M. Taylor, A. Côté, J. E. Audia, M. H. Beresini, D. J. Burdick, R. Cummings, L. A. Dakin, M. Duplessis, A. C. Good, M. C. Hewitt, H.-R. Huang, H. Jayaram, J. R. Kiefer, Y. Jiang, J. Murray, C. G. Nasveschuk, E. Pardo, F. Poy, F. A. Romero, Y. Tang, J. Wang, Z. Xu, L. E. Zawadzke, X. Zhu, B. K. Albrecht, S. R. Magnuson, S. Bellon and A. G. Cochran, J. Med. Chem., 2016, 59, 5391–5402 CrossRef CAS.
- E. Nittinger, P. Gibbons, C. Eigenbrot, D. R. Davies, B. Maurer, C. L. Yu, J. R. Kiefer, A. Kuglstatter, J. Murray, D. F. Ortwine, Y. Tang and V. Tsui, J. Comput.-Aided Mol. Des., 2019, 33, 307–330 CrossRef CAS.
Footnote |
| † Electronic supplementary information (ESI) available. See DOI: 10.1039/d0ra09469b |
| This journal is © The Royal Society of Chemistry 2021 |

