 Open Access Article
Breaking the diffraction limit in absorption spectroscopy using upconverting nanoparticles
Sumeet
Kumar
*a,
Gunaseelan
M.
a,
Rahul
Vaippully
a,
Ayan
Banerjee
 b and
Basudev
Roy
 a
a
aDepartment of Physics, Quantum Centres in Diamond and Emergent Materials (QuCenDiEM)-group, Micro Nano and Bio-Fluidics (MNBF)-Group, Indian Institute of Technology Madras, Chennai, 600036, India. E-mail: basudev@iitm.ac.in
bDepartment of Physical Sciences, Indian Institute of Science Education and Research, Kolkata, 741246, India. E-mail: ayan@iiserkol.ac.in
First published on 25th June 2021
Abstract
We employ a single optically trapped upconverting nanoparticle (UCNP) of NaYF4:Yb,Er of diameter about 100 nm as a subdiffractive source to perform absorption spectroscopy. The experimentally expected mode volume of 100 nm of the backscatter profile of the nanoparticle matches well with a numerical simulation of the dominant backscattering modes to confirm our assertion of achieving a source dimension considerably lower than the diffraction limit set by the excitation wavelength of 975 nm for the UCNP. We perform absorption spectroscopy of several diverse entities such as the dye Rhodamine B in water, a thin gold film of thickness 30 nm, and crystalline soft oxometalates micro-patterned on a glass substrate using the UCNP as a source. The initial results lead to unambiguous utility of UCNPs as single nanoscopic sources for absorption spectroscopy of ultra-small sample volumes (femtolitres), and lead us to hypothesize a possible Resonance Energy Transfer mechanism between the UCNP and the molecules of the ambient medium, which may even lead to single molecule absorption spectroscopy applications.
1. Introduction
The diffraction limit defines the maximum spatial confinement of light or the best resolving power of optical instruments as determined by classical wave optics.1,2 While it is easily bypassed in the case of evanescent waves,3 a propagating light beam presents a more difficult challenge – typically mitigated by employing the angular momentum of light to produce diffraction-less beam modes,4 or high-resolution microscopy techniques such as STED,5,6 RESOLFT,7 photothermal microsopy8,9etc. In addition, fluorescence emission from single molecules which display controllable photochromism,10 have also enabled super-resolution microscopy techniques such as PALM11,12 or STORM13,14 – that are able to overcome the diffraction limit as well. However – to the best of our knowledge – a subdiffractive source to facilitate absorption spectroscopy still remains elusive.In order to attain subdiffractive sources, we envisage a single particle smaller than the diffraction limit that emits a broadband light, which can then be used for absorption measurements. Our idea relies on the fact that classical scattering theories predict that the mode volume of the leading order scattered modes are of the same order of the source volume – so that, if the source is a particle that is smaller than the diffraction limit of visible and infra-red light, the emission shall also remain sub-diffractive for a certain propagation distance. The rare earth doped upconversion nanoparticles (UCNPs) which have exceptional photon conversion behaviour of lower energy near-infra red photons into higher energy visible photon via long lived intermediate energy states15 are excellent candiates for this since the emission is in visible and can be easily isolated from the infra-red excitation beam. Moreover, it has advantages over conventional organic fluorophores and quantum dots like low excitation intensity and high chemical and photo stability.16 The UCNPs have been used for bio imaging,17–20 chemical sensing,21 temperature sensing,22,23 anti counterfeiting,24,25 basic statistical mechanics,26 security27 and solar cells.28 We expect that such UCNPs with diameter smaller than the diffraction limit of light can create subdiffractive mode volumes.
In this paper, we test this hypothesis, where we first perform numerical simulations to determine the scattered mode volume of a single UCNP (diameter 100 nm), and proceed to validate our simulations experimentally on an optically trapped single UCNP. Thus, we image the upconverted emission – which is predominantly in the backscatter direction – on a camera and determine its full-width at half maxima (FWHM), and obtain very good agreement with our simulation results. Thus, the source appears to be clearly subdiffractive – indeed, significantly smaller than that obtained by a tightly focused Gaussian beam at visible wavelengths. In order to test the efficacy of this source for diverse materials of known absorption characteristics, we perform absorption spectroscopy in the visible wavelengths for three different types of samples, namely Rhodamine-B dye (few femto-liters of Rhodamine-B dye dissolved in water detected up to a concentration of 100 ppm), gold film on glass coverslip and a pattern made on glass using soft oxometallates. In standard techniques employed for absorption spectroscopy in the visible wavelengths, the sample is irradiated with monochromatic light which is scanned through the band of required wavelengths, or a broadband white light. Importantly, such techniques reach an ultimate spatial resolution determined by the diffractive limit, but in practice achieve significantly lower resolution. On the other hand, a single UCNP clearly provides a definitive route to facilitate sudiffractive absorption spectroscopy with several exciting applications that can be envisaged. These include deploying it in conjugation with confocal microscopy to facilitate ultrahigh resolution without the use of complex higher order beams,5,11,13 and in the absorption-based imaging of molecules present in the mode volume of the UCNP source. Indeed, this could lead to an analog of the fluorescence correlation spectroscopy,29 which we propose could be termed as absorption correlation spectroscopy – that would enable absorption spectroscopy and imaging of extremely small sample volumes (femtolitres to attolitres) while in motion, as opposed to being immobilized.30
2. Theory
For propagating light, the diffraction limit is given by , where λ is the wavelength of light, and NA is the numerical aperture of the lens that is used for focusing/imaging the light. Hence, w0 is lowest for monochromatic light, and is significantly compromised in case of broadband light. Thus, the spatial resolution of absorption/emission processes are dependent on the linewidth of the emission line, which is again governed by the diffraction limit. It is here that we suggest usage of single UCNPs which absorb 975 nm light to generate broadband emission – whose spatial extent – however, is smaller than the diffraction limit of light.
To understand this in a quantitative manner, we take recourse to the well-known Mie scattering theory. While the Mie theory describes elastic scattering very accurately, we believe that it would be reasonably efficacious in describing the inelastic scattering process we report here, as we clarify shortly. The scattered electric field from the Mie theory for a particle of radius a is given as31
 | (1) |
 | (2) |
 , Momn = ∇ × (rψomn), Memn = ∇ × (rψemn),
  ,
,  , ψemn = cos(mφ)Pmn(cos
![[thin space (1/6-em)]](https://www.rsc.org/images/entities/char_2009.gif) θ)zn(kr), ψomn = sin(mφ)Pmn(cos
θ)zn(kr), ψomn = sin(mφ)Pmn(cos![[thin space (1/6-em)]](https://www.rsc.org/images/entities/char_2009.gif) θ)zn(kr), Pmn(cos
θ)zn(kr), Pmn(cos![[thin space (1/6-em)]](https://www.rsc.org/images/entities/char_2009.gif) θ) is the associated Legendre polynomial and zn(kr) are the spherical Bessel functions. The superscript (3) in the eqn (1) and (2) indicate that the radial part of the functions ψ are spherical Hankel functions. Now, in the case of particle sizes much smaller than the wavelength of the light, only the lower order scattered modes contribute significantly. Indeed, the main reason for our usage of the elastic scattering method to describe our process is that the spatial distributions of the scattered lower order modes – where the mode amplitudes are indicated by an and bn – are likely to remain mostly unaltered for the two-photon upconverting process. Thus, we expect to obtain good estimates of mode volumes using the elastic scattering calculations.
θ) is the associated Legendre polynomial and zn(kr) are the spherical Bessel functions. The superscript (3) in the eqn (1) and (2) indicate that the radial part of the functions ψ are spherical Hankel functions. Now, in the case of particle sizes much smaller than the wavelength of the light, only the lower order scattered modes contribute significantly. Indeed, the main reason for our usage of the elastic scattering method to describe our process is that the spatial distributions of the scattered lower order modes – where the mode amplitudes are indicated by an and bn – are likely to remain mostly unaltered for the two-photon upconverting process. Thus, we expect to obtain good estimates of mode volumes using the elastic scattering calculations.
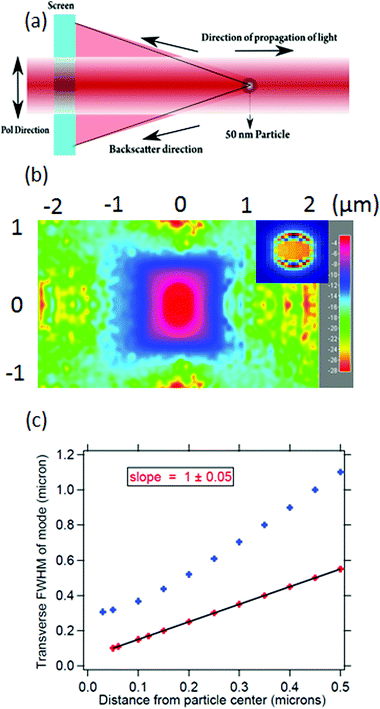
In order to quantify the size of the backscattered upconverted light, we perform a simulation on the FDTD-based software Lumerical32 with the assumption that the UCNP emission goes mostly into the backscatter direction, as is observed in experiments which we shall describe later. We consider a particle with a size well below the diffraction limit of visible light – namely 50 nm diameter – with a plane wave of wavelength 500 nm incident on it. We proceed to simulate the backscattering from the particle and determine the full width at half maximum (FWHM) of the Gaussian spread of the backscatter. The procedure has been indicated in Fig. 1(a), and the results are shown in Fig. 1(b) and (c). The FWHM of the Gaussian backscatter light increases linearly with the distance from the nanoparticle with a slope of 1. Thus, it appears that the emission from a 50 nm particle shall remain subdiffractive till about 150 nm distance from its center. Moreover, the UCNP backscatter mode volume appears to be significantly smaller than that for a tightly focused Gaussian beam with similar propagation distance at visible wavelength, as indicated in Fig. 1(c). The blue curve indicates the waist size as a function of distance from the center of the particle, as estimated from the eqn (3).
 | (3) |
Thus, it is clear that using a particle with subdiffractive dimensions yields a back-scattered mode which is subdiffractive as well. Very importantly, if there are absorbing particles or molecules inside that scattered volume, we clearly access the domain of sub-diffractive absorption spectroscopy. Note here that our imaging mechanism does not overcome the diffraction limit. However, since the source emits well within the diffraction limit, the final resolution we obtain overcomes the diffraction limit for that wavelength. It is also clear that we shall be limited to using the entire volume of the cone into which the particle backscatter is emitted (up to the wall of the sample chamber), unless we make use of confocal microscopy.
To test our design experimentally, we perform subdiffractive absorption spectroscopy on a solution of Rhodamine-B (RhB) molecules that have an absorption at the spectral emission profile of the UCNP, as indicated in Fig. 2. Now, when a source of light is passed through a medium, the intensity of forward scattered light can be ascertained from the Beer–Lambert Law using eqn (4).
I = I0![[thin space (1/6-em)]](https://www.rsc.org/images/entities/char_2009.gif) exp(−cσl) exp(−cσl) | (4) |
I = A![[thin space (1/6-em)]](https://www.rsc.org/images/entities/char_2009.gif) exp(−c/τ) exp(−c/τ) | (5) |
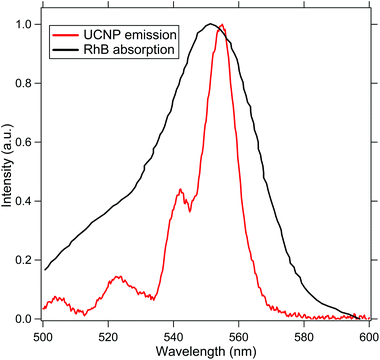 | ||
| Fig. 2 This indicates the absorption spectra of RhB (black) and the emission spectra of the UCNP (red) to show the efficiency of the resonance energy transfer process. | ||
The eqn (4) can also be written as
| log(I) = log(A) − c/τ | (6) |
Note that there would be some alteration to the theory while using a divergent beam for absorption, since the intensity of the beam also decreases with distance from the particle. The exact calculation is beyond the scope of this manuscript. However, since we focus on constant conical mode volumes to ascertain the concentration, the relative reduction in intensity is a good measure.
We determine both the spatial extent of the UCNP scattering (in the backward direction) and its spectral signatures convolved with that of RhB (in the forward direction) by careful experimentation. We also determine the concentration of RhB from the peak amplitudes of the spectra using eqn (4)–(6), which we now go on to describe.
3. Experimental details
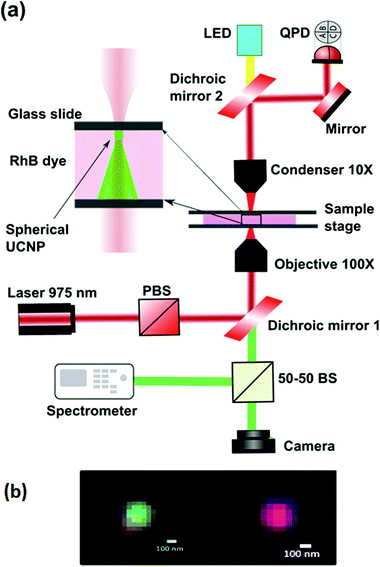
The experiment is performed on an optical tweezers setup made from an optical tweezers kit OTKB/M (Thorlabs) in the inverted configuration.33,34 A linearly polarized 400 mW, 975 nm butterfly laser (Thorlabs) is used to trap the UNCPs. The objective used is an Olympus 100×, 1.3NA oil-immersion objective type with the illumination aperture being overfilled while the condenser being a 10×, 0.25 NA Nikon air-immersion type. The power at the sample plane was adjusted to be about 30 mW, with the schematic being shown in Fig. 3. A set of two dichroic mirrors, one at the input while the other is at the output, separate the visible light from the trapping IR light. An LED lamp is used to illuminate the sample from the top via the output dichroic and passes through the bottom dichroic into a CMOS camera (Thorlabs). A part of light directed through the bottom dichroic is coupled into a spectrometer (Research India) using a 50–50 beam splitter. The 975 nm laser passes through the sample chamber and the forward scattered light passing through the top dichroic is made incident onto the Quadrant Photodiode (QPD) (Thorlabs, USA). To test the efficacy of our technique, we use this setup for examining the absorption property of the Rhodamine-B (RhB) dye, the absorption spectrum of a 30 nm gold film, and a layer of deposited Soft Oxometallate (SOM).The spherical UCNPs were prepared using the reverse microemulsion technique.35 Two identical solutions were prepared with 50 ml of microemulsion (μE) containing 20% of surfactants (CTAB, oleic acid and co-surfactant 1-butanol), 70% of oil (iso-octane) and 10% of water-phase (DI water) were prepared. 0.4 M of NaF was added into one μE (50 ml) and 0.1 M of Ln(NO3)3 (Ln = 78%Y, 20%Yb and 2%Er) was added in another μE (50 ml). These two μE s were mixed together using magnetic stirring for 30 min and kept aging for 24 h. The white gel like precipitant was washed three times with ethanol/acetone (1![[thin space (1/6-em)]](https://www.rsc.org/images/entities/char_2009.gif) :
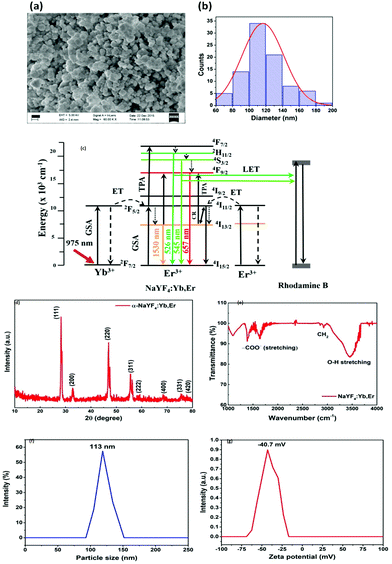
:![[thin space (1/6-em)]](https://www.rsc.org/images/entities/char_2009.gif) 1 ratio) and centrifuged with a force of 4700 RCF. The white colour powder was collected by drying at 100 C about 3 h. The sample was further calcined at 200 C for 30 min to obtain cubic phase NaYF4:Yb,Er nanoparticles. This cubic phase NaYF4:Yb,Er nanoparticles was used in the experiment. The Scanning Electron Microscopy (SEM) images for the prepared particles are shown in Fig. 4(a) with the distribution indicated in Fig. 4(b), which demonstrates that the diameter of the particles is between 60–180 nm. The energy level diagram for the NaYF4:Yb,Er particles has been shown in Fig. 4(c). The X-ray Diffraction (XRD) pattern of the NaYF4:Yb,Er reveals the cubic crystal structure of the NaYF4 without any impurity peaks, as indicated in Fig. 4(d). The calculated lattice parameters are a = 0.54507 ± 0.035 nm; v = 0.16194 nm3 and are matched with JCPDS number 77-2042. The FTIR spectrum of the UCNPs shows a small amount of carboxylic and hydroxyl from the residuals of surfactants used during the preparation, indicated in Fig. 4(e). The purity of the reverse microemulsion prepared sample is 98% up to 800 C, which is confirmed from the thermal gravimetric analysis.35 We also performed Dynamic Light Scattering (DLS) experiments using Horiba SZ 100 particle size analyzer. The size distribution results are shown in Fig. 4(f) while the zeta potential results are shown in Fig. 4(g). The DLS shows similar distribution of particle sizes as the SEM measurements – from 90 nm to 150 nm – and well dispersed in the colloidal solution. The zeta potential is −40 mV.
1 ratio) and centrifuged with a force of 4700 RCF. The white colour powder was collected by drying at 100 C about 3 h. The sample was further calcined at 200 C for 30 min to obtain cubic phase NaYF4:Yb,Er nanoparticles. This cubic phase NaYF4:Yb,Er nanoparticles was used in the experiment. The Scanning Electron Microscopy (SEM) images for the prepared particles are shown in Fig. 4(a) with the distribution indicated in Fig. 4(b), which demonstrates that the diameter of the particles is between 60–180 nm. The energy level diagram for the NaYF4:Yb,Er particles has been shown in Fig. 4(c). The X-ray Diffraction (XRD) pattern of the NaYF4:Yb,Er reveals the cubic crystal structure of the NaYF4 without any impurity peaks, as indicated in Fig. 4(d). The calculated lattice parameters are a = 0.54507 ± 0.035 nm; v = 0.16194 nm3 and are matched with JCPDS number 77-2042. The FTIR spectrum of the UCNPs shows a small amount of carboxylic and hydroxyl from the residuals of surfactants used during the preparation, indicated in Fig. 4(e). The purity of the reverse microemulsion prepared sample is 98% up to 800 C, which is confirmed from the thermal gravimetric analysis.35 We also performed Dynamic Light Scattering (DLS) experiments using Horiba SZ 100 particle size analyzer. The size distribution results are shown in Fig. 4(f) while the zeta potential results are shown in Fig. 4(g). The DLS shows similar distribution of particle sizes as the SEM measurements – from 90 nm to 150 nm – and well dispersed in the colloidal solution. The zeta potential is −40 mV.
The 975 nm laser beam is tightly focused inside the sample chamber for optically trapping a single UCNP. The concentration of RhB dye present in the medium of the sample chamber is varied while performing the experiment. Along with water, four different concentrations of 100, 750, 1500 and 3000 ppm RhB dye are used, in which a small amount of spherical UCNP in powdered form is added. These concentrations are well under the threshold concentration at which the inner filter effect may set in (lower than 200 μM (ref. 36)). The sample chamber is formed by placing 20 μL of each sample on a glass slide (Blue Star, 75 mm × 25 mm × 1.1 mm) and covered with a glass cover slip (Blue Star, English glass, Number 1 size). The thickness of the sample chamber has been estimated to be 22 μm. To estimate this, we first image the nanoparticles adhering to the bottom surface of the sample chamber into clear focus of the microscope camera. Then we move the z-axis of the stage such that those adhering to the top surface come into focus. The distance by which the stage was moved in order to shift focus between the two surfaces corresponds to the thickness of the sample chamber. Such an experiment was also done using a thin large area film of upconverting material,37 but we use nanoparticles of the material to do the same.
In order to coat the gold on the cover slip, the substrate was cleaned in acetone, IPA and de-ionized water using an ultrasonic bath for 5 min each followed by nitrogen drying. The samples were then loaded into a thermal evaporator immediately and 5 nm chromium was initially evaporated at a rate of 0.05 nm s−1 to provide better adhesion followed by 30 nm of gold evaporation at 0.1 nm s−1. The thickness of the deposited layer was monitored using a quartz crystal monitor and the vacuum of the evaporator chamber was maintained at 1 nbar during the deposition.
The Soft Oxometallate (SOM) was prepared by dispersing 817.6 mg of ammonium heptamolybdate tetrahydrate (from Sigma-Aldrich) in 4 mL of water which was heated until a homogeneous clear dispersion was obtained that scattered no light from a laser. This dispersion was subsequently cooled to room temperature before being used for optical patterning experiments – for which, the SOM solution was mixed with UCNP and then the patterning was performed with thermo-optical tweezers, as reported previously in literature.38 Briefly, a layer of self-assembled SOM absorbs light which leads to the formation of a temperature ‘hot spot’ that eventually results in the nucleation of a bubble which in turn causes an in-flow of material into the base of the bubble due to Marangoni convection. The bubble is then displaced in one direction by moving the laser spot which causes formation of patterns on the substrate. The SOMs are in a crystalline phase in the pattern as has been demonstrated.39
We report our results in the next section.
4. Results and discussion
Here, we describe in detail the experimental results demonstrating sub-diffraction limit absorption spectroscopy where emission of a single UNCP is used as the source for several species including RhB dye, an Au nano-layer on a glass substrate, and a colloidal crystal (SOMs), also patterned on a glass substrate. We have carried out several controlled experiments which we believe establish our claim to the subdiffractive nature of our UNCP-based source. But prior to absorption spectroscopy, we characterize the emission from the UNCPs themselves, and determine that the spatial extent of the backscattered mode is indeed of the order predicted in our simulations.4.1. Scatter mode volume of a single UCNP and effect of UCNP sizes
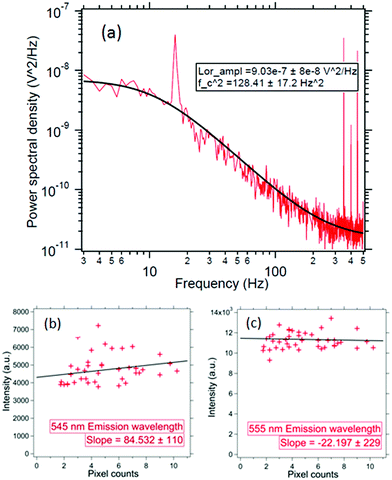
We concentrate on the emission at 410 nm, which we proceed to use as a reference when working with RhB – since the latter does not absorb at this wavelength. Indeed, the ratio of the peak intensities at 555/545 nm and 410 nm are used to track dye absorption. However, we first attempt to quantify the backscatter mode volume by estimating the size of the particle using an indirect technique relying upon the Stokes drag encountered by the trapped particle. Thus, we trap the particle and move the stage periodically along the direction transverse to the direction of the trapping light beam. Then we estimate the Power Spectral Density, as is shown in Fig. 5(a). The displacement sensitivity is given by,40 | (7) |
 , where tmsr is the measurement time. Here A is the amplitude of the sinusoidal stage motion. The drag coefficient for the driven axis is then given by:
 | (8) |
We modulate stage sinudoidally at fstage = 16 Hz with an amplitude of A = 500 nm. The Δf is 0.5 Hz and the T is the room temperature set using an air-conditioner at 25 C. As shown in Fig. 5(a) – the size for this particle comes out to be 136 ± 10 nm – which is in the range of the UCNP size we synthesized. Note that this is within 2 standard deviations of the size we predicted in our simulations for the backscatter mode volume in very close proximity of the nanoparticle – which is essentially the same as the diameter of the particle itself. Incidentally, this also proves that we indeed have a single trapped UNCP. These results clearly demonstrate that the illumination region of the sub-diffractive UCNP's scatter is well within the diffraction limit of visible light.
We now proceed to the measurement of the spectra of individual trapped UCNPs. The UCNP absorbs light at 975 nm and emits in a range of wavelengths between 400 and 700 nm as shown in Fig. 7. The backscattered light from a single trapped UCNP is now coupled into a spectrometer. The integration time is fixed to 10 s and the measurements are repeated over 5 scans – the average of which yields the spectrum of the emitted light. Now, since we do not have monodispersed UCNPs – it had to be established that the ratio of the intensities at different wavelengths remained steady for different particle sizes (all from the same batch of average diameter 120 nm). Thus, we proceeded to trap individual particles, and measured both the scattering spectrum and the scatter-mode volume diameter. The results have been shown in Fig. 5(b) and (c). It appears that the mean particle sizes are slightly larger than the mean size from the SEM images, which maybe due to the formation of clusters. From the spectra, we find that the ratio of intensities at 555 nm (or 545 nm) with that at 410 nm are constant to within 12%, as indicated in Fig. 5. Thus, in our experiments with the RhB dye – where we attempted to measure dye concentration from changes in intensity of the UCNP spectra due to absorption by RhB – any attempt to extract concentrations with intensity changes less than 12% is futile, which is the reason why dye concentrations lower than 100 ppm cannot be detected by this technique presently. However, the sensitivity may be improved by performing the experiment in a microfluidic chamber with smaller spatial dimensions than what we have presently in our sample chamber, and proceeding to trap a single UCNP in a similar manner and gradually flowing different concentrations of dye.
4.2. Absorption spectra through gold film
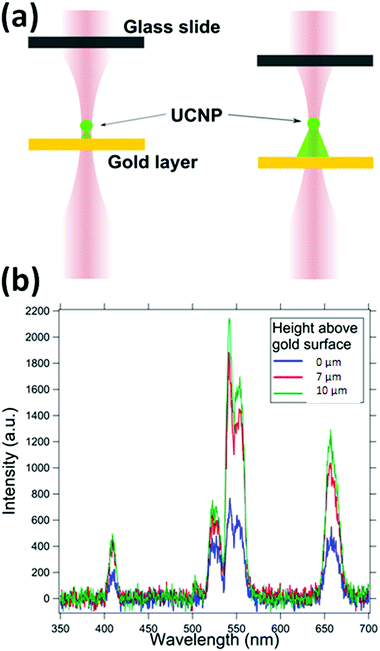
We first take the spectra from the UCNP in the presence of a 30 nm gold film at the bottom surface, as indicated in Fig. 6, to establish that the entire conical volume of emission from the particle is not required to get the absorption. The Fig. 6 shows that layers as thin as 30 nm can also provide absorption, and hence a signature of the UCNP source as sub-diffractive. As the trapped particle is moved deeper into the sample, the absorption due to the gold film reduces. The absorption due to the gold film appears broadband with significant absorption at 405 nm, 545 nm, 555 nm and at 650 nm. Here, we suspect that the plasmon resonance might also be in the recorded band of wavelengths.4.3. UNCP spectra in the presence of RhB dye and the effects of dye concentration
We now go on to use the spherical UCNP as a source of excitation for dye molecules. The spectra of the samples are normalised to 410 nm in order to compare the intensity at 545 and 555 nm as shown in Fig. 7. Now, since RhB absorbs at 555 nm, the intensity of emission at 555 nm changes with concentration of RhB dye. Understandably, when the medium does not contain RhB, the intensity is highest as predicted by the Beer–Lambert law. It gradually decreases while increasing the concentration of dye. Finally the emission from UCNP is almost completely absorbed by RhB molecules at 3000 ppm concentration – which clearly demonstrates the absorption of light emitted from the UCNP by the RhB. The spectra obtained for both the cases are shown in Fig. 7.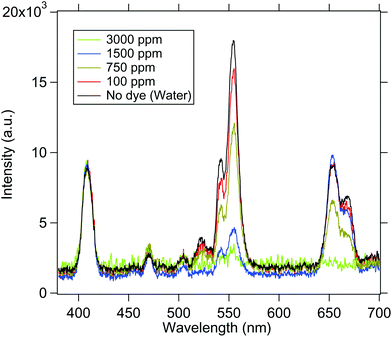 | ||
| Fig. 7 The emission spectra from the UCNP in the presence of various concentrations of the dye solution is shown. As the concentration is increased, the 545 nm/555 nm peak intensity gets reduced. | ||
These observations suggest that there may be two possible mechanisms behind the absorption of the dye molecules – simple reabsorption, or a Resonance Energy transfer. Now, for the latter to be the case, one should observe a re-emission peak at 580 nm for the RhB molecules,37 which should increase with dye concentration. However, we do not observe this – which may reinforce the fact that the phenomenon we have in our experiments is one of reabsorption. However, we may not yet completely rule out the possibility of the energy transfer, since a possible reason for us not observing the re-emission peak might be that we integrate for too long in order to obtain a measurable signal in our spectrometer – which may lead to photobleaching of the dye molecules. However, this is a very interesting question which should be addressed in future research, where more sophisticated and sensitive detectors may be deployed to determine the existence of the re-emission peak, so as to test our hypothesis of the energy transfer. Note also that When the UCNP is placed in the upper region, the dye molecules present in the entire conical volume of the sample chamber can absorb the emitted radiation. This shows that the energy is transferred to the dye molecules present at distances even larger than few nanometers. In addition, we also notice some non-linearities in the absorption spectra of the 655 nm line which is possible since this wavelength is not exactly on absorption resonance of the dye.
4.4. Characterisation of concentration dependence of absorption
RhB dye absorbs light in the visible region having the center of the peak at a wavelength of 550 nm and bandwidth of 40 nm. The light emitted from UCNP at 410 nm is not absorbed by the dye and hence the intensity at this wavelength has been used as a reference. The ratio of the intensity of emission at 545 and 410 nm is measured for different concentrations of the dye. The ratio decreases with an increase in the concentration of dye as shown in Fig. 8(a), in accordance with the Beer–Lambert's law. Similarly, the ratio of intensity at wavelengths of 555 nm and 410 nm i.e. I555(C)/I410(C) are estimated for different concentrations of the dye and shown in Fig. 8(b). It can be seen that the τ parameters are similar for both the 545 nm absorption response and the 555 nm response.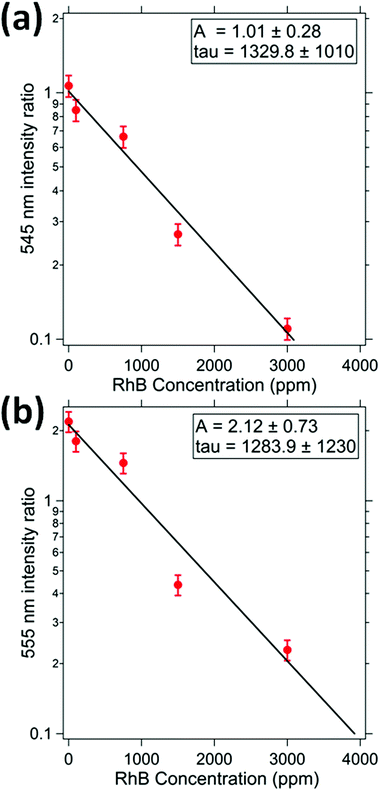 | ||
| Fig. 8 This indicates the relative intensity of (a) 545 nm, and (b) 555 nm peak as function of RhB concentration. The relative intensity has been estimated with respect to the 405 nm intensity. | ||
The values of the parameter A are 1.0 ± 0.1 and 2.1 ± 0.2 for 545 nm and 555 nm intensity ratios. It shows that for zero concentration of dye, the emission from UCNP at 555 nm is nearly twice as bright as that at 545 nm. The coefficient τ for 545 nm is 1329 ppm which is well consistent with that at 555 nm (1289 ppm). The exact values of the collision cross section could not be ascertained due to the conical profile of the emitted light and a varying intensity as a function of distance from the UCNP.
Note that for all the experiments, the optical path length, l is fixed at 22 μm by moving the trapped UCNP to the upper region of the sample chamber. Hence, the emission is in a 45 degree cone with the apex at the UCNP with the mode passing through to a glass surface located 22 μm away. This gives a mode volume of  . This volume can be further reduced by employing confocal techniques, so that information may be gleaned from virtually a single axial plane – which will naturally contain an ultra-small volume of fluid.
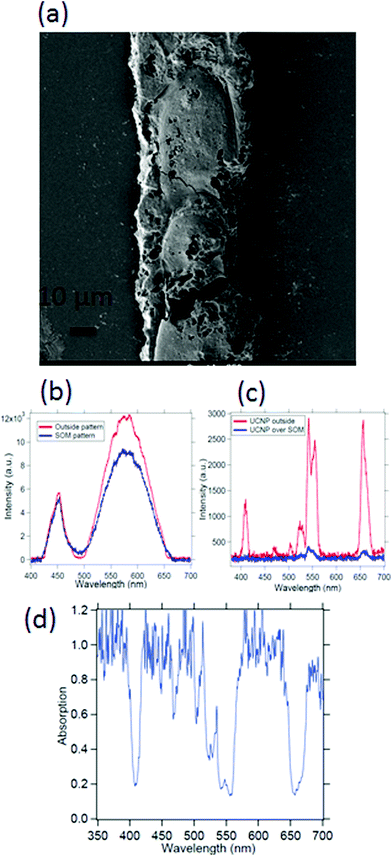
4.5. Spectra due to deposited SOM
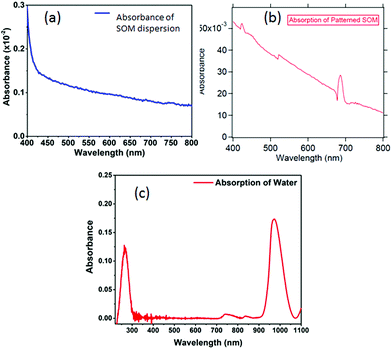
Spectroscopy of nano or microsamples is challenging since the light from standard sources may be mostly unutilized due to the sample surface area being extremely small, which often leads to complex calibration (background correction) procedures and poor signal to noise ratio. A nanoscopic source helps mitigate these issues since the source dimensions are now comparable or even less than the sample size, so that the source may even be scanned to resolve interesting features of the sample. We demonstrate this on a micropatterned SOM38 sample where we obtain a high signal to noise ratio spectra with a single UCNP as source. The SOM material has a width of 50 μm (Fig. 9(a)) and a thickness of 1 μm and hence difficult to take absorption spectra of, using conventional spectrometers. Indeed the signal to noise ratio is at least 3 times better when obtained by illumination from a standard laser source at 975 nm, than using broadband source, as indicated in Fig. 9(b) and (c). Here we find that the intensities of the peak at 405, 555 nm and 650 nm are suppressed by about 80% while at the same time, the 545 nm peak is suppressed by only 60%, as shown in Fig. 9(d).We also show the absorption spectra taken with a conventional spectrometer (Jasco, V-570) and find that the absorbance recorded is about 3% for the deposited SOM pattern while the SOM dispersion has even lower absorbance, as shown in Fig. 10(a) and (b). Further, the absorption of pure water is also shown in Fig. 10(c). There is significant absorption of 975 nm light by pure water (around 18%), so that it is clear that the absence of water would have increased the overall signal levels by the same percentage (since the excitation intensity is now lowered). However, any dye would be needed to be mixed with a solvent – so that the solvent absorption would indeed contribute to the signals finally measured from the dye itself. However, this is not expected to interfere with the re-emission of the dye, since the re-emission happens in visible where water has very low absorption.
An issue that may merit consideration is the classification of the emission peaks of the UNCPs between electric (ED) or magnetic dipole (MD) driven transitions. Now, there exists interesting work in this area on Er:Y2O3 and Eu:NaYF4 UCNPs,41,42 where the spectra has been carefully analysed from their polarization characteristics, which has then been combined with simulations to infer the origin of the transitions. Note that these UCNPs were of a different material compared to ours, and also different in geometry, quite distinct from the predominantly spherical nanoparticles we have in our case. Interestingly, in our case, we observe that the emission from the these in our case is not dependent on the polarization of the coupling light – which we attribute to the fact that the visible emission from this source has been found to be predominantly driven by ED transitions with very little MD character.43 Further, trapping in optical tweezers does not retain control over the orientation of the nanoparticle and hence polarization dependent features can be expected to be smeared out. Moreover, our chief focus in this work is to observe the change in the spectra of the trapped single UCNPs in the presence of RhB and SOMs – thereby confirming our claim of the former qualifying as sub-diffraction absorption sources – and is independent of the ED or MD origin of the spectra.
5. Conclusions
In conclusion, we demonstrate a new method of performing absorption spectroscopy, employing the emission from a single UCNP with dimensions ∼100 nm as a source – which results in spatial resolution better than that provided by sources constrained by the diffraction limit that determines the extent of confinement of propagating light. Naturally, this offers tantalizing possibilities – some of which we highlight in this paper. Thus, we first ascertain that the scattered light is indeed confined within sub-wavelength dimensions using an FDTD simulation whose results we confirm experimentally. Then, we actually perform spectroscopy using a single UCNP source on the well known dye RhB, and show that the UCNP emission is actually modified in the presence of the dye at the latter's absorption regions, while the unabsorbed component of the emission spectra remains the same. Our experiments are carried out on femtolitres of the dye – and we believe that this can be lowered to even attoliter volumes using confocal microscopy. Additionally, we use the UCNP as a source for a micropatterned metal oxide polymer (SOM), where conventional sources would lead to considerably lower SNR due to a significant fraction of the source light being unabsorbed. Indeed, we obtain an increase of almost 3 times using our UCNP source for the absorption spectroscopy of SOMs in comparison to a standard source coupled using a microscope. It may also be possible to detect single molecule transits through the scattered mode of the UCNP – whose emission can be tuned with the use of different materials for fabricating the UCNP – thus leading to broadband sub-diffraction sources, that can prove as a crucial resource in the absorption spectroscopy of nanomaterials. Finally, our results suggest the possibility of existence of a Resonance Energy Transfer mechanism between the UCNP and the molecules of the ambient medium – which, we believe, can lead to a new domain of research in single molecule absorption spectroscopy facilitated by such single UCNP-based subdiffractive sources. We have started research in some of these directions, and hope to report exciting results soon.Conflicts of interest
There are no conflicts to declare.Acknowledgements
We wish to acknowledge the Indian Institute of Technology Madras, Chennai, India for their Seed Grant. This work was also supported by the DBT/Wellcome Trust India Alliance Fellowship IA/I/20/1/504900 awarded to Basudev Roy. We also wish to thank Jayaraman Senthilselvan for allowing the usage of his lab for preparation of the 120 nm UCNP.References
- E. Abbe, Arch. Mikrosk. Anat., 1873, 9, 413–468 CrossRef.
- A. Lipson, S. G. Lipson and H. Lipson, Optical physics, Cambridge University Press, 2010 Search PubMed.
- U. Dürig, D. W. Pohl and F. Rohner, J. Appl. Phys., 1986, 59, 3318–3327 CrossRef.
- L. Li and F. Li, Phys. Rev. E, 2013, 88, 033205 CrossRef PubMed.
- S. W. Hell and J. Wichmann, Opt. Lett., 1994, 19, 780–782 CrossRef CAS PubMed.
- G. Vicidomini, P. Bianchini and A. Diaspro, Nat. Methods, 2018, 15, 173 CrossRef CAS PubMed.
- M. Hofmann, C. Eggeling, S. Jakobs and S. W. Hell, Proc. Natl. Acad. Sci. U. S. A., 2005, 102, 17565–17569 CrossRef CAS PubMed.
- D. Boyer, P. Tamarat, A. Maali, B. Lounis and M. Orrit, Science, 2002, 297, 1160–1163 CrossRef CAS PubMed.
- A. Gaiduk, M. Yorulmaz, P. Ruijgrok and M. Orrit, Science, 2010, 330, 353–356 CrossRef CAS PubMed.
- J. Fölling, V. Belov, R. Kunetsky, R. Medda, A. Schönle, A. Egner, C. Eggeling, M. Bossi and S. E. Hell, Angew. Chem., Int. Ed., 2007, 46, 6266–6270 CrossRef PubMed.
- S.-H. Lee, J. Y. Shin, A. Lee and C. Bustamante, Proc. Natl. Acad. Sci. U. S. A., 2012, 109, 17436–17441 CrossRef CAS PubMed.
- E. Betzig, G. H. Patterson, R. Sougrat, O. W. Lindwasser, S. Olenych, J. S. Bonifacino, M. W. Davidson, J. Lippincott-Schwartz and H. F. Hess, Science, 2006, 313, 1642–1645 CrossRef CAS PubMed.
- M. J. Rust, M. Bates and X. Zhuang, Nat. Methods, 2006, 3, 793–796 CrossRef CAS PubMed.
- E. Nehme, L. E. Weiss, T. Michaeli and Y. Shechtman, Optica, 2018, 5, 458–464 CrossRef CAS.
- F. Auzel, Chem. Rev., 2004, 104, 139–174 CrossRef CAS PubMed.
- S. Wu, G. Han, D. J. Milliron, S. Aloni, V. Altoe, D. V. Talapin, B. E. Cohen and P. J. Schuck, Proc. Natl. Acad. Sci. U. S. A., 2009, 106, 10917–10921 CrossRef CAS PubMed.
- P. A. Demina, N. V. Sholina, R. A. Akasov, D. A. Khochenkov, N. A. Arkharova, A. V. Nechaev, E. V. Khaydukov and A. N. Generalova, Biomater. Sci., 2020, 8, 4570–4580 RSC.
- G. Chen, H. Qiu, P. N. Prasad and X. Chen, Chem. Rev., 2014, 114, 5161–5214 CrossRef CAS PubMed.
- S. Yamini, M. Gunaseelan, G. Kumar, S. Singh, G. C. Dannangoda, K. S. Martirosyan, D. K. Sardar, S. Sivakumar, A. Girigoswami and J. Senthilselvan, Microchim. Acta, 2020, 187, 1–10 CrossRef PubMed.
- B. Del Rosal and D. Jaque, Methods Appl. Fluoresc., 2019, 7, 022001 CrossRef CAS PubMed.
- D. E. Achatz, R. Ali and O. S. Wolfbeis, Luminescence applied in sensor science, Springer, 2010, pp. 29–50 Search PubMed.
- F. Vetrone, R. Naccache, A. Zamarrón, A. Juarranz de la Fuente, F. Sanz-Rodríguez, L. Martinez Maestro, E. Martin Rodriguez, D. Jaque, J. Garcia Sole and J. A. Capobianco, ACS Nano, 2010, 4, 3254–3258 CrossRef CAS PubMed.
- M. Runowski, P. Woźny, N. Stopikowska, I. R. Martín, V. Lavin and S. Lis, ACS Appl. Mater. Interfaces, 2020, 12, 43933–43941 CrossRef CAS PubMed.
- M. You, M. Lin, S. Wang, X. Wang, G. Zhang, Y. Hong, Y. Dong, G. Jin and F. Xu, Nanoscale, 2016, 8, 10096–10104 RSC.
- M. Skwierczynska, P. Wozny, M. Runowski, M. Perzanowski, P. Kulpinski and S. Lis, J. Alloys Compd., 2020, 154456 CrossRef CAS.
- S. Kumar, A. Kumar, M. Gunaseelan, R. Vaippully, D. Chakraborty, J. Senthilselvan and B. Roy, Front. Phys., 2020, 8, 570842 CrossRef.
- F. Kaboli, N. Ghazyani, M. Riahi, H. Zare-Behtash, M. H. Majles Ara and E. Heydari, ACS Appl. Nano Mater., 2019, 2, 3590–3596 CrossRef CAS.
- M. Ambapuram, R. Ramireddy, G. Maddala, S. Godugunuru, P. V. S. Yerva and R. Mitty, ACS Appl. Electron. Mater., 2020, 2, 962–970 CrossRef CAS.
- D. Magde, E. Elson and W. W. Webb, Phys. Rev. Lett., 1972, 29, 705 CrossRef CAS.
- M. Celebrano, P. Kukura, A. Renn and V. Sandoghdar, Nat. Photonics, 2011, 5, 95–98 CrossRef CAS.
- C. F. Bohren and D. R. Huffman, Absorption and scattering of light by small particles, John Wiley & Sons, 2008 Search PubMed.
- https://www.lumerical.com/products/ .
- R. Vaippully, D. Bhatt, A. D. Ranjan and B. Roy, Phys. Scr., 2019, 94, 105008 CrossRef CAS.
- R. Vaippully, V. Ramanujan, S. Bajpai and B. Roy, J. Phys.: Condens. Matter, 2020, 32, 235101 CrossRef CAS PubMed.
- M. Gunaseelan, S. Yamini, G. Kumar and J. Senthilselvan, Opt. Mater., 2018, 75, 174–186 CrossRef CAS.
- S. K. Panigrahi and A. K. Mishra, J. Photochem. Photobiol., C, 2019, 41, 100318 CrossRef.
- J. L. Wu, B. S. Cao, L. Rino, Y. Y. He, Z. Q. Feng and B. Dong, RSC Adv., 2017, 7, 48494–48500 RSC.
- B. Roy, M. Arya, P. Thomas, J. K. Jurgschat, K. Venkata Rao, A. Banerjee, C. Malla Reddy and S. Roy, Langmuir, 2013, 29, 14733–14742 CrossRef CAS PubMed.
- E. Greenberg, N. Armon, O. Kapon, M. Ben-Ishai and H. Shpaisman, Adv. Mater. Interfaces, 2019, 6, 1900541 CrossRef.
- E. Schaffer, S. F. Norrelykke and J. Howard, Langmuir, 2007, 23, 3654–3665 CrossRef PubMed.
- D. Li, M. Jiang, S. Cueff, C. M. Dodson, S. Karaveli and R. Zia, Phys. Rev. B: Condens. Matter Mater. Phys., 2014, 89, 161409(R) CrossRef.
- F. T. Rabouw, P. T. Prins and D. J. Norris, Nano Lett., 2016, 16, 7254–7260 CrossRef CAS PubMed.
- M. He, T. Liu, J. Xiu, Y. Tang and Z. Zhang, J. Spectrosc., 2015, 2015, 871320 Search PubMed.
| This journal is © The Royal Society of Chemistry 2021 |

