Lanthanide doped luminescence nanothermometers in the biological windows: strategies and applications
Albenc
Nexha
 ,
Joan Josep
Carvajal
 *,
Maria Cinta
Pujol
,
Francesc
Díaz
and
Magdalena
Aguiló
Universitat Rovira i Virgili, Departament de Química Física i Inorgànica, Física i Cristal·lografia de Materials i Nanomaterials (FiCMA-FiCNA)-EMaS, Campus Sescelades, E-43007, Tarragona, Spain. E-mail: joanjosep.carvajal@urv.cat
First published on 24th March 2021
Abstract
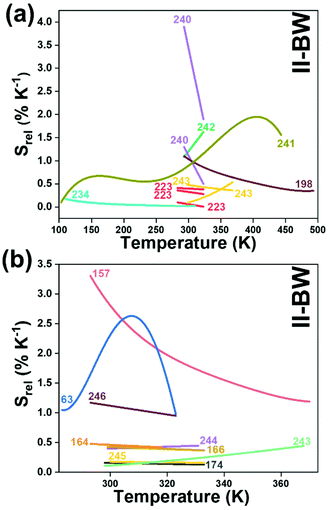
The development of lanthanide-doped non-contact luminescent nanothermometers with accuracy, efficiency and fast diagnostic tools attributed to their versatility, stability and narrow emission band profiles has spurred the replacement of conventional contact thermal probes. The application of lanthanide-doped materials as temperature nanosensors, excited by ultraviolet, visible or near infrared light, and the generation of emissions lying in the biological window regions, I-BW (650 nm–950 nm), II-BW (1000 nm–1350 nm), III-BW (1400 nm–2000 nm) and IV-BW (centered at 2200 nm), are notably growing due to the advantages they present, including reduced phototoxicity and photobleaching, better image contrast and deeper penetration depths into biological tissues. Here, the different mechanisms used in lanthanide ion-doped nanomaterials to sense temperature in these biological windows for biomedical and other applications are summarized, focusing on factors that affect their thermal sensitivity, and consequently their temperature resolution. Comparing the thermometric performance of these nanomaterials in each biological window, we identified the strategies that allow boosting of their sensing properties.
1. Introduction
Several chemical, physical and biological processes are temperature-dependent. Thus, precise and accurate measurement of the temperature is of paramount importance in countless industrial and research applications.1–7Nowadays, temperature sensors account for 80% of the world-wide sensor market and expect to reach a value of $8.8 billion by 2027, according to Grand View Research, Inc.8 However, most of these temperature sensors are based on contact thermometers, where the thermal reading is achieved by direct physical contact of an invasive probe material with the body in which the temperature should be determined. Contact thermometers require conductive heat transfer and need to reach a thermal equilibrium between the sensor and the object under study. This connection might disturb the measurement of the temperature at the object, leading to an inappropriate determination of the exact temperature in some cases. These measurements are especially affected when dealing with nanoscale dimensions, in which the size of the object under study is smaller than the sensor head of the thermometer.9–13 In addition, contact thermometers allow the performance of only surface measurements. Modern requirements for temperature readings in areas such as microelectronics, photonics, nanomedicine and diagnosis, and microfluidics, among others, have led to the replacement of contact thermometers and the development of non-contact nanoscale thermometers.14–16
Non-contact nanoscale thermometers can provide feedback of the local temperature of a given system with micro and nanoscale spatial resolution.17 The precise determination of the temperature at the nanoscale has attracted great interest, especially in nanomedicine and diagnosis fields, as many functions of the human body, including cell division, gene expression or enzyme reactions, are temperature-dependent.18 Diseases such as the cellular pathogenesis of cancer lead to heat generation.19 In addition, temperature changes can also be induced intentionally to kill locally infected cells.20 Therefore, achieving precise temperature reading information is crucial to heal infected cells and simultaneously avoid the destruction of surrounding healthy tissues.
High-resolution temperature non-contact measurement techniques operating in the micro/nanoscale are divided into several types using distinct criteria based on their operating principle. These methods provide different advantages and drawbacks;21 hence a proper selection according to the required spatial, temporal and temperature resolutions is essential. Non-contact techniques for the determination of the temperature include infrared thermometry, thermoreflectance, Raman scattering, interferometry, and non-optical and luminescence nanothermometry.17
The principle of infrared thermometry is to determine the temperature by the amount of the thermal radiation emitted by the target which is being monitored.17 Knowing the amount of infrared energy emitted by the object and its emissivity, the target temperature can be determined. This non-contact method is a well-implemented commercial technique and grants a temperature image profile of the surface of the target, achieving spatial, temporal and temperature resolutions of ∼10 μm, ∼10 μs and ∼0.1 K,17 respectively. However, this technique requires an additional knowledge of the spatial resolution and the emissivity of the target at the micrometer scale.2 These are serious drawbacks for the application of this technique at the nanoscale because, with the determination of the temperature on the surface and not inside the target, the precise discrimination of the temperature of a living cell, for instance, strongly impacts on the analysis of its pathology and physiology and, in turn, on the optimization of therapeutic processes (e.g. in hyperthermal tumor treatments and photodynamic therapy).22,23
Thermoreflectance thermometry extracts temperature readings from the dependence of the refractive index of the material on the temperature.24 This technique offers high temperature (∼0.01 K) and temporal resolution (∼0.1 μs), and the combination of qualitative and quantitative measurements.2 Despite this, it requires the calibration of the refractive index of the material of analysis, and its spatial resolution is restricted by the light diffraction limit.25
Raman scattering thermometry is based on the dependence of the position of the Raman modes of the material of interest on temperature.26 Raman thermometry can be applied to liquids and solids, including powders, achieving spatial, temporal and temperature resolutions of ∼1 μm, ∼106 μs and ∼0.1 K,2 respectively. Regardless of these good parameters, it is a time-consuming technique and the number of the materials to which this technique can be applied is very small because the materials need to have a large Raman efficiency if applied as successful temperature probes.7
Optical interferometry provides dual information: local temperature and local deformation due to the thermal expansion of the material under analysis.27 Interferometers depict the differences in optical paths between light beams that bypass the test section and pass directly through it. Although this technique can be integrated in remote detection systems with spatial, temporal and temperature resolutions of ∼1 μm, ∼0.001 μs and ∼10−5 K,2 respectively, drawbacks related to cross talk with other stimuli, such as strain/stress and bending, and low spatial resolution in the transverse direction, limit their application.2
Non-optical thermometry methods include several techniques developed for nanoscale thermometric applications such as scanning thermal microscopy,28 deposition of metallic temperature sensors by nanolithography,29 carbon nanotube thermometry,30 and biomaterial thermometry.31 Scanning thermal microscopy uses a small thermocouple with a junction diameter of the order of 20 to 100 nm, formed at the probe tip of an atomic force microscope, which is scanned over the surface of interest.32 It can also consist of a combination of a thermocouple and a resistance temperature,33 providing sub-micrometric spatial resolution.2 This technique is limited to solid samples and offers slow acquisition times, requiring at the same time fundamental knowledge of the tip–sample heat transfer mechanisms.2 Nanolithography can be applied to deposit a platinum strip to form a thermal sensor on the surface of the material of interest. However, ensuring the robustness of the sensor and its chemical consistency is an important challenge for this technique.17 Carbon nanotubes as thermal probes were originally proposed using gallium as the thermometric liquid filling them, and with the support of a scanning electron microscope to observe their meniscus.30 These nanotubes have been used also to provide good thermal contact between an electron microscope and the sample with nanoscale resolution,34 but they presents also some limitations, such as the thermal contact resistance formed between the tip and the surface, which can modify the probe response, especially for high thermal conducting samples.34 Biomaterials, such as living cells, sense temperature by using their components (proteins, nucleic acids and mRNAs).31 The change of temperature in these components is manifested either by modifying their conformational structure directly or undergoing complex reactions that can be exploited to extract the temperature at the nanoscale level.35–37 However, the molecular complexity associated with this temperature sensing is not yet fully understood, and the thermal response occurs within the physiological range of temperatures. Furthermore, this technique often induces conformational changes that are subtle and reversible.31
Luminescence thermometry (also called thermographic phosphor nanothermometry1) refers to the relationship between the temperature and the luminescence properties of the light emitted by the luminophore to achieve temperature sensing.10 The major boost for luminescence thermometry at the nanoscale is attributed to the high temperature sensitivity and the easy detection setups required for these signals. With the change of temperature, different luminescence characteristics such as the intensity of the emission, spectral position, decay and rise time, and band positions and widths, may all be modified, which gives rise to different luminescence thermometry classes.10 Luminescence thermometry provides high spatial resolution (<10 μm) in short acquisition times (<10 μs) and high thermal resolution (0.1 K).2 Additionally, luminescent thermometers can operate even in harsh conditions such as in biological fluids, strong electromagnetic fields, cryogenic temperatures and fast-moving objects, without restricting their resolutions.10,13,38,39
1.1. Luminescence nanothermometry
A sensitizer incorporated into a host lattice is capable of absorbing more efficiently the energy from the excitation source and transferring it in a very efficient way to a neighbor activator that at the end will generate luminescence.41 When exposed to a temperature, the characteristics of the luminescence of the phosphor (intensity, spectral position, decay and/or rise time, the band position and width), may change. Exploring the way in which these characteristics change, with the ultimate goal of determining the temperature of the phosphor, gives rise to luminescent thermometry. Fig. 1 depicts a general schematic illustration of the basic mechanisms of luminescence thermometry. For the sake of simplicity, a single center emission phosphor is illustrated, displaying a change in the intensity of the emissions as the temperature increases. This figure illustrates the class of band-shape luminescence thermometry, probably the widest explored class. In the figure we show how the phosphor is excited with an energy source (hν) from the ground state level (indicated as 0) to an excited state level (indicated as 3), from where, according to the principle of conservation of energy, it will decay back to an intermediate or to the ground state with the emission of light or through the release of energy via non-radiative processes.40,41 The decay could occur directly from the excited state (3) back to the ground state (0) via a radiative relaxation process, generating an emission line (labelled as “Emission 1” with intensity I1) or via a non-radiative relaxing process (shown with a golden wavy arrow) through a lower intermediate excited level (either 2 or 1). From here, the second emission line (labelled as “Emission 2” with intensity I2) can be generated when a second radiative relaxation process occurs to another lower level, or to the ground state.40 Please note that from the 2 and 1 intermediate excited states, additional emission lines can be generated, but for simplicity reasons, they are not illustrated in Fig. 1.
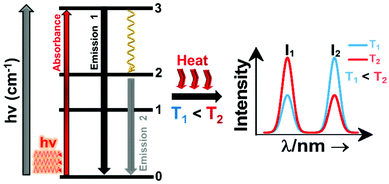 | ||
| Fig. 1 Basic working principle of luminescence nanothermometry, illustrated via the change of the intensity of the emissions with the increase of temperature, as an example. | ||
In order to be used in a luminescent nanothermometer, the generated emissions from the phosphor must fulfill several requirements. These requirements are related to the quality of the emission generated: they should exhibit high quantum yield and should be temperature-dependent.10 The generated emissions of a phosphor are related to, among other different variables, the composition of the material, the purity level and the local temperature of the system.1 Thus, the principle of luminescence nanothermometry is to exploit the relationship between the properties of the luminescence emission process and the temperature to achieve temperature sensing by temporal or spectral analysis of the emission.10 For example, in our simplified single center emission phosphor, upon increasing the temperature from T1 to T2 (presented in Fig. 1 by the red curved arrows labelled as “Heat”), this induces changes in the intensity of the emissions. Investigating the variation of the ratio of the intensities of the emissions (I1 and I2), the temperature can be determined before calibration of the luminescent thermometer.10 When the temperature changes are applied, the intensity of the emissions (and other luminescence properties as well) can vary due to the processes of electronic population or depopulation of the energy levels.1,10
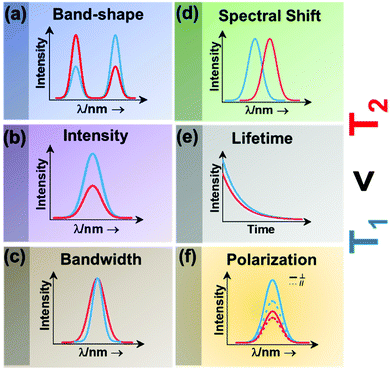 | ||
| Fig. 2 Classes of luminescence nanothermometry: (a) band-shape, (b) intensity, (c) bandwidth, (d) spectral shift, (e) lifetime and (f) polarization. | ||
Intensity luminescence nanothermometry determines temperature through the analysis of the intensity of the luminescence generated by a single emission band (Fig. 2(b)).10 With the change of temperature, as for the case of the band-shape luminescence nanothermometry class, processes like quenching and the increase in probability of non-radiative mechanisms happening will display a decrease in intensity of the luminescence that can be correlated with the temperature.45 With the change of temperature, the intensity of the emission spectrum becomes less (or more) intense due to an overall change in the number of emitted photons.42,46
Bandwidth luminescence nanothermometry extracts temperature information from the effect that the change of temperature has on the width of the emission lines of the luminescence spectrum (Fig. 2(c)).10 Generally, with an increase of the temperature, the emission lines become broader because of the thermal vibration of the luminescent center and its neighboring atoms/molecules.10 The degree of change of the emission line broadening is usually small, and as a result it can only be observed in systems showing inherent narrow emission lines and strongly temperature-dependent transitions.10
Spectral shift luminescence nanothermometry is based on the analysis of the spectral positions of the emission lines, which change due to their dependence on temperature. When the temperature increases, the energy value of the emitting level changes, manifested by a shift in the emission wavelength (Fig. 2(d)).10 This ΔE depends on a large variety of temperature-dependent parameters of the emitting material, including the refractive index and the inter-atomic distances, among others.10 The shift in the spectral position is usually related to thermally induced strains in the environment of the thermal probes, occurring as a result of electron–phonon interaction.16
Lifetime nanothermometry analyzes the temperature dependence of the luminescence lifetime (Fig. 2(e)). Luminescence lifetime studies the time interval in which the emitted intensity decays down to 1/e of its maximum value after a pulsed excitation.10 The experimental lifetime is related to the contribution of the radiative, non-radiative or multiphonon and quenching mechanisms.47 With the increase of temperature, the lifetime generally shortens due to the increase of the probability of quenching mechanisms happening. The lifetime is also related to the dimension of the material. The lifetime of nanocrystals is shorter when compared with that of macrometric particles. This difference is related to lattice distortion, and a bigger number of surface defects related to the higher surface-to-volume ratio in nanomaterials, which overall leads to an increase of the radiative rates and higher quenching rates.47
Polarization luminescence nanothermometry is based on the influence of temperature in the polarization anisotropy parameter, which is the ratio between the luminescence intensities emitted at two orthogonal polarization states (Fig. 2(f)).10
In the following sections, we will analyze how these different luminescence nanothermometry classes have been used to determine temperature using lanthanide-doped luminescent nanothermometers operating in the biological windows, with special emphasis on the different strategies developed to improve their performance. For a detailed comprehensive understanding of the six luminescence thermometry classes and the determination of their thermal sensing capacity, the reader is requested to refer to the review of Jaque et al.10 and Brites et al.48
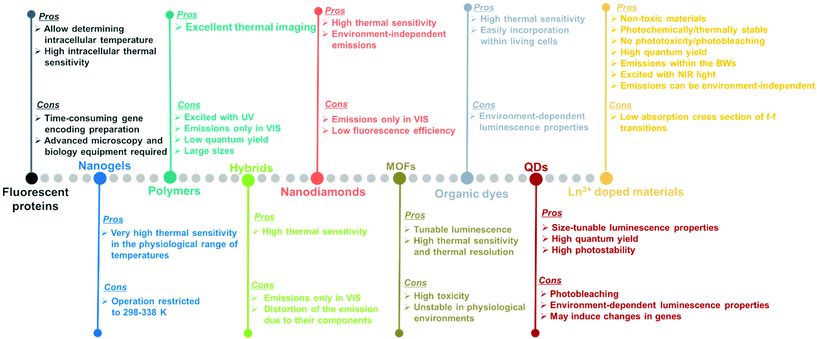
Luminescent materials tested as potential nanothermometers include fluorescent proteins,50–54 nanogels,3,55–57 polymers,58–61 organic–inorganic hybrids,43,62–64 nanodiamonds,65–67 metal organic frameworks (MOFs),39,68–71 organic dyes,72–76 semiconductor quantum-dots (QDs),77–81 and lanthanide (Ln3+) doped nanomaterials.10,21,48,82Fig. 3 highlights the pros and cons of these materials as potential luminescent nanothermometers.
Fluorescent proteins, either in their simple form or genetically encoded, can be used to measure temperature at the intracellular level.50–54 These nanothermometers can be applied to obtain thermal images of heated single cells and to study thermogenesis, a fundamental process in cell biology. Regardless of the relatively high intracellular thermal sensitivity achieved with these nanothermometers, drawbacks, including time-consuming gene encoding, the need for specialized microscopy equipment and advanced molecular biology techniques for gene modification,83,84 have prevented their future applications.
Nanogels portray nanoscale-sized three-dimensional hydrogel materials formed by crosslinked swellable polymer networks with a high capacity to hold water, without actually dissolving into the aqueous medium.85 Below a particular temperature, normally around 300 K, the structure of the nanogel swells by absorbing water into its interior, which causes a quenching of the fluorescence that is gradually recovered when the temperature increases above this temperature since the nanogel shrinks because of the release of water molecules.3,55–57 As luminescent nanothermometers, nanogel compounds present an important advantage: the most relevant changes in their fluorescence intensity occur within the physiological range of temperatures. A particular disadvantage is that the emission intensity of the nanogels becomes highly temperature sensitive only in a reduced temperature range (298–338 K).10
Polymers stands for large macromolecules composed of repeated structural units, called monomers. The presence of luminescent monomers within the polymers allows their use as luminescent thermometers.58–61 The luminescence of these compounds is usually found in the visible (VIS) range (500–600 nm) after being excited with ultraviolet (UV) light,58–61 which can induce phototoxicity if applied to extract thermal information from biological tissues.86 Despite the good results demonstrated in thermal imaging, these thermometers usually exhibit drawbacks related to their low quantum yield,87 relatively large sizes, and the dependence of the luminescence not only on temperature, but also on the local concentration of emitting centers.10
An organic–inorganic hybrid can be defined as a single particle that combines two different materials belonging to these categories.88 In the field of luminescence nanothermometry, these materials can be used by exploiting the complementary functionalities of their constituent materials to develop multifunctional platforms, such as temperature sensing and heat generation, for further applications.62–64,89 Regardless of their good temperature-sensing properties, limitations are also encountered. These limitations are related to nanothermometers being operative only in the VIS region, which represents a low penetration depth in biological tissues and a distortion of the spectra recorded due to the non-negligible absorption of the different components encountered in them.90
The application of nanodiamonds as luminescent nanothermometers is attributed to the presence of particular local point defects (nitrogen vacancy centers) in their structure.91 These nanodiamonds are fluorescent and display a very sensitive temperature transition between two ground quantum spin states.65–67 The advantages of these nanothermometers rely on their high thermal sensitivity and on the fact that nitrogen vacancy centers are inner defects, hence, in theory, making these thermometers environment-independent.91 However, when applied to biological tissues, the light generated from these materials might be affected by the biological tissue components. Furthermore, their emissions are often located in the VIS, and the low fluorescence efficiency displayed is a limiting factor especially when acquiring cellular thermal images.92
Metal organic frameworks (MOFs) have emerged as an important class of luminescent materials due to their multiple luminescent centers and tunable optical properties.39,68–71 The tunability of the optical properties of MOFs is related to the fact that the metal nodes, organic linkers, and guest molecules within porous MOFs all can potentially generate luminescence. Furthermore, the inherent porosity and large surface areas of MOFs offer great opportunities for intermolecular interactions between the frameworks and guest molecules, influencing the coordination environment and the energy transfer processes that can occur among them, thus modulating their luminescence properties.71 However, it should be admitted that, to use these luminescent thermometers in biological environments, besides high sensitivity and spatial resolution, non-toxicity and stability in the physiological environment are required, which are often lacking in MOF-based thermometers.71
Organic dyes are organic compounds with strong luminescence intensity, in general.10 Despite their high temperature-sensing properties and the ability to be easily incorporated into living cells, the spectral properties of the luminescence band depend on many factors, including temperature, solvent used, concentration, and pH, among others.10,92 Being specially dependent on the environment in which the organic dye is embedded makes it necessary to recalibrate the thermometers in each particular environment, and thus, the temperature-sensing ability will strongly depend on the medium where the compound is embedded.92
Quantum dots (QDs) are highly attractive nanomaterials for application as luminescent nanothermometers, due to their size-tunable spectroscopic properties,77–81 narrow emissions, high photostability and high quantum yields.93,94 For years, concerns regarding their phototoxicity and cytotoxicity towards biological matter due to UV light excitation,86,95 and emission wavelengths limited to the range shorter than 1000 nm, have been resolved by the preparation of core@shell structures.94,96,97 Despite this, limitations still remain concerning the variation of the luminescence parameters (intensity, lifetime and spectral shift) with the environment, including surfactants and ligands, which leads to a source of error in thermal readings,98 and their genetically-induced changes.95,97
Lanthanide (Ln3+) doped nanomaterials, due to their peculiar electronic configuration, exhibit stable and narrow emissions covering a wide range of the electromagnetic spectrum, upon proper selection of the dopants and the transparency of the host, with high emission quantum yields (>50% in the visible range).99–102 In addition, these barely non-toxic materials103 can generate their emission lines upon excitation via near infrared (NIR) light, which stands for a low-cost excitation source with no photobleaching, no autofluorescence and no phototoxicity upon biological matter.21,48 Furthermore, the generation of NIR light and its use instead of VIS or UV light allows for deep-tissue penetration,86 specifically when the wavelengths of the emissions fall within the so-called biological windows104,105 (section 1.3). A drawback of these materials relates to the low absorption cross section of the 4f–4f electronic transitions because of their forbidden nature.106 Different strategies have been implemented to increase the absorption properties of Ln3+-doped materials, including plasmonic enhancement, organic-dye sensitization, and coupling with semiconductors.107,108 Thus, inspired by these properties of Ln3+-doped luminescent nanomaterials, the rest of this review will be focused on the performance of these nanomaterials to extract information on the local temperature of a given system when the generated emissions fall in the biological window regions. Furthermore, the strategies explored to boost their ability to achieve better thermal readings will be analyzed.
1.2. Performance of a lanthanide-doped luminescent nanothermometer
Regardless of the luminescent nanothermometry class used to extract temperature information, the performance of a lanthanide-doped nanothermometer, as well as that of other thermometers based on other materials, can be evaluated and compared with other nanothermometers, based on their thermal sensitivity, temperature resolution, spatio-temporal resolution, repeatability and reproducibility. Detailed information about all these parameters is summarized elsewhere.21,48 Thus, here we will emphasize, in general terms, how these parameters can be calculated.The thermal sensitivity expresses the degree of change of the thermometric parameter (generally denoted by Δ) per degree of temperature. The thermal sensitivity can be expressed as the absolute thermal sensitivity and the relative thermal sensitivity. The absolute thermal sensitivity (Sabs) is defined as the rate of change of the thermometric parameter (Δ) with the temperature and is expressed as:109
 | (1) |
S abs is expressed in units of K−1. This parameter is strictly related to the experimental setup used and the sample characteristics; thus, its use is restricted to comparing only nanothermometers of the same nature and tested under the same conditions.
To compare the thermometric performance of different nanothermometers, independently of their nature or material employed, the relative thermal sensitivity (Srel) can be used. Srel expresses the maximum change in the thermometric parameter (Δ) for each temperature degree and it is defined as:38,42,110
 | (2) |
The temperature resolution (also defined as temperature sensitivity), δT, represents the smallest temperature change that can be resolved in a given measurement.38
Depending on the experimental detection setup used, the acquisition conditions applied, and the signal-to-noise ratio in the experiment, δT might change.38δT is measured in kelvin (K) and it is expressed as:111
 | (3) |
Another way of determining δT experimentally is by recording several consecutive emission spectra at a fixed temperature.21,112 By using the calibration curve of the nanothermometer, the range of variability of the calculated temperature is determined. Results display a gaussian distribution with a mean value and a standard deviation value, corresponding to the average temperature and uncertainty (δT) of the measurement.21,112
The spatial resolution represents the minimum distance between points presenting a temperature difference higher than δT, when the temperature is measured at different spatial positions.21 The spatial resolution (δx) is expressed as:21
 | (4) |
 is the maximum temperature gradient in the system.
The temporal resolution of the measurement (δt) is defined as the minimum time interval between measurements presenting a temperature difference higher than δT and is expressed as:48
 | (5) |
 is the maximum temperature change per unit of time.
The repeatability indicates the ability of a nanothermometer to provide the same temperature measurement under the same identical conditions,113 and is defined as:
 | (6) |
Finally, the reproducibility refers to the variations of the same measurement in different modified circumstances, including different measurement methods, different equipment in use, different observers, or measurements made over a period of time within the true level of the already measured data.114
From these performance parameters, the most reported ones are the thermal sensitivity and the temperature resolution, while the rest are scarcely used to determine the performance of a luminescent thermometer, despite their importance for the use of these thermometers in real applications.
1.3. Biological windows
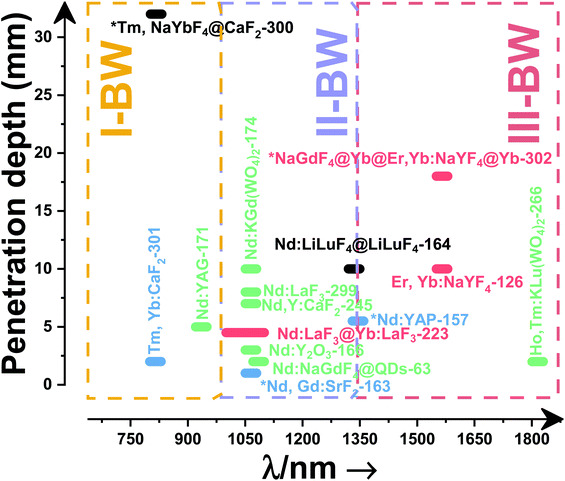
A good use of luminescent thermometers in biological tissues requires knowledge about several parameters that influence the excitation of the nanothermometers by optical means, and also the detection of the emitted light by the materials. These parameters, including the emission characteristics, the optical path length through biological tissues and the volumetric energy distribution, are linked to the absorption and scattering properties of the biological samples.115,116 The selection of these parameters should meet the overall goal of achieving a high penetration depth in real biological samples, allowing deeper thermal readings, and favoring the development of an efficient and reliable luminescent material for early detection and diagnosis of diseases. Applying NIR light instead of UV or VIS as the excitation source results in a more efficient and deeper penetration in biological tissues due to the reduced scattering and absorption of light with longer wavelengths.105 Spectral regions where both tissue absorption and scattering are minimized are known as biological windows (hereafter BWs).105 The main absorbers of light in biological tissues include water, hemoglobin, melanin and lipids, and their size, composition and morphology are responsible for the scattering of light.117 Water absorbs in the NIR region at around 980 nm and it is nearly transparent in the visible region.118 Hemoglobin (oxy-hemoglobin and deoxy-hemoglobin), from its side, is the component responsible for the absorption of visible light by blood. The highest absorbance of hemoglobin is in the visible region and it decreases above 600 nm.119 The absorbance of melanin is inversely proportional to the increase of the wavelength from the visible to the NIR.120 Regarding the absorbance of lipids in vivo, the data available in the literature are quite scarce; however as reported by Smith et al., the absorption contribution of fat components in biological tissues is less important than that of water and blood.105 Scatterers of light in biological tissues include cell nuclei, mitochondria, cell membranes and whole cells.121 Light scattering decreases exponentially as the wavelength increases from the visible to the NIR.122Within these BWs, four distinctive wavelength regions have been established (Fig. 4(a)):
• First biological window (I-BW) (650–950 nm)
• Second biological window (II-BW) (1000–1350 nm)
• Third biological window (III-BW) or short-wavelength infrared (SWIR) window (1400–2000 nm)
• Fourth biological window (IV-BW) (centered at 2200 nm)
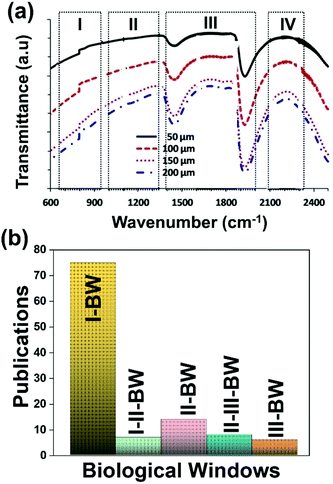 | ||
| Fig. 4 (a) Transmittance of brain tissue in biological tissues. Adapted with permission from ref. 124, Copyright 2016, Wiley-VCH Verlag GmbH & Co. KGaA. (b) Number of publications of luminescence thermometry in every biological window, including also the thermometers whose performance is evaluated by emissions lying in two different BWs simultaneously. | ||
The I-BW is limited at short wavelengths by the absorption of light by oxygenated blood and at long wavelengths by the absorption of water due to the second overtone of its stretching band, a combination of symmetric and antisymmetric stretching modes.123 This biological window encounters limitations attributed to signal interference by biological tissue autofluorescence, which produces background noise, thus limiting the maximum tissue penetration to 1–2 cm.120 This biological window is also known as the therapeutic window.124
The II-BW provides an improved signal-to-noise ratio by a factor over 100-fold by effectively filtering out autoflorescence from biological tissues.116 The limits of the II-BW lie in the short wavelength by the second overtone of the stretching band of water and at longer wavelengths by the combination of the bending and stretching (symmetric and antisymmetric) modes of water also.123
The III-BW or SWIR, despite the limitation from the absorption bands of water (stretching and bending modes),123 offers improved image contrast and higher penetration depths compared with the other BWs due to the reduction of light scattering.
The IV-BW, centered at 2200 nm, is the least explored one due to the lack of sensitive detectors operating at these wavelengths.125 The advent of new photodetectors (InSb in single or array photodiodes) and excitation laser sources (supercontinuum lasers operating in the range from 400 nm to 2500 nm) now makes the IV-BW a viable spectral domain.126 The IV-BW shows similar values of light attenuation for skin and other soft tissues comparable with that of the II-BW, lower than the III-BW but better than the I-BW.125
Fig. 4(a) shows the variation of transmittance of rat brain tissue as a function of the thickness of the biological sample, covering all four BWs.124 The maximum transmittance is located in the III-BW, regardless of the thickness. The transmittances in the II-BW and the IV-BW are close to each other and are much higher than the transmittance in the I-BW, indicating a better potential application for deep imaging.124Fig. 4(b) presents the number of publications implementing lanthanide-doped materials as luminescent thermometers operating in the different biological window regions. Apart from the main four BWs, the regions in which the luminescent nanothermometer performance has been evaluated with emissions lying partly in the I- and II-BWs (named as I–II-BW) and II- and III-BWs (named as II–III-BW) are also presented. The biological window with the highest number of publications is the I-BW, whereas the IV-BW represents, up to now, an unexplored region for luminescence thermometry. Recently, however, an increase has been observed in the number of publications regarding the II-BW and III-BW, mainly due to the benefits of better image contrast and higher penetration depths. The following sections have been structured according to the emission lines used for luminescent thermometry lying within any of these BWs, despite the fact that their excitation is provided in a spectral range lying in a different biological window.
Several reviews have been published about luminescence thermometry, and more specifically about the use of Ln3+-doped materials devoted to this practice. Precisely, Brites et al.48 published in 2019 a review on these materials, focused on strategies to enhance the thermometric performance and on cutting-edge applications of Ln3+-doped materials mainly operating in the visible region. The present review unveils key guidelines to promote the application of Ln3+-doped materials only within the BW spectral regions. We stress the mechanisms behind the generation of the emission lines within the BWs, something not analyzed in detail in the review mentioned above, and emphasize the role of the different excitation sources. We point out the different fitting models applied to evaluate the thermometric performance of Ln3+-doped luminescent thermometers. We highlight strategies towards the development of highly sensitive nanothermometers by stating the important role of the morphology of the host in which these Ln3+ ions are embedded, such as the shape of core@shell or multishell structures. We define the differences between the thermometric performances based on the combination of emissions arising from the same Ln3+ ion, different Ln3+ ions or Ln3+ ions combined with transition metal ions or quantum dots. Potential applications of these nanothermometers in the biological/biomedical field and possible applications outside of these fields are presented. Finally, we share our opinions on future challenges for luminescence nanothermometry in the BW spectral regions, and possible routes to overcome these.
2. Lanthanide-doped luminescent nanothermometers operating in the I-BW
The I-BW is the most explored biological window in relation to the performance of lanthanide-doped luminescent thermometers up to now. The most encountered lanthanide active ions are Tm3+ and Nd3+, mainly due to their emission bands in the 700–800 nm and 800–950 nm regions, respectively (Table 1). This section and the later ones will be arranged as follows: the lanthanide ion with the best thermometric performance (only the maximum value of Srel and the associated minimum value of δT will be given) will appear first. After this, single- or dual-doped materials and the excitation wavelengths associated with the luminescent thermometers will be presented, providing an overview of how these parameters influence the performance of that specific lanthanide active ion, in order to underline strategies for boosting thermometric performance.| A | S | Host | λ exc (nm) | λem (nm) | Transitions | ΔT (K) | Δ | S rel/T (% K−1)/K | δT (K) | Ref. |
|---|---|---|---|---|---|---|---|---|---|---|
| Tm3+ | Tm3+ | YAP | 1210 | 705, 800 | 3F2,3 → 3H6, 3H4 → 3H6 | 324–424 | FIR705/800 | 2.61/324 | 0.20* | 127 |
| Tm3+ | Tm3+ | NaNbO3 | 1319 | 800 | 3H4 → 3H6 | 303–453 | FIR797/807 | 0.80/303 | 0.62* | 128 |
| Tm3+ | Yb3+ | Phosphate glass | 980 | 658, 693 | 3F2 → 3H6, 1G4 → 3H5 | 303–653 | I 693/I658 | 3.9/303 | 0.13* | 130 |
| Tm3+ | Yb3+ | GdVO4@SiO2 | 980 | 700, 800 | 3F2,3 → 3H6, 3H4 → 3H6 | 298–333 | FIR700/800 | 2/303 | 0.4 | 131 |
| Tm3+ | Yb3+ | LaPO4 | 975 | 700, 800 | 3F2,3 → 3H6, 3H4 → 3H6 | 293–773 | FIR700/800 | 3/293 | 0.16* | 132 |
| Tm3+ | Yb3+ | S-LiNbO3 | 980 | 700, 800 | 3F2;3 → 3H6, 3H4 → 3H6 | 323–773 | FIR700/800 | 3/323 | 0.17* | 133 |
| Tm3+ | Yb3+ | CaWO4 | 980 | 700, 800 | 3F2,3 → 3H6, 3H4 → 3H6 | 303–753 | FIR700/800 | 2.79/303 | 0.17* | 134 |
| Tm3+ | Yb3+ | NaYF4@NaYF4@SiO2 | 980 | 697, 798 | 3F2,3 → 3H6, 3H4 → 3H6 | 298–623 | FIR697/798 | 2.58/298 | 0.18* | 135 |
| Tm3+ | Yb3+ | Bi2TiO7 | 980 | 700, 797 | 3F2,3 → 3H6, 3H4 → 3H6 | 300–505 | FIR797/700 | 2.41/300 | 0.20* | 136 |
| Tm3+ | Yb3+ | LiY9(SiO4)6O2 | 980 | 695, 789 | 3F2,3 → 3H6, 3H4 → 3H6 | 293–553 | FIR797/700 | 2.38/293 | 0.21* | 137 |
| Tm3+ | Yb3+ | Ca2Gd8(SiO4)6O2 | 980 | 700, 790 | 3F2,3 → 3H6, 3H4 → 3H6 | 293–553 | FIR700/790 | 2.36/293 | 0.21* | 138 |
| Tm3+ | Yb3+ | YPO4 | 975 | 700, 800 | 3F2,3 → 3H6, 3H4 → 3H6 | 293–773 | FIR700/800 | 2.33/293 | 0.21* | 132 |
| Tm3+ | Yb3+ | YAG | 976 | 683, 782 | 3F2,3 → 3H6, 3H4 → 3H6 | 333–733 | FIR700/800 | 2.31/333 | 0.22* | 139 |
| Tm3+ | Yb3+ | BiPO4 | 980 | 700, 804 | 3F2,3 → 3H6, 3H4 → 3H6 | 313–573 | FIR700/804 | 2.14*/425 | 0.23* | 140 |
| Tm3+ | Yb3+ | Bi2SiO5@SiO2 | 977 | 650, 700 | 1G4 → 3F4, 3F3 → 3H6 | 260–400 | FIR700/650 | 2.6/260 | 0.19* | 141 |
| Tm3+ | Yb3+ | Bi2SiO5@SiO2 | 977 | 700, 800 | 3F2,3 → 3H6, 3H4 → 3H6 | 280–800 | FIR700/800 | 2.1/280 | 0.25 | 141 |
| Tm3+ | Yb3+ | P-LiNbO3 | 980 | 700, 800 | 3F2,3 → 3H6, 3H4 → 3H6 | 323–773 | FIR700/800 | 2.04/323 | 0.25* | 133 |
| Tm3+ | Yb3+ | Sr2GdF7 | 980 | 650, 700 | 1G4 → 3F4, 3F3 → 3H6 | 293–563 | I 700/I650 | 1.97/353 | 0.25* | 142 |
| Tm3+ | Yb3+ | KLuF4 | 980 | 690, 795 | 3F2,3 → 3H6, 3H4 → 3H6 | 303–503 | FIR690/795 | 1.36*/503 | 0.37* | 143 |
| Tm3+ | Yb3+ | YOF | 980 | 801, 806 | 3H4 → 3H6 | 12–300 | Δν800.9 | 0.84/300 | 0.60* | 144 |
| Tm3+ | Yb3+ | PbF2 oxyfluoride glass | 976 | 700, 800 | 3F2,3 → 3H6, 3H4 → 3H6 | 288–498 | I 700/I800 | 0.78/448 | 0.64* | 145 |
| Tm3+ | Yb3+ | NaYbF4 | 980 | 697, 803 | 3F2,3 → 3H6, 3H4 → 3H6 | 298–778 | I 697/I803 | 0.49*/458 | 1.02* | 146 |
| Tm3+ | Yb3+ | NaGdTiO4 | 980 | 795, 798 | 3H4 → 3H6 | 100–300 | FIR795/798 | 0.36/100 | 1.38* | 147 |
| Tm3+ | Yb3+ | NaGdTiO4 | 980 | 798, 807 | 3H4 → 3H6 | 100–300 | FIR807/798 | 0.22/100 | 2.27* | 147 |
| Tm3+ | Yb3+ | NaGdTiO4 | 980 | 798, 812 | 3H4 → 3H6 | 100–300 | FIR812/798 | 0.21/100 | 2.38* | 147 |
| Tm3+ | Yb3+ | NaYF4@CaF2 | 980 | 802, 820 | 3H4 → 3H6 | 313–373 | FIR802/820 | 0.21/313 | 2.38* | 148 |
| Tm3+, Ho3+ | Yb3+ | YPO4 | 980 | 668 (Ho3+), 699 (Tm3+) | 5F5 → 5I8 (Ho3+), 3F3 → 3H6 (Tm3+) | 303–563 | I 668/I699 | 2.85/563 | 0.18* | 149 |
| Tm3+, Ho3+ | Tm3+ | KLu(WO4)2 | 808 | 696 (Tm3+), 755 (Ho3+) | 3F2,3 → 3H6 (Tm3+), 5S2,5F4 → 5I7(Ho3+) | 300–333 | I 696/I755 | 2.84/303 | 0.2 | 150 |
| Tm3+, Ho3+ | Yb3+ | Gd2(WO4)3 | 980 | 655 (Ho3+), 700 (Tm3+) | 5F5 → 5I8 (Ho3+), 3F2,3 → 3H6 (Tm3+) | 295–595 | I 700/I655 | 1.42*/415 | 0.35* | 151 |
| Tm3+, Er3+ | Yb3+ | NaLuF4 | 980 | 660 (Er3+), 695 (Tm3+) | 3F2 → 3H6 (Tm3+), 4F9/2 → 4I15/2 (Er3+) | 300–600 | I 695/I660 | 1.94/300 | 0.26* | 152 |
| Tm3+, Er3+ | Yb3+ | YF3:ceramic | 980 | 655 (Er3+), 700 (Tm3+) | 3F2,3 → 3H6 (Tm3+), 4F9/2 → 4I15/2 (Er3+) | 298–563 | I 700/I655 | 1.89/393 | 0.27* | 153 |
| Tm3+, Er3+ | Yb3+ | LuF3 | 980 | 656 (Er3+), 701 (Tm3+) | 3F2 → 3H6 (Tm3+), 4F9/2 → 4I15/2 (Er3+) | 303–543 | I 656/I701 | 0.95/363 | 0.54* | 154 |
| Nd3+ | Nd3+ | YAG | 590 | 730–770, 780–840 | 4F7/2 → 4I9/2, 4F3/2 → 4I9/2 | 77–850 | FIR730–770/780–840 | 2.98/200 | 0.17* | 155 |
| Nd3+ | Nd3+ | La2O2S | 532 | 818, 897 | 4F5/2 → 4I9/2, 4F3/2 → 4I9/2 | 270–600 | FIR818/897 | 1.95/270 | 0.26* | 156 |
| Nd3+ | Nd3+ | YAP | 532 | 820, 890 | 4F5/2 → 4I9/2, 4F3/2 → 4I9/2 | 293–611 | FIR820/890 | 1.83/293 | 0.9 | 157 |
| Nd3+ | Nd3+ | Gd2O3 | 580 | 820, 892 | 4F5/2 → 4I9/2, 4F3/2 → 4I9/2 | 288–323 | FIR820/892 | 1.75/288 | 0.14 | 158 |
| Nd3+ | Nd3+ | LaPO4 | 690 | 804, 890 | 4F5/2 → 4I9/2, 4F3/2 → 4I9/2 | 303–773 | FIR804/890 | 1.65/303 | 0.30* | 159 |
| Nd3+ | Nd3+ | Fluorotellurite glass | 514 | 815, 885 | 4F5/2 → 4I9/2, 4F3/2 → 4I9/2 | 298–600 | FIR815/885 | 1.55*/298 | 0.32* | 160 |
| Nd3+ | Nd3+ | SBN | 532 | 820, 880 | 4F5/2 → 4I9/2, 4F3/2 → 4I9/2 | 300–700 | FIR820/880 | 1.52*/300 | 0.33* | 161 |
| Nd3+ | Nd3+ | YAG | 590 | 780–840, 870–920 | 4F5/2 → 4I9/2, 4F3/2 → 4I9/2 | 77–850 | FIR780–840/870–920 | 1.02/200 | 0.49* | 155 |
| Nd3+ | Nd3+ | LiLuF4 | 808 | 862, 866 | 4F3/2 → 4I9/2 | 77–575 | I 862/I866 | 0.62/77 | 0.6 | 162 |
| Nd3+ | Nd3+ | SrF2 | 573 | 800–950 | 4F3/2 → 4I9/2 | 293–328 | FIR800–950(2)/(1) | 0.61/293 | 2.1 | 163 |
| Nd3+ | Nd3+ | LiLuF4@LiLuF4 | 793 | 883, 887 | 4F3/2 → 4I9/2 | 293–318 | I 887/I883 | 0.58/293 | 3.4 | 164 |
| Nd3+ | Nd3+ | LiLaP4O12 | 808 | 850–900 | 4F3/2 → 4I9/2 | 83–600 | Δλ850–900 | 0.47/323 | 1.05* | 165 |
| Nd3+ | Nd3+ | RbLaP4O12 | 808 | 850–900 | 4F3/2 → 4I9/2 | 83–600 | Δλ850–900 | 0.47/323 | 1.05* | 165 |
| Nd3+ | Nd3+ | KLaP4O12 | 808 | 850–900 | 4F3/2 → 4I9/2 | 83–600 | Δλ850–900 | 0.47/323 | 1.05* | 165 |
| Nd3+ | Nd3+ | NaLaP4O12 | 808 | 850–900 | 4F3/2 → 4I9/2 | 83–600 | Δλ850–900 | 0.42/323 | 1.2* | 165 |
| Nd3+ | Nd3+ | LiLaP4O12 | 808 | 850–900 | 4F3/2 → 4I9/2 | 83–600 | Δν850–900 | 0.32/323 | 1.5* | 165 |
| Nd3+ | Nd3+ | Y2O3 | 808 | 870, 920 | 4F3/2 → 4I9/2 | 298–333 | I 870/I820 | 0.31/298 | 1 | 166 |
| Nd3+ | Nd3+ | RbLaP4O12 | 808 | 850–900 | 4F3/2 → 4I9/2 | 83–600 | Δν850–900 | 0.28/323 | 1.1* | 165 |
| Nd3+ | Nd3+ | YNbO4 | 752 | 880, 890 | 4F3/2 → 4I9/2 | 303–473 | I 880/I890 | 0.28/303 | 1.1 | 167 |
| Nd3+ | Nd3+ | LaF3 | 808 | 865, 885 | 4F3/2 → 4I9/2 | 283–333 | I 865/I885 | 0.26/283 | 1.95* | 168 |
| Nd3+ | Nd3+ | NaLaP4O12 | 808 | 850–900 | 4F3/2 → 4I9/2 | 83–600 | Δν850–900 | 0.24/323 | 2.1* | 165 |
| Nd3+ | Nd3+ | KLaP4O12 | 808 | 850–900 | 4F3/2 → 4I9/2 | 83–600 | Δν850–900 | 0.20/323 | 2.5* | 165 |
| Nd3+ | Nd3+ | YVO4 | 808 | 879, 887 | 4F3/2 → 4I9/2 | 298–333 | I 879/I887 | 0.19/298 | 2.6* | 169 |
| Nd3+ | Nd3+ | Gd3Sc2Al3O12 | 806 | 936, 946 | 4F3/2 → 4I9/2 | 293–323 | FIR936/946 | 0.21/293 | 2.38* | 170 |
| Nd3+ | Nd3+ | YAG | 808 | 938,![[thin space (1/6-em)]](https://www.rsc.org/images/entities/char_2009.gif) 945 945 |
4F3/2 → 4I9/2 | 283–343 | FIR938/945 | 0.15/283 | 0.3 | 171 |
| Nd3+ | Nd3+ | BiVO4 | 750 | 872, 902 | 4F3/2 → 4I9/2 | 310–523 | FIR872/902 | 0.14/310 | 3 | 172 |
| Nd3+ | Nd3+ | NaYF4 | 830 | 863, 870 | 4F3/2 → 4I9/2 | 273–423 | FIR863/870 | 0.12/273 | 0.1 | 173 |
| Nd3+ | Nd3+ | KGd(WO4)2 | 808 | 883, 895 | 4F3/2 → 4I9/2 | 298–333 | FIR883/895 | 0.12/298 | 0.43 | 174 |
| Nd3+ | Nd3+ | NaNdF4@NaYF4@NaYF4:Nd | 808 | 857, 863 | 4F3/2 → 4I9/2 | 293–333 | FIR857/863 | 0.11/293 | 4.5* | 175 |
| Nd3+ | Nd3+ | RbLaP4O12 | 808 | 850–900 | 4F3/2 → 4I9/2 | 83–600 | FIR880(2)/(1) | 0.108/323 | 4.6* | 165 |
| Nd3+ | Nd3+ | NaLaP4O12 | 808 | 850–900 | 4F3/2 → 4I9/2 | 83–600 | FIR880(2)/(1) | 0.104/323 | 4.8* | 165 |
| Nd3+ | Nd3+ | KLaP4O12 | 808 | 850–900 | 4F3/2 → 4I9/2 | 83–600 | FIR880(2)/(1) | 0.097/323 | 5.1* | 165 |
| Nd3+ | Yb3+ | Oxyfluoride glass | 980 | 750, 863 | 4F7/2 → 4I9/24F3/2 → 4I9/2 | 303–623 | FIR750/863 | 3.27/303 | 0.15* | 176 |
| Nd3+ | Yb3+ | SrWO4 | 980 | 750, 863 | ,4F7/2 → 4I9/2, 4F3/2 → 4I9/2 | 313–453 | FIR750/863 | 3.1/313 | 0.16* | 177 |
| Nd3+ | Yb3+ | CaWO4 | 980 | 755, 872 | 4F7/2 → 4I9/2, 4F3/2 → 4I9/2 | 303–873 | FIR750/863 | 3/303 | 0.16* | 178 |
| Nd3+ | Yb3+ | Al4B2O9 | 977.7 | 800, 920 | 4F5/2 → 4I9/2 (Nd3+), 2F5/2 → 2F7/2 (Yb3+) | 298–333 | FIR800/920 | 2.6/298 | 0.19* | 179 |
| Nd3+ | Yb3+ | NaYF4 | 980 | 750, 863 | 4F7/2 → 4I9/2, 4F3/2 → 4I9/2 | 293–333 | FIR750/863 | 2.4/293 | 0.20* | 180 |
| Nd3+ | Yb3+ | Oxyfluoride glass | 980 | 750, 803 | 4F7/2 → 4I9/2, 4F5/2 → 4I9/2 | 303–623 | FIR750/863 | 2.05/303 | 0.24* | 176 |
| Nd3+ | Yb3+ | Oxyfluoride glass | 980 | 803, 863 | 4F5/2 → 4I9/2, 4F3/2 → 4I9/2 | 303–623 | FIR750/863 | 1.95/303 | 0.25* | 176 |
| Nd3+ | Yb3+ | La2O3 | 980 | 750, 803 | 4F7/2 → 4I9/2, 4F3/2 → 4I9/2 | 293–1233 | FIR750/803 | 1.6/293 | 0.1 | 181 |
| Nd3+ | Yb3+ | Al4B2O9 | 977.7 | 864, 920 | 4F5/2 → 4I9/2 (Nd3+), 2F5/2 → 2F7/2 (Yb3+) | 299–333 | FIR800/920 | 1.38/299 | 0.36* | 179 |
| Nd3+, Eu3+ | Nd3+, Eu3+ | Ba2LaF7 | 578.3 | 699 (Eu3+), 800 (Nd3+) | 5D0 → 7F4 (Eu3+), 4F3/2 → 4I9/2 (Nd3+) | 290–740 | I 699/I800 | 2.2/290 | 0.22* | 182 |
| Nd3+, Eu3+ | Nd3+, Eu3+ | YVO4 | 590 | 696 (Eu3+), 812 (Nd3+) | 5D0 → 7F4 (Eu3+), 4F3/2 → 4I9/2 (Nd3+) | 299–466 | I 696/I812 | 0.79/299 | 1.4 | 183 |
| Nd3+, Ti4+ | Nd3+, Ti4+ | YAG | 260 | 668 (Ti4+), 870 (Nd3+) | 2T2 → O2− (Ti4+), 4F3/2 → 4I9/2 (Nd3+) | 123–773 | I 668/I870 | 3.70/473 | 0.13* | 184 |
| Nd3+, Cr3+ | Nd3+, Cr3+ | YAG | 590 | 690 (Cr3+), 890 (Nd3+) | 4T1 → 4A2 (Cr3+), 4F3/2 → 4I9/2 (Nd3+) | 77–850 | I 690/I890 | 3.49/200 | 0.14* | 155 |
| Nd3+, Mn4+ | Nd3+, Mn4+ | YAG | 355 | 670 (Mn4+), 880 (Nd3+) | 2E → 4A2 (Mn4+), 4F3/2 → 4I9/2 (Nd3+) | 123–823 | I 670/I880 | 0.60/475 | 0.83* | 185 |
| Eu3+ | Eu3+ | Y2O3 | 590 | 690–715 | 5D0 → 7F4 (7F1,7F0) | 180–280 | FIR690–714/690–714 | 1.7/180 | 0.29* | 186 |
| Eu3+ | Eu3+ | Y2O3 | 611 | 690–715 | 5D0 → 7F4 (7F2,7F0) | 283–333 | FIR690–714/690–714 | 1.55/283 | 0.29* | 186 |
| Er3+ | Er3+ | SBN | 532 | 800, 850 | 2H11/2 → 4I13/2, 4S3/2 → 4I13/2, | 300–700 | FIR800/850 | 1.39*/300 | 0.36* | 161 |
| Er3+ | Er3+ | NaErF4@NaGdF4 | 1530 | 654, 806 | 4F9/2 → 4I15/2, 4I9/2 → 4I15/2 | 303–593 | I 806/I654 | 0.54/303 | 0.9* | 187 |
| Er3+ | Er3+ | NaErF4@Yb:NaYF4@Nd:NaYbF4 | 800 | 652, 670 | 4F9/2 → 4I15/2 | 305–425 | FIR652/670 | 0.22/305 | 2.2* | 188 |
| Er3+ | Er3+ | Y2O3 | 800 | 654, 660 | 4F9/2 → 4I15/2 | 200–1300 | FIR654/660 | 0.15/300 | 3.3* | 189 |
| Er3+, Mn4+ | Er3+, Mn4+ | YAP | 980 | 660 (Er3+), 714 (Mn3+) | 4I9/2 → 4I15/2 (Er3+), 2E → 4A2 (Mn4+) | 300–550 | I 714/I660 | 1.95/530 | 0.25* | 190 |
| Er3+, Ho3+ | Yb3+ | NaLuF4 | 975 | 817 (Er3+), 887 (Ho3+) | 4I9/2 → 4I15/2 (Er3+), 5I6 → 5I8 (Ho3+) | 293–568 | I 887/I817 | 1.73/293 | 0.29* | 191 |
| Er3+ | Yb3+ | YF3 | 980 | 793, 840 | 2H11/2 → 4I15/2, 4S3/2 → 4I15/2 | 293–473 | FIR793/840 | 0.98/293 | 0.51* | 192 |
| Er3+ | Yb3+ | ZrO2 | 980 | 660, 682 | 4F9/2 → 4I15/2 | 293–573 | VPR660/682 | 0.75/293 | 0.66* | 193 |
| Ho3+, Mn4+ | Yb3+ | YAP | 980 | 660 (Ho3+), 714 (Mn3+) | 5F5 → 5I8 (Ho3+), 2E → 4A2 (Mn4+) | 300–550 | I 714/I660 | 1.17/450 | 0.42* | 190 |
| Ho3+ | Yb3+ | KLu(WO4)2 | 980 | 650, 660, | 5F5 → 5I8, | 297–673 | FIR650/660 | 0.38/297 | 1 | 194 |
| Ho3+ | Yb3+ | Ba2In2O5 | 980 | 653, 661, | 5F5 → 5I8 | 303–573 | FIR653/661 | 0.19*/303 | 2.5 | 195 |
2.1. Thulium-doped luminescent thermometers operating in the I-BW
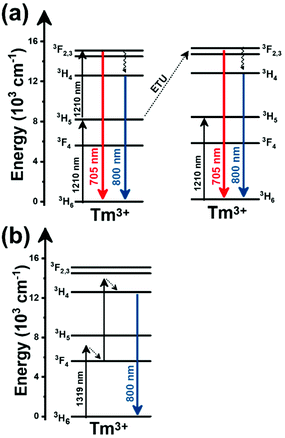
Thulium (Tm3+) ion exhibits an electronic configuration 1s2 2s2 2p6 3s2 3p6 3d10 4s2 4p6 4d10 5s2 5p6 4f12, and up to now, represents one of the most investigated active ions for luminescent nanothermometry in the I-BW due to, among others aspects, its NIR-to-NIR upconversion optical properties. Different Tm3+-doped luminescent nanothermometers have been developed including single Tm3+-doped materials, those using Tm3+ as an activator and Yb3+ as a sensitizer, and those that use Tm3+ together with another Ln3+ ion as activators in the presence or absence of Yb3+ as a sensitizer.Tm3+:YAP nanothermometers (with a grain size of 35 nm) have been developed based on the temperature dependence of the emission lines located at 705 nm and 800 nm, arising from the 3F2,3 and 3H4 TCLs decaying to the 3H6 ground state, after excitation at 1210 nm.127 These upconversion emissions can be generated either by sequential absorption of two excitation photons by a single Tm3+ ion through excited state absorption (ESA) or by the simultaneous absorption of two photons by two nearby Tm3+ ions via energy transfer upconversion (ETU) processes.127,129 The process of upconversion refers to a nonlinear optical phenomenon known as anti-Stokes emission in which the sequential absorption of two or more low-energy photons leads to a high-energy luminescence emission.129 From these two processes, the 3F2,3 excited state is populated. From this state, a radiative decay to the ground state will generate the emission line at 705 nm. A non-radiative relaxation from the 3F2,3 level to the 3H4 level, followed by a radiative decay to the ground state, generates the second emission line at 800 nm (Fig. 5(a)).127,129
For the evaluation of the thermometric performance of the Tm3+:YAP nanothermometers, the FIR between the emission lines at 705 nm and 800 nm was used in the temperature range from 324 K–424 K. The FIR is defined using the emission intensities of the of |2> → |0> (I02![[triple bond, length as m-dash]](https://www.rsc.org/images/entities/char_e002.gif) I2) and |1> → |0> (I01
I2) and |1> → |0> (I01![[triple bond, length as m-dash]](https://www.rsc.org/images/entities/char_e002.gif) I1) transitions, where |0>, |1>, |2> denote the ground state and TCLs 1 and 2,42,196 respectively, as:
I1) transitions, where |0>, |1>, |2> denote the ground state and TCLs 1 and 2,42,196 respectively, as:
 | (7) |
 | (8) |
Thus, the expression for FIR can be rewritten as:
 | (9) |
 . By applying the expression for FIR to eqn (2) and (3), the corresponding expressions for Srel and δT can be obtained as follows:21,42,196
 | (10) |
 | (11) |
Thus, considering the |2> → |0> as the electronic transition generating the emission line at 705 nm and the |1> → |0> as the electronic transition generating the emission line at 800 nm, the maximum Srel of the Tm3+:YAP nanothermometer is 2.64% K−1 at 324 K, whereas the δT was not reported by the authors.127 However, knowing the reported value of ΔE = 1926 cm−1,127 and applying an experimental setup error, which is the most commonly used in the literature,21δT can be calculated according to eqn (11), with a minimum value of 0.20 K at 324 K that increases to 0.32 K at 424 K.
Tm3+:NaNbO3 luminescent thermometer, from its side, was based on the change of the FIR of the emission peaks arising from different Stark sub-levels of the 3H4 → 3H6 transition with a broad emission band located at ∼800 nm, using in particular the emission lines located at 797 nm and 807 nm, after excitation at 1319 nm, in the temperature range 303–453 K.128 The generation of the 800 nm emission line is assigned to a multiphonon-assisted excitation from the ground state 3H6 to the 3H5 excited level, a rapid relaxation to the 3F4 level, followed by an excited-state absorption to the 3H4 level (Fig. 5(b)).
Instead of using the expression indicated above for FIR, to calculate the thermometric parameter in this case the authors propose to use the following equation:128
| R = A + B × T | (12) |
 | (13) |
This value is higher than the one that should be obtained when applying strictly the FIR model according to eqn (9) (0.25% K−1), and according to that, the δT calculated according to eqn (11) (0.62 K if the thermal sensitivity given by the authors is used, and 2 K if the thermal sensitivity according to the FIR model is used) is clearly overestimated.
Curiously, the two examples included here are based on upconversion mechanisms with excitation in the II-BW, despite the fact that the exploited emissions are in the I-BW, ensuring that both excitation and emission have a good penetration in the biological tissues. Upconversion nanomaterials offer the possibility of a relatively high thermal sensing in combination with high penetration depths and optical tunability.130
In fact, Pereira et al.128 could demonstrate that the penetration of light by exciting at 1319 nm was twice the one that could be obtained when exciting at 800 nm. Nevertheless, the excitation wavelength they used (1319 nm) induced a local heating in the environment where the Tm3+:NaNbO3 nanoparticles were used, of up to 8 K for a pump power of 350 mW, due to the fact that this wavelength is not resonant with any of the electronic levels of Tm3+. So part of the energy of the excitation source was lost in the form of heat, which the nanoparticles dispersed in the surrounding medium.128
The only conclusion that can be extracted from these two examples is that to maximize Srel, and consequently minimize the thermal resolution, the best strategy would be to maximize the separation between the emission lines used in the thermometer, but maintaining it below to 2000 cm−1 to maintain them inside the defined range of TCLs.42
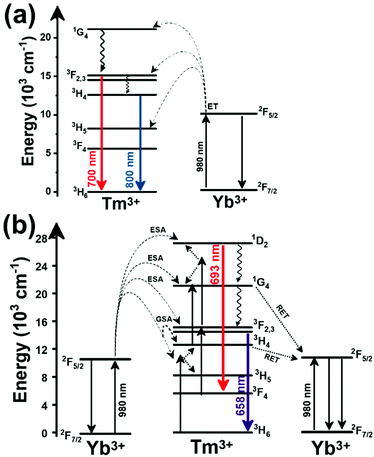
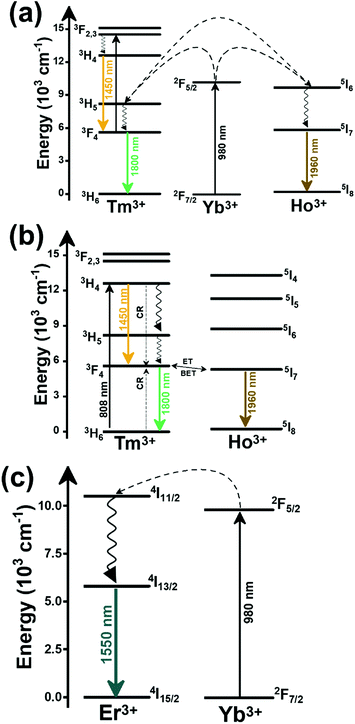
Another characteristic of the Tm3+,Yb3+-codoped luminescent thermometers operating in the I-BW is that most of them use the same emission lines to build the luminescent thermometer: the emission at around 700 nm, arising from the 3F2,3 → 3H6 transition, and the emission produced at around 800 nm, arising from the 3H4 → 3H6 transition, in both cases of Tm3+, as was shown in the first example of the previous subsection. However, in this case, due to the presence of Yb3+, the excitation and emission mechanism is different. Fig. 6(a) shows the excitation mechanism used to generate these emission lines after excitation at 980 nm. The 980 nm radiation is absorbed by Yb3+, promoting its electrons from the 2F7/2 ground state to the 2F5/2 excited state. From this excited state of Yb3+, via energy transfer (hereafter ET) processes, the excited states of Tm3+ are populated. Hence, three ET processes populate the 1G4, 2F2,3 and 3H5 levels of Tm3+. From the 1G4 level, electrons relax non-radiatively to the 3F2,3 level, from which they fall back to the 3H6 ground state level, generating the 700 nm emission. From the 3F2,3 level, a non-radiative relaxation process to the 3H4 level, followed by a radiative decay to the ground state, gives rise to the 800 nm emission.131 It should be emphasized here that other mechanisms and emission lines might be involved in this process, but we are presenting only the emission lines used to determine the thermometric performance.
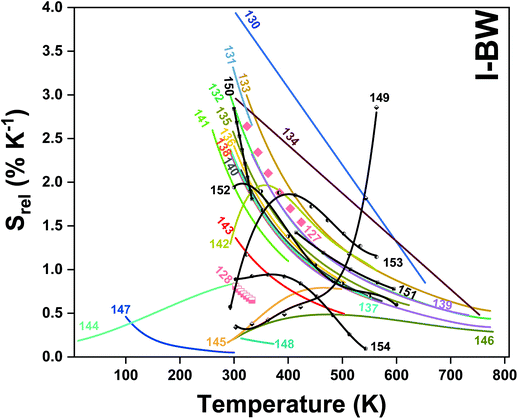
In all these cases, since the 3F2,3 and 3H4 energy levels can be considered to be thermally coupled, the FIR model was used as the thermometric parameter. However, despite the big majority of the papers analyzed defining this FIR as the ratio between the intensity of the emission at 800 nm divided by the intensity of the emission at 700 nm, following the recommendation of Wade et al. in their seminal publication,42 we encountered two recent publications (ref. 136 and 137) in which they defined it in the inverse way. Nevertheless, since eqn (10) does not take into account the way in which FIR has been defined, they could be compared with the rest of the luminescent thermometers analyzed in this section. If we analyze the maximum Srel obtained for these kinds of luminescent thermometer, it is encountered in the range between 2–3% K−1, as a result of having a ΔE between the Tm3+ 3F2,3 and the 3H4 energy levels of around 1785 cm−1. This energy difference can change slightly from host to host, due to their different crystal fields, and this would be reflected in the different Srel values reported by the authors and that are listed in Table 1. This would provide a δT of ∼0.2 K, approaching the desired limit of 0.1 K for biomedical purposes.13 The temperatures at which these values are obtained are in all cases around room temperature, and all of them became worse as the temperature increased (Fig. 7).
In some cases the FIR model was modified, compared with the equation proposed by Wade et al.,42 to account for the significant overlapping between the two emission bands used in the luminescent thermometer, adding an additional summand to the equation as:
 | (14) |
 | (15) |
It is important also to note here the large variety of materials used to host Tm3+ and Yb3+ for this kind of thermometer, including vanadates,131 phosphates,130,132,140 niobates,198 tungstates,134 fluorides,135,142,143,146,148 oxyfluorides,144,145 titanates,136,147 silicates,137,138,141 and aluminates.139
It is worth mentioning here that in some cases the inner active cores have been coated with an inactive shell. This strategy has been used in the case of GdVO4@SiO2,131 NaYF4@NaYF4@SiO2,135 Bi2SiO5@SiO2,141 and NaYF4@CaF2 nanoparticles,148 using an inert layer constituted by amorphous silica (SiO2), or cubic CaF2. The aim of coating the active core with this inert layer was to prevent the thermal degradation of the active core from potential oxidation, and at the same time prevent non-radiative relaxation processes of the active ions encountered on the surface of the nanoparticles by their interactions with the surface-bound ligands in the case of colloidal dispersions.135 Also, in the case of NaYF4@NaYF4@SiO2, an inert NaYF4 interlayer was used for further protection of the radiative properties of the active ions.135 Thus, despite the fact that it seems evident that these core@shell structures help to increase the quantum yield of the luminescent nanoparticles, no conclusion can be extracted about their thermometric performance, since none of the papers published up to now for Tm3+,Yb3+-codoped systems operating in the I-BW reported a comparison between the same material coated and not coated with the inert layer. Also, by analyzing the data provided in Table 1 for the phosphates, it seems that when the phosphate material is based on a metal of the lanthanide series (Y or La), the Srel achieved is higher than that obtained for a material based on a post-transition metal. In fact, Srel values obtained for Tm3+,Yb3+:LaPO4 (Srel = 3% K−1) and in Tm3+,Yb3+:YPO4 (Srel = 2.33% K−1) nanoparticles132 are slightly higher than the ones obtained for Tm3+,Yb3+:BiPO4 (Srel = 2.14% K−1).140 However, other factors, such as the structure, can also affect the thermometric performance of these luminescent thermometers, since LaPO4 crystallizes in the monoclinic system, YPO4 does so in the tetragonal system, and BiPO4 is a hexagonal compound.
From another side, Xing et al.133 studied the effect of using a single crystal or a polycrystal on the temperature-sensing performance of Tm3+,Yb3+:LiNbO3 (labelled as S-LiNbO3 and P-LiNbO3, respectively, in Table 1). A higher Srel was obtained for the single crystal (∼3% K−1vs. ∼2% K−1 in the polycrystal). The authors assigned these differences in Srel to the effect of the crystallinity of the material based on the degree of splitting of the upconversion emission spectra. In fact, in Fig. 8 it can be seen that the spectrum recorded for the single crystal is narrower than the spectrum recorded for the polycrystalline material, and that the spectrum of the polycrystalline material has a richer peak structure. However, the intensity of the spectrum for the single crystal is much higher than that of the polycrystalline material (Fig. 8), which could generate also a saturation in the intensity of the spectrum that might affect also the thermometric performance of the luminescent thermometer. In fact, δT and, as a consequence, Srel are greatly affected by the signal-to-noise  ratio of the emission spectra from which temperature is estimated.21,199 At lower intensity signals, the probability of having a high signal-to-noise ratio increases, hampering obtaining a good thermometric performance of the material.
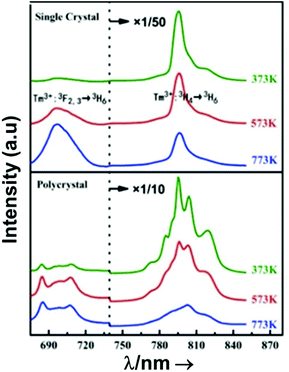 | ||
| Fig. 8 Emission spectra of Tm3+/Yb3+-codoped LiNbO3 polycrystal and single crystal at different temperatures under 980 nm excitation (1/10 and 1/50 represent the factor of division applied above the marked wavelength to visualize clear the different emission bands). Reprinted with permission from ref. 133. Copyright 2015, Elsevier. | ||
A small number of examples applied the FIR method to the thermal evolution of the intensities of different emission lines arising from Stark sublevels of the 3H4 → 3H6 transition of Tm3+, lying at around 800 nm, to develop thermometers based on Tm3+ and Yb3+-codoped materials.147,148 Since the 3H4 → 3H6 transition generates the emission band with the maximum intensity in this region with Tm3+, it is logical to use it to develop luminescent thermometers since the optical sensitivity of the detection system is less strict, allowing the use of cheaper, and even portable detectors. However, as mentioned in the previous section, the fact that ΔE in this cases is small (>300 cm−1) makes the Srel values obtained smaller (in the range 0.20–0.40% K−1) than those obtained using other strategies, which gives δT values ∼1 K. Hence, these luminescent thermometers are not competitive enough in front of the other strategies proposed.
A different example, based on the analysis of the intensity of two different emission lines, is that provided by an amorphous Yb3+ and Tm3+-codoped phosphate glass,130 and by Tm3+,Yb3+:Sr2GdF7 glass ceramics.142 In both cases, the luminescent thermometer developed was based on the intensity ratio between two emissions arising from two different energy levels of Tm3+ (1G4 and 3F2,3) that are not thermally coupled, although the population of the 3F2,3 level is potentiated as the temperature increases by the non-radiative relaxations generated from the upper excited levels, including the 1G4 level (Fig. 6(b)). In these cases, the authors used two emission bands located at ∼700 nm (generated by the 1G4 → 3H5 transition) and ∼650 nm (generated by the 3F2,3 → 3H6 transition) after excitation at 980 nm, although these two lines exhibited a very low intensity when compared with the 800 nm emission line used in the previous examples. The mechanism of generation of these emission lines is presented in Fig. 6(b). Under 980 nm excitation, Yb3+ is excited from the 2F7/2 ground state to the 2F5/2 excited state. The energy of this transition can be transferred to Tm3+, which excites its electron from the 3H6 ground state to the 3H5 excited state, which then relaxes rapidly and non-radiatively to the 3F4 level. When the energy of a second photon of 980 nm is transferred from Yb3+ to the electrons that are in this excited state, they can promote to the 3F2,3 level. From here, the radiative 3F2,3 → 3H6 transition can take place, generating the emission at 650 nm. The second emission is generated when part of the energy of the electrons lying in the 3F2,3 is dissipated non-radiatively, populating the lower 3H4 energy level. From here, the transfer of the energy of a third photon of 980 nm from Yb3+ boosts these electrons to the 1D2 level that can relax radiatively to the 3F4 level, generating the emission at 700 nm. Despite the fact that the two electronic levels from which these emissions arise are not thermally coupled, the authors fitted their intensity ratio to the FIR model, and from it they extracted a ΔE value (2493 cm−1 and 2207 cm−1 for the phosphate130 and ceramic glass142 respectively) that allowed the calculation of Srel according to eqn (13). Since the energy separation between the electronic levels involved in these emissions is of the order of 6000 cm−1, higher than the upper limit defined for TCLs, the Boltzmann model cannot be used, and instead a phenomenological model fitting the experimental data to a conventional exponential curve should be taken into account. One might think that, according to that, the Srel values they provided (3.94% K−1 and 1.97% K−1 at 303 K,130,142 respectively) should not be considered, since they are based on a wrong model. But, surprisingly, by taking the FIR equation they provided as a phenomenological equation, of the form:
 | (16) |
To end up this subsection, it is worth mentioning a totally different example, based on bandwidth thermometry instead of band-shape thermometry, as are all the luminescent thermometers reported up to now. Lu et al. synthesized rhombohedral Tm3+,Yb3+:YOF irregular nanoparticles and analyzed their temperature-sensing performance applying the bandwidth luminescence nanothermometry model to the 800 nm emission band of Tm3+, that as we said before is by far the band with the highest emission generated by Tm3+ in this region, after exciting the material at 980 nm in the temperature range from 12 to 300 K.144 The temperature variation of the full width at half maximum (FWHMs) of the emission band was fitted to a simplified exponential equation:200
| Δν = Δν0 + AeR0T | (17) |
 | (18) |
The maximum Srel obtained was 0.84% K−1 at the highest temperature analyzed.144 Despite the fact that this example, strictly speaking, could not be used for biomedical applications since the temperature range analyzed was located at lower temperatures than those used in biological media, the fact that the maximum Srel value was obtained at 300 K might suggest that it would be also useful in this temperature range. This is why we decided to include this example here.
Thus, the conclusion that can be extracted from the examples included in this subsection is that the most effective strategy to get a high Srel is using the emissions arising from two non-thermally coupled electronic levels that are apart by a distance higher than the upper limit defining the thermally coupled range of energies (2000 cm−1). Other strategies are not as effective as this one to increase Srel. However, the quantum yield of the materials and that of the emissions used has not been taken into account in any of the luminescent thermometers operating in the I-BW reported as lying in the category described here. In fact, the low intensity of the emissions considered at ∼650 nm and ∼700 nm, or the big difference of intensity existing between the two emissions located at ∼700 nm and at ∼800 nm, would imply using highly sensitive (and thus bulky and costly) detectors, or that recording one of the signals in the optimum conditions would affect the collection of the other one in terms of signal-to-noise ratio or saturation of the detector. Thus, other strategies that, a priori, have a lower Srel, like those involving different Stark sublevels of the 3H4 → 3H6 transition of Tm3+, lying at around 800 nm, might be more effective, due to the high intensity of this emission, which is the consequence of the 3H4 level of Tm3+ being electronically fed by different radiative and non-radiative mechanisms. Nevertheless, this would lead to δT of around 1 K, one order of magnitude higher than that desired for biomedical applications.
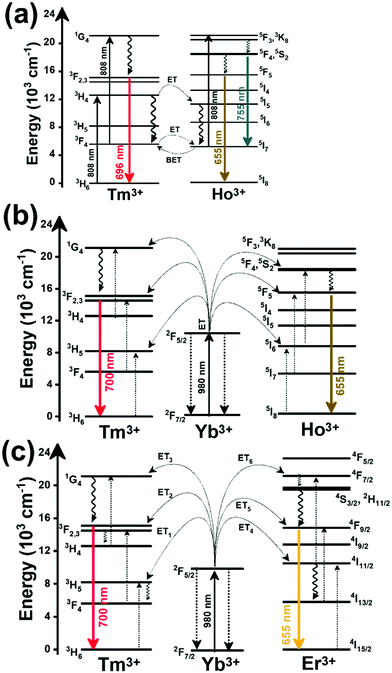
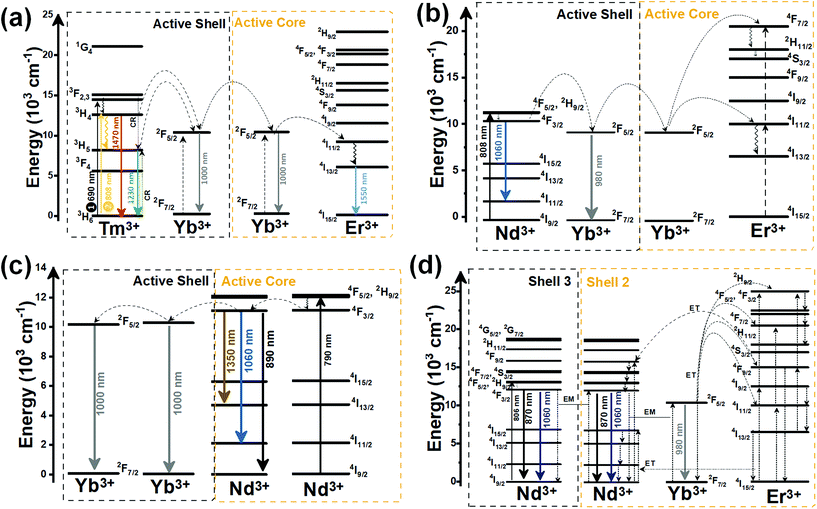
In the case of Ho3+, an important temperature-dependence of the emissions arising from the electronically linked energy levels of Ho3+ and Tm3+ has been reported, from which ET and back ET (hereafter BET) processes are possible. Despite the fact that the electronic levels of these different ions are not thermally coupled, a relationship between their intensities as the temperature changes can be established. Two different strategies have been proposed in this case. Savchuk et al. doped monoclinic potassium lutetium double tungstate KLu(WO4)2 nanoparticles with Ho3+ and Tm3+ and investigated their thermal performance in the physiological range of temperatures (303 K–333 K), after exciting the material at 808 nm.150 In this case, Tm3+ acted both as a sensitizer, by absorbing the energy of the 808 nm laser source and transferring part of the energy to Ho3+, and as an activator, generating different emission lines, among which one located at ∼700 nm attributed to the 3F2,3 → 3H6 transition. The laser radiation at 808 nm excites the Tm3+ electrons to the 3H4 level, from where they non-radiatively relax to the 3F4 level. The absorption of a second photon at 808 nm promotes the electrons from the 3F4 level to the 1G4 level, from which a non-radiative decay can take place to the 3F2,3 level, from which a radiative transition to the ground state can occur, generating the emission at 696 nm. The energy levels of Ho3+ can be populated through two different ET mechanisms: one from the Tm3+ 3H4 level to the Ho3+ 5I5 level, and a second one from the 3F4 level of Tm3+ to the 5I7 level of Ho3+, from which also a BET process to Tm3+ can take place. Besides the direct ET from Tm3+, the 5I7 level of Ho3+ can also be populated by the non-radiative relaxation from its 5I5 energy level. The ET of another photon of 808 nm from Tm3+ promotes the electrons lying in the 5I7 level of Ho3+ to the higher energy levels 3K8 and 5F3. From these levels, non-radiative decay processes populate the 5S2 and 5F4 levels of Ho3+ from which a radiative transition towards the 5I7 level can take place, generating an emission at 755 nm. A non-radiative relaxation from the 5S2 and 5F4 levels to the 5F5 level, followed by a radiative transition to the 5I8 ground state, generated an emission at 655 nm.150 The detailed mechanism for this complex system is depicted in Fig. 9(a).
The temperature-sensing capacity was estimated by the integrated intensity ratio of the 3F2,3 → 3H6 and the 5S2,5F4 → 5I7 transitions of Tm3+ and Ho3+, respectively, corresponding to the emission bands located at 696 nm and 755 nm, arising from non-thermally coupled electronic levels (NTCLs).150 Hence, the thermometric parameter (Δ) in this case was fitted to an empirical exponential growing equation of the type:150
Δ = Δ0 + B![[thin space (1/6-em)]](https://www.rsc.org/images/entities/char_2009.gif) exp(αT) exp(αT) | (19) |
Thus, the corresponding Srel was calculated by:
 | (20) |
The maximum Srel = 2.84% K−1 was achieved at 303 K. Savchuk et al., also estimated the δT of this luminescent thermometer using the equation:150
 | (21) |
The second strategy developed in Tm3+,Ho3+-codoped systems in the presence of Yb3+ as a sensitizer is that demonstrated in Tm3+,Ho3+,Yb3+:YPO4 microplates,149 and in Tm3+,Ho3+,Yb3+:Gd2(WO4)3 nanocrystals.151 In these two cases, Yb3+ acted as a sensitizer to absorb the energy of the 980 nm excitation source and transferred it to Tm3+ and Ho3+, to generate an emission line at ∼650–660 nm, corresponding to the Ho3+ 5F5 → 5I8 transition, and another one at ∼700 nm, corresponding to the Tm3+ 3F2,3 → 3H6 transition. Yb3+ absorbs the 980 nm excitation, exciting its electrons from the 2F7/2 ground state to the 2F5/2 excited state (Fig. 9(b)). Subsequently, the energy of this sensitizer is transferred to the adjacent activators Ho3+ and Tm3+, and the sensitizer is relaxed back to the ground state. Ho3+ and Tm3+ activators promote their electrons to their excited states (Tm3+ to 3H5, 3F2,3 and 1G4 levels, and Ho3+ to 5I6, 5F5 and 5S2, 5F4 levels). In addition, the excited states involved in the generation of the red emissions (3F2,3 of Tm3+ and 5F5 of Ho3+) can be populated by non-radiative processes from the higher energy excited states of the corresponding ions (1G4 of Tm3+ and 5S2, 5F4 of Ho3+).149,151 From these states, decaying back radiatively to the corresponding ground states (3F2,3 → 3H6 of Tm3+ and 5F5 → 5I8 of Ho3+) generated the emissions used for temperature sensing.
Again, these emission bands do not arise from TCLs; hence the thermometric parameter could be deduced from the intensity ratio between these bands by fitting the experimental data to a linear equation,149 or to a polynomial function:151
| Δ = X − S × T | (22) |
| Δ = C1 + B1T + B2T2 + B3T3 | (23) |
 | (24) |
| Srel = (B1 + 2B2T + 3B3T2) × 100% | (25) |
The maximum Srel = 2.86% K−1 at 563 K was obtained for Tm3+,Ho3+,Yb3+:YPO4,149 which allowed the calculation of a δT of 0.2 K. In the case of Tm3+,Ho3+,Yb3+:Gd2(WO4)3, the authors reported a substantially lower Srel of 1.43% K−1 at 595 K, due to the different phenomenological model used to fit the experimental data.149
When the two emission centers consisted of the combination of Tm3+ and Er3+, in the presence of Yb3+ as a sensitizer, the same strategy was always used: the temperature reading was achieved by the intensity ratio between the 700 nm emission line of Tm3+ attributed to the 3F2,3 → 3H6 transition, and the 655–660 nm emission line of Er3+, arising from the 4F9/2 → 4I15/2 transition.152–154
The mechanism of the generation of these emission lines is depicted in Fig. 9(c).
In short, Yb3+ acts as a sensitizer to absorb the energy of the 980 nm excitation source, and generates three ET processes towards Tm3+, populating its 3H5, 3F2,3, and 1G4 states after some non-radiative relaxation processes in some cases (Fig. 9(c)):
• Yb3+:2F5/2 + Tm3+:3H6 → Yb3+:2F7/2 + Tm3+:3H5 (ET1)
• Yb3+:2F5/2 + Tm3+:3H4 → Yb3+:2F7/2 + Tm3+:3F2,3 (ET2)
• Yb3+:2F5/2 + Tm3+:3H4 → Yb3+:2F7/2 + Tm3+:1G4 (ET3)
On the other hand, a two-step ET processes from Yb3+ to Er3+ can also occur:
• Yb3+:2F5/2 + Er3+:4I15/2 → Yb3+:2F7/2 + Er3+:4I11/2 (ET4)
• Yb3+:2F5/2 + Er3+:4I11/2 → Yb3+:2F7/2 + Er3+:4F7/2 (ET5)followed by a non-radiative relaxation to populate the Er3+ 2H11/2, 4S3/2 and 4F9/2 electronic levels.
In addition, the population of the Er3+ 4F9/2 state can be achieved through another ET process:
• Yb3+:2F5/2 + Er3+:4I13/2 → Yb3+:2F7/2 + Er3+:4F9/2 (ET6)
Finally, a last ET process between Er3+ and Tm3+ can occur, populating the 3F2,3 level of Tm3+ (not presented in Fig. 9(c) for clarity reasons):
• Er3+:4F9/2 + Tm3+:3H6 → Er3+:4I15/2 + Tm3+:3F2,3 (ET7)
Once the 3F2,3 level of Tm3+ and the 4F9/2 level of Er3+ are populated, the emissions at 700 nm and at 666–660 nm are generated arising from the electronic transitions indicated above.
This strategy was used in Tm3+,Er3+,Yb3+:YF3 nanoparticles embedded in a glass ceramic,153 and in Tm3+,Er3+,Yb3+:LuF3,154 and in oleic acid-capped Tm3+,Er3+,Yb3+:NaLuF4 nanocrystals.152 It is important to note here that due to the non-resonant energy matching between the 3F2,3 level of Tm3+ and the 4F9/2 level of Er3+, the multiphonon-assisted ET rate (KET) can be described by the Mott–Seitz model:201,202
 | (26) |
In the case of Tm3+,Er3+,Yb3+:YF3 nanoparticles embedded in a glass ceramic,153 the one exhibiting the highest Srel (1.89% K−1 at 393 K) among these examples of luminescent thermometers, the authors fitted the experimental data to a FIR model of the form of eqn (14). However, as discussed previously, since the two energy levels from which the emissions considered are not thermally coupled since they do not belong to the same Ln3+, this model should not be used, and instead a phenomenological one should be implemented, exponential in that case. In the two other cases, phenomenological models were implemented, following polynomial equations in both cases, of second order in the case of oleic acid-capped Tm3+,Er3+,Yb3+:NaLuF4 nanocrystals with the form:152
| Δ = C1 − B1T + B2T2 | (27) |
| Δ = C1 − B1T + B2T2 − B3T3 | (28) |
The Srel of these systems were obtained using eqn (2), with values of 0.76% K−1 at 500 K,152 and 0.95% K−1 at 363 K,154 respectively. The differences between Srel obtained can be attributed to the different phenomenological models implemented in each case.
In general, the strategies to develop luminescent nanothermometers analyzed in this section do not provide higher Srel than those highlighted in the previous sections for Tm3+-doped systems, although in some cases they are pretty close. However, they use emission bands with a more similar intensity than those used previously in Tm3+,Yb3+codoped systems (Fig. 10), which would facilitate recording the two emission bands with enough guarantees with the available detection systems, facilitating their practical use in biomedical applications with a δT of ∼0.2 K, closer to the ones demanded by the scientific community.
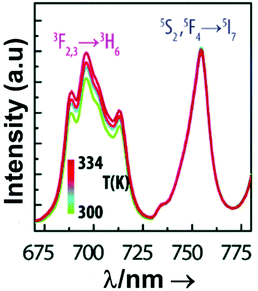 | ||
| Fig. 10 Temperature dependence of the emission spectra of Ho,Tm:KLu(WO4)2 nanocrystals, demonstrating the similar intensity between the 3F2,3 → 3H6 of Tm3+ and 5S2,5F4 → 5I7 of Ho3+. Reprinted with permission from ref. 150. Copyright 2018, The Royal Society of Chemistry. | ||
Table 1 summarizes all the information regarding Tm3+-doped luminescent nanothermometers, and Fig. 7 depicts the evolution of the Srel of every luminescent thermometer based on Tm3+ analyzed in this section operating in the I-BW in the range of temperatures studied. From this figure, it can be seen that in the majority of the cases analyzed, Srel reaches its maximum value at room temperature, and then it decreases as the temperature increases. However, there are three cases in which Srel increases in the biological range of temperatures, decreasing later, and showing maxima at around 350–400 K. These luminescent thermometers, based on Tm3+,Yb3+:Sr2GdF7,142 Tm3+,Er3+,Yb3+:YF3 nanoparticles embedded in a glass ceramics,153 and Tm3+,Er3+,Yb3+:LuF3 mesocrystals,154 would be the best options to perform luminescence thermometry for biological applications in the I-BW, particularly in the two first cases, since their maximum Srel is around 2% K−1, which might allow a δT of ∼0.2 K, and the emission bands in which they are based have a similar intensity, simplifying the detection setup.
2.2. Neodymium-doped luminescent thermometers operating in the I-BW
Nd3+-doped luminescent thermometers have attracted significant attention due to their superior luminescent yields in the NIR spectral region.158,173,203 Nd3+ ions can be excited with UV, VIS and NIR light to generate emissions in the I-BW,204–206 with potential advantages for biomedical applications, including large penetration depths, minimal background interference, and little damage to the targeted samples, especially when excited in the NIR, enhancing their application as luminescent probes for various bioapplications as NIR-to-NIR luminescent nanoprobes.207,208 Different Nd3+-doped luminescent thermometers operating in the I-BW have been designed based on three different pairs of TCLs that the electronic structure of this ion provides: 4F7/2/4F3/2 (TCL 1), 4F7/2/4F5/2 (TCL 2) and 4F5/2/4F3/2 (TCL 3). In the field of luminescent nanothermometry, Nd3+-doped materials have been frequently used as sensitive thermometers in the physiological range of temperatures. An important number of papers have been also devoted to exploring luminescent thermometers based on the transitions from different Stark sublevels of the 4F3/2 excited state to the 4I9/2 ground state. Furthermore, other recent references explore the possibilities of developing dual emitting center luminescence thermometers combining Nd3+ with other Ln3+ ions, such as Eu3+, and transition metals like Ti4+. This section will focus first on the temperature-sensing properties of single-doped Nd3+ luminescent thermometers, then on dual emitting center Nd3+/Ln3+-codoped luminescent thermometers, and will conclude with dual emitting center Nd3+/transition metal-codoped luminescent thermometers, all of them operating in the I-BW.The reported single Nd3+-doped luminescent thermometers operating in the I-BW have been excited with VIS and NIR light sources. In a typical example of exciting the Nd3+-doped particles with green light, the mechanism of the generation of the emission bands (Fig. 11(a)) is as follows: photons of the 580 nm excitation light source are absorbed by Nd3+, promoting its electrons from the 4I9/2 ground state to the 4G9/2 or 4G7/2 excited state, decaying then non-radiatively to the 4F5/2 and 4F7/2 states. From the 4F5/2 state, a radiative relaxation decaying back to the ground state generates an emission lying at 780–840 nm. The second emission band at 870–920 nm is generated after the non-radiative relaxation of the electrons from the 4F5/2 state to the 4F3/2 level, prior to a radiative relaxation to the ground state.158 A third emission band at 730–770 nm is generated when electrons relax back to the ground state from the 4F7/2 state.
Nd3+ ions were embedded in hosts such as La2O2S,156 YAP,157 Gd2O3,158 LaPO4,159 fluorotellurite glass,160 and strontium barium niobate (SBN) glass ceramic,161 for this class of luminescent thermometers. In general, the performance of these luminescent thermometers was evaluated by analyzing the intensity ratio of the emissions corresponding to the 4F5/2 → 4I9/2 and 4F3/2 → 4I9/2 transitions (TCL 3). It should be noted here that for La2O2S, the FIR model applied was that of eqn (14), in which a correction term accounting for the overlapping of the emissions was used although the emission bands were largely apart, whereas for the other cases, the classical FIR model, described by eqn (9), was applied. Nd3+-doped hexagonal La2O2S particles operated as a luminescent thermometer in the I-BW over the range of temperatures from 270 K to 600 K, exhibiting a maximum Srel of 1.95% K−1 at the lowest temperature analyzed, which is a little overestimated with respect to the other luminescent thermometers based on Nd3+ due to the fitting model used in its calibration.156 However, the big size of the particles obtained, and the temperature where this maximum value of Srel was obtained, quite often might limit the potential applications of this thermometer.13 In fact, for this thermometer, by taking into consideration the value of the experimental ΔE reported (987 cm−1),156 and the proper FIR equation (eqn (9)), the correct value of the Srel that should be considered would be 1.15% K−1 (at 293 K). In the case of the fluorotellurite glass,160 and the SBN glass ceramic,161 we calculated the values of the Srel (and δT) by considering the ΔE provided by the authors and the temperature ranges analyzed. From all these results, we can conclude that the maximum Srel of this class of luminescent thermometers would be in the range 1.15–1.83% K−1, in all cases obtained at the lowest temperature analyzed. A higher Srel was reported in Nd3+ embedded in YAG, when TCL 2 was taken into account.155 If we compare the performance of the luminescent thermometers based on TCL 2 and TCL 3, it is clear that the best temperature-sensing properties were achieved for the former one, mainly due to the higher ΔE between the electronic levels.155 Despite the higher Srel (2.95% K−1) this value was obtained at 200 K, whereas in the physiological range of temperatures, it drops down to 0.3% K−1.155 The performance of the Nd3+-doped luminescent thermometers based on considering the Stark-sublevels of the 4F3/2 → 4I9/2 transition resulted in a lower Srel (0.11–0.62% K−1) which implied a larger δT when determined using eqn (3) (>1 K), independently of the excitation source used. Nevertheless, in some cases in the bibliographic references δT was reported to be smaller, associated with better Srel values reported that are impossible to get according to the E associated with the Stark sublevels involved in the emissions used to build the luminescent thermometer, of the order of 50–270 cm−1 depending on the host in which the Nd3+ has been embedded. This energy difference, strictly speaking, does not allow for the application of the FIR model to those emission lines arising from energy levels apart by an energy difference below 200 cm−1, so several reports fit the experimental data to an exponential function of the form of that shown in eqn (16), which might also explain why in some cases better Srel values were reported.
Fig. 11(b) shows the mechanism of generation of the emission lines associated with the Stark-sublevels of the 4F3/2 → 4I9/2 transition after excitation in the NIR. In this way, the electrons in the Nd3+ 4I9/2 ground state are excited to the 4F5/2, 2H9/2 states; then they relax via a non-radiative process populating the 4F3/2 metastable state. If instead, visible light in the green range is used to excite the sample, the electrons will be excited to the more energetic 4G9/2 or 4G7/2 excited states, as shown in Fig. 11(a), but from there, they relax non-radiatively to the 4F5/2, 2H9/2 state, from which the rest of the emission mechanism is the same. The 4F3/2 metastable state may be radiatively depopulated, generating emission bands in the I-BW, assigned to the 4F3/2 → 4I9/2 transition.165 Since both levels (4F3/2 and 4I9/2) are composed of several Stark sublevels (R1 and R2 for 4F3/2, and Z1–Z5 for 4I9/2, as presented in Fig. 11(b)), a plethora of emission bands lying in the 800–950 nm spectral range (Table 1) may be generated, which can be used to define different luminescent thermometers, depending on the host considered. Note that here we focused only on the generation of the emissions lines used to build this class of luminescent thermometers, without taking into account that Nd3+ can generate other emission lines in different spectral regions, as we will see in the following sections.
The case of Nd3+:LiLuF4@LiLuF4 should be mentioned here, where instead of the thermalization of the R2 and R1 levels, the contributions to peak shift and the width change of the intensity of the emissions were considered to build the luminescent thermometers, leading to higher sensitivity values (if only the thermalization is considered with an ΔE of 55 cm−1, a maximum Srel value of 0.09% K−1 would have been achieved).164
Despite these limitations in this class of thermometer, Marciniak et al. investigated the effect of the Nd3+ concentrations and the alkali ion in the host on the thermometric performance of Nd3+-doped monoclinic tetraphosphates of the form ALaP4O12, where A = Li, K, Na and Rb.165 The authors investigated the thermometric performance of these compounds, via three different classes of luminescence nanothermometry technique: band-shape, bandwidth and spectral position.
Regarding the performance of the luminescent thermometer via the band-shape thermometry technique, the experimental data were fitted to an exponential function of the form of that shown in eqn (16). The authors observed a tendency of the intensity ratio to increase as the temperature increased for all the investigated hosts. However, at higher temperatures, an inversion of this trend could be observed for the hosts containing Li and Na, due to the drastic lowering of the intensity of one of the emissions with respect to the other, due to the excited state absorption to higher energy levels (Fig. 12(a)). This effect reduces the usable temperature range for these luminescent thermometers. The highest Srel was obtained for the LiLaP4O12 host while the lowest one was obtained for the KLaP4O12 host, while the other two, the RbLaP4O12 and NaLaP4O12 hosts, have similar values (Table 1), following a linear trend with the crystallographic b parameter of the materials, coinciding with the direction along which the (PO4)3− tetrahedral chains characteristic of these compounds run (Fig. 12(b)).165 Here, the influence of the symmetric P–O–P vibration mode, that shifts towards lower energies as the mass of the alkali ion in the host increases due to the distance between the alkali ion and the phosphorus ion, seems to play a major role. Also the concentration of Nd3+ in the hosts highly influences the Srel value due to the dependence of the energy separation between the two Stark sublevels involved in the generation of the emissions used to build the thermometer (Fig. 12(c)). With the increase of the Nd3+ concentration, the position of R2 and R1 is shifted (Fig. 12(d)), using the KLaP4O12 host as an example. This tendency, with different rates, can be noticed for each of the other hosts. The decrease of the ΔE value was stronger for RbLaP4O12 (a decrease of 24 cm−1), compared with LiLaP4O12 (15 cm−1), NaLaP4O12 (6 cm−1) and KLaP4O12 (3 cm−1) (Fig. 12(e)). Since Srel for these nanothermometers is ruled by the Boltzmann distribution, it depends on ΔE, and it is clear that a decrease of this parameter will lead to a decrease in the thermal sensitivity.
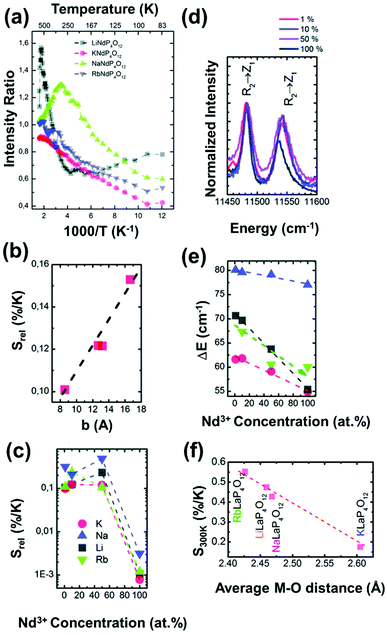 | ||
| Fig. 12 (a) Effect of the temperature on the intensity ratio of Nd3+-doped ALaP4O12 nanocrystals. (b) Variation of the relative sensitivity as a function of the cell parameter b of these compounds. (c) Change in Srel as a function of the dopant concentration. (d) Comparison of the emission band positions for the R2 → Z1 and R1 → Z1 transitions for different concentrations of Nd3+ ions in KLaP4O12. (e) Effect of the dopant concentration on the energy separation between the R1 and R2 Stark sublevels for AP4O12 nanocrystals. (f) Variation of Srel with the M–O mean distance in Nd3+-doped AP4O12 nanocrystals. Reprinted with permission from ref. 165. Copyright 2016, The Royal Society of Chemistry. | ||
Concerning spectral position thermometry, with the increase of the temperature a red-shift of the emission lines was observed for all the hosts analyzed, with RbNdP4O12 showing the strongest changes, while KNdP4O12 exhibited the smallest ones. This shift in the position of the emission lines is usually associated with the electron-phonon coupling effect that results from the introduction of random perturbations in the active-ion-surrounding environment by the host vibration modes at higher temperatures that can be thermally occupied, generating stronger electron–host interactions. This results in a decrease of the energy of the emitted phonons and thus a slight shift of the emission band towards higher wavelengths. The spectral change can be described by:165,209
| Δλ = ΔλS + ΔλD + ΔλM + ΔλR | (29) |
According to that, the change in the spectral position can be expressed as:209,210
 | (30) |
where δλ0, α, ΘD and ħΩ and represent the initial line position, the electron–host coupling parameter, the effective Debye temperature, and the phonon energy, respectively. The corresponding Srel, thus, can be calculated from the following equation:
 | (31) |
S rel follows a linear inverse trend with the average distance between the metal and the oxygen host (Fig. 12(f)).165 After these results, the general conclusion that can be drawn is that the materials exhibiting the shortest metal–oxygen distance exhibited the highest thermometric performance. This is because the electron–host coupling parameter is proportional to the average metal–oxygen distance while the electron–phonon interaction strength increases with the covalence of the bond, which increases proportionally to the shortening of the chemical bond length.209,210 These results indicate that, to further enhance the thermometric performance of luminescent thermometers based on Nd3+, host types with strong electron–host interaction parameters should be selected.
Using bandwidth luminescence nanothermometry, it was observed that the width of the emission band was broadened as the temperature increased, as a consequence of the electron–phonon interaction. To determine the thermometric performance, the bandwidth of the emission band at a particular temperature could be determined according to:211
 | (32) |
As a final remark, among the three luminescence nanothermometry classes explored to study the thermometric performance of these compounds, the spectral position luminescence nanothermometry technique displayed the best temperature-sensing properties.165 Despite this better performance, according to the authors the spectral position is much more difficult to accurately determine and requires high-resolution detection systems, which hampers the implementation of this technique to determine the temperature in real biomedical samples.165 Thus, please note that Table 1 presents only the nanomaterial with the highest Srel and the corresponding way of evaluating this performance. As can be observed from Table 1, the thermometric performance of this class of materials is still lower compared with other materials operating within this spectral region.
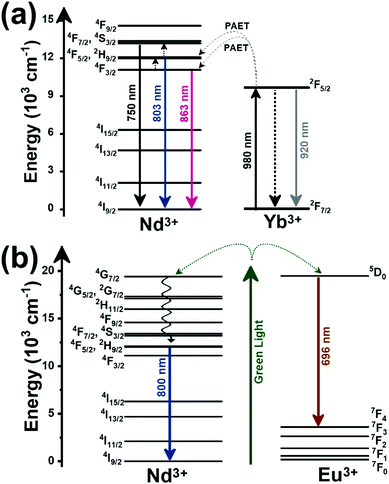 | ||
| Fig. 13 Mechanisms of generation of the emission bands of nanoparticles codoped with Nd3+ and: (a) Yb3+ after 980 nm excitation, and (b) Eu3+ after excitation in the green range. | ||
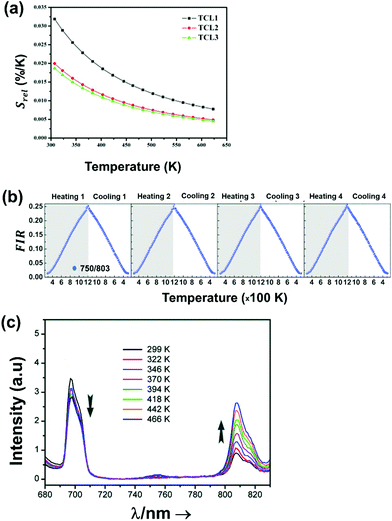 | ||
| Fig. 14 (a) Evolution of Srel as a function of the three TCLs in Nd3+,Yb3+-codoped oxyfluoride glass: TCL1 = 4F7/2/4F3/2, TCL2 = 4F7/2/4F5/2, and TCL3 = 4F5/2/4F3/2. Reprinted with permission from ref. 176. Copyright 2013, Elsevier. (b) Repeatability of the FIR 750 nm/803 nm over 4 heating and cooling cycles from 293 to 1233 K with a step of 20 K in Nd3+,Yb3+-codoped trigonal La2O3 microparticles. Adapted with permission from ref. 181. Copyright 2018, The Royal Society of Chemistry. (c) Emission spectra of Eu,Nd:YVO4 nanoparticles under excitation at 590 nm in the temperature range of 299–466 K. Adapted with permission from ref. 183. Copyright 2020, The Royal Society of Chemistry. | ||
Another interesting example here is the luminescent thermometer constituted by Nd3+,Yb3+-codoped trigonal La2O3 microparticles, in which the thermometric performance was explored in the widest temperature range among this class of thermometers, from room temperature to 1233 K.181 Here, the repeatability of the measurements was tested via four heating and cooling cycles, revealing an excellent performance (Fig. 14(b)). Also, based on these heating and cooling cycles, the authors could calculate the temperature uncertainty as:
 | (33) |
An interesting choice with these dual emitting center Nd3+,Ln3+-codoped luminescent thermometers operating in the I-BW is the choice of combining the emissions of Nd3+ with the emission of Yb3+, which besides acting as a sensitizer can also generate an emission line that can be used to measure the temperature. An example of this kind of thermometer is that of Nd3+,Yb3+:Al4B2O9 orthorhombic nanoparticles excited at 977.7 nm.179 The mechanism of the generation of the emissions is exactly the same as that described before in Fig. 13(a), including the emission generated by the 2F5/2 → 2F5/2 radiative relaxation in Yb3+. The highest Srel was obtained when calculating the 800 nm versus 920 nm intensity ratio of the emissions of Nd3+ and Yb3+, respectively (Table 1), as ΔE is larger when compared with the one between the 864 nm and 920 nm emissions.179 The results obtained from this combination are comparable to that obtained for the TCL 3 when only the Nd3+ emissions are used, but are still lower than that of the TCL 1.
Besides Nd3+/Yb3+-codoped luminescent thermometers operating in the I-BW, another choice, rarely reported, is Nd3+/Eu3+-doped materials. These luminescent thermometers are based on the emissions arising from non-thermally coupled levels (hereafter NTCLs) of Eu3+ at ∼700 nm and Nd3+ at ∼800 nm.182,183 The reason why these Nd3+/Eu3+ co-doped thermometers were proposed was to overcome the drawback of the limitation in the maximum value of the Srel that can be achieved operating with TCLs.212 Thus, the strategy of implementing emission lines generated from two different active centers was tested. The mechanism of the generation of these emission lines is depicted in Fig. 13(b). The excited energy states 5D0 of Eu3+ and 4G7/2 of Nd3+ are very close in energy; therefore they can be simultaneously excited at 590 nm. From these excited states, the electrons of Eu3+ can fall back to the 7F4 state, generating the emission located at ∼700 nm. The electrons of Nd3+, from the 4G7/2 level, followed a series of non-radiative relaxations that populate the 4F5/2 level (among others). From this level, the radiative relaxation back to the ground state generates the emission at ∼800 nm.182,183 It is worth noticing here again that we only focused on the mechanisms to generate the emissions involved in the luminescent thermometers, independently of the fact that other emission lines can be generated with these ions.
Two examples that apply this combination of Nd3+ and Eu3+ ions involve YVO4,183 and Ba2LaF7,182 as hosts. One of the interesting characteristics of these luminescent thermometers is that the emission that should be expected at around 750 nm for Nd3+, arising from the transition of the 4F7/2 level to the ground state, is very weak, compared with that observed in Nd3+/Yb3+ luminescent thermometers, so it cannot be used for luminescence thermometry in this case. Another interesting feature of this class of thermometers is that while the emission of Eu3+ changes slightly with temperature, the emission of Nd3+ is highly dependent on the temperature, and its intensity increases as the temperature increases (Fig. 14(c)). In the case of Ba2LaF7, the Srel reported was calculated using eqn (1), corresponding to Sabs, so it cannot be compared with that of other luminescent thermometers reported in the literature. From the fitting function a ΔE of 1890.8 cm−1 could be extracted,182 a value that can be used to calculate Srel using eqn (10), obtaining a value of 2.2% K−1 and a δT of 0.22 K at the lowest temperature under investigation (290 K).
From Table 1 and Fig. 15(a) and (b), it can be noted that the purpose of these Nd3+/Eu3+-codoped luminescent thermometers to achieve better thermal sensing properties than that of thermometers based on TCLs is partially achieved. The performance is better when compared with that of the Nd3+/Yb3+ luminescent thermometers operating under TCL 3, similar to TCL 2, but still lower than that of TCL 1. However, an important aspect to consider here is that Nd3+/Eu3+-codoped luminescent thermometers are excited in the green region, whereas the ones based on Nd3+/Yb3+ are excited in the NIR. Thus, a limitation for this class of luminescent thermometers is the penetration depth that can be achieved with them in biological applications.86
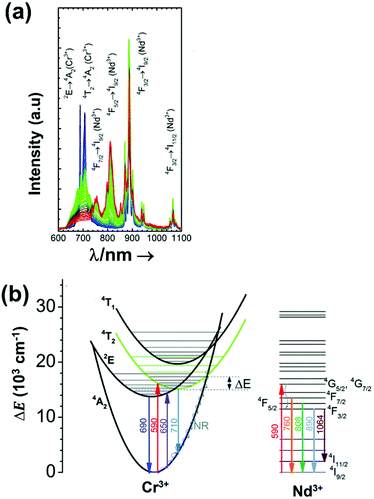 | ||
| Fig. 16 (a) Emission lines and (b) mechanisms for their generation in Nd3+,Cr3+-codoped YAG, after being excited at 590 nm. Reprinted with permission from ref. 155. Copyright 2017, the Owner Societies. | ||
Absorption of light at 590 nm allows for the excitation of electrons of Cr3+ from the 4A2 ground state to the 4T2 excited state, which was followed by nonradiative multiphonon relaxation processes leading to the population of the 2E state. Radiative relaxation from these two states led to narrow (690 nm) and broad emission bands (710 nm), assigned to the 2E → 4A2 and 4T2 → 4A2 transitions, respectively.155 In Fig. 16(b), the displacement of the position of the 4T2 state with respect to that of the 4A2 ground state is due to the distortion introduced by the crystal field, leading to the appearance of a crossing point between these parabolas.155 Through this crossing point, electrons can be transferred to the ground state via nonradiative multiphonon relaxation processes, if the thermal energy provided to the system is sufficiently high.155 Nd3+ emissions are generated after this ion absorbs the energy provided by the excitation source, promoting its electrons to the 4G5/2, 4G7/2 excited states, followed by a non-radiative relaxation to the 4F3/2 state, where either: (i) radiative relaxation to the 4I9/2 and 4I11/2 states, or (ii) thermalization of the higher energy levels 4F5/2 and 4F7/2, can occur, giving rise to emission bands in the I-BW and II-BW.155
The performance of this luminescent thermometer (and the Nd3+/Ti4+ and Nd3+/Mn4+ systems as well) was evaluated through the intensity ratio, defined as:155
 | (34) |
The temperature dependence of this intensity ratio involves 3 mechanisms:
(i) the luminescence thermal quenching with a cross-over point, where I0 Cr and ΔE1 represent the initial intensity of the Cr3+ emission bands at low temperature, and the energy difference between the bottom of the excited state parabola and the energy of the crossing point of the excited and ground state parabolas (Fig. 16(b)).
(ii) the temperature dependence of the intensity of the emission band arising from the 4F3/2 → 4I9/2 transition of Nd3+, where I0 Nd is the initial intensity of this transition, whose intensity decreased as the temperature increased due to multiphonon depopulation processes, and where ħω and p represent the maximum phonon energy of the host material and the number of phonons involved in the process, respectively.
(iii) the thermal depopulation of the 4F3/2 state towards the 4F5/2 state of Nd3+, lying ΔE2 = 1000 cm−1 above the 4F3/2 state.
S rel was calculated according to eqn (2). The temperature dependence of Srel for each Nd3+/transition metal luminescent thermometer is presented in Fig. 15(b), whereas their maxima are listed in Table 1. A maximum Srel of 3.49% K−1 was achieved for this class of luminescent thermometers, being higher than the one that can be achieved in Nd3+/Yb3+ and single-doped Nd3+ luminescent thermometers.155 In fact, this value of sensitivity is approximately 3 times higher than the thermal sensitivity that can be obtained when using the intensity ratio of TCL 2 or TCL 3 in single-doped Nd3+ in YAG. The reason behind this improvement in the thermometric performance is the efficiency of the Cr3+ → Nd3+ ET process.155 This class of luminescent thermometers, constituted by the combination of the emissions arising from Nd3+ and a transition metal, definitely exhibit higher temperature-sensing performances, especially in the case of Nd3+/Ti4+ and Nd3+/Cr3+. Thus, their potential application as temperature sensors is attractive. Despite this, as can be observed in Fig. 15(b) and in Table 1, the maximum Srel values are either achieved at lower (Nd3+/Cr3+) or higher (Nd3+/Ti4+) temperatures than those similar to those that can be achieved with Nd3+/Yb3+ luminescent thermometers (for Nd3+/Ti4+ this value is ∼3.3% K−1,184 for example). It should be emphasized as well that these systems are quite complex, and detailed studies to understand the effect of the factors that govern the temperature-sensing properties, such as the electron–phonon interaction, the crystal field strength and the physical processes responsible for temperature susceptibility, are highly needed.184 Last, these materials are excited with UV and VIS light, at wavelengths that might induce autofluorescence, phototoxicity, and limited penetration depths when applied in biological tissues.86 Thus, novel strategies to excite these materials with NIR light sources are needed.
2.3. Europium-doped luminescent thermometers operating in the I-BW
The application of Eu3+-doped materials as luminescent thermometers operating in the I-BW is based on their emissions located in the deep red region, ∼710 nm, assigned to the 5D0 → 7F4 transition. These thermometers are rarely reported in the literature (Eu3+:Y2O3).186 However, the most significant aspect of the Eu3+:Y2O3 luminescent thermometer it that it offered for the first time the possibility of predicting the calibration curve of the thermometric parameter independently of the medium in which this thermometer operates, allowing the development of a luminescent primary thermometer based on Ln3+-doped materials. Primary thermometers are systems in which the temperature can be determined based on the knowledge of thermodynamic laws and quantities.214 In general, to extract the thermometric parameter, the calibration process requires an independent measurement of the temperature through a thermocouple or an IR camera. But when this thermometer operates in different media, a new calibration procedure is required. Hence, primary thermometers guarantee a single calibration procedure that is medium-free. The thermometric parameter, Δ, in Eu3+:Y2O3 was determined by the ratio between the emission intensity of the its 5D0 → 7F4 transition, when the 5D0 state is excited through the 7F2 or the 7F0 state, in the physiological range of temperature, or through the 7F1 and 7F0 states, for lower temperatures (down to 180 K).186 Considering the physiological range of temperatures as a particular region of interest for biomedical applications, Δ is defined as: | (35) |
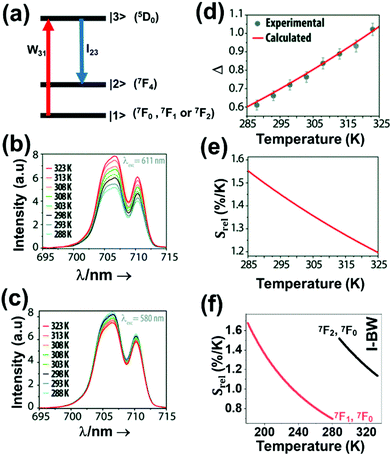 | ||
| Fig. 17 (a) Energy level diagram used for stimulating the energy levels of Eu3+ involved in the luminescent thermometer operation. Deep red emission spectra of Eu3+:Y2O3 nanocrystals excited at: (b) 611 nm, and (c) 580 nm. (d) Thermometric parameter calculated in the physiological range of temperatures. Points are the experimental values of the Δ parameter obtained from the spectra in (b) and (c) after being corrected for the respective excitation intensity, whereas the line is the calculated curve obtained from eqn (37), corresponding to the primary thermometer. (e) Relative sensitivity in the physiological range of temperatures. (b)–(e) Reprinted with permission from ref. 186. Copyright 2016, The Royal Society of Chemistry. (f) The variation of Srel of Eu3+-doped nanothermometers operating in the I-BW. The red line is computed using eqn (35) and the black line using eqn (36). | ||
Δ is determined by measuring the integrated areas under the emission curves of the 5D0 → 7F4 transition, excited resonantly through the 7F2 and the 7F0 levels, considering that the two different excitations towards the 5D0 level are the same and are dielectric in nature, and that the emitting level (5D0) and the 7F0 ground state are nondegenerate:186
 | (36) |
 | (37) |
The experimental values were in excellent agreement with those obtained from the equation defining the primary thermometer (eqn (37)) (Fig. 17(d)), displaying an error of 3%,186 and demonstrating the successful development of a Ln3+-doped material as a primary luminescent thermometer. In terms of Srel, it is in the order of 1.55% K−1 at the physiological range of temperatures (Fig. 17(e)). Higher values of thermal sensitivity (∼1.7% K−1 at 180 K) were obtained when calculating the thermometric parameter from the red emission excited through the 7F1 and 7F0 levels. Also for this case, the principles of the primary thermometer could be applied, with a maximum error of 2%.186 In that case, the thermometric parameter was defined as:
 | (38) |
If we compare the performance of this single-doped Eu3+ luminescent nanothermometer with the dual emitting center Nd3+/Eu3+ ones, based as well in the red emission of Eu3+, the latter exhibit higher Srel in the physiological range of temperatures (Table 1).
2.4. Erbium-doped luminescent thermometers operating in the I-BW
The application of erbium (Er3+) doped materials as luminescent nanothermometers operating in the I-BW is mainly assigned to the presence of the red (∼660 nm) and NIR (800 nm and 850 nm) emissions, either in single-doped materials, or in combination with other dopants, including other Ln3+ and transition metals.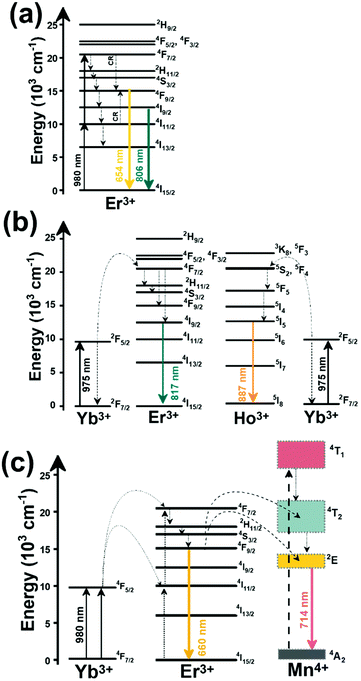 | ||
| Fig. 18 Mechanisms of generation of the emission lines located in the I-BW of: (a) Er3+, (b) Er3+/Ho3+/Yb3+, and (c) Er3+/Mn4+/Yb3+ doped materials. | ||
The operation of these luminescent thermometers is based on the temperature dependence of the electronic population of the different Stark sublevels of the 4F9/2 level, with emissions located in the red region, the intensity ratio of the emissions at ∼800 nm, or the intensity ratio between the red and NIR emissions (Table 1). Among these, the high Srel extracted from the intensity ratio of the NIR emissions represents a promising strategy.
Er3+-doped strontium barium niobate (SBN) glass ceramic was investigated as a luminescent thermometer in a wide range of temperatures (300–700 K), by studying the intensity ratio in the NIR between the 800 nm and 850 nm emissions, attributed to the 2H11/2 → 4I13/2 and 4S3/2 → 4I13/2 electronic transitions, respectively.161 The temperature dependence of this intensity ratio was fitted to the FIR equation (eqn (9)), achieving a maximum Srel and a minimum δT of 1.39% K−1 and 0.36 K, respectively, at the lowest temperature investigated. It should be noted here that the authors did not report these two parameters, but they provided an experimental value of ΔE (872.3 cm−1) between the thermally coupled 2H11/2 and 4S3/2 levels, which allowed us to determine their performance. However, the excitation wavelength (532 nm) used to activate this luminescent thermometer,161 located in the visible region, may hamper its biological/biomedical applications.
The Srel obtained from the intensity ratio between the red and NIR emissions is higher when compared with that achieved using the emissions of the Stark sublevels of the 4F9/2 level. An example of this class of luminescent thermometers is that of Er3+ incorporated within active core–inert shell NaErF4@NaGdF4 nanoparticles.187 The emissions of these nanocrystals, located at 654 nm and 806 nm, are generated from excitation either at 980 or 1530 nm.187 These two emissions arise from NTCLs, and their performance was extracted by fitting the intensity ratio with a second-order polynomial function, as presented in eqn (27).
When using emissions arising from a different Stark sublevel of the 4F9/2 level, red emissions (654 nm and 660 nm) were obtained after excitation at 800 nm. The Srel of this class of luminescent nanothermometers was up to 9 times smaller than that obtained with the two other luminescent thermometer classes described in this subsection (Table 1). The reason for that is the low ΔE between the different Stark sublevels from which the emissions arose.188,189 Moreover, the overlap of the two emission signals causes a low discriminability between the emission lines, and a large detection deviation.189 Regardless of the poor performance of this class of luminescent thermometers (Fig. 19), it is worth mentioning here the idea behind heavily concentrated core@shell@shell Tm3+:NaErF4@Yb3+:NaYF4@Nd3+:NaYbF4 nanostructures, in which Tm3+-mediated transient energy trapping coupled to Nd3+/Yb3+ cascade-sensitization is used to efficiently trigger a single-band red emission of Er3+, after careful optimization of the doping composition.188
When codoped Er3+,Yb3+ materials were investigated alone, without the addition of other ions, Srel decreased around 2 times (Table 1). Two typical examples exploring this strategy are Er3+,Yb3+: ZrO2,193 and Er3+,Yb3+:YF3 nanoparticles.192 In these cases, the temperature-sensing properties were explored by using the emissions located in the red (Er3+,Yb3+:ZrO2) and NIR (Er3+,Yb3+:YF3) spectral regions, by exciting the particles at 980 nm. Here, it is important to note that the luminescent thermometer based on Er3+,Yb3+:ZrO2 nanoparticles worked under the so-called “valley-to-peak” model (VPR).193 According to this model, and for emissions that originate from TCLs, if the emission lines are close enough, they will overlap, and as a consequence, a valley will be formed between them.193,215 As the temperature increases, the linewidth of each emission peak broadens monotonically and the intensity valley formed overlaps also.215 The VPR model is predicted to be a monotonic function of the temperature and is expressed as:193,215
| VPR = a(T−T0) + b | (39) |
 | (40) |
The temperature evolution of this Srel is presented in Fig. 19, together with that of the rest of the luminescent thermometers described in this subsection, showing a tendency to decrease as the temperature increases.
Er3+,Ho3+,Yb3+:NaLuF4 luminescent thermometers exhibit a Srel two times larger (Table 1), so that the combination of the emissions of Er3+ and those of other Ln3+, in the presence of Yb3+ as a sensitizer, is a promising strategy for luminescence thermometry.
An additional strategy towards better temperature-sensing properties is that of codoping materials with Er3+ and transition metals, such as Mn4+. Manganese ions generally display red to NIR luminescence assigned to the spin-forbidden 2E → 4A2 transition under excitation with UV or blue light, owing to their high effective positive charge and the influence of a strong local crystal-field.216,217 Upon proper modification of the crystal-field environment, the spectral position of these ions can be tuned from 620 nm to 723 nm.218,219 Hence, since the luminescence of transition metals is highly influence by the medium in which they are embedded, and often it drastically reduces, this makes them highly desirable in luminescence nanothermometry, in combination with Ln3+, in which the latter acts as a reference probe.165,184,185,190
In comparison with the case of materials codoped with Nd3+ and transition metal materials, in which the excitation source was UV or VIS light (section 2.2.3), here, the incorporation of Yb3+ as a sensitizer has allowed for excitation in the NIR, overcoming the problems related to the phototoxicity and limited penetration depth exhibited by UV and VIS light.
Triply doped Er3+,Mn4+,Yb3+:YAP nanocrystals were investigated as luminescent temperature sensors operating in the I-BW over the temperature range 300–550 K.190 They worked with the intensity ratio of the emissions arising from NTCLs located at 714 nm and 660 nm, corresponding to the 2E → 4A2 and 4F9/2 → 4I15/2 electronic transitions of Mn4+ and Er3+, respectively. The generation of these emission bands is presented in Fig. 18(c). Yb3+ absorbs the energy of the 980 nm excitation source, and via two photon-assisted processes, the excited energy levels (4F7/2 and 4I11/2) of Er3+ are populated. Through a non-radiative decay process, the 4F9/2 state is populated, which when relaxing back to the 4I15/2 ground state generates the red emission at 660 nm. Via two ET processes, from the 4F7/2 and 4F9/2 levels of Er3+, the 4T2 and 2E levels of Mn4+ are populated. The 2E energy level can relax back to the 4A2 ground state, generating the emission centered at 714 nm.190
To calculate the dependence of the intensity ratio with the temperature and the thermometric performance the same model as in the case of materials codoped with Nd3+ and transition metals (eqn (34)) was applied. The maximum Srel obtained was 1.95% K−1 at 530 K.190 Despite the relatively high thermal sensitivity reported, this value was obtained at a higher temperature than those used in the physiological range, for which Srel reduces substantially.190 The overall temperature dependence of Srel of this material is depicted in Fig. 19, together with those of all the other Er3+-doped luminescent thermometers operating in the I-BW.
To conclude with the section of Er3+-doped luminescent thermometers operating in the I-BW, it should be said that the most promising strategy identified for improving their thermometric performance involves dual emitting center nanoparticles, either with other Ln3+ or with transition metals. Concerning the use of red or NIR emissions, the better choice is using NIR emissions, not only because of the better performance, but also because deeper penetration depths can be achieved.
2.5. Holmium-doped luminescent thermometers operating in the I-BW
Luminescent temperature sensors based only on holmium (Ho3+) as an activator operating in the I-BW are very rare in the literature. The reason for that is because mainly Ho3+ is used together with Tm3+ for luminescence thermometry purposes exhibiting high relative thermal sensitivities in the I-BW (section 2.1.3) and in the III-BW (section 6.1).The examples encountered involving Ho3+ as the main emitting ion incorporate Yb3+ as a sensitizer to enhance the red emission of Ho3+, lying at around 660 nm and attributed to the 5F5 → 5I8 electronic transition of this ion. Monoclinic Ho3+,Yb3+:KLu(WO4)2 nanocrystals,194 and tetragonal Ba2In2O5 particles,195 have been investigated as luminescent thermometers operating in the I-BW. The red emissions, located at ∼650 nm and ∼660 nm, were generated after exciting these at 980 nm. By means of ground state absorption (GSA), Yb3+ absorbs the radiation from the excitation source, exciting its electrons from the 2F7/2 ground state to the 2F5/2 excited state. Via two ET processes, the electrons of Ho3+ are promoted to the 5I6 and 5S2, 5F4 energy levels. A nonradiative relaxation process from the 5S2, 5F4 energy levels populates the 5F5 level, from which a radiative process generates the red emissions with two main peaks centered at ∼650 nm and ∼660 nm (Fig. 20(a)). A second path to explain the electronic population of the 5F5 energy level can also be postulated from a nonradiative process after the first ET transfer process from Yb3+, populating the 5I7 energy level of the Ho3+ ion. The second ET from Yb3+ promotes these electrons directly to the 5F5 energy level of Ho3+.194 These luminescent thermometers operate with emissions generated by TCLs. Nevertheless, for the case of Ho3+,Yb3+:KLu(WO4)2 nanocrystals, the authors take into consideration the overlapping factor for the emission peaks, such as the case of red emissions of Ho3+.194 Hence, in that case, eqn (14) was used to fit the experimental data of the thermometric parameter, whereas for the case of Ho3+,Yb3+:Ba2In2O5 particles, the simple form of the FIR model (eqn (9)) was applied, which may lead to an underestimation of the performance of the luminescent thermometer. In fact, the Srel of Ho3+,Yb3+:KLu(WO4)2 nanoparticles is approximately four times higher than that of Ho3+,Yb3+:Ba2In2O5 particles (Table 1 and Fig. 20(b)). Nevertheless, the performance of Ho3+,Yb3+:KLu(WO4)2 nanoparticles is lower (∼3 times) compared with that of Ho3+,Mn4+,Yb3+:YAP nanoparticles,190 (Fig. 20(b)). The red emission of Ho3+ was combined with the 714 nm emission arising from Mn4+, generated after NIR excitation ensured by the presence of Yb3+. However, in the physiological range of temperatures, the Srel of this material does not differ much from that of Ho3+,Yb3+:KLu(WO4)2 nanoparticles.
3. Lanthanide-doped luminescent nanothermometers operating in the I- and II-BW simultaneously
The emissions of Ln3+ ions, upon proper excitation, could be located in a wide range of the electromagnetic spectrum. Besides lying in each of the four biological window regions, the emissions of Ln3+ ions used for thermometry can also be found in two different BWs. Hence, here, we focus our attention on the luminescent thermometers that use emissions which are placed in the I-BW and the II-BW. Although the number of publications that report luminescent thermometers working in this mixed region is reduced, the most representative examples are those of Nd3+-doped materials due to the emissions located at 850 nm and 1050 nm, covering simultaneously the I- and the II-BWs.3.1. Nd3+-doped luminescent thermometers operating in the I-BW and II-BW region simultaneously
Nd3+-doped materials operating in the I- and II-BWs simultaneously can be classified in single emitting Nd3+-doped luminescent thermometers, dual emitting center luminescent thermometers in combination with other Ln3+, and dual emitting center luminescent thermometers in combination with transition metals. Alkali earth fluorides such as CaF2,220 and SrF2,163 have been studied as hosts for single emitting Nd3+ luminescent thermometers, due to their low phonon energies that reduce the probability of non-radiative relaxing processes happening, favoring in this way the luminescence efficiency.221 They are also biocompatible, and nanoparticles of these materials with sizes below 10 nm can be produced, which makes them attractive for biomedical applications.163,220 These water-dispersible nanocrystals were prepared by hydrothermal synthesis,222 in which Gd3+ was introduced to enhance the emissions of Nd3+.163,220 Upon excitation at 573 nm, these nanocrystals generate emissions at ∼850 nm (I-BW) and ∼1050 nm (II-BW), attributed to the 4F3/2 → 4I9/2 and 4F3/2 → 4I11/2 transitions of Nd3+, respectively.163,220Upon excitation at this wavelength, the 4G5/2, 4G7/2 energy levels of Nd3+ are populated. Then, a non-radiative decay process takes place populating the 4F3/2 state. From this energy level, a radiative decay to the 4I11/2 level generates the emission located in the II-BW (Fig. 21(a)). Concerning the emission in the I-BW, from the lower lying Stark sublevels of the 4F3/2 level (R1 in Fig. 21(a)), a radiative decay to the lower lying Stark sublevel of the 4I9/2 ground state (Z1 in Fig. 21(a)) generates this emission
The thermometric parameter for these luminescent thermometers was a FIR between the 1050 nm and 850 nm emissions in the physiological range of temperatures, using eqn (9). The results, summarized in Table 2, show that the highest Srel was obtained for Nd3+:SrF2 nanoparticles with a value of 0.50% K−1 and δT of 1.2 K at room temperature.163 The different thermometric performance of SrF2 and CaF2 can be due to the lower phonon energy of SrF2 (366 cm−1) compared with CaF2 (466 cm−1).230 Thus, it seems that materials with low phonon energies maximize Srel. Nevertheless, it should be taken into consideration that the excitation wavelength used to activate these luminescent thermometers is not located in the BW spectral regions; instead it is located in the VIS, for which the absorption and scattering in the biological tissues is high, resulting in a limited penetration depth, not allowing for deep-tissue imaging.86 Hence, this limitation should be surpassed by using other ions that are able to absorb excitation sources located within the BWs spectral regions.
| A | S | Host | λ exc (nm) | λem (nm) | Transitions | ΔT (K) | Δ | S rel/T (% K−1)/K | δT (K) | Ref. |
|---|---|---|---|---|---|---|---|---|---|---|
| Nd3+ | Nd3+ | Gd3+:SrF2 | 573 | 950, 1150 | 4F3/2 → 4I9/2, 4F3/2 → 4I11/2 | 293–338 | FIR950/1150 | 0.50/293 | 1.2 | 163 |
| Nd3+ | Nd3+ | Gd3+:CaF2 | 573 | 867, 1058 | 4F3/2 → 4I9/2, 4F3/2 → 4I11/2 | 294–338 | FIR1058/867 | 0.12/294 | 1.85 | 220 |
| Nd3+, Yb3+ | Nd3+ | Nd:LaF3@Yb:LaF3 | 790 | 890 (Nd3+), 1060 (Yb3+) | 2F5/2 → 2F7/2 (Yb3+), 4F3/2 → 4I13/2 (Nd3+) | 283–323 | I 890/I1060 | 0.41/283 | 1.2* | 223 |
| Nd3+, Yb3+ | Nd3+ | Yb:LaF3@Nd:LaF3 | 790 | 890 (Nd3+), 1060 (Yb3+) | 2F5/2 → 2F7/2 (Yb3+), 4F3/2 → 4I13/2 (Nd3+) | 283–323 | I 890/I1060 | 0.36/283 | 1.4* | 223 |
| Nd3+, Yb3+ | Nd3+ | LiLaP4O12 | 808 | 870 (Nd3+), 1000 (Yb3+) | 4F3/2 → 4I9/2, (Nd3+), 2F5/2 → 2F7/2 (Yb3+) | 93–663 | I 870/I1000 | 0.3/330 | 1.6* | 201 |
| Nd3+, Yb3+ | Nd3+ | Nd,Yb:LaF3 | 790 | 890 (Nd3+), 1060 (Yb3+) | 2F5/2 → 2F7/2 (Yb3+), 4F3/2 → 4I13/2 (Nd3+) | 283–323 | I 1300/I1000 | 0.1/283 | 5* | 223 |
| Nd3+, Cr3+ | Nd3+, Cr3+ | LiLaP4O12 | 665 | 810 (Cr3+), 1048 (Nd3+) | 4T2 → 4A2 (Cr3+), 4F3/2 → 4I11/2 (Nd3+) | 293–323 | I 810/I1048 | 4.89/323 | 0.10* | 224 |
| Er3+, Yb3+ | Yb3+ | NaYF4@SiO2 | 975 | 810 (Er3+), 1010 (Yb3+) | 4I9/2 → 4I15/2 (Er3+), 2F5/2 → 2F7/2 (Yb3+) | 299–337 | I 1010/I810 | 1.64/337 | 0.76 | 225 |
| Yb3+ | Yb3+ | NaGdF4 | 808 | 1012 | 2F5/2 → 2F7/2 | 303–343 | τ 1012 | 1.59/343 | 0.31* | 226 |
| Yb3+ | Nd3+ | NaYF4@Y@CaF2 | 800 | 980 | 2F5/2 → 2F7/2 | 283–337 | τ 980 | 1.4/283 | 0.36* | 227 |
| Yb3+ | Yb3+ | Bi7F11O5 | 808 | 1030 | 2F5/2 → 2F7/2 | 323–573 | τ 1012 | 0.24/323 | 2.1* | 228 |
| Yb3+, Cr3+ | Yb3+, Cr3+ | LiLaP4O12 | 665 + 920 | 820 (Cr3+), 975 (Yb3+) | 4T2 → 4A2 (Cr3+), 2F5/2 → 2F7/2 (Yb3+) | 100–475 | I 820/I975 | 1.2/333 | 0.42* | 229 |
| Yb3+, Cr3+ | Yb3+, Cr3+ | LiLaP4O12 | 665 | 820 (Cr3+), 975 (Yb3+) | 4T2 → 4A2 (Cr3+), 2F5/2 → 2F7/2 (Yb3+) | 100–475 | I 820/I975 | 0.32/333 | 1.6 | 229 |
An interesting alternative, was proposed by Marciniak et al. through the preparation of dual emitting center luminescent thermometer-based Nd3+,Yb3+:LiLaP4O12 nanoparticles, in which, under 808 nm NIR excitation, Nd3+ acts both as a sensitizer and an activator, while Yb3+ acts only as an activator.201 The reason for this selection is because the Nd3+ absorption cross section at 800 nm is higher than that of Yb3+ at 980 nm, and the water absorption at 800 nm is around 25 times lower than that at 980 nm, overcoming in this way also the overheating problems displayed by the 980 nm excitation.201 Upon 808 nm excitation, Nd3+ absorbs this energy and excites its electrons from the 4I9/2 ground state to the 4F5/2 excited state. Via a non-radiative process, the 4F3/2 state is populated. From this state, two radiative processes towards the 4I9/2 and 4I11/2 levels generate the Nd3+ emissions at 870 nm and 1060 nm, respectively (Fig. 21(b)). From the 4F3/2 state of Nd3+, an ET process with WET probability can populate the 2F5/2 state of Yb3+. A radiative decay from this state, back to the 2F7/2 ground state, allows for the generation of the 1000 nm emission band of Yb3+.201 The thermometric parameter of these nanocrystals was defined as the intensity ratio between the emissions at 870 nm (Nd3+) and 1000 nm (Yb3+) as function of the temperature over the range 93–663 K, and as a function of the concentration of Yb3+ ions (Fig. 21(a)). The thermometric performance of these nanocrystals is influenced by three processes: (i) with the increase of temperature, the electronic population of the Stark sublevels of the 2F5/2 manifold of Yb3+ increases gradually, leading to a BET process, with probability WBET, towards the 4F3/2 state of Nd3+ (Fig. 21(b)); (ii) by increasing the concentration of Yb3+, the average distance between these ions decreases, and consequently, the energy diffusion between Nd3+ and Yb3+ ions, with probability WD, and among Yb3+ ions (WYb) increases; and (iii) the energy difference between the 4F3/2 state of Nd3+ and the 2F5/2 level of Yb3+, that controls the ET processes, with probability WET, is affected by the changes of temperature and the concentration of Yb3+.201 Hence, the intensity ratio between these two nonresonant energy matching ions, extracted from the phonon-assisted model of ET described by Miyakawa and Dexter,231 was correlated to these processes by the following equation:201
 | (41) |
From eqn (41) it can be deduced that as the doping concentration of Yb3+ increases, the effectiveness of the energy diffusion among the Yb3+ network gradually increases, while the impact of the BET process towards Nd3+ decreases, leading to changes in Δ. The highest Srel was obtained for the highest concentration of Yb3+ (Fig. 22(a)), probably because the decrease in the average distance among the Nd3+–Yb3+ ions facilitated energy diffusion.201 The Srel of these luminescence thermometers is, however, very low, with a maximum of 0.3% K−1 in the physiological range of temperatures (the full variation of the Srel in the interval of temperatures analyzed is presented in Fig. 22(b)).
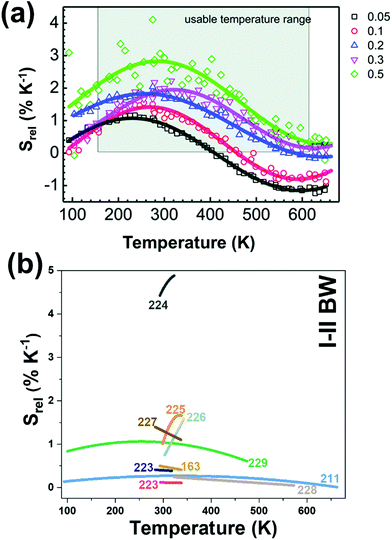 | ||
| Fig. 22 (a) Srel of Nd3+- and Yb3+-doped LiLaP4O12 as a function of Yb3+ concentration. Reprinted with permission from ref. 201. Copyright 2015, the Owner Societies. (b) Temperature dependence of Srel of lanthanide-doped luminescent thermometers operating in the I-BW and II-BWs, simultaneously. The numbers indicate the corresponding references for each thermometer. | ||
The same strategy was followed for the case of two different active core@active shell nanostructures, one having the core doped with Nd3+ and the shell with Yb3+ (Nd3+:LaF3@Yb3+:LaF3), and the other constituted by a Yb3+-doped core and a Nd3+-doped shell (Yb3+:LaF3@Nd3+:LaF3).223 The performance of these two different core@shell structures was also compared with the corresponding nanoparticles containing the two ions in the same layer, revealing a four-fold enhancement of Srel. In addition, the core@shell nanocrystals displayed an enhanced emission intensity, attributed to the reduction of intensity when the doping ions are located in the same layer due to self-quenching effects originating from non-radiative mechanisms such as cross-relaxation, energy migration, and energy-trap processes occurring between the emitting ions and the OH− radicals present at the surface of the nanoparticles.223 These types of material, however, are more interesting for the emissions generated by Nd3+ in the II-BW (1060 nm and 1350 nm); hence they will be mentioned again in section 4.2.
When combining the emissions arising from Nd3+ and those of a transition metal, such as Cr3+, a substantial increase on Srel is observed (Table 2). In that case, the emission of Nd3+ located at ∼1050 nm in the II-BW was combined with the emission at 810 nm of Cr3+ in the I-BW, both ions being embedded in LiLaP4O12.224 These emission bands were generated after exciting the nanoparticles at 655 nm, in the lower limit of the I-BW that allows the excitation of Cr3+ and Nd3+ at the same time. To describe the generation of the emission band of Cr3+, a low crystal field assumption for the low-symmetry host used was applied by the authors. Electrons of Cr3+ are excited after illumination with the 655 nm light from the 4A2 fundamental state to the 4T2 excited state (Fig. 21(c)).
When relaxing back to the 4A2 state, the broad emission line centered at ∼810 nm is generated. When the temperature increases, the electronic population of the higher vibrational levels of the 4T2 state also increases, and the Cr3+ emission can be quenched via non-radiative processes as soon as the thermally excited electrons reach the crossing point between the 4T2 and 4A1 energy level parabolas (Fig. 21(c)).232 At the same time, the electrons of Nd3+ are pumped from the 4I9/2 ground state to the 2H11/2 excited state. Then, a non-radiative relaxation to the 4F3/2 state happens, from which the 880 nm (4F3/2 → 4F9/2) and the ∼1050 nm (4F3/2 → 4I11/2) emissions are produced.224 The intensity of the emission of Nd3+ is barely influenced by temperature, so it can be used as a reference probe. A maximum Srel of 4.89% K−1 at 323 K (Fig. 22(b) was obtained in this case.
In Nd3+,Cr3+-doped LiLaP4O12 nanoparticles, as the size of the nanocrystals decreases, the intensity of the emissions decreases (∼0.81% nm−1, Fig. 23(a)), the emission band position blue-shifts (∼0.066 nm grain size−1), the temperature-sensing region narrows (from 300 to 600 K for particles with a size of 240 nm to 300–420 K for particles with a size of 20 nm), Srel increases from 1% K−1 to 5% K−1 (Fig. 23(b)), and δT drops down to 0.03 K (Fig. 23(c)).232 The reason for that is that with the decrease of the size of the nanoparticles, non-radiative depopulation processes become more important, being the main processes responsible for the decreasing of the intensity of the emissions. Furthermore, this leads to a faster decrease in the intensity ratio used in the luminescent thermometer, which allows a higher Srel and a lower δT to be obtained.232
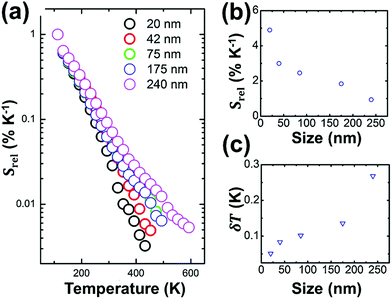 | ||
| Fig. 23 The effect of the size of Nd3+,Cr3+:LiLaP4O12 nanoparticles on: (a) the intensity ratio between the emissions lines of Cr3+ and Nd3+ at 810 nm and 1048 nm, respectively, (b) Srel, and (c) δT. Reprinted with permission from ref. 232. Copyright 2016, Elsevier. | ||
3.2. Yb3+-doped luminescent thermometers operating in the I- and II-BWs simultaneously
Another example of luminescent thermometers operating simultaneously in the I- and II-BWs is that of Yb3+-doped materials, based on the ∼1000 nm emission of this ion, combined with other emissions arising from other Ln3+ or transition metal ions.Only a few publications explored the case of dual emitting center luminescent thermometers consisting of Yb3+ with another Ln3+ (such as Er3+) or a transition metal ion (such as Cr3+). For the Yb3+/Er3+-coemitting material, the host was an active core of hexagonal NaYF4 nanorods coated with an amorphous silica shell, synthesized by a hydrothermal method.225 Under excitation at 975 nm, Yb3+ acts as a sensitizer, besides the role of activator, absorbing the energy of the excitation source and transferring this energy to Er3+ (Fig. 24(a)). By these ET processes, the 4F7/2 state of Er3+ can be populated, from which a non-radiative decay can take place that populates the 4F9/2 and 4I9/2 energy levels of Er3+. From there, by relaxing back to the 4I15/2 ground state, the red emission at 660 nm and the NIR emission located at 810 nm are generated, respectively.225 The 1010 nm emission of Yb3+ is generated by simply relaxing back the electrons to the 2F7/2 ground state from the 2F5/2 excited energy level. The thermometric performance of this material was extracted by studying the temperature dependence of the 1010 nm/810 nm and 1010 nm/660 nm intensity ratios, both modelled according to a second-order polynomial fitting equation, as expected for a luminescent thermometer based on NTCLs (eqn (27)). The results reveal that the 1010 nm/810 nm intensity ratio allows a Srel two times higher than the 1010 nm/660 nm intensity ratio to be obtained.225 The maximum Srel was 1.64% K−1 and the minimum δT was 0.76 K, both obtained at 337 K.225
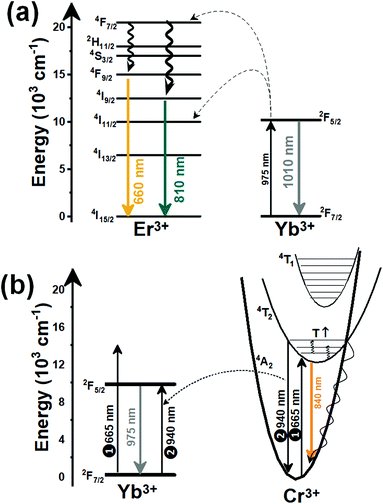 | ||
| Fig. 24 Mechanisms of generation of the emission lines of dual-doped (a) Er3+/Yb3+ and (b) Cr3+/Yb3+ materials operating simultaneously in the I- and II-BWs. | ||
In the case of Yb3+,Cr3+:LiLaP4O12,229 the intensity ratio between the emissions of Cr3+ located at 840 nm and Yb3+ located at 975 nm did not allow the obtaining of results as promising as those obtained for the combination of Nd3+/Cr3+. To generate these emission bands, a first alternative is excitation at 665 nm that allows the excitation of electrons of Cr3+ from the 4A2 ground state to the 4T2 excited state. A radiative relaxation from this level led to a broad emission band, centered at ∼840 nm, assigned to the 4T2 → 4A2 transition, as explained before. Also, after thermalization of the higher energy levels of the 4T2 excited state, an emission at 940 nm can take place, when relaxing back radiatively to the ground state. For the excitation of Yb3+, the authors considered an ET process from Cr3+ to Yb3+ or a reabsorption process of the 940 nm emission band generated by Cr3+, that allowed excitation of the Yb3+ electrons to the 2F5/2 level (Fig. 24(b)), from where the radiative relaxation to the ground state generated the emission line at 975 nm used in the luminescent thermometer.
Here, the maximum Srel obtained in the physiological range of temperatures was 0.32% K−1, with a δT of 1.6 K.229 The authors tried to correlate the differences between the sensitivity of Yb3+/Cr3+ and Nd3+/Cr3+ luminescent thermometers to the population mechanism of the excited states in these ions. For the Nd3+/Cr3+ combination, the 655 nm excitation wavelength was chosen to excite simultaneously both ions.224 For the Yb3+/Cr3+ combination, the simple energy diagram of Yb3+ and the lack of high energy levels hampers the simultaneous excitation of both ions, which concurrently reduces the sensitivity of such luminescent thermometers.229 A possible solution for the dually doped Yb3+/Cr3+ materials would be the use of two excitation beams simultaneously, one for Cr3+ (at 650 nm) and another one for Yb3+ (∼940 nm). In terms of thermometric performance, this last approach achieved a three times higher Srel (Fig. 25), with a value of 1.2% K−1.229 However, this approach is technically rather complex, and exhibits strong sensitivity fluctuations above 320 K (Fig. 25).229
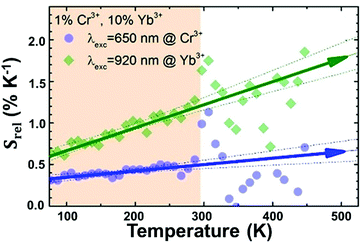 | ||
| Fig. 25 S rel of codoped Cr3+,Yb3+:LiLaP4O12 nanoparticles operating simultaneously in the I- and II-BWs, as a function of the excitation wavelength. Reprinted with permission from ref. 229. Copyright 2016, Elsevier. | ||
Recently, lifetime nanothermometry226–228 has been applied for materials operating within the I and II BWs simultaneously. Tan et al. studied the temperature dependence of the 980 nm emission of Yb3+ in a NaYF4@NaYF4:Nd3+,Yb3+@CaF2 core–shell nanostructure with a size of 13.5 nm.227 This nanostructure does not only minimize the probability of deactivation processes happening, produced by crystal defects and surface quenching centers, but also maximizes the thermal sensitivity of the luminescent nanothermometer. The emission band of Yb3+ is generated after exciting the nanoparticles at 800 nm. Nd3+ ions absorb this energy to promote their electrons from the 4I9/2 ground state to the 4F5/2 excited state. From here, a non-radiative relaxation leads to the population of the 4F3/2 level. From this level, which is resonant in energy with the 2F5/2 level of Yb3+, ET and BET processes occur. ET processes populate the 2F5/2 level of Yb3+, from which, upon relaxation back to the 2F7/2 ground state, the 980 nm emission band is generated (as has been described in Fig. 21(b)).
The lifetime of this emission was recorded from 283 K to 337 K, after optimizing the concentration of the Ln3+ ions in these structures. This temperature dependence was governed by the temperature dependence of the ET and BET rates, the multiphonon process probabilities, and the energy migration that can take place among Yb3+ ions. The authors modelled the lifetime according to a polynomial function (as that presented in eqn (23)) and Srel was expressed as follows:227
 | (42) |
The maximum Srel was obtained at the lowest temperature under investigation with a value of 1.4% K−1.
Similarly, Wang et al.228 and Ji et al.226 studied the temperature dependence of the lifetime of this emission embedded in Bi7F11O5 and Nd3+:NaGdF4 (see Table 2), respectively. Here the chosen fitting model was an exponential equation (as that presented in eqn (19)). Among these materials, Yb3+,Nd3+:NaGdF4 displayed the highest Srel with a value of 1.59% K−1 at 343 K. The variation of Srel with temperature is presented in Fig. 22(b). Lifetime nanothermometry, although not too much used within the BW regions, portrays a potential and very powerful route towards biomedical applications of Ln3+-doped luminescent nanothermometers, as it is independent of the optical properties of the medium in which the nanoparticles are embedded.227 However, this technique requires the use of complex and expensive acquisition systems based on either fast detectors or time-gated detection procedures, which might hamper their implementation at a practical level.
4. Lanthanide-doped luminescent nanothermometers operating in the II-BW
Lanthanide-doped luminescent thermometers operating in the II-BW are based on Yb3+ and Nd3+-doped materials. The explanation for this relies on the ability of these two Ln3+ ions to absorb the energy of an excitation source located in the I-BW, and generate emissions in the II-BW,48,90,233 providing deeper penetration depths into biological tissues, while maintaining a high spatial resolution.86,90,233 The luminescent thermometers based on Yb3+ use the emission at ∼1000 nm, either in single-doped materials by studying the Stark sublevels of the electronic transition that generate this emission, or combined with other emissions arising from other Ln3+, including Tm3+ and Nd3+. Luminescent thermometers based on Nd3+-doped materials used the emissions arising from the Stark sublevels of the 1050 nm and 1330 nm emission bands in single-doped materials, or the combination with emissions from other Ln3+ (Ho3+) in codoped materials, or from semiconductor quantum dots in dual emitting materials.4.1. Yb3+-doped luminescent nanothermometers operating in the II-BW
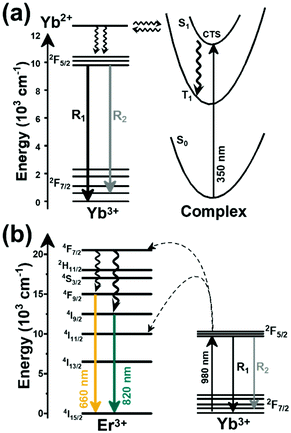 | ||
| Fig. 26 Mechanisms of generation of Yb3+ emissions lines in: (a) organic complexes via charge transfer state (CTS) and (b) ZrO2 codoped with Er3+. | ||
Nevertheless, for these hybrids, besides the low Srel they exhibit (0.13–0.17% K−1) with maximum values at cryogenic temperatures (110 K)234 (Table 3), they are excited with UV light, hampering significantly their implementation in possible biomedical applications.
| A | S | Host | λ exc (nm) | λem (nm) | Transitions | ΔT (K) | Δ | S rel/T (% K−1)/K | δT (K) | Ref. |
|---|---|---|---|---|---|---|---|---|---|---|
| Yb3+ | Yb3+ | ZrO2 | 980 | 1023, 1036 | 2F5/2 → 2F7/2 | 293–493 | VPR1023/1036 | 1.1/293 | 0.45* | 193 |
| Yb3+ | Yb3+ | dppz-ePMO@Yb(tta)3 | 350 | 986, 1015 | 2F5/2 → 2F7/2 | 110–310 | FIR986/1015 | 0.17/110 | 2.9* | 234 |
| Yb3+ | Yb3+ | dppz-vSilica@Yb(tta)3 | 350 | 990, 1025 | 2F5/2 → 2F7/2 | 110–310 | FIR990/1025 | 0.13/110 | 3.8* | 234 |
| Yb3+, Tm3+ | Tm3+ | Er,Yb:LaF3@Tm,Yb:LaF3 | 690 | 1000 (Yb3+), 1230 (Tm3+) | 2F5/2 → 2F7/2 (Yb3+), 3H5 → 3H6 (Tm3+) | 293–323 | I 1000/I1230 | 3.9/293 | 0.3 | 240 |
| Yb3+, Tm3+ | Tm3+ | LaF3 | 690 | 1000 (Yb3+), 1230 (Tm3+) | 2F5/2 → 2F7/2 (Yb3+), 3H5 → 3H6 (Tm3+) | 293–323 | I 1000/I1230 | 1.3/293 | 0.38* | 240 |
| Nd3+, Yb3+ | Nd3+ | Er,Yb:NaYF4@Yb,Nd:NaYF4 | 808 | 980 (Yb3+), 1060 (Nd3+) | 2F5/2 → 2F7/2 (Yb3+), 4F3/2 → 4I9/2 (Nd3+) | 103–443 | I 1060/I980 | 2.1/370 | 0.24* | 241 |
| Nd3+, Yb3+ | Nd3+ | Tm,Yb:SrF2@Y:SrF2@, Er:SrF2@Nd:SrF2 | 806 | 980 (Yb3+), 1060 (Nd3+) | 2F5/2 → 2F7/2 (Yb3+), 4F3/2 → 4I11/2 (Nd3+) | 293–323 | I 980/I1060 | 1.62/323 | 1.7 | 242 |
| Nd3+, Yb3+ | Nd3+ | PDC | 808 | 1005 (Yb3+), 1065 (Nd3+) | 2F5/2 → 2F7/2 (Yb3+), 4F3/2 → 4I11/2 (Nd3+) | 298–368 | I 1065/I1005 | 0.53/368 | 1.09 | 243 |
| Nd3+, Yb3+ | Nd3+ | PDC | 808 | 1005 (Yb3+), 1052 (Nd3+) | 2F5/2 → 2F7/2 (Yb3+), 4F3/2 → 4I11/2 (Nd3+) | 298–368 | I 1052/I1005 | 0.48/298 | 0.08 | 243 |
| Nd3+, Yb3+ | Nd3+ | Nd:LaF3@Yb:LaF3 | 790 | 1000 (Yb3+), 1300 (Nd3+) | 2F5/2 → 2F7/2 (Yb3+), 4F3/2 → 4I13/2 (Nd3+) | 283–323 | I 1300/I1000 | 0.41/283 | 1.61 | 223 |
| Nd3+, Yb3+ | Nd3+ | Nd:LaF3@Yb:LaF3 | 790 | 1000 (Yb3+), 1060 (Nd3+) | 2F5/2 → 2F7/2 (Yb3+), 4F3/2 → 4I11/2 (Nd3+) | 283–323 | I 1060/I1000 | 0.41/283 | 1.61 | 223 |
| Nd3+, Yb3+ | Nd3+ | Nd:LaF3@Yb:LaF3 | 790 | 1000 (Yb3+), 890 (Nd3+) | 2F5/2 → 2F7/2 (Yb3+), 4F3/2 → 4I9/2 (Nd3+) | 283–323 | I 890/I1000 | 0.41/283 | 1.61 | 223 |
| Nd3+, Yb3+ | Nd3+ | Yb:LaF3@Nd:LaF3 | 790 | 1000 (Yb3+), 1300 (Nd3+) | 2F5/2 → 2F7/2 (Yb3+), 4F3/2 → 4I13/2 (Nd3+) | 283–323 | I 1300/I1000 | 0.36/283 | 1.61 | 223 |
| Nd3+, Yb3+ | Nd3+ | Yb:LaF3@Nd:LaF3 | 790 | 1000 (Yb3+), 1060 (Nd3+) | 2F5/2 → 2F7/2 (Yb3+), 4F3/2 → 4I11/2 (Nd3+) | 283–323 | I 1060/I1000 | 0.36/283 | 1.61 | 223 |
| Nd3+, Yb3+ | Nd3+ | Yb:LaF3@Nd:LaF3 | 790 | 1000 (Yb3+), 890 (Nd3+) | 2F5/2 → 2F7/2 (Yb3+), 4F3/2 → 4I9/2 (Nd3+), | 283–323 | I 890/I1000 | 0.36/283 | 1.61 | 223 |
| Nd3+, Yb3+ | Nd3+ | Yb,Nd:LaF3 | 790 | 1000 (Yb3+), 890 (Nd3+) | 2F5/2 → 2F7/2 (Yb3+), 4F3/2 → 4I9/2 (Nd3+) | 283–323 | I 890/I1000 | 0.1/283 | 1.61 | 223 |
| Nd3+, Yb3+ | Nd3+ | Yb,Nd:LaF3 | 790 | 1000 (Yb3+), 1060 (Nd3+) | 2F5/2 → 2F7/2 (Yb3+), 4F3/2 → 4I11/2 (Nd3+) | 283–323 | I 1300/I1000 | 0.1/283 | 1.61 | 223 |
| Nd3+, Yb3+ | Nd3+ | Yb,Nd:LaF3 | 790 | 1000 (Yb3+), 1300 (Nd3+) | 2F5/2 → 2F7/2 (Yb3+), 4F3/2 → 4I13/2 (Nd3+) | 283–323 | I 1300/I1000 | 0.1/283 | 1.61 | 223 |
| Nd3+ | Nd3+ | YAP | 532 | 1348 | 4F3/2 → 4I13/2 | 293–370 | Δ 1348 | 3.3/293 | 0.37 | 157 |
| Nd3+ | Nd3+ | LiLuF4@LiLuF4 | 793 | 1316, 1328 | 4F3/2 → 4I13/2 | 293–318 | FIR1316/1328 | 0.49/293 | 1.02 | 164 |
| Nd3+ | Nd3+ | LiLuF4@LiLuF4 | 793 | 1045, 1055 | 4F3/2 → 4I11/2 | 293–318 | FIR1045/1055 | 0.48/293 | 1.05 | 164 |
| Nd3+ | Nd3+ | YVO4@SiO2 | 808 | 1064, 1066 | 4F3/2 → 4I11/2 | 297–331 | FIR1064/1066 | 0.45/331 | 0.50 | 244 |
| Nd3+ | Nd3+ | PDC | 808 | 1054, 1065 | 4F3/2 → 4I11/2 | 298–368 | FIR1054/1065 | 0.44/368 | 0.3 | 243 |
| Nd3+ | Nd3+ | Y2O3 | 532 | 1053, 1075 | 4F3/2 → 4I11/2 | 298–333 | FIR1053/1075 | 0.43/298 | 0.2 | 166 |
| Nd3+ | Nd3+ | YVO4 | 808 | 1064, 1066 | 4F3/2 → 4I11/2 | 297–331 | FIR1064/1066 | 0.35/331 | 0.44 | 244 |
| Nd3+ | Nd3+ | Y3+:CaF2 | 808 | 1053, 1062 | 4F3/2 → 4I11/2 | 300–333 | FIR1053/1062 | 0.18/300 | 2.7* | 245 |
| Nd3+ | Nd3+ | KGd(WO4)2 | 808 | 1067, 1075 | 4F3/2 → 4I11/2 | 298–333 | FIR1067/1075 | 0.16/298 | 3* | 174 |
| Nd3+, QDs | Nd3+, QDs | Nd:NaGdF4@QD@PGLA | 808 | 1060 (Nd3+), 1300 (QDs) | 4F3/2 → 4I11/2 (Nd3+), first exciton (QDs) | 283–323 | I 1060/I1300 | 2.5/303 | 0.2 | 63 |
| Nd3+, Ho3+ | Nd3+ | Er,Ho,Yb:NaGdF4@Yb:NaGdF4@Nd,Yb:NaGdF4@NaGdF4 | 806 | 1180 (Ho3+), 1340 (Nd3+) | 5I6 → 5I8 (Ho3+), 4F3/2 → 4I13/2 (Nd3+) | 293–323 | I 1180/I1340 | 1.17/293 | 1.2 | 246 |
Another choice to excite single Yb3+-doped luminescent thermometers operating in the II-BW is using NIR light at 980 nm. This approach has been investigated in ZrO2 nanocrystals codoped with Er3+, in which the authors investigated the performance of the thermometer in the I-, II- and III-BWs, using the different emissions of Er3+ and Yb3+.193 For the luminescent thermometer operating in the II-BW the linear model of VPR (eqn (39)) was applied between the different peaks in the manifold corresponding to the 2F5/2 → 2F7/2 electronic transition of Yb3+, with peaks located at 1023 nm (label R1 of Fig. 26(b)) and 1036 nm (label R2 of Fig. 26(b)).193 The mechanism for the generation of these emission lines is similar to that reported in Fig. 24(a), in which Yb3+ not only acts as a sensitizer, but also as an activator. These nanocrystals exhibited a better Srel with a value of 1.1% K−1 at room temperature, making this approach a better strategy towards the development of single Yb3+-doped luminescent thermometers operating in the II-BW. Nevertheless, as pointed out before, the strong water absorption band at around 980 nm makes Yb3+-based luminescent nanothermometers pumped at this wavelength not ideal for biomedical or biological applications, as it might generate strong heating in the biological tissues when excessive pumping power densities are applied, which might damage biological tissues.206
If we fix our attention on the structure of the nanoparticles, besides their colloidal stability and target abilities in biomedical applications, they often exhibit limitations related to the drastic reduction of the luminescence efficiency due to the increase of non-radiative processes caused by the interactions with other molecules at their surfaces.236 It is also difficult in a simple particle to implement multifunctionality.237 To overcome these limitations, core@shell or multishell nanoparticles have emerged as a very promising strategy. The core@shell or multishell structure allows for flexible designs, incorporating efficient multifunctionality, and the facile incorporation of dopants with the desired spatial distribution, allowing the manipulation of ET processes among different ions located in different layers.238,239 Hence, here we will highlight the advantages offered by core@shell nanocrystalline structures when compared with bare nanocrystals in luminescence thermometry.
First, we focus on luminescent nanothermometers based on the Yb3+ and Tm3+ emissions located in the II-BW, which display higher relative thermal sensitivities than Yb3+/Nd3+ thermometers (Table 3). A typical example that explores the differences between the core@shell and the simple particles is the case of Er3+,Yb3+:LaF3@Tm3+,Yb3+:LaF3 nanocrystals with sizes ∼32 nm, synthesized via wet chemistry methodologies.223,240 These active core@active shell nanocrystalline structures were compared, in terms of the intensity of the emissions generated after excitation at either 690 nm or 808 nm and in terms of the thermometric performance, with their corresponding simple cores. Upon excitation at 690 nm, the energy is absorbed by Tm3+, promoting its electrons from the ground state to the 3F2,3 excited state. From this state, a cross relaxation process 3F2,3; 3H6 → 3F4; 3H5 (Fig. 27(a)) takes place leading to the population of the 3H5 energy level, from which a radiative decay to the ground state generates the 1230 nm emission of Tm3+. From the 3H5 energy level and from the 3H4 energy level (populated by a non-radiative decay from the 3F2,3 state), ET processes to the energy-resonant 2F5/2 state of Yb3+ takes place, followed by a radiative relaxation to the ground state, which leads to the 1000 nm emission of Yb3+. Further ET processes between the active shell and the active core, as presented in Fig. 27(a), lead to the population of the 2F5/2 and 4I11/2 energy levels of Yb3+ and Er3+, respectively, present in the active core. The electrons in the 4I11/2 state of Er3+ can non-radiatively decay to the 4I13/2 state, prior to relaxing back radiatively to the ground state, leading to the generation of the 1550 nm emission. The intensity of the 1000 nm, 1230 nm and 1550 nm emissions of Yb3+, Tm3+ and Er3+ ions in this core–shell structure were compared with the ones obtained in the Tm3+, Er3+, Yb3+ nanocrystals in which the three ions are located in the same layer.
Under excitation at 690 nm, brighter emissions are obtained in the core@shell structures (Fig. 28(a)). This big difference between the intensity of the emissions is a direct effect of the core@shell architecture, according to the authors, leading to a spatial separation between Er3+ and Tm3+ ions in such a way that the Er3+ → Tm3+ ET process, involving the 4I13/2 and 3F4 energy levels of Er3+ and Tm3+, respectively, is avoided or reduced, as confirmed also from the fluorescence lifetime measurements performed.240 As can be observed also in Fig. 28(a), a significant effect on the signal of the emissions (and in the thermometric performance as well, as we will analyze in section 5) was produced by excitation at 808 nm in the core@shell structures, although in that case the emission of Tm3+ is almost non detected. A possible explanation for this might be that upon 808 nm excitation, the mechanism of generation of the Tm3+ emission is mainly governed by the de-excitation of the 3H4 state and not through the cross relaxation process. Hence, as presented in Fig. 27(a), upon 808 nm excitation, the electrons of Tm3+ will be excited to the 3H4 state, from where through a direct radiative decay to the ground state, the 1470 nm emission will be generated.
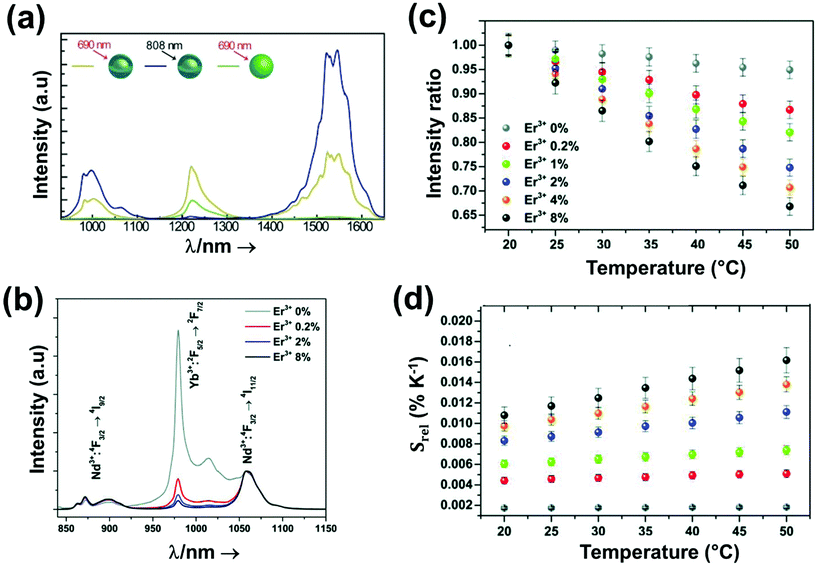 | ||
| Fig. 28 (a) Room temperature emission spectra of simple core Er3+,Tm3+, Yb3+:LaF3 under 690 nm excitation (green) and of active core@active shell Er3+,Yb3+:LaF3@Yb3+,Tm3+:LaF3 (concentrations of lanthanide ions Tm3+,Yb3+ and Er3+ are 10 mol%, 10 mol% and 2 mol%, respectively) under 690 (yellow) and 808 nm (blue) laser excitation. The green sphere and the grey core covered with a blue sphere represent the simple core and the active core@active shell, respectively. Reprinted with permission from ref. 240. Copyright 2017, Wiley-VCH Verlag GmbH & Co. KGaA. Effect of the Er3+ concentration on: (b) the intensity of the emissions, (c) the intensity ratio, and (d) Srel on Tm3+,Yb3+:SrF2@Y3+:SrF2@Er3+,Nd3+,Yb3+:SrF2@Nd3+:SrF2 nanocrystals. (b)–(d) Adapted with permission from ref. 242. Copyright 2018, The Royal Society of Chemistry. | ||
Since the 3H5 energy level is not populated any more via cross relaxation processes, but through a simple non-radiative decay from the 3H4 energy level (Fig. 27(a)), the emission at 1230 nm is almost inexistent. Here, the thermometric parameter was defined by the three intensity ratios that can be calculated combining the emissions of Yb3+, Tm3+ and Er3+: (i) the 1000 nm emission of Yb3+ combined with the 1230 nm emission of Tm3+, both located in the II-BW; (ii) the 1000 nm emission of Yb3+ combined with the 1550 nm emission of Er3+, located within the II- and III-BWs, that will be described in section 5; and (iii) the 1230 nm emission of Tm3+ combined with the 1550 nm emission of Er3+, located within the II- and III-BWs, that will be also described in section 5. For the luminescent thermometer operating exclusively in the II-BW, a maximum Srel of 3.9% K−1 was obtained at room temperature,240 three times higher than that corresponding to the nanoparticles in which the three Ln3+ were located in the same layer (Table 3). This improvement was assigned to the efficient ET and quenching rates in the core@shell structures.240
Returning to the case of Yb3+ and Nd3+ emissions located in the II-BW, a hexagonal Er3+,Yb3+:NaYF4@Nd3+,Yb3+:NaYF4 core@shell structure was analyzed as a luminescent temperature sensor. Here, to determine the temperature, the authors used the emissions generated by Yb3+ and Nd3+ located in the outer shell (the emissions generated by the ions in the inner core were used for sensing in the visible range, which is out of the scope of this review).241 By exciting the nanocrystals at 808 nm, the electrons are excited from the Nd3+ ground state to the 4F5/2 excited state, followed by a fast non-radiative decay to populate the 4F3/2 metastable state. At this stage, different radiative and non-radiative processes can take place (Fig. 27(b)), starting from the generation of the Nd3+ emission at 1060 nm, corresponding to the 4F3/2 → 4I11/2 electronic transition, and the ET between the Nd3+ and Yb3+ ions present in the shell, ruled by the Miyakawa–Dexter model.231 From here, the emission of Yb3+ located at 980 nm, assigned to the 2F5/2 → 2F7/2 transition, is generated. Also, the energy migration from the Yb3+ ions in the shell to the Yb3+ ions in the core, followed by an ET between Yb3+ and Er3+, can take place, leading finally to the green emission of Er3+ in the visible range.241 The mechanisms for the generation of the green emissions of Er3+ are out of the scope of this review; thus, they are not discussed here. The intensity ratio, fitted to the model described by eqn (42) between the 1060 nm emission of Nd3+ and the 980 nm emission of Yb3+, was analyzed as a function of temperature, in the 103–443 K range, and the concentration of Nd3+ in the outer shell, tuned from 1 to 15 at% with respect to the concentration of Yb3+.241 The results show that a maximum Srel of 2.1% K−1 at 370 K could be obtained.241 In addition, this Srel is proportional to the content of Nd3+ in the outer shell. This effect is related to the shortening of the average Nd3+–Yb3+ distance, hence facilitating the Nd3+ to Yb3+ ET.241
In simple Nd3+,Yb3+-doped LaF3 nanoparticles and two different active core@active shell nanostructures, one having the core doped with Nd3+ ions and the shell with Yb3+ ions (Nd3+:LaF3@Yb3+:LaF3) and the other constituted by a Yb3+-doped core and a Nd3+-doped shell (Yb3+:LaF3@Nd3+:LaF3),223 Nd3+ displayed two additional emission bands at 890 nm (located in the I-BW) and 1350 nm (located in the II-BW), corresponding to the 4F3/2 → 4I9/2 and 4F3/2 → 4I13/2 transitions, respectively, when excited at 790 nm. The energy of this excitation source is absorbed by Nd3+ ions, promoting their electrons to the 4F5/2 excited state. Then, a rapid phonon-assisted relaxation to the metastable 4F3/2 state takes place, from which three radiative decays to the 4I9/2, 4I11/2 and 4I13/2 levels produce the emissions located at 890 nm, 1060 nm and 1350 nm, respectively (Fig. 27(c)). A further ET process to Yb3+ can lead to the excitation of the electrons of these ions from their ground state up to the 2F5/2 state, from which the 1000 nm emission is produced.
Here, all the possible intensity ratios considering the emissions of Nd3+versus the emission of Yb3+, which obey a linear function when plotted against temperature, were explored for temperature sensing by luminescence means. The same Srel was found for all the three intensity ratios, either in the simple nanoparticles or in the core@shell structures (Table 3). Comparing the performance of the simple nanoparticles with that of the core@shell structures, a four-fold improvement in their Srel was observed. Nevertheless, the Srel values are relatively low, with a maximum of ∼0.41% K−1 in the physiological range of temperatures.223
The thermal sensitivity of these Nd3+,Yb3+-doped LaF3 nanoparticles is comparable to that of Nd3+ and Yb3+-codoped lanthanide complex with pyridine-3,5-dicarboxylate (hereafter PDC).243 Here, Nd3+ emission peaks at 1054 nm and 1065 nm are generated from the transitions between the different Stark sublevels in the 4F3/2 → 4I11/2 electronic transition, whereas the Yb3+ emission at 1005 nm corresponds to the 2F5/2 → 2F7/2 transition, after excitation at 808 nm. The intensity ratios among the three combinations (the combination of Nd3+ emissions is presented in section 4.2.1) of these emissions were analyzed for temperature-sensing purposes. The temperature dependence of the 1065 nm/1005 nm intensity ratio was fitted to eqn (14), while the 1054 nm/1005 nm intensity ratio was fitted to a linear equation. The highest Srel was obtained for the 1054 nm/1005 nm ratio with a value of 0.48% K−1 and a δT of 0.08 K.243 It should be underlined here that the uncertainty in the determination of the intensity ratio here was taken as 0.033%,243 which of course, will imply a lower δT.
Cortelletti et al. reported the thermometric performance of a complex system in the form of a core@multishell nanostructure composed of Tm3+,Yb3+:SrF2@Y3+:SrF2@Er3+,Nd3+,Yb3+:SrF2@Nd3+:SrF2,242 based on the intensity ratio between the emissions of Yb3+ at 980 nm and of Nd3+ located at 1060 nm (another emission of Nd3+ is generated at 870 nm, but the authors used only the one located at 1060 nm for temperature-sensing purposes due to its higher emission intensity). The performance of this luminescence nanothermometer was closely related to the amount of Er3+ ions in shell 2. In this structure, the energy of the 806 nm excitation source is absorbed by the Nd3+ ions present in the most external shell. This energy allows the promotion of the Nd3+ electrons to the 4F5/2 excited state, from which a non-radiative decay will populate the lower 4F3/2 excited state. From here, radiative decays to 4I9/2 and 4I11/2 states generate the emissions located at 870 nm and 1060 nm, respectively. From the 4F5/2 excited state of Nd3+, an ET process can lead to the population of the Nd3+ ions located in shell 2 (Fig. 27(d)). Then, an ET process to Yb3+ can lead to the population of its excited state prior to a radiative decay to its ground state, generating the 980 nm emission.242 Hence, between Nd3+ ions and Yb3+ ions, ET and BET processes may exist. However, this is true only when no Er3+ ions in shell 2 are found. With the addition of Er3+ ions, several ET processes between Yb3+ and Er3+ ions may occur, influencing in this way not only the intensity of the emissions generated, but also the thermometric performance of the system. With the increase of Er3+ concentration, the emission intensity of Yb3+ clearly decreases (Fig. 28(b)), due to the increase of the probability of the Yb3+ → Er3+ ET process. This ET process quenches the emission of Yb3+, which works in favor of the luminescence nanothermometry means. When considering the evolution of the intensity ratio between the emissions of Yb3+ and Nd3+ with temperature, its slope increases as the concentration of Er3+ increases (Fig. 28(c)), and so does Srel (Fig. 28(d)), generating better luminescent thermometers. From these figures it can be concluded that the Srel of the luminescent thermometer with the highest Er3+ concentration is approximately 5 times better compared with the material without this ion. Thus, efficient Yb3+ → Er3+ ET processes are beneficial for thermometric performance, although it is difficult to predict the effect of these processes in complex systems. Nevertheless, the maximum Srel achieved (1.62% K−1 in the physiological range of temperatures) is still lower when compared with the one achieved in Er3+,Yb3+:LaF3@Tm3+,Yb3+:LaF3,240 and Er3+,Yb3+:NaYF4@Nd3+,Yb3+:NaYF4 nanostructures.241
To conclude this subsection, it is clear that core@shell and core@multishell nanoarchitectures offer a boost in the brightness of the emissions generated and in addition, a significant enhancement of their temperature-sensing performance. However, it should be admitted that these structures constitute very complex systems either from the synthetic or the spectroscopic point of view. Additionally, most of them are hydrophobic because they are coated with organic surfactants; hence, for biomedical applications further modifications of their surfaces are needed to make them water dispersible.
4.2. Nd3+-doped luminescent nanothermometers operating in the II-BW
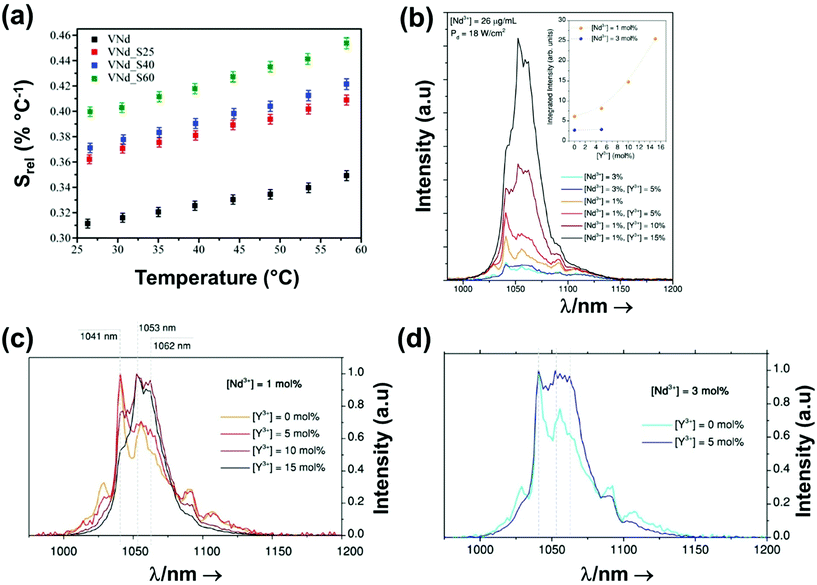 | ||
| Fig. 29 (a) Effect of the thickness of the silica shell on the thermal performance of Nd3+-doped YVO4@SiO2, where S25, S40, S60 stand for the thickness of the silica in nm. Reprinted with permission from ref. 244, Copyright 2016, Elsevier. Effect of Y3+ impurities in Nd3+-doped CaF2 on: (b) the intensity, and (c) and (d) the spectral line shape of the 4F3/2 → 4I11/2 emission band. Reprinted with permission from ref. 245. Copyright 2018, American Chemical Society. | ||
In Nd3+:YAP nanoparticles, the 1350 nm emission band was used for temperature-sensing purposes by analyzing the full width at half maximum (Δν) of the emission located at 1348 nm as a function of the temperature, from room temperature to 370 K.157 Upon green light excitation, Nd3+ promotes its electrons from the 4I9/2 ground state to the 4G9/2 or 4G7/2 excited states, followed by a non-radiative decay process to the 4F5/2 and 4F7/2 states. The 4F3/2 level can also be populated by a non-radiative decay from the 4F5/2 level. From this state, a radiative decay to the 4I13/2 level generates the emission located at 1348 nm (Fig. 30(a)). As the temperature increased, Δν became broader and its dependence on temperature could be fitted to a second-order polynomial function of the form:157
| Δv = a + bT + cT2 | (43) |
An additional strategy towards tuning the performance of these luminescent thermometers is the introduction of impurities in the host, such as the incorporation of Y3+ ions in Nd3+:CaF2 cubic nanoparticles.245 The presence of Y3+ avoids the formation of clusters of Nd3+ ions in these nanoparticles, and thus it prevents the quenching of their emissions, leading to a brighter luminescence upon using the proper doping ratio (Fig. 29(b)).245 A brighter emission lead to a more accurate and reliable performance of the luminescent thermometer.13 Nevertheless, the Srel of these nanocrystals, determined as a function of the amount of Y3+ on the structure, is relatively low, since the emissions used in this luminescent thermometers arise from TCLs with a low ΔE between them, in the range of 49–98 cm−1, depending on the Y3+ content.245 Besides the generation of a brighter emission, the introduction of Y3+ generated changes in the shape of the emission band (Fig. 29(c) and (d)), due to the modification of the environment surrounding the Nd3+ ions and to a different distribution of luminescent centers in the nanoparticles.
Skripka et al. demonstrated that upon intermixing and discriminating different factors such as the absolute intensity, the spectral shift and the line broadening of the emissions generated by different Stark sublevels, contributing to the shape of the Nd3+ emissions, a better thermometric performance can be obtained that is based only on the thermalization of the Stark sublevels.164 Hence, upon excitation at 793 nm, the Nd3+ ions in Nd3+:LiLuF4@LiLuF4 core–shell nanoparticles can absorb the energy and excite its electrons to the 4F5/2 state, from which the 4F3/2 state can be populated due to non-radiative decays (Fig. 30(b)). From here, successive radiative decays can lead to the generation of emissions lines located at 880 nm (explained in section 2.2.1), 1050 nm and 1320 nm. The corresponding FIRs between different emission peaks coming from different Stark sublevels of each of these emissions were analyzed to develop luminescent thermometers with these nanomaterials. Hence, the FIR of these emission bands provided Srel values ∼0.49% K−1 in the physiological range of temperatures. The authors strongly emphasized that if only the thermalization of the Stark sublevels would have been taken into account, Srel would have been ∼0.09% K−1, since the ΔE between the different Stark sublevels was around 55 cm−1.164 Thus, by resolving the fine Stark structure of the Nd3+ spectra with the adequate detector systems (InGaAs NIR sensors in this case) and the proper choice and design of the host material, an improvement in the thermal sensitivity based on single Nd3+ nanothermometers can be achieved.
Overall, concerning the thermometric performance of single Nd3+-doped luminescent thermometers, the use of the 1350 nm emission band results in a higher Srel. However, if advanced detector systems and proper host materials are chosen, the 1050 nm emission band can stand as a promising alternative. Nevertheless, the luminescent thermometers based on the 1350 nm emission band rely on excitation in the visible range, which will, of course, limit the biomedical applications of these temperature sensors.13,86,90 On the other hand, normally the 1050 nm emission is obtained after excitation in the I-BW, which despide their low Srel, facilitates their use in biological applications.
For example, Cerón et al.63 developed a high-resolution temperature sensor consisting of Nd3+:NaGdF4 dielectric nanoparticles and semiconductor PbS/CdS/ZnS quantum dots (QDs) combined in a poly(lactic-co-glycolic acid) (PLGA) hybrid nanostructure, excited within the I-BW (808 nm) and emitting in the II-BW. This luminescent thermometer worked on the basis of the different temperature responses of its components. While the intensity of the emission of Nd3+, located at 1060 nm, remained unchanged in the physiological range of temperatures, the intensity of the 1300 nm emission band of the QDs, assigned to their first exciton, decreased linearly due to photon-assisted processes (Fig. 31(a)). Hence, they developed a highly sensitive thermometer based on the change in the emission intensity of the quantum dots and using the emission of the Ln3+ ion as a reference probe. The maximum value of Srel and the minimum value of δT, obtained at 303 K, were 2.5% K−1 and 0.2 K, respectively.63
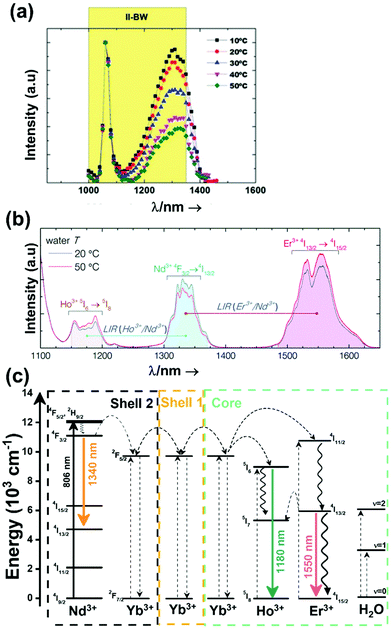 | ||
| Fig. 31 (a) Evolution of the intensity of the emissions of Nd:NaGdF4 and PbS/CdS/ZnS nanoparticles combined in PGLA hybrid nanostructures. Reprinted with permission from ref. 63. Copyright 2015, Wiley-VCH Verlag GmbH & Co. KGaA. (b) Emissions of Er3+,Ho3+,Yb3+@Yb3+@Nd3+,Yb3+@NaGdF4 multishell nanostructures (Reprinted with permission from ref. 246. Copyright 2017, The Royal Society of Chemistry), and (c) mechanisms of generation of these emission lines. | ||
A water-soluble multishell complex nanostructure based on hexagonal NaGdF4 has been also proposed as a temperature probe in the II-BW (and in the II- and III-BW regions, as will be discussed in section 5). This multishell nanostructure, formed by an active core, a Yb3+ doped inner shell, a second active shell containing Nd3+, and a final inert shell, Er3+,Ho3+,Yb3+:NaGdF4@Yb3+:NaGdF4@Nd3+,Yb3+:NaGdF4@NaGdF4, was synthesized via a thermal decomposition process, leading to oleate-capped nanoparticles.246 To make these nanostructures water dispersible, they were encapsulated in polyethylene glycol-grafted phospholipid (PEG-DOPE) micelles. After excitation at 806 nm emissions located in the II-BW and III-BW (Fig. 31(b)) were generated. The energy of the excitation source is absorbed by the Nd3+ ions located in shell 2 that subsequently generate the emission at 1340 nm, after a non-radiative decay process to the 4F3/2 level. Part of this energy is also transferred, via several ET processes through Yb3+ ions in shell 1, to the core, leading to the population of the 5I6 and 4I11/2 levels of Ho3+ and Er3+, respectively (Fig. 31(c)). The 1180 nm emission of Ho3+ is generated after a radiative decay to the ground state 5I8. From the excited 4I11/2 level of Er3+, a non-radiative decay process leads to the population of the lower excited level 4I13/2, prior to relaxing to the ground state, where the 1550 nm emission located in the III-BW is produced. Therefore, the role of the inert shell 1 is to suppress the interionic quenching of the Er3+ and Ho3+ emissions by Nd3+ ions, while the presence of Yb3+ in the core, shell 1 and shell 2 facilitates the energy migration across these multiple layers.246 Hence, from this nanostructure, three emissions are generated, two of them located in the II-BW (1180 nm of Ho3+ and 1340 nm of Nd3+) and one in the III-BW (1550 nm of Er3+). In this section, we will review only the luminescence thermometric possibilities of the emissions located in the II-BW. The temperature determination from this luminescent thermometer was done by studying the temperature dependence of the intensity ratio between the emission at 1180 nm of Ho3+ (located in the core) and the 1340 nm emission of Nd3+ (located in shell 2) in the physiological range of temperatures. With the increase of the temperature, the intensity of the emission of Ho3+ increased, due to the phonon-assisted Yb3+ (2F5/2) → Ho3+ (5I6) process,247 whereas the emission of Nd3+ decreased, due to the phonon-assisted ET Nd3+ (4F3/2) → Yb3+ (2F5/2) process201,246 (Fig. 31(b) and (c)). Since these multishell nanocrystals were dispersible in water, additional de-excitation channels associated with the presence of water molecules on the surfaces of these nanocrystals were expected. In order to prevent these de-excitation channels, the third passivating undoped shell was introduced. The maximum Srel obtained for the 1180 nm/1340 nm intensity ratio was 1.17% K−1.
Despite its relatively good temperature-sensing performance, the core@shell and multishell materials presented in this subsection are based on fluoride-doped hosts synthesized (mostly) through the thermal decomposition of trifluoroacetate precursors to control the size and the morphology of the nanoparticles, which is accompanied by highly toxic by-products of the reactions.248 Nevertheless, in terms of the thermometric performance, clearly complex nanoarchitectures, such as core@shell and multishell materials, exhibit high relative thermal sensing compared with the other forms of materials presented up to now (Fig. 32(a) and (b)) and fulfill the conditions to be used in biomedical applications. They can be excited in the BWs and generated highly temperature-dependent emissions, also located within the BWs spectral regions.
5. Lanthanide-doped luminescent nanothermometers operating in the II and III-BWs simultaneously
Based on the emission at 1550 nm, Er3+ ions represent one of the most explored lanthanide luminescent ions for thermometry operating in the II- and III-BWs simultaneously, by combining them with other emissions located in the II-BW arising either from other Ln3+ ions or transition metals. Concerning the combination of Er3+ with Ln3+ ions, typical examples involve Yb3+, Nd3+ and Ho3+ emissions. For the combination with transition metals, only one example involves the application of the Er3+ emission with the emission of nickel(II), located in the II-BW. A few cases involve also single center emitting Ln3+ ions (Nd3+ and Tm3+) as potential thermometers operating in this region.5.1. Er3+-doped luminescent nanothermometers operating in the II- and III-BWs simultaneously
Several luminescent nanothermometers have been reported using the 1550 nm emission of Er3+ together with the emission of other Ln3+ ions, including Yb3+, Ho3+ and Nd3+, operating in this way in the II- and III-BWs simultaneously. Among these combinations, pairing it with the 1000 nm emission of Yb3+ stands out as one of the most promising strategies to develop highly sensitive luminescent thermometers, especially when sensitized via Tm3+ (Table 4). For example, Er3+,Yb3+:LaF3@Tm3+,Yb3+:LaF3 core–shell nanocrystals (also explored in the II-BW) display an outstanding Srel with a value of 5% K−1 at room temperature.240 This high Srel was extracted from the intensity ratio between the 1000 nm emission of Yb3+ and the 1550 nm emission of Er3+, generated after the core@shell nanocrystals were excited at 690 nm (the mechanism of generation of the emission lines is presented in Fig. 26(a)). Compared with the performance of the Er3+,Tm3+,Yb3+:LaF3 nanoparticles, the core@shell nanocrystals have a 7-fold higher Srel (Table 4).240 Furthermore, the authors investigated the effect of the excitation laser wavelength applied (690 nm and 808 nm) on the temperature-sensing properties of these nanocrystals. The results suggest that the high Srel obtained when exciting the nanoparticles at 690 nm is due to the contribution of the 3H5 level of Tm3+ ions to the overall emission spectrum generated by the nanoparticles and/or when the 3H5 (Tm3+), 2F5/2 (Yb3+) → 3H5 (Tm3+), 2F5/2 (Yb3+) ET process is involved, implying that excitation at 690 nm, contrary to the excitation at 808 nm, highly favors this ET process.240 For the case of excitation at 808 nm, the maximum Srel was only ∼0.80% K−1. Hence, an important conclusion that can be drawn from this reference is that engineering core@shell nanostructures is not always a key feature for producing highly sensitive luminescent nanothermometers, but one has to properly select the most suitable excitation wavelength.| A | S | Host | λ exc (nm) | λem (nm) | Transitions | ΔT (K) | Δ | S rel/T (% K−1)/K | δT (K) | Ref. |
|---|---|---|---|---|---|---|---|---|---|---|
| Er3+, Yb3+ | Tm3+ | Er,Yb:LaF3@Tm,Yb:LaF3 | 690 | 1000 (Yb3+), 1550 (Er3+) | 2F5/2 → 2F7/2 (Yb3+), 4I13/2 → 4I15/2 (Er3+) | 293–323 | I 1000/I1550 | 5/293 | 0.3 | 240 |
| Er3+, Yb3+ | Yb3+ | Na2K(Lu3Si6O18) | 903 | 1125 (Yb3+), 1640 (Er3+) | 2F5/2 → 2F7/2 (Yb3+), 4I13/2 → 4I15/2 (Er3+) | 12–450 | I 1125/I1640 | 2.6/26.8 | 0.08 | 249 |
| Er3+, Yb3+ | Tm3+ | Er,Yb:LaF3@Tm,Yb:LaF3 | 808 | 1000 (Yb3+), 1550 (Er3+) | 2F5/2 → 2F7/2 (Yb3+), 4I13/2 → 4I15/2 (Er3+) | 293–323 | I 1000/I1550 | 0.80/293 | 0.62* | 240 |
| Er3+, Yb3+ | Tm3+ | Er, Tm, Yb:LaF3 | 690 | 1000 (Yb3+), 1550 (Er3+) | 2F5/2 → 2F7/2 (Yb3+), 4I13/2 → 4I15/2 (Er3+) | 293–323 | I 1000/I1550 | 0.7/293 | 0.71* | 240 |
| Er3+, Ho3+ | Yb3+ | NaYF4 | 980 | 1150 (Ho3+), 1550 (Er3+) | 5I6 → 5I8 (Ho3+), 4I13/2 → 4I15/2 (Er3+) | 299–319 | I 1150/I1550 | 2.17/299 | 0.23* | 252 |
| Er3+, Ho3+ | Yb3+ | NaYF4 | 980 | 1150 (Ho3+), 1550 (Er3+) | 5I6 → 5I8 (Ho3+), 4I13/2 → 4I15/2 (Er3+) | 298–319 | I 1150/I1550 | 1.87/298 | 0.2 | 253 |
| Er3+, Ho3+ | Yb3+ | Gd2O3 | 980 | 1149 (Ho3+), 1545 (Er3+) | 5I6 → 5I8 (Ho3+), 4I13/2 → 4I15/2 (Er3+) | 313–573 | I 1550/I1149 | 0.82/498 | 0.61* | 254 |
| Er3+, Ho3+ | Yb3+ | Y2O3 | 980 | 1149 (Ho3+), 1545 (Er3+) | 5I6 → 5I8 (Ho3+), 4I13/2 → 4I15/2 (Er3+) | 313–573 | I 1550/I1149 | 0.80/523 | 0.62* | 254 |
| Er3+, Ho3+ | Yb3+ | YAG | 980 | 1149 (Ho3+), 1545 (Er3+) | 5I6 → 5I8 (Ho3+), 4I13/2 → 4I15/2 (Er3+) | 313–573 | I 1550/I1149 | 0.48/573 | 1.05* | 254 |
| Er3+, Ho3+ | Yb3+ | BaTiO3 | 980 | 1149 (Ho3+), 1545 (Er3+) | 5I6 → 5I8 (Ho3+), 4I13/2 → 4I15/2 (Er3+) | 313–573 | I 1550/I1149 | 0.40/573 | 1.25* | 254 |
| Er3+, Ho3 | Yb3+ | NaLuF4 | 975 | 1177 (Ho3+), 1545 (Er3+) | 5I6 → 5I8 (Ho3+), 4I13/2 → 4I15/2 (Er3+) | 298–568 | I 1177/I1545 | 0.21/298 | 2.38* | 191 |
| Er3+, Ho3+ | Yb3+ | YVO4 | 980 | 1149 (Ho3+), 1545 (Er3+) | 5I6 → 5I8 (Ho3+), 4I13/2 → 4I15/2 (Er3+) | 313–573 | I 1550/I1149 | 0.17/573 | 2.9* | 254 |
| Er3+, Nd3 | Nd3+ | Er,Ho,Yb:NaGdF4@Yb:NaGdF4@Nd,Yb:NaGdF4@NaGdF4 | 806 | 1340(Nd3+), 1550 (Er3+) | 4F3/2 → 4I13/2 (Nd3+), 4I13/2 → 4I15/2 (Er3+) | 293–323 | I 1550/I1340 | 1.1/293 | 0.8 | 246 |
| Er3+, Ni2+ | Er3+, Ni2+ | SrTiO3 | 375 | 1245 (Ni2+), 1540 (Er3+) | 3T2g → 3A2g (Ni2+), 4I13/2 → 4I15/2 (Er3+) | 123–483 | I 1540/I1245 | 5.8/483 | 0.08* | 255 |
| Tm3+ | Tm3+ | LaF3 | 690 | 1230, 1470 | 3H5 → 3H63H4 → 3F4 | 297–361 | I 1470/I1230 | 1.90/297 | 0.26* | 256 |
| Nd3+ | Nd3+ | Gd2O3 | 808 | 1315, 1350 | 4F3/2 → 4I13/2 | 303–393 | I 1315/I1350 | 0.23/303 | 2.17* | 257 |
Er3+,Yb3+:Na2K(Lu3Si6O18) nanoparticles, with a triclinic crystalline structure, and synthesized by an autoclave-assisted hydrothermal process, were also tested as luminescent nanothermometers over a wide range of temperatures (12–450 K).249 The emission lines, located at 930–1125 nm corresponding to electronic transitions of Yb3+ and 1425–1640 nm corresponding to electronic transitions of Er3+, were generated after excitation at 903 nm. Yb3+ acted here also as a sensitizer, by absorbing the energy of the excitation source and promoting its electrons to the 2F5/2 level. From this level, radiatively decaying to the ground state can generate the emission of these ions. In addition, from the excited level of Yb3+, an ET process can populate the 4I11/2 level of Er3+. From this level, a non-radiative decay can populate the 4I13/2 level, prior to a radiative decay to the ground state, generating the emission of Er3+. A typical mechanism for the generation of these emission lines is similar to the ones presented in Fig. 24(a) or Fig. 26(b).
To extract the intensity ratio and eventually Srel, the authors correlated the total transition probabilities to the inverse of the lifetime using the classic Mott–Seitz model.250,251 Besides this, this lifetime, considered as the sum of the radiative (assumed to be temperature independent) and non-radiative lifetime (expressing an Arrhenius type of temperature dependence), is proportional to the intensity of the emissions, as follows:250,251
 | (44) |
 | (45) |
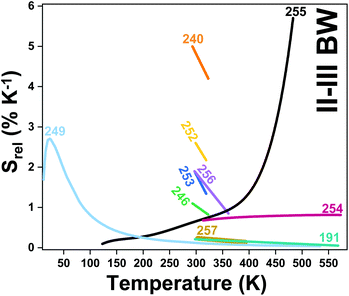 | ||
| Fig. 33 Temperature dependence of Srel of all nanothermometers operating simultaneously in the II- and III-BW regions. Numbers represent the corresponding literature references for each thermometer. | ||
A second combination of emissions for luminescent thermometers operating simultaneously in the II- and III-BWs is that formed by the emissions of Er3+ and Ho3+, located at ∼1550 nm and ∼1150 nm, respectively. These emission lines are generated in the presence of Yb3+ as a sensitizer; hence special attention should be paid to the overheating problem when pumping at 980 nm.206
For Er3+,Ho3+,Yb3+:NaYF4 luminescent nanothermometers operating within these spectral regions, we would like to stress that by using Yb3+ as a sensitizer, which has to be excited at 980 nm, and Er3+ as an emitter at 1550 nm,253,254 an overlap with the water absorption bands is produced, generating heat and hampering their potential biomedical applications.258,259 For temperature sensing, the intensity ratio between the 1150 nm emission of Ho3+ and the 1550 nm emission of Er3+ was used. These emissions lines are generated after the absorbance of the energy of the 980 nm excitation source by Yb3+, which promotes its electrons to the 2F5/2 excited state. From here, the 4I11/2 level of Er3+ and the 5I6 level of Ho3+ can be populated by ET or photon-assisted ET processes (Fig. 34), respectively. From the 4I11/2 level, Er3+ can be relaxed non-radiatively to the 4I13/2 level, prior to decaying radiatively to the 4I15/2 ground state, generating the emission at 1550 nm.253,254 The 1150 nm emission of Ho3+ can be generated by the direct relaxation from the 5I6 level to the 5I8 ground state (Fig. 34). In terms of Srel, Er3+,Ho3+,Yb3+:NaYF4 nanocrystals253,254 show a 9-fold higher sensitivity than Er3+,Ho3+,Yb3+:NaLuF4 nanocrystals,191 both being based on the intensity ratio between the 1150 nm emission of Ho3+ and 1550 nm of Er3+ (Fig. 33 for a comparison of the evolution of the Srel of these two materials and Table 4 for the maximum Srel values). We observed that the thermometric parameter of the Er3+,Ho3+,Yb3+:NaYF4 nanocrystals was fitted to a linear function (as in eqn (22)),253,254 whereas for NaLuF4, nanocrystals it was fitted to a second-order polynomial function (as in eqn (23)).191 This would explain the differences observed in Srel.
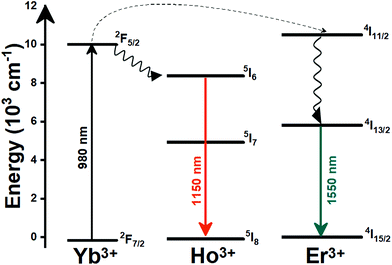 | ||
| Fig. 34 Mechanism of generation of the emissions lines located in the II- and III-BWs of Er3+,Ho3+,Yb3+:NaYF4 nanoparticles under 980 nm excitation. | ||
Similar Srel values for Er3+,Ho3+,Yb3+:NaYF4 nanocrystals were also achieved by Wortmann et al.252 The authors evaluated the performance of these nanocrystals by tuning their sizes, dispersing agent (distilled water versus an apolar organic solvent such as cyclohexane) and concentration of the emitting ions. Three trends were observed: (i) Srel increased as the size of the nanocrystals decreased, attributed to the increase of the number of emitting ions in the surface of the nanoparticles due to the increase of the surface-to-volume ratio as the size decreased; (ii) Srel was higher when the nanocrystals were dispersed in water than in cyclohexane, attributed to the O–H vibrational stretching mode of water molecules which leads to quenching of the luminescence;260,261 and (iii) Srel depended on the concentration of Ho3+ ions, due to the influence of the amount of this ion on the ET and CR rates that might take place between the sensitizer and the activators.252 These three tendencies can be seen in Fig. 35. The maximum Srel (2.17% K−1) was obtained for nanoparticles with a size ∼48 nm, dispersed in cyclohexane and with a Ho3+ concentration of 1.5 mol%.252
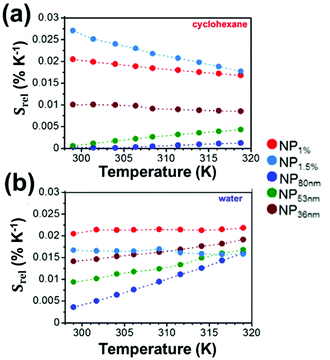 | ||
| Fig. 35 S rel of Er3+,Ho3+,Yb3+:NaYF4 nanocrystals as a function of dispersing agents: (a) cyclohexane and (b) distilled water. Also the effect of the Ho3+ concentration (1.5 mol% and 3 mol%) and the size of the nanocrystals (36 nm, 53 nm and 83 nm) can be observed. Adapted with permission from ref. 252. Copyright 2016, Elsevier. | ||
Continuing the combination between the emissions of Er3+ and Ho3+, Jia et al.254 reasoned that phonons can play an essential role in allocation of harvested energy via two types of phonon-assisted processes: multi-phonon relaxation (MPR) between the 4I11/2 and 4I13/2 states of Er3+, and PAET from the 2F5/2 state of Yb3+ to the 5I6 state of Ho3+, that will govern the electronic population of the energy states of Er3+ and Ho3+ (Fig. 34). The temperature dependence of the probability rates of these processes happening can be described as:254,262
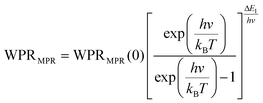 | (46) |
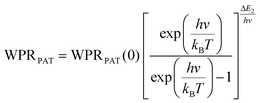 | (47) |
 | (48) |
 | (49) |
 ,
,  , NYb represents the electronic population of the 2F5/2 state of Yb3+, WR is the probability rate of the ET process, and A1 and A2 represent the spontaneous emission rates of the corresponding emission transitions.
For temperature-sensing purposes, the effect of these two mechanisms was tested in different hosts, including BaTiO3, Gd2O3, Y2O3, YAG and YVO4.254 Theoretically, the different phonon modes of the host would contribute differently to the MPR and PAT processes; however one of them should play a major role.263 In this study, the authors investigated the effect of the dominant and cutoff phonons on the thermometric performance of these luminescent thermometers, and determined that the dominant phonons have a major contribution to the MPR and PAT processes, and as a consequence, also to their temperature-sensing performance. Hence, the term hν in eqn (48) and (49) was assigned to the dominant phonons presented in each of the tested hosts.254Srel was inversely proportional to the dominant phonon energy (Fig. 36), assuming identical ΔE1 − ΔE2 in the different hosts. The highest Srel was obtained for Er3+,Ho3+,Yb3+:Gd2O3 nanoparticles, which had the lowest dominant phonon energy. It should be noticed that the maximum Srel of these materials was usually obtained at the maximum temperature investigated (Table 4), contrary to the general trend observed in the other luminescence thermometers considered. In Table 4, however, it can be also observed that these phonon-assisted luminescent thermometers do not offer an improvement of thermal sensitivity, when compared with the other thermometers (for example Er3+,Ho3+,Yb3+:NaYF4 nanoparticles252,253).
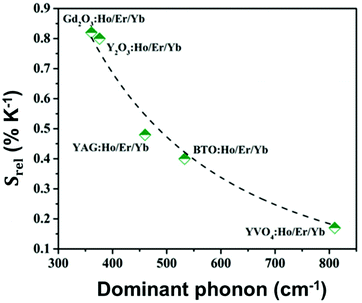 | ||
| Fig. 36 S rel of Er3+,Ho3+,Yb3+-co-doped nanoparticles as a function of the dominant phonon energy. Reprinted with permission from ref. 254. Copyright 2020, Wiley-VCH Verlag GmbH & Co. KGaA. | ||
For the combination of the emissions arising from Er3+ and Nd3+ ions, located at 1550 nm and 1340 nm, respectively, we recall the water-soluble Er3+,Ho3+,Yb3+@Yb3+@Nd3+,Yb3+@NaGdF4 core@shell nanoparticles in PEG-DOPE micelles commented on previously in section 4.2.2, as the only example that could be found in the literature.246 The mechanism of the generation of these emission lines is presented in Fig. 31(c). Srel, calculated from the intensity ratio of the emissions at 1550 nm and 1340 nm, is 1.1% K−1 at room temperature.246 This value is relatively low compared with other types of core@shell nanoparticles, such as is the case for Er3+,Yb3+:LaF3@Tm3+,Yb3+:LaF3 nanocrystals, but still higher than that of most of the luminescent nanothermometers based on the combination of emissions arising from Er3+ and Ho3+ (Table 4). Despite this, the temperature-sensing properties of this multishell structure are good for biomedical applications since they are water dispersible and are excited within the BW spectral regions.
Combining the emission of Er3+ with a transition metal, Ni2+ in this case, resulted in a Srel slightly higher than the one obtained with Er3+,Yb3+:LaF3@Tm3+,Yb3+:LaF3 nanocrystals. Er3+,Ni2+:SrTiO3 nanocrystals were excited at 375 nm, and two emission bands were generated at 1540 nm, corresponding to Er3+, and 1240 nm, corresponding to Ni2+.255 Upon excitation at 375 nm, Er3+ ions are excited from the ground state to the 4G11/2 state. From here, successive non-radiative decay processes can populate the 4S3/2 and 4I13/2 states, and a radiative relaxation from the latter to the ground state results in the generation of the 1540 nm emission band. Similarly, the 1245 nm emission of Ni2+ is generated by the absorption of the energy of the 375 nm excitation source, promoting its electrons to the 3T1g (P) excited state. From here, non-radiative decay processes can populate the 3T1g (F) and 3T2g (F) metastable states, prior to relaxing radiatively to the ground state, which results in the generation of the corresponding emission band of this transition metal ion. In addition, from the 3T1g (F) of Ni2+ an ET process to the 4S3/2 state of Er3+ can take place (Fig. 37), which might contribute to increasing the population of the 4I13/2 state, eventually contributing to the generation of the emission band at 1540 nm. The emission located at 1245 nm, as for all the emissions of Ln3+ ions in luminescent thermometers combined with transition metal ions, is temperature insensitive, serving as a reference, whereas the emission at 1240 nm drastically changes as the temperature increases.255
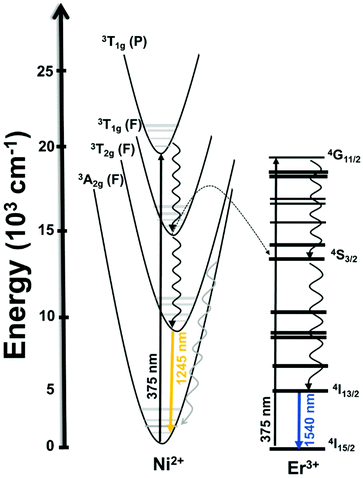 | ||
| Fig. 37 Mechanism of generation of emission lines in Ni2+,Er3+:SrTiO3 nanoparticles under 375 nm excitation. | ||
The maximum Srel for this luminescent thermometer was 5.8% K−1, obtained at the highest temperature under investigation (483 K). This value is comparable to that reported for Er3+,Yb3+:LaF3@Tm3+,Yb3+:LaF3 nanocrystals, despite the significant differences in terms of excitation wavelengths. However, to have a proper comparison with other luminescent thermometers as potential temperature sensors for biomedical applications, Srel should be compared in the physiological range of temperatures. By doing so, the Srel for this luminescent thermometer is reduced to ∼0.80% K−1 (Fig. 33).255 In addition, another significant limitation for the luminescent thermometers based on the combination of Er3+ and Ni2+ is the need for excitation in the UV at 375 nm, which reduces significantly the penetration depth that can be achieved in biological tissues, and more important, this light induces phototoxicity in these kinds of sample.13,86,90
5.2. Other Ln3+-doped luminescent nanothermometers operating in the II- and III-BWs simultaneously
Single-doped lanthanide materials based on the emission of Tm3+ and Nd3+ have been also reported as thermometers operating simultaneously in the II- and III-BWs.For the Tm3+-doped luminescent thermometers, their performance is based on the intensity ratio between the emissions located at 1230 nm and 1470 nm, generated after excitation either at 690 nm or 790 nm, as reported in Tm3+:LaF3 nanoparticles, arising from the 3H4 and 3H5 levels of Tm3+, respectively.256 The mechanism of generation of these emission bands is based on cross-relaxation (CR) and multiphonon decay processes (Fig. 38(a)). The population of the 3H5 level is favored by a CR process, whereas the population of the 3H4 level is due to multiphonon decay processes after electrons are excited to the 3F2,3 levels by absorption of the energy of the 690 nm excitation source. From the 3H5 level, a radiative decay to the 3H6 ground state generates the emission located at 1230 nm, whereas through the 3H4 → 3F4 transition, the emission band located at 1470 nm is generated.256
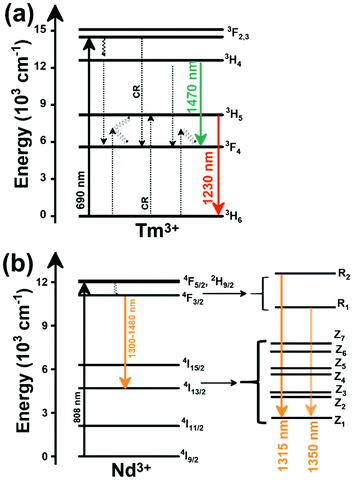 | ||
| Fig. 38 Mechanism of the generation of the emission lines on: (a) Tm3+-doped LaF3 nanocrystals, and (b) Nd3+:Gd2O3 nanospheres, operating in the II-BW and III-BW regions simultaneously. | ||
Concerning the temperature-sensing properties of this Tm3+ luminescent thermometer, the thermometric parameter was calculated from a linear fitting of the intensity ratio between the 1230 nm and the 1470 nm emission bands of Tm3+ with temperature. However, several parameters were analysed before determining the optimal Srel. First, two different excitation wavelengths (690 nm and 790 nm) were tested with the goal of determining which one generated the brightest emissions. Upon 690 nm excitation, both emissions were brighter than when 790 nm excitation was used (Fig. 39(a)), demonstrating a more efficient excitation path. In fact, when excited at 790 nm, the 1230 nm emission band shows a considerably lower intensity compared with the other emission band, mainly due to the inefficient population of the 3H5 level due to the small branching ratio of the 3H4 → 3H5 transition and the low phonon energy of the LaF3 host (<400 cm−1),264 which hampers multiphonon decay processes in this large ΔE. When excited at 690 nm, this level is populated through a CR process (3F3; 3H6 → 3F4; 3H5) that could be probed by the increase of the intensity of the 1230 nm emission band when the concentration of Tm3+ increased. Second, by tuning the concentration of Tm3+ from 1 mol% to 5 mol%, the Tm3+ concentration that displayed the highest change in the intensity of the emissions as the temperature increased was selected. It can be observed in Fig. 39(b) that the intensity of the 1230 nm emission band changed substantially as a function of the concentration of Tm3+, whereas the band at 1470 nm was almost insensitive, upon increasing the temperature from 297 K to 361 K. The intensity ratio decreased slightly as the Tm3+ concentration increased (Fig. 39(c)), and the maximum Srel, 0.90% K−1, was obtained for 1 mol% Tm3+ (Fig. 39(d)).256 This value is quite high and comparable to that of dual emitting center luminescent thermometers operating in these spectral regions (Table 4). These results, combined with a δT of ∼0.2 K, clearly underline the potential of this luminescent thermometer for biomedical applications.
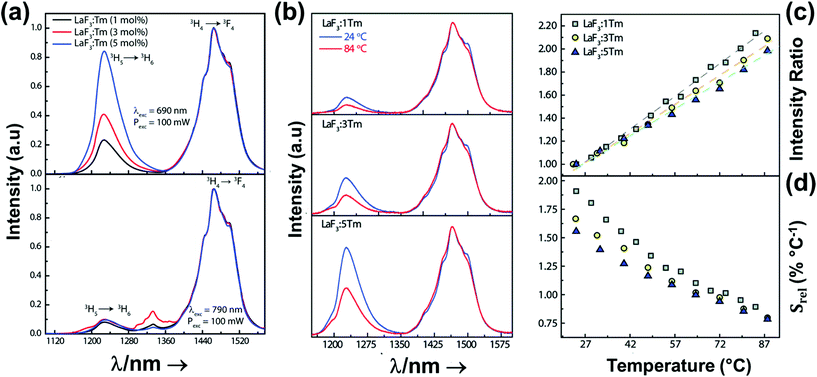 | ||
| Fig. 39 (a) Emission spectra in Tm3+-doped LaF3 nanocrystals as a function of the concentration of the Tm3+ ions (1, 3, 5 mol%) and the excitation source (690 and 790 nm). (b) Variation of the intensity of the emissions in Tm3+-doped LaF3 nanocrystals with the change of the temperature. Variation of the: (c) intensity ratio and (d) Srel of Tm3+-doped LaF3 nanocrystals as a function of the concentration of Tm3+ ions and temperature. Reprinted with permission from ref. 256. Copyright 2019, The Royal Society of Chemistry. | ||
For the Nd3+ luminescent thermometers operating in these spectral regions, the only example that could be found in the literature is that of Nd3+:Gd2O3 nanoparticles, with the shape of nanospheres with a mean diameter of 108 nm ± 21 nm, synthesized via a precipitation method.257 The performance of this material as a temperature sensor is based on the FIR from the emission lines of the Stark sublevels of the 4F3/2 → 4I13/2 transition, located in the 1300 nm–1480 nm region, while excited at 808 nm. This excitation source promotes Nd3+ electrons from the ground state to the 4F5/2 excited state. From there, the 4F3/2 level, and its different Stark sublevels, are populated through non-radiative decay processes (Fig. 38(b)). Radiative decays from these Stark sublevels to the lower Stark sublevel of the 4I13/2 state generate the two emissions located at 1315 nm and 1350 nm used for temperature sensing in this particular case, with a Srel of 0.23% K−1.257 According to the authors, this value was independent of the concentration of Nd3+ and was exclusively governed by the δT between the Stark sublevels (150 ± 20 cm−1),257 which is relatively low, providing this low value of Srel.
6. Lanthanide-doped luminescent nanothermometers operating in the III-BW
The third biological window (III-BW), or the short wavelength infrared (SWIR) region as it was originally named,126 started gaining the attention of researchers when Naczynski et al. reported that longer wavelengths than those lying in the I- and II-BWs transmitted up to three times more efficiently through oxygenated blood and melanin-containing tumors, and as a consequence for luminescent thermometry this would allow for deeper thermal readings in biological samples due to the reduction of tissue scattering and absorption, compared with the other BWs.126 Moreover, up to now, the luminescent thermometers reported operating in the III-BW are all excited at wavelengths lying in the I-BW (Table 5), providing an important advantage for their possible application in biomedicine. Typical Ln3+ ions applied for temperature sensing in the III-BW are mainly based on the emissions arising from Tm3+ located at ∼1450 nm and ∼1800 nm, the emission of Er3+ located at ∼1550 nm, and the emission of Ho3+ located at ∼1960 nm. For the case of Tm3+-doped luminescent thermometers operating in this spectral region, their performance is determined by the temperature dependence of the intensity ratio of their two emissions, or as more often encountered, combined with the emission of Ho3+, using or not using Yb3+ a as sensitizer, and for the case of Er3+-doped thermometers, the intensity ratio of their two emissions, or as more often encountered, combined with the emission of Ho3+, using or not using Yb3+ as a sensitizer. For the case of Er3+-doped thermometers, the performance is entirely based on the temperature dependence of emissions arising from TCLs constituted by the Stark sublevels of the 4I13/2 → 4I15/2 transition, using Yb3+ as a sensitizer.| A | S | Host | λ exc (nm) | λem (nm) | Transitions | ΔT (K) | Δ | S rel/T (% K−1)/K | δT (K) | Ref. |
|---|---|---|---|---|---|---|---|---|---|---|
| Tm3+ | Tm3+ | KLu(WO4)2 | 808 | 1470, 1740 | 3H4 → 3F4, 3F4 → 3H6 | 298–333 | I 1470/I1740 | 0.08/298 | 6.2* | 265 |
| Tm3+ | Yb3+ | NaYF4 | 980 | 1470, 1740 | 3H4 → 3F4, 3F4 → 3H6 | 298–333 | I 1470/I1740 | 0.6/298 | 0.8* | 265 |
| Tm3+ | Yb3+ | KLu(WO4)2 | 980 | 1470, 1740 | 3H4 → 3F4, 3F4 → 3H6 | 298–333 | I 1470/I1960 | 0.22/298 | 2.2* | 265 |
| Tm3+ | Yb3+ | KLu(WO4)2 | 808 | 1470, 1740 | 3H4 → 3F4, 3F4 → 3H6 | 298–333 | I 1470/I1740 | 0.06/298 | 8.3* | 265 |
| Tm3+,Ho3+ | Tm3+ | KLu(WO4)2 | 808 | 1800 (Tm3+), 1960 (Ho3+) | 3H4 → 3F4 (Tm3+), 5I7 → 5I8 (Ho3+) | 293–333 | I 1800/I1960 | 0.90/293 | 0.7 | 266 |
| Tm3+,Ho3+ | Yb3+ | KLu(WO4)2 | 980 | 1480 (Tm3+), 1960 (Ho3+) | 3H4 → 3F4 (Tm3+), 5I7 → 5I8 (Ho3+) | 298–333 | I 1480/I1960 | 0.52/298 | 0.9* | 265 |
| Er3+ | Yb3+ | LuVO4 | 980 | 1637, 1660 | 4I13/2 → 4I15/2 | 298–523 | FIR1637/1660 | 0.54/523 | 0.92* | 267 |
| Er3+ | Yb3+ | LuVO4@SiO2 | 915 | 1469, 1527 | 4I13/2 → 4I15/2 | 298–523 | FIR1469/1527 | 0.18/298 | 2.7* | 268 |
| Er3+ | Yb3+ | NaY2F5O | 980 | 1535, 1554 | 4I13/2 → 4I15/2 | 298–333 | FIR1535/1554 | 0.15/298 | 3.3* | 265 |
| Er3+ | Yb3+ | BaMoO4 | 980 | 1521, 1531 | 4I13/2 → 4I15/2 | 293–553 | FIR1521/1531 | 0.13/293 | 3.8* | 269 |
| Er3+ | Yb3+ | BaMoO4 | 980 | 1504, 1531 | 4I13/2 → 4I15/2 | 293–553 | FIR1504/1531 | 0.095/293 | 5.2* | 269 |
| Er3+ | Yb3+ | KLu(WO4)2 | 980 | 1535, 1554 | 4I13/2 → 4I15/2 | 298–333 | FIR1535/1554 | 0.095/298 | 5.2* | 265 |
| Er3+ | Yb3+ | Lu2O3 | 980 | 1535, 1554 | 4I13/2 → 4I15/2 | 298–333 | FIR1535/1554 | 0.09/298 | 5.5* | 265 |
| Er3+ | Yb3+ | NaYF4 | 980 | 1535, 1554 | 4I13/2 → 4I15/2 | 298–333 | FIR1535/1554 | 0.06/298 | 8.3* | 265 |
6.1. Tm3+-doped luminescent nanothermometers operating in the III-BW
Tm3+-doped luminescent thermometers operating in the III-BW were either excited at 980 nm or 808 nm, depending on whether Yb3+ has been used as sensitizer or not. When Yb3+ was used as a sensitizer, Tm3+-doped luminescent thermometers were excited at 980 nm (Table 5). These thermometers can be formed by nanoparticles doped with Tm3+ or co-doped with Ho3+, using Yb3+ as the ion that absorbed the energy of the excitation source. Upon 980 nm excitation, the luminescence spectrum of the Tm3+-doped nanoparticles in the III-BW was composed of two emissions at ∼1450 nm and ∼1800 nm, whereas when Ho3+ was also present, a third emission band at ∼1960 nm was observed. Yb3+ ions acting as a sensitizer absorb the 980 nm excitation light, promoting their electrons from the 2F7/2 ground stated to the 2F5/2 excited state. Due to the energy resonance between this level of Yb3+ and the 3H5 level of Tm3+, an ET process can take place, populating this level of Tm3+. From the 3H5 level, electrons can relax non-radiatively to the 3F4 level.From this state, the energy of a second excited electron of Yb3+ is transferred to Tm3+ while its electrons are in the 3F4 excited state, promoting them to the 3F2,3 state. From this state, a second non-radiative process can take place towards the 3H4 energy level, from which the emission band located at 1450 nm is generated through the 3H4 → 3F4 electronic transition (Fig. 40(a)). Finally, a radiative relaxation of the electrons from the 3F4 level to the ground state gives rise to the second emission of Tm3+ located at 1800 nm.265
With the addition of Ho3+, an additional ET process can take place from Yb3+ to the 5I6 level of Ho3+ that is resonant in energy with the 2F5/2 excited state of Yb3+. From it, the 5I7 level of Ho3+ can be populated through a non-radiative relaxation process, prior to a radiative transition to the ground state (5I8), generating the emission at 1960 nm. Another mechanism for the generation of the Ho3+ emission band is a direct ET process from the 3H5 level of Tm3+ to the resonant 5I6 level of Ho3+ (Fig. 40(a)). This mechanism, however, has a lower probability of happening due to the high concentration of Yb3+ in the nanoparticles, up to ten times higher than that of Tm3+, which makes more feasible the ET between Yb3+ and Ho3+.265
The addition of Ho3+ provided positive effects not only in the intensity of the luminescence of the whole spectrum, which was improved, but also in the temperature-sensing properties.
Hence, the presence of Ho3+ plays an important role in transferring additional energy towards Tm3+ ions through the 5I6 and 3H5 levels of Ho3+ and Tm3+, respectively (Fig. 40(a)), apart from that already transferred by Yb3+. The intensity ratio between the two emissions of Tm3+ ions was considered for luminescence thermometry purposes in Ho3+,Tm3+,Yb3+:KLu(WO4)2 nanoparticles, obtaining a two-fold higher Srel in the nanoparticles containing Ho3+ when compared with those containing only Tm3+ (Table 5).
Besides the benefits demonstrated by this kind of luminescent thermometer, one thing that should be considered is the fact that they were excited at 980 nm, which would hamper their potential biomedical applications due to the absorption of this radiation by water and the subsequent heat generation.206 To surpass this drawback, the possibility of exciting these materials at 808 nm through the direct absorption of energy by Tm3+ was considered as a solution.
Hence, in the absence of Yb3+ ions, an illustrative example is Ho3+,Tm3+:KLu(WO4)2 nanocrystals. Upon excitation at 808 nm, Tm3+ promotes its electrons from the 3H6 ground state to the 3H4 excited state. The electrons decay radiatively to the 3F4 manifold, generating the emission line at 1.45 μm. From the 3F4 level, a second radiative relaxation to the 3H6 ground state generates the emission line at 1.8 μm. Tm3+ might undergo a CR process 3H4, 3H6 → 3F4, 3F4, which contributes to the higher intensity observed for the emission band at 1.8 μm. Also, due to the energy resonance between the 3F4 level of Tm3+ and the 5I7 level of Ho3+, ET and BET processes might take place between these electronic levels, promoting the electrons of Ho3+ to this excited state from the ground state. Then, the electrons of Ho3+ relax radiatively to the 5I8 ground state, giving rise to the emission band at 1.96 μm (Fig. 40(b)).270 The temperature-sensing properties of Tm3+:KLu(WO4)2, Tm3+,Yb3+:KLu(WO4)2 and Ho3+,Tm3+:KLu(WO4)2 nanocrystals were compared upon excitation at 808 nm in the physiological range of temperatures. It was observed that when the temperature increased, the intensity of the 1450 nm band remained unchanged, while the intensity of the 1800 nm band decreased for Tm3+ and Tm3+,Yb3+ particles. Instead, for Tm3+,Ho3+ nanoparticles, the intensity of both the 1450 nm and 1960 nm bands decreased as the temperature increased, while the intensity of the 1800 nm band increased (Fig. 41(a)), indicating that the BET mechanism (Fig. 40(b)) between these two ions is promoted as the temperature increased.265
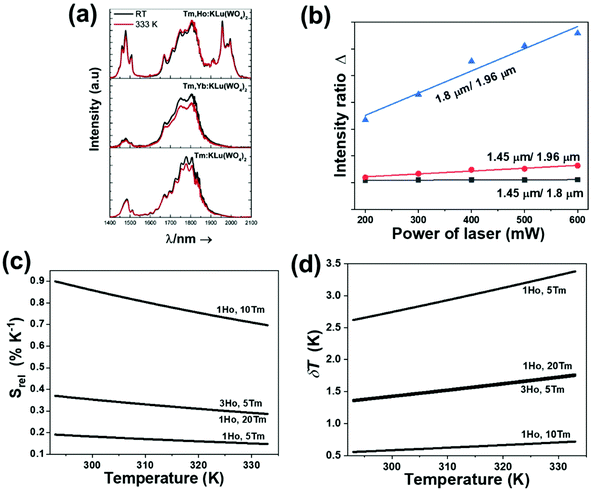 | ||
| Fig. 41 (a) Effect of temperature in the III-BW emissions for the KLu(WO4)2 nanoparticles doped with Tm3+; Tm3+,Yb3+ and Ho3+,Tm3+ ions after pumping at 808 nm. Reprinted with permission from ref. 265. Copyright 2016, Elsevier. (b) Evolution of the intensity ratios in Ho3+,Tm3+:KLu(WO4)2 nanoparticles as a function of the excitation power. Effect of different lanthanide doping concentrations in Ho3+,Tm3+:KLu(WO4)2 nanoparticles on: (c) Srel, and (d) temperature resolution. (b)–(d) Adapted with permission from ref. 266. Copyright 2020, The Royal Society of Chemistry. | ||
As a consequence, the Srel of Ho3+,Tm3+:KLu(WO4)2 nanoparticles is approximately 5 times higher than that of Tm3+:KLu(WO4)2 and Tm3+,Yb3+:KLu(WO4)2 nanoparticles, by considering either the 1450 nm/1800 nm or the 1800 nm/1960 nm intensity ratio, which provided the same Srel since the electronic populations of the two emitting levels of Tm3+ from which the emissions at 1450 and 1800 nm are generated are linked through the CR process 3H4, 3H6 → 3F4,3F4 (Fig. 41(b)).266 Then, the effects of other parameters like the excitation power, the different lanthanide doping concentrations, and the choice between the 1450 nm/1800 nm, 1450 nm/1960 nm or 1800 nm/1960 nm intensity ratios were analyzed. The 1800 nm/1960 nm intensity ratio changed the most as the excitation power increased (Fig. 41(b)). The linear variation of these intensity ratios with the excitation power represents a very important point when envisaging the application of these luminescent nanothermometers in biomedical fields. During biomedical applications, there is no real control of the excitation power reaching the nanoparticles within the biological sample; hence this might lead to inaccuracy that can be reduced with this linear variation, while always maintaining it at a value low enough to avoid damage to the biological tissues. The optimal doping concentration to maximize the luminescence intensity was found at 3 at% of Ho3+ and 5 at% of Tm3+.266 The doping concentration that allowed obtaining the highest Srel (0.90% K−1), and subsequently the minimum δT (0.55 K at 293 K), was found at 1 at% of Ho3+ and 10 at% of Tm3+ (Fig. 41(c) and (d) and Table 5). Thus, different doping concentrations of Tm3+ and Ho3+ imply different efficiencies for the electronic population processes, especially those concerning the ET and BET processes between the 3F4 level of Tm3+ and the 5I7 level of Ho3+, and consequently different thermometric performances.266 We underline as an important conclusion from this section the combination of Tm3+ and Ho3+ emissions to generate highly sensitive thermometers.
6.2. Er3+-doped luminescent nanothermometers operating in the III-BW
Er3+ doped luminescent nanothermometers operating in the III-BW exhibit, in general, a very low Srel (Table 5). Their performance, based entirely on the emissions generated from the different Stark sublevels of the 4I13/2 → 4I15/2 transition, has been evaluated through the FIR model (eqn (9)), being strictly related to the ΔE between the Stark sublevels involved in the generation of the emissions in which these luminescent thermometers are based (50–130 cm−1), which in general are very small.Er3+-doped luminescent thermometers operating in the III-BW used Yb3+ as a sensitizer, which implies excitation at 980 nm. The mechanism of generation of this emission band is depicted in Fig. 40(c). After the absorption of a photon at 980 nm by Yb3+, its electrons are promoted to the 2F5/2 level. Then, an ET to Er3+ occurs, populating its 4I11/2 level. After a multiphonon relaxation to the 4I13/2 energy level followed by a radiative decay to the ground state through the 4I13/2 → 4I15/2 transition, the emission centered at 1550 nm is generated.265,267,268
The intensity of the emission generated and the thermometric performance of different Er3+-doped luminescent thermometers operating the III-BW was analyzed by Savchuk et al. as a function of different hosts, including oxyfluorides (NaY2F5O), fluorides (NaYF4), simple oxides (Lu2O3) and complex oxides (KLu(WO4)2).265 In terms of intensity, the fluoride host exhibited the highest one, mainly attributed to its low phonon energy (Fig. 42(a)). Comparing their temperature-sensing properties in the physiological range of temperatures, calculated from eqn (9), the oxyfluoride host (NaY2F5O) exhibited the highest Srel, with a value of 0.15% K−1 at room temperature, almost 3 times higher than that obtained for the other hosts.265
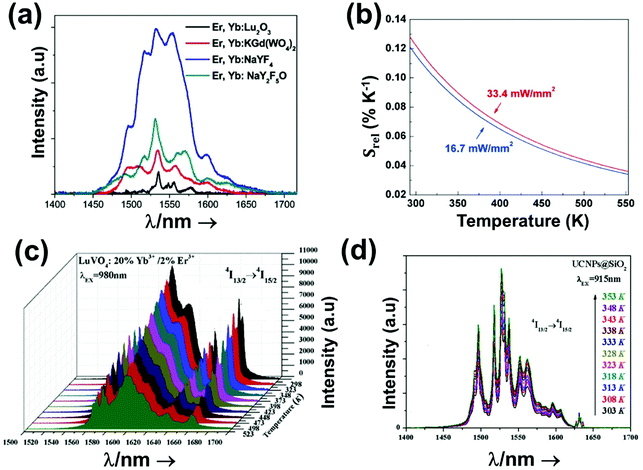 | ||
| Fig. 42 (a) Intensity of the Er3+ 1550 nm emission in different hosts after excitation at 980 nm. Reprinted with permission from ref. 265. Copyright Elsevier. (b) Effect of the excitation power density at 980 nm in Srel of Er3+,Yb3+:BaMoO4 nanoparticles. Reprinted with permission from ref. 269. Copyright 2018, Elsevier. (c) Temperature dependence of the intensity of the Er3+ 1550 nm emission in Er3+,Yb3+:LuVO4 nanoparticles, excited at 980 nm. Reprinted with permission from ref. 267. Copyright 2018, Elsevier. (d) Temperature dependence of the intensity of the Er3+ 1550 nm emission in LuVO4@SiO2 core–shell nanoparticles, excited at 915 nm. Reprinted with permission from ref. 268. Copyright 2019, American Chemical Society. | ||
In another study, in which BaMoO4 was studied as a host for Er3+, the authors demonstrated that the performance of these Er3+-doped luminescent thermometers is influenced by the excitation power density.269 The authors tested two different intensity ratios from the Stark sublevels of the 4I13/2 → 4I15/2 transition (1504 nm/1531 nm and 1521 nm/1531 nm) under two different excitation power densities (16.7 mW mm−2 and 33.4 mW mm−2). The 1504 nm/1531 nm intensity ratio was almost insensitive to the variation of the excitation power density, whereas the 1521 nm/1531 nm intensity ratio allowed a slightly higher Srel to be obtained at higher excitation power densities (Fig. 42(b)).
All the thermometers mentioned above calculated their performance based on the Boltzmann model; however, in some cases another phenomenological fitting model was applied. This is the case for Er3+,Yb3+:LuVO4267 and Er3+,Yb3+:LuVO4@SiO2 nanoparticles,268 where the thermometric parameter was fitted to the phenomenological equation:
Δ = B![[thin space (1/6-em)]](https://www.rsc.org/images/entities/char_2009.gif) exp(a + b + cT2) exp(a + b + cT2) | (50) |
According to that, Srel could be calculated as:
| Srel = |b + cT| × 100% | (51) |
The maximum Srel (0.54% K−1) was obtained for the uncoated Er3+,Yb3+:LuVO4 nanoparticles, at the highest temperature under study (523 K).267 For the silica-coated nanoparticles, a lower Srel (∼0.18% K−1) was obtained at room temperature, although they were excited at a different wavelength.268
An additional difference between these two materials was observed in the evolution of the intensity of the emission as the temperature increased. For the uncoated nanoparticles, excited at 980 nm, the intensity of the emission decreased as the temperature increased (Fig. 42(c)), while for the SiO2-coated nanoparticles a general increase of the intensity of the emission band as the temperature increased was observed (Fig. 42(d)), assigned, according to the authors, to the improvement of the multiphonon relaxation process from the 4I11/2 level to the 4I13/2 level as the temperature increased.
A final remark for this subsection should be devoted to the fact that the excitation wavelength used for these luminescent thermometers has the drawback of causing overheating, hampering their use in biomedical applications.206 Even though in Er3+,Yb3+:LuVO4@SiO2 core–shell nanoparticles excitation at 915 nm was applied to overcome this problem, the absorption cross section of Yb3+ at this wavelength is only half of that at 980 nm, which generates weaker emissions and might make their practical use as luminescent thermometers difficult.271
In summary, the variation of Srel with the increase of temperature for the luminescent thermometers operating in the III-BW is presented in Fig. 43(a) and (b). In general, for these thermometers a decrease of Srel is observed as the temperature increases, with the exception of the thermometer based on Er3+,Yb3+:LuVO4 nanoparticles, due to the different model to which the experimental data were fitted. In addition, the Srel of the Er3+-doped luminescent thermometers operating within the III-BW is relatively low compared with the Tm3+-doped ones. When compared with the luminescent thermometers operating in the other BWs, the relative thermal sensitivities of the thermometers operating in the III-BW are lower, implying that additional strategies to boost their performances need to be developed.
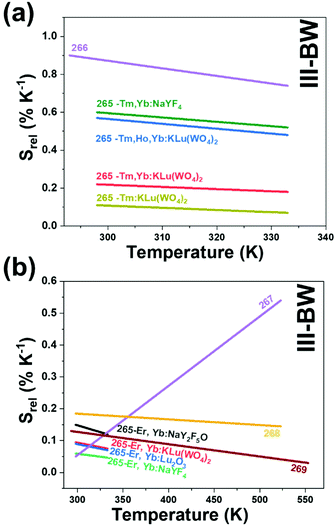 | ||
| Fig. 43 Temperature dependence of Srel of: (a) Tm3+- and (b) Er3+-doped thermometers operating in the III-BW. The numbers indicate the corresponding references for each thermometer. | ||
7. Applications of lanthanide-doped luminescent nanothermometers operating within the BWs
The development of highly sensitive lanthanide-doped luminescent nanothermometers by means of tunable synthetic strategies and the combination of different emission bands has accelerated their application as potential tools for thermal sensing in ex vivo, in vitro and in vivo trials, including 2D subcutaneous dynamic thermal imaging as well as controlled photothermal therapy experiments. This section covers most of the examples published up to now devoted to the applications of these Ln3+-doped luminescent nanothermometers operating within the different BW spectral ranges. It concludes with some other applications, distinct from those in the biomedical/biological fields in which these luminescent thermometers have also been used.7.1. Biological/biomedical applications of lanthanide-doped luminescent nanothermometers operating within the BWs
Benayas et al.171 reported the ability of Nd3+:YAG luminescent nanothermometers for ex vivo temperature monitoring, based on their emissions located in the I-BW (Table 1). The temperature-sensing properties of these nanothermometers were based on the emission lines from different Stark sublevels of the 4F3/2 → 4I11/2 transition, located at 938 nm and 945 nm, after pumping at 800 nm with a power of 100 mW. 100 μL of a 0.1 wt% water dispersion of Nd3+:YAG nanoparticles were injected into chicken breast tissue at a depth of 5 mm. The biological tissue was externally heated using a hot air flow (343 K) for 90 s, prior to letting it to cool down to room temperature naturally, as illustrated in Fig. 44(a). The luminescence and the intensity ratio of the particles during the heating/cooling cycles was monitored for a period of more than 8 min. The time evolution of the intensity ratio between the two emission lines and the corresponding subtissue temperature determined from it revealed that during the heating process a linear increase of the subtissue temperature with time was produced, reaching a maximum temperature change of about 328 K (Fig. 44(b)).171
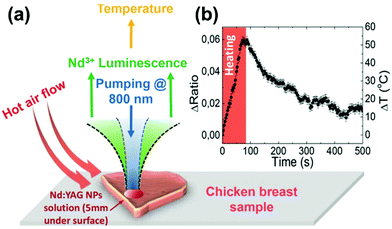 | ||
| Fig. 44 Ex vivo temperature sensing in the I-BW with Nd3+:YAG nanoparticles. (a) Scheme of the experimental procedure used to measure the time evolution of the subtissue temperature of a chicken breast sample in which an aqueous dispersion of the luminescent nanothermometers was injected, externally heated by a flow of hot air. (b) Time evolution of the subtissue temperature determined from the ratio between the intensities of the 938 nm and 945 nm emission bands of Nd3+. Reprinted with permission from ref. 171. Copyright 2015, Wiley-VCH Verlag GmbH & Co. KGaA. | ||
When the hot air flow was turned off, an exponential decrease of the temperature due to thermal diffusion was observed (Fig. 44(b)).
Based on heating–cooling cycle dynamics, Skripka et al. used water-dispersible Nd3+:LiLuF4@LiLuF4 nanocrystals as ex vivo luminescent temperature sensors.164 These nanocrystals, in principle, can work as ex vivo thermal sensors in the three BWs (they generate emissions located at 880 nm, 1050 nm and 1320 nm). However, the authors selected the emission band located in the II-BW (4F3/2 → 4I11/2 transition, 1050 nm) due to its higher intensity. The heating–cooling cycles generated in a pork fat tissue sample when a 980 nm laser (power density ∼37 W cm−2) was turned on and off were measured with an aqueous dispersion of these Nd3+:LiLuF4@LiLuF4 nanocrystals with a concentration of 5 mg mL−1 as a function of the tissue thickness (Fig. 45(a)). To record the emission generated by the nanocrystals they were continuously excited at 793 nm with a power density ∼49 W cm−2 for a period of 12 min. The recorded photoluminescence and the calculated intensity ratio based on the different emission lines arising from the different Stark sublevels that generate the 1050 nm emission of Nd3+ were used to determine the temperature. A temperature increase was induced in the pork fat tissue sample by turning ON the 980 nm laser after 2 min from the beginning of the experiment (2 min after the 793 nm laser was turned ON to excite the luminescent nanoparticles) and heating the sample for 5 min, after which it was switched OFF (Fig. 45(a)). After switching OFF the 980 nm laser, the cooling profile was also monitored through the emission generated by the nanoparticles over the next 5 min with the 793 nm laser still ON. In addition, a thermocouple was used to verify the temperature measurements. Based on these heating–cooling cycles, the heat dissipation time constant of the nanoparticles in the surrounding medium, δT, and the temporal uncertainty of the luminescent nanothermometers were determined at different biological tissue thicknesses. The results revealed that as the biological tissue becomes thicker, the values for the heat dissipation time constant determined from the spectra collected with the nanoparticles began to deviate from those measured with the thermocouple.164 Also, a significant error was observed in the determination of the temperature difference induced solely by the 980 nm light, and calculated between the OFF point of the 980 nm laser and the end of the cycle, attributed to the photoluminescence extinction of the biological tissue. With the increase of the thickness of the biological tissue from 1 to 5 mm, the δT of the luminescent thermometer changed from 0.19 to 1.23 K, while the temporal uncertainty changed from 0.52 ± 0.37 to 4.26 ± 6.60 s.164 As a conclusion, and as can be observed in Fig. 45(b), the reliability of these nanothermometers is highly compromised for a tissue thickness above 2 mm.
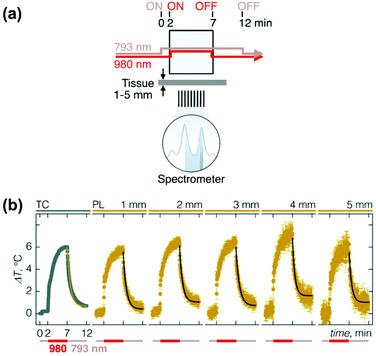 | ||
| Fig. 45 (a) Scheme of the heating–cooling experiment measurements in pork fat tissue. (b) Heating-cooling cycles measured with an aqueous dispersion of Nd:LiLuF4@LiLuF4 nanocrystals measured with a thermocouple (TC) and via the intensity ratio among the emissions generated by the different Stark sublevels of the 1050 nm emission of Nd3+, as a function of the pork fat tissue thickness. Reprinted with permission from ref. 164. Copyright 2019, The Royal Society of Chemistry. | ||
Another example of a luminescent nanothermometer applied in an ex vivo experiment is that of water-dispersible hybrid Nd3+:NaGdF4 nanoparticles and the semiconductor PbS/CdS/ZnS QDs in PGLA, operating in the II-BW using the intensity ratio between the 1060 nm emission of Nd3+ and the 1220 nm emission of QDs (Table 3).63 The ability of these particles to sense the temperature in biological tissues was tested by injecting subcutaneously 100 μL of a 1 mg mL−1 dispersion of these particles in distilled water into a chicken breast sample at a depth of ∼2 mm. The biological tissue was externally heated using a hot air current at 323 K for 20 s, prior to letting it to cool down to room temperature naturally. The emissions of the Nd3+:NaGdF4 nanoparticles and the QDs, generated within the tissue after excitation at 808 nm with a 1 W cm−2 power density, were collected by an optical fiber and spectrally analyzed through a high-resolution spectrometer (Fig. 46(a)). The temperature profile of these emissions displayed a different behavior during heating/cooling cycles (Fig. 46(b)). During the heating cycle (shadowed area), the emission of Nd3+ remained unchanged, while the emission of the QDs drastically decreased due to thermal quenching effects.63 During the cooling process, the emission of the QDs recovered its initial value. The variation of temperature of the tissue during the heating/cooling cycles was determined by calculating the intensity ratio between these two emissions (Fig. 46(c)). The results showed a temperature increase of approximately 6 K at the end of the heating pulse.63 During the cooling cycle, a pseudo-exponential decreasing profile was observed, monitored for two minutes until the initial room temperature was recovered. From the magnitude of the random fluctuations in the temperature profile (Fig. 46(c)), δT was estimated to be 0.2 K (Table 3).63
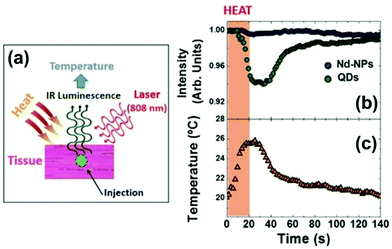 | ||
| Fig. 46 Ex vivo temperature sensing in the II-BW with hybrid Nd3+:NaGdF4 and QDs in PGLA particles. (a) Scheme of the experimental procedure. (b) Evolution of the intensity of the 1060 nm (Nd3+) and 1220 nm (QDs) emissions, normalized to their room temperature values, of the hybrid particles injected into the chicken breast tissue during a heating/cooling cycle. (c) Sub-tissue temperature evolution during the heating/cooling cycle determined from the intensity ratio of the emissions of the hybrid Nd3+:NaGdF4 and QDs in PGLA particles. Reprinted with permission from ref. 63. Copyright 2015, Wiley-VCH Verlag GmbH & Co. KGaA. | ||
Ex vivo lanthanide nanothermometers operating in the III-BW have been also reported. Savchuk et al. investigated the intensity ratio between the 1470 nm and 1711 nm emissions of Tm3+ in Ho,Tm:KLuW nanoparticles to sense the temperature inside a chicken breast sample at a depth of 2 mm, after being excited at 808 nm with a power of 200 mW.265 For the experiment, the nanoparticles were deposited on a microscope glass slide, on top of which the slice of chicken breast was placed. A heating gun, with a power of 1 W and fixed to a horizontal moving stage to control its movement, was used to induce the heating of the chicken breast sample. The heating gun was moved away from its initial position, close to the chicken breast sample, to generate a decrease of temperature in the biological tissue. The maximum temperature reached in the chicken breast sample was maintained below 318 K to avoid exceeding the denaturalization temperature of biological tissues. The excitation beam was focused on the nanoparticles by using a 40× microscope objective with a numerical aperture (hereafter N.A.) of 0.6. The photoluminescence generated by the Ho,Tm:KLuW nanoparticles was collected with a Yokogawa AQ6375 optical spectrum analyzer and the temperature was determined through the intensity ratio indicated above. In addition, close to the nanoparticles, and inside the chicken breast sample, a small Pt-100 thermocouple was placed to verify the changes of temperature (the schematic representation of the experimental setup is in Fig. 47(a)). The temperature profile resulting from moving the heating gun away from the chicken breast sample is shown in Fig. 47(b), showing a temperature drop of 1.5 K cm−1. The temperature determined by the nanoparticles displayed a difference of 0.8 K with respect to the one determined by the Pt-100 thermocouple.265 This difference was assigned to the different thermal conductivity of the two materials (nanoparticles and thermocouple) or also to the different location of the thermal probes within the chicken breast sample.265
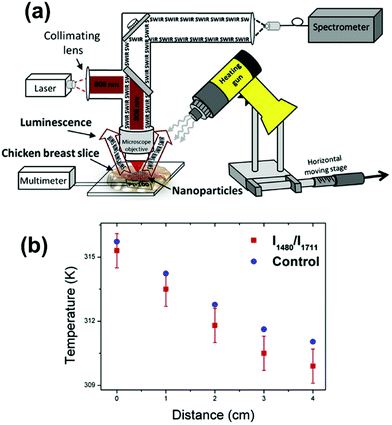 | ||
| Fig. 47 Ex vivo temperature sensing in the III-BW with Ho, Tm:KLu(WO4)2 nanoparticles. (a) Schematic representation of the experimental setup. (b) Temperature profile determined from the intensity ratio of the 1480 nm and 1711 nm emission bands of Tm3+ in Ho,Tm:KLu(WO4)2 particles (red squares) and by a Pt-100 thermocouple (blue spheres). Reprinted with permission from ref. 265. Copyright 2018, Elsevier. | ||
Photothermal therapy, which employs light-absorbing agents to convert photoenergy into heat to achieve local hyperthermia, is regarded as a minimally invasive and highly efficient method for targeted cancer treatment.4,49,274 Typical conditions that have to be fulfilled by a material to act as a potential photothermal agent include high light-to-heat conversion efficiency, nanometric sizes, excitation and emission within the BW spectral ranges, and real-time temperature feedback.275 Here, we cover the examples published in the literature which involve the application of Ln3+-doped luminescence as nanothermometers combined with materials that can generate heat, and the so-called self-assessed Ln3+-doped nanothermometers, which can simultaneously sense the temperature but also generate heat within the medium where they are embedded.
Nd3+,Y3+:CaF2 nanoparticles, combined with Au nanorods, have been used in ex vivo photothermal experiments.245 The nanoparticles that could sense the temperature (Nd3+,Y3+:CaF2) were combined with nanoparticles that could generate heat (Au nanorods). It must be emphasized that the Nd3+-doped particles alone would have also the ability to generate heat upon NIR excitation due to their ladder-like electronic configuration.15,199,204 In fact, the heat generated by the Nd3+-doped nanoparticles is a consequence of both the increase of the absorbed pump power when irradiated at 808 nm (since the absorption coefficient of these nanoparticles is proportional to the Nd3+ concentration), and the decrease of the fluorescence quantum yield due to Nd3+–Nd3+ interactions (such as cross relaxations and energy migrations when the distance among these ions is short enough). Therefore, it would be possible to tailor the balance between light and heat generation through an appropriate choice of the Nd3+ concentration inside the nanoparticles. Nevertheless, the authors chose Au nanorods as photothermal agents because the use of Nd3+-doped nanoparticles would require higher illumination doses to reach the targeted temperature.245,276 Au nanorods, upon excitation on their longitudinal plasmon mode, can efficiently generate heat.4,277 Hence, nanorods with a local surface plasmon resonance maximum at ∼810 nm were used. Concerning the Nd3+,Y3+:CaF2 luminescence temperature sensors, they operated in the II-BW using different emission lines of the band located at 1050 nm through the FIR model (Table 3). For the ex vivo experiment, 1 mol% Nd3+ and 10 mol% Y3+ co-doped CaF2 nanoparticles were chosen due to their Srel and good emission intensity. A solution of these nanoparticles with a concentration of 1.6 mg mL−1 was combined with a solution of the Au nanorods with a concentration of 1.3 × 10⁻³ mM.245 A TEM image of the combined nanoparticle dispersion is in Fig. 48(a). Chicken breast samples with different thicknesses were placed on the top of the cuvette containing the nanoparticle suspension. On the bottom of the cuvette, a thermal camera was used to monitor also the generation of heat (Fig. 48(a)). The luminescence generated by the Nd3+,Y3+:CaF2 nanoparticles, after 808 nm excitation, was recorded by an InGaAs spectrometer, and then the temperature was determined by calculating the corresponding intensity ratio. For the experiment, the power of the excitation laser was maintained below 0.94 W to avoid any overheating in the biological tissue. Also, a low concentration of Nd3+ in the nanoparticles was used to avoid the generation of heat by them; thus, the generated heat could be only attributed to the Au nanorods.245 Under these conditions, the temperature read by the thermal camera and the temperature determined by the intensity ratio between the emission lines coming from different Stark sublevels of the emitting state in the 1050 nm emission (4F3/2 → 4I11/2 transition) of the Nd3+,Y3+:CaF2 nanoparticles were compared as a function of the power of the laser applied (Fig. 48(b)–(d)), showing a good agreement for thicknesses of the chicken breast below 5.5 mm.245 For a thickness of 2 mm, a δT of 0.2 K was obtained, fulfilling the requirements for a nanothermometer to be operative in biomedical applications.13 This δT was determined using eqn (3) after recalibrating the luminescent nanothermometer in the new aqueous dispersion medium of the mixture of the Nd3+,Y3+:CaF2 and Au nanoparticles.245 Above this thickness, δT increased, reaching a value of 3.5 K for a thickness of 5.5 mm, clearly jeopardizing the reliability of this luminescent thermometer, and indicating that a new recalibration of the luminescence thermometer is required, probably inside the chicken breast.
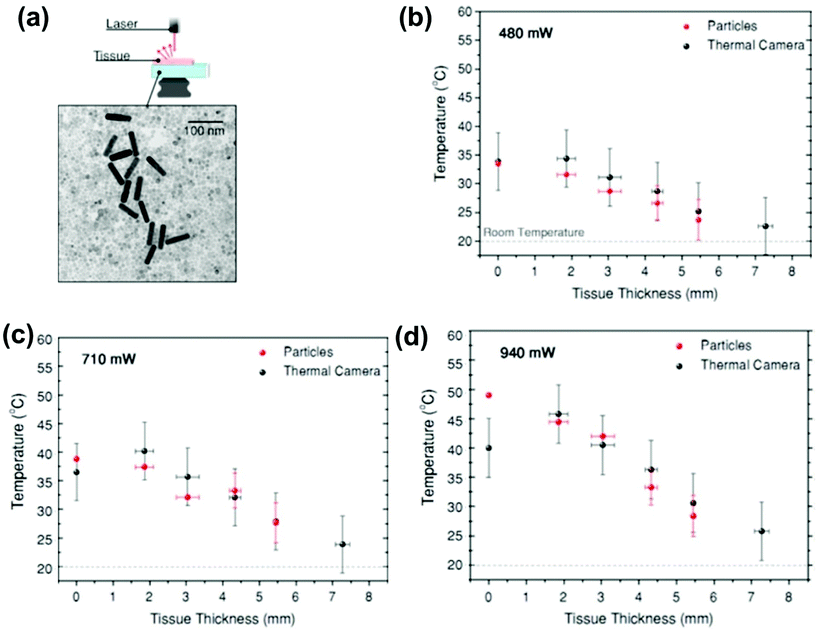 | ||
| Fig. 48 (a) Ex vivo photothermal experiment in chicken breast using a colloidal solution containing gold nanorods as photothermal agents and Nd3+,Y3+:CaF2 nanoparticles as luminescent thermometers (a TEM image of the mixed colloid is presented as well). Temperature determined by using the intensity ratio of the Stark sublevels of the 1050 nm emission of Nd3+ (in red) in the Nd3+,Y3+:CaF2 nanoparticles, and by a thermal camera (in black) as a function of the power of the 808 nm laser applied: (b) 480 mW, (c) 710 mW and (d) 940 mW. Adapted with permission from ref. 245. Copyright 2018, American Chemical Society. | ||
Another reported ex vivo photothermal experiment is the one in which so-called self-assessed photothermal agents were used.266 These self-assessed photothermal agents are materials that can simultaneously generate heat and sense the temperature. Here, these self-assessed photothermal agents were composed of only Ln3+-doped nanoparticles, which were the responsible for sensing the temperature and generating heat at the same time. As an example, we can mention Ho3+,Tm3+:KLu(WO4)2 nanoparticles,266 operating as luminescent nanothermometers in the III-BW, based on the intensity ratio between the 1800 nm emission of Tm3+ and the 1960 nm emission of Ho3+, that generated heat simultaneously due to the existence of non-radiative processes within the relaxations between the different electronic levels and non-resonant ET processes between Ln3+ ions (Fig. 49(a)). In the ex vivo experiment, the nanoparticles were placed in between two pieces of chicken breast, ensuring a complete medium homogeneity, with a maximum thickness of 2 mm. Close to the nanoparticles, a thermocouple was also located to verify the temperature determined. Upon excitation at 808 nm, a fast increase of temperature during the first 100 s was observed by monitoring the temperature with a thermocouple, prior to reaching a plateau, produced only by the Ho3+,Tm3+:KLu(WO4)2 (Fig. 49(b)). At this point, the temperature was determined through the intensity ratio of the emissions generated also by the luminescent nanoparticles (inset of Fig. 49(b)) and compared with the temperature measured with the thermocouple. The results showed a difference of up to 0.8 K between these two temperatures, probably due to the different thermal conductivities of the nanoparticles (a dielectric material) and the thermocouple (a metal), and the different medium in which the nanoparticles were embedded during the calibration procedure (air) and during the experiment (chicken breast). Hence, this ex vivo experiment demonstrated that Ho3+,Tm3+:KLuW nanoparticles could be used as self-assessed photothermal conversion agents.
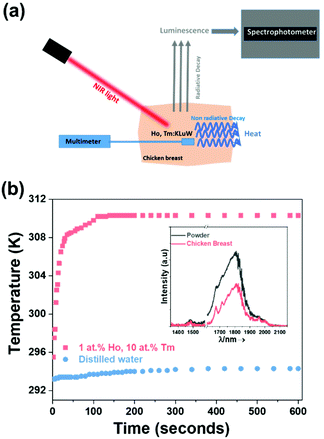 | ||
| Fig. 49 (a) Schematic representation of the experimental procedure for ex vivo temperature determination in chicken breast using self-assessed 1 at% Ho, 10 at% Tm:KLuW photothermal agents that allow the generation of heat and the measurement of temperature at the same time, with the luminescent thermometer operating in the III-BW. (b) Time-dependent temperature profiles of distilled water and aqueous dispersion of 1 at% Ho, 10 at% Tm:KLuW nanocrystals when illuminated with the 808 nm laser. The inset stands for the emissions in the III-BW of 1 at% Ho, 10 at% Tm:KLuW nanocrystals as powder in air and covered by a 2 mm thick chicken breast piece of meat. Adapted with permission from ref. 266. Copyright 2020, The Royal Society of Chemistry. | ||
By working with luminescent thermometers operating within the BW spectral regions, higher thermal sensitivities can be achieved when compared with those operating in the VIS, and thermal maps with higher spatial resolution can be recorded, due to the lower scattering at these wavelengths.279 Nevertheless, the number of Ln3+-doped nanoparticles operating within the BWs used as in vitro luminescent nanothermometers is very limited. In fact, we could identify only one in vitro luminescent nanothermometer based on a hybrid nanostructure that combines plasmonic Au nanoparticles as an efficient optical heater with Nd3+,Y3+:CaF2 nanoparticles acting as luminescent thermometers.276 These materials can both be excited with the same wavelength, 808 nm, located in the I-BW, while the emissions of the lanthanide nanoparticles used to determine the temperature are located within the II-BW. Hence, both functionalities (heating and temperature sensing) can be triggered by using a single excitation source. The luminescent thermometer constituted by the Nd3+,Y3+:CaF2 nanoparticles was based on the FIR of different emission lines generated by different Stark sublevels of the 4F3/2 → 4I11/2 transition of Nd3+, located at ∼1050 nm. Y3+ ions were intentionally added to break the energy migration paths between Nd3+ ions, which would otherwise quench the emission intensity. Concerning the nanoheater, the authors chose Au nanostars, which exhibited a higher light-to-heat conversion capacity when compared with the Au nanorods used previously in ex vivo thermometry (section 7.1.1).277 To properly prepare the combination of these nanoparticles for in vitro luminescence nanothermometry, the Nd3+,Y3+:CaF2 nanoparticles and Au nanostars were co-assembled into hybrid structures by using polysterene beads with diameters ∼500 nm as the colloidal support that were finally coated with a silica shell (∼7 nm thick) to prevent their dissociation when used in biological environments.276 TEM images of the hybrid structures can be seen in Fig. 50(a) and (b). Finally, these hybrids were internalized into a 3D spheroid tumor cell model prepared using a U-87MG human glioblastoma cell line. The hybrids, dispersed in water with a concentration of 100 μg mL−1, were added to the cell culture medium and incubated for 48 hours at room temperature to allow internalization. The location of the hybrid particles inside the 3D tumor cells could be monitored through the observation of the Nd3+ luminescence, using a modified Lightsheet microscope to properly record the emission band at 1050 nm. The emission of Nd3+ (presented in a red color) was observed surrounding the DAPI (4,6-diamidino-2-phenylindole, used to label cell nuclei) emission, indicating that the hybrid beads were located in the cell cytoplasm (Fig. 50(c)).
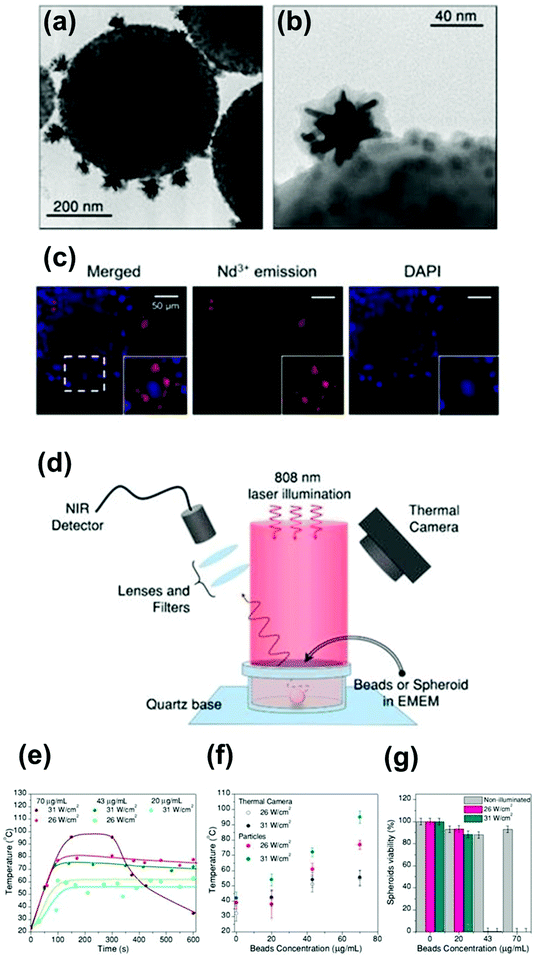 | ||
| Fig. 50 In vitro temperature sensing using Nd3+,Y3+:CaF2 nanoparticles and Au nanostars, combined in polysterene beads, and coated with a silica shell, forming a hybrid structure. (a) and (b) TEM images of the hybrid nanostructures. (c) Images of treated 3D spheroid tumor cells, showing the Nd3+ emission apparently located in the cytoplasm. (d) Schematic representation of the experimental procedure used to determine the temperature inside the 3D spheroid tumor cells. (e) Temperature measurements inside the spheroids during photothermal treatment as a function of time, using different excitation powers and different concentrations of the hybrid beads. (f) Average temperature at thermal equilibrium compared with the temperature determined by the thermal camera. (g) Viability of the 3D spheroid tumor cells 24 h after photothermal treatment. Adapted with permission from ref. 276. Copyright 2019, IvySpring International Publisher. | ||
The ability of these hybrids to emit light and generate heat was monitored in the cell medium, applying the experimental procedure schematically shown in Fig. 50(d) with an aqueous dispersion of 0.02 wt% of these hybrids. The hybrid particles were illuminated at 808 nm with a fiber-coupled laser diode using different powers and the beam was collimated to a 3 mm diameter spot. The emissions were collected with a lens, filtered with a longpass filter cut-off at 850 nm to remove the laser signal, and finally recorded by an InGaAs spectrometer. The generated heat was monitored also by a thermal camera. In the in vitro experiment, the local temperature inside the 3D spheroids tumor cells was investigated as a function of the different concentrations of the hybrids and different excitation power densities, during a period of time of 10 min to maintain the spheroids alive.276 The recorded temperature data, after transforming each of the intensity ratios of the emissions of the Nd3+,Y3+:CaF2 nanoparticles into temperatures, are shown in Fig. 50(e). The temperature increased fast initially until thermal equilibrium was reached at around 100 s. Then, it remained stable for all the samples, with the only exception of the hybrid nanoparticles excited at 31 W cm−2 and loaded with a concentration of 70 μg mL−1, for which, according to the authors, the boiling point of water was likely reached prior to cooling due to the expansion and death of the 3D spheroids. δT was found to be between 3 K and 4 K, although it could reach up to 9 K for the sample with the lowest concentration of the hybrids, excited at the lowest power density.276
The average temperature at equilibrium increased proportionally to the increase in the concentration of the hybrids and the laser power density (Fig. 50(f)). It was also observed that the temperature measured by the hybrid particles was higher than that recorded by the thermal camera, in agreement with the fact that the particles measure the temperature in the local proximity of the Au nanostars, while the thermal camera monitors the temperature at the surface of the cell medium. A final cell viability test (Fig. 50(g)) revealed that when the local temperature surpassed 328 K, the cells were almost completely dead, with a viability below 1% for a treatment reaching 334 K, and 0.3% above this temperature.276
It is important to note here that this luminescent thermometer was based on the FIR model. According to this model, and eqn (9) that is used to fit the experimental data, ΔE, i.e. the energy gap between the electronic energy levels from which the emissions are generated (in this case the different Stark sublevels of the 4F3/2 and 4I11/2 levels of Nd3+), is independent of the external environment due to shielding of the 4f orbitals by the more external 5s orbitals of the Ln3+ ions.
Nevertheless, the pre-exponential factor B can be understood as a correction parameter related to detected differences in the intensity of the emissions when embedded in different media. According to that, the intensity of the emission of the Nd3+,Y3+:CaF2 nanoparticles, combined in the hybrid structures, can change when located in air or immersed in the tumor cell culture. To correct the value of the B parameter in eqn (9), fortunately a full re-calibration was not needed. Instead it was sufficient to record several spectra at different excitation powers inside the cells.214 By doing so, a linear fit to the data allowed a calculation of the intensity ratio at zero power, which can be assumed to be the value of FIR at room temperature.214,276 By introducing this correction, the results obtained were in agreement with the temperature measured by the thermal camera (differences below 1.5 K).276 Despite the positive results obtained in this in vitro experiment, there are, however, some aspects to be improved. One would be the size of the hybrid particles used, with a diameter of 830 ± 30 nm, clearly above the desired dimensions of nanometers in the biomedical field.13 Additionally, the number of the lanthanide-doped temperature sensors per Au nanoparticle should be increased, to favor a higher intensity of the emission of Nd3+ in order to improve the signal-to-noise ratio and to reduce the time required to record the spectra. Also the distance between the Au nanoparticles and the Ln3+ ions should be larger than 5 nm, in order to avoid quenching of the Nd3+ emissions. Another issue to take into consideration is the low Srel of these luminescent thermometers, 0.18% K−1 at room temperature (Table 3).
Nd3+:LaF3 nanoparticles have been used as a luminescent nanothermometer for in vivo applications operating in the I-BW. In addition, these nanoparticles can release heat under excitation at 808 nm at a power density of 4 W cm−2 when the doping level inside the nanoparticles is high enough, such as 5.6 at%.168 As described in section 7.1.1, it is possible to tailor the balance between light and heat generation through an appropriate choice of the Nd3+ content inside the nanoparticles. Carrasco et al. used these Nd3+:LaF3 nanoparticles for in vivo photothermal treatment with continuous temperature monitoring in a mouse model.168 The authors chose the intensity ratio between the emission lines at 865 and 885 nm, assigned to two Stark sublevels of the 4F3/2 → 4I9/2 transition of Nd3+ (Table 1). Fig. 51(a) shows a schematic representation of the experimental procedure used in this investigation. Tumor-bearing mice, with one tumor per flank, were injected with a dispersion of Nd3+:LaF3 nanoparticles in phosphate-buffered saline (PBS) at a concentration of 10% in mass into one of the tumors, while the other one was used as a control (Fig. 51(b)). The injected volume was equal to ½ of the estimated tumor volume, from which it was estimated that around 7 × 10¹³ nanoparticles were injected. Intratumor injection was chosen to avoid the preferential take up of the nanoparticles by the liver and spleen observed in intravenous injection. Only the tumor containing the nanoparticles exhibited luminescence within the I-BW (Fig. 51(c)), and heating capability (Fig. 51(d)) recorded with a thermographic camera. During the photothermal therapy experiment, the intratumoral temperature was monitored (Fig. 51(e)), together with the temperature determined at the surface of the skin of the mouse (being obtained by infrared thermographic imaging) in the treated tumor and the control tumor (injected only with the equivalent amount of pure PBS and illuminated also with the 808 nm laser). The photothermal treatment lasted for 4 min. Fig. 51(e) shows the discrepancy between the intratumoral temperature, determined with the luminescent nanothermometers internalized in the tumor, and the surface temperature, determined by thermographic imaging, indicating the importance of an accurate temperature control at the injection site to minimize collateral damage due to overheating. The photothermal therapy treatment had a successful result, with a decrease of the size of the tumor after treatment to finally leave only a surface scar behind (Fig. 51(f)). Meanwhile, the growth of the control tumor did not stop.
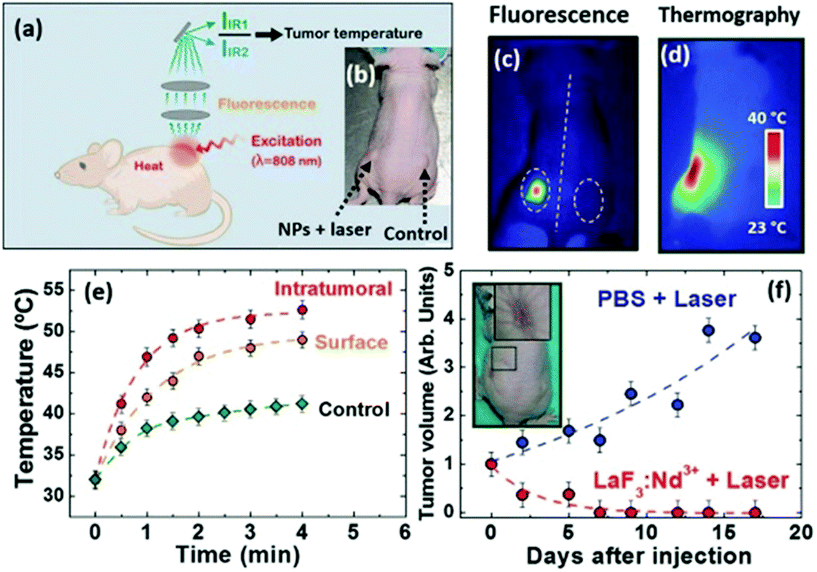 | ||
| Fig. 51 Temperature-controlled photothermal therapy in living mice with Nd3+:LaF3 nanoparticles operating in the I-BW. (a) Schematic representation of the experimental procedure for the dynamic controlled photothermal treatment of tumors in mice by using Nd3+:LaF3 nanoparticles. (b) Optical image of a tumor-bearing mouse. The left tumor was treated with Nd3+:LaF3 nanoparticles and laser, while the one on the right was used as a control. (c) Luminescent and (d) thermal images collected after a 4 min long irradiation treatment. (e) Time evolution of the intratumoral temperature determined from the analysis of the luminescence of the Nd3+:LaF3 nanoparticles, and tumor surface temperature (both treated and control tumor) as measured by infrared thermal imaging. (f) Post-treatment size evolution of both treated and control tumors. The inset shows the optical image of the surface scar left at the tumor site 15 days after the therapy. Reprinted with permission from ref. 168. Copyright 2015, Wiley-VCH Verlag GmbH & Co. KGaA. | ||
Real-time subcutaneous thermal sensing has been proposed as a powerful tool for the study of the thermal dynamics of biological tissues during in vivo experiments. Such studies would, in turn, provide access to the basic properties of biological tissues from which possible alterations related to incipient diseases could be detected.284 Ximendes et al. used Nd3+:LaF3@Yb3+:LaF3 core@shell nanoparticles to measure subcutaneous thermal transients as a potential theranostics tool.223 The core@shell nanoparticles were excited at 790 nm, and by using the intensity ratio between the emissions of Nd3+ at 1.3 μm (4F3/2 → 4I13/2) and Yb3+ at around 1 μm (2F5/2 → 2F7/2), the temperature could be determined (Table 2). The authors used these luminescent nanothermometers to measure subcutaneous thermal transients, since the cooling dynamics strongly depend on the biological tissue properties. By measuring these cooling relaxation profiles it was possible to determine the characteristic thermal relaxation time that is unequivocally related to the fundamental properties of a particular biological tissue, and that additionally can provide information about the tissue status. The detection of small variations in the subcutaneous tissue relaxation times would allow for the identification of possible alterations of its thermal diffusivity, specific heat, thermal conductivity and density associated with diseases and, hence, could be used to detect anomalies caused by incipient diseases, such as dehydration, inflammation, ischemia or, even, tumor growth. To do that, the authors injected subcutaneously 200 μL of Nd3+:LaF3@Yb3+:LaF3 core@shell nanoparticles dispersed in PBS with a concentration of 1% in mass over the right flank of a CD1 mouse at a depth of 2 mm approximately. The mouse was anesthetized by isoflurane inhalation, and placed in a small animal imaging chamber equipped with a body temperature controller so that the mouse's temperature was maintained at 307 K ± 1 K. A moderate temperature increment was induced at the injection site by illuminating the mouse with a 808 nm laser beam with a power density of 0.7 W cm−2 for 4 min that activated the release of heat by the nanoparticles. After that, a low-power 790 nm laser diode at a power of 30 mW was also focused on the nanoparticles through an infrared long working distance microscope objective to generate the luminescence of the nanoparticles from which temperature could be determined. After 4 min of irradiation, the 808 nm laser was turned off and the mouse tissues gradually recovered their initial temperature. Fig. 52(a) shows a schematic representation of the experimental procedure used for this experiment. The luminescence of the nanoparticles was used to monitor the dynamics of the subcutaneous thermal relaxation. Just after the end of the heating cycle, the subcutaneous temperature was determined to be 312 K ± 1 K. The authors were able to reveal clear differences between the thermal relaxation curves corresponding to the subcutaneous and skin temperatures (Fig. 52(b)). According to the authors, those differences arise mainly due to the different physical mechanisms responsible for heat dissipation: whereas for the skin the dissipation may be essentially convective, for the subcutaneous tissues it could be assumed to be mainly conductive, due to the lack of any physical contact with air. Another reason for these different thermal relaxation curves is the minimum blood flow in the hypodermis, several orders of magnitude lower than in internal organs.
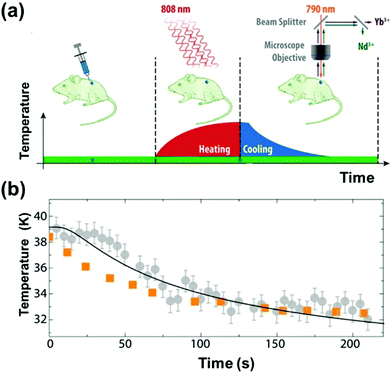 | ||
| Fig. 52 Measurement of in vivo subcutaneous thermal transients in biological tissues using luminescence thermometry within the BWs. (a) Schematic representation of the experimental procedure used to measure subcutaneous thermal relaxation. (b) Time evolution of the temperature measured by the subcutaneous luminescent thermometers (grey and orange) and the IR camera (blue). Dots correspond to experimental subcutaneous (circles) and skin (squares) temperatures. Reprinted with permission from ref. 223. Copyright 2016, American Chemical Society. | ||
Through the analysis of the subcutaneous thermal relaxation dynamics, which allowed access to the characteristic thermal relaxation time of a given subcutaneous tissue, it was possible to compute the thermal diffusivity of the mouse tissue, resulting in a value of 0.13 ± 0.04 mm2 s−1, which was similar to that reported for chicken breast tissue determined by frequency-domain photon migration.285 Additionally, the subcutaneous thermal monitoring allowed the quantification of the local thermal dose administrated in a hyperthermia treatment which in that case was 54 ± 8 J. This parameter is considered nowadays to be one of the most important factors which influences the efficiency of hyperthermia treatments. Since the total energy given by the 808 nm laser in the tissue was 560 ± 63 J, the biological tissue absorbed only 10% of this energy. Thus, the absorption coefficient of the biological tissue was 0.23 ± 0.05 cm−1, also in agreement with previous reported data in the literature.285
Despite this big advance, accurate thermal-based diagnosis would require, at least, the dynamic acquisition of 2D subcutaneous thermal images. To do that it is necessary to acquire low-noise luminescence thermal images with commercially available shortwave infrared cameras, and therefore to reconstruct accurate bidimensional thermal images. For this purpose, Ximendes et al. designed and synthesized Er3+,Yb3+:LaF3@Yb3+,Tm3+:LaF3 core@shell nanoparticles capable of producing 2D subcutaneous dynamic thermal imaging when excited at 690 nm (in the I-BW), emitting in the II- and III-BWs.240 In these Ln3+-doped nanoparticles, Tm3+ and Er3+ ions were spatially separated, with Tm3+ acting as the sensitizer, while Er3+ and Yb3+ were used as activators. The emissions used for the luminescent thermometer in this case were those of Er3+ at 1550 nm (III-BW), and Yb3+ at 1000 nm (II-BW) (Table 4). The authors used these core@shell nanoparticles for the acquisition of 2D thermal videos unveiling heat diffusion at the subcutaneous level. These videos allowed the acquisition of 2D patterns of tissue thermal properties that, in turn, could be used to identify and localize damaged (or non-healthy) biological tissues in vivo. Moreover, this analysis made possible the quantification of the thermal dose administered in the whole area of injection during a hyperthermia treatment. For that, the authors subcutaneously injected 200 μL of a dispersion of the Er3+,Yb3+:LaF3@Yb3+,Tm3+:LaF3 core@shell nanoparticles in PBS in a CD1 mouse model. Then, the temperature at the injection site was increased by illuminating at 808 nm with an excitation density of 0.7 W cm−2, and the temperature was measured through the luminescence of the nanoparticles excited at 690 nm with a power density of 0.1 W cm−2, low enough to avoid additional heating.240 A schematic representation of the experimental procedure used can be seen in Fig. 53(a). From the videos recorded, the authors extracted thermal images at different time delays during the heating and cooling cycles (Fig. 53(b)–(c)), providing detailed 2D images of the subcutaneous spatial distribution of temperature with a time resolution better than 1 s. From these data the authors computed the time evolution of the subcutaneous temperature during both heating and cooling cycles (Fig. 53(d)). The thermal diffusivity of the tissue was determined to be 0.15 ± 0.02 mm2 s−1 for the heating process, and 0.12 ± 0.02 mm2 s−1 for the cooling one.
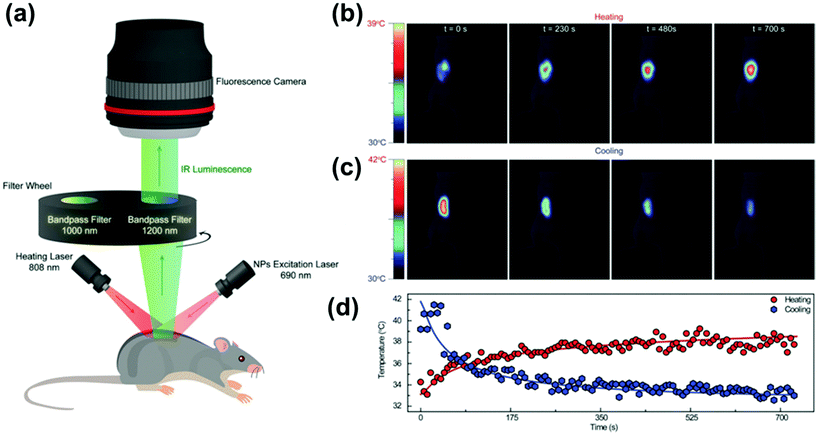 | ||
| Fig. 53 In vivo acquisition of 2D subcutaneous thermal images. (a) Schematic representation of the experimental procedure used in the in vivo experiment. (b) Thermal images obtained during the heating and relaxation (cooling) cycles. (c) Time evolution of the average temperature in the injection area as measured by the subcutaneous lanthanide nanothermometers during heating and thermal relaxation cycles. Reprinted with permission from ref. 240. Copyright 2017, Wiley-VCH Verlag GmbH & Co. KGaA. (d) Time evolution of the average temperature of the injection area as measured by subcutaneous luminescence nanothermometry during heating and thermal relaxation processes. | ||
7.2. Other applications of lanthanide-doped luminescent nanothermometers operating within the BWs
Lanthanide-doped luminescent materials can be used as nanothermometers also outside the biological/biomedical fields. An example involves the application of lanthanide-doped luminescent materials as thermal probes on the surface of a copper microwire to visualize the Joule induced heating effect.171 Nd3+:YAG luminescent nanothermometers, operating in the I-BW based on the thermally coupled Stark sublevels of the 4F3/2 → 4I9/2 electronic transition of Nd3+, located at ∼940–950 nm (Table 1), have been used for this purpose. A drop of an aqueous dispersion of these nanoparticles (1 wt%) was deposited onto a 100 μm thick copper wire fixed on a glass plate. After the evaporation of water, an 808 nm laser diode was focused onto the wire using a 10× magnification microscope objective with a N.A. = 0.55, which produced a laser spot of approximately 1.8 μm in diameter on the wire. Using the same microscope objective, the luminescence arising from the Nd3+:YAG nanoparticles was collected (Fig. 54(a) for the schematic representation of the experimental procedure used). The increase of the temperature caused by the ohmic heating of the microwire was monitored by an infrared thermographic camera and by the emissions of the luminescent particles. The temperature calculated from the intensity ratio of the emission generated by the nanoparticles presented a parabolic dependence on the different electrical currents applied (Fig. 54(b)), as expected since the Joule heating effect is directly proportional to the square of the intensity of the electrical current applied.171 These results were validated with those recorded with the infrared thermographic camera (Fig. 54(b) and (c)).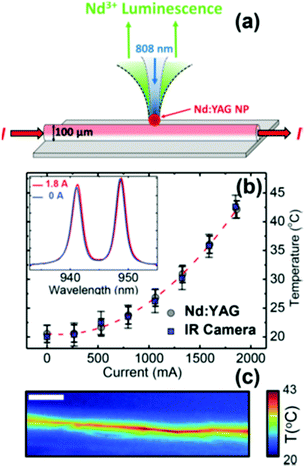 | ||
| Fig. 54 Temperature sensing in metallic microwires heated by the Joule effect using lanthanide-doped luminescent nanothermometers operating in the I-BW. (a) Scheme of the experimental procedure used. (b) Temperature of the microwire as a function of the applied current, obtained from the intensity ratio of the emissions generated by the nanoparticles and from an infrared thermographic camera. The emission spectra generated by the nanoparticles placed on the wire obtained at the two extreme values of the electrical current (0 and 1.8 A) can be seen in the inset. (c) Thermal image of the microwire when conducting the maximum electrical current applied (1.8 A), as obtained with the thermographic camera (scale bar is 2 cm long). Adapted with permission from ref. 171. Copyright 2015, Wiley-VCH Verlag GmbH & Co. KGaA. | ||
Nd3+:YAG nanoparticles with the same emissions as in the previous example have also been used as thermal probes in microfluidics.171 Taking advantage of the water dispersibility of these Nd3+:YAG nanoparticles, thermal imaging of a simple optofluidic device consisting of a 100 μm thick microchannel was recorded. In this microchannel, a single-mode fiber-coupled 1480 nm diode laser with a maximum power of 200 mW was used as a heating source. This laser was focused on the channel containing the dispersion of the nanoparticles in water through a 10× microscope objective with a N.A. = 0.25. To extract the temperature distribution pattern generated by the 1480 nm laser irradiation, strongly absorbed by water, the microfluidic channel was filled with a 0.1 wt% aqueous dispersion of the nanoparticles, while being monitored with a thermal camera (Fig. 55(a) for the schematic representation of the experimental procedure used). Nd3+:YAG nanoparticles were excited with a 808 nm laser, which was focused onto the optofluidic device using a 10× microscope objective with NA = 0.55, that produced a laser spot of approximately 1.8 μm in diameter on the channel.
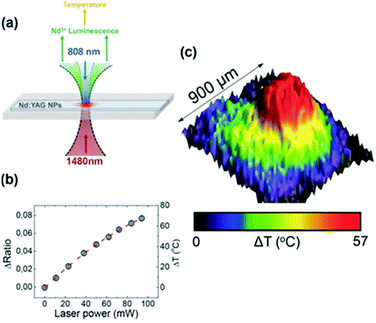 | ||
| Fig. 55 Temperature sensing in optofluidics using luminescent nanothermometers operating in the I-BW. (a) Scheme of the experimental procedure used to record the temperature distribution within an optical trap created by a 1480 nm focalized laser beam on a microchannel filled with an aqueous dispersion of Nd3+:YAG nanoparticles. (b) Temperature increment as a function of the power of the 1480 nm laser. (c) All-optical thermal imaging (2D temperature distribution map) of the area where the optical trap was created under pumping with the 1480 nm laser. Adapted with permission from ref. 171. Copyright 2015, Wiley-VCH Verlag GmbH & Co. KGaA. | ||
The luminescence generated by the nanoparticles was collected using the same microscope objective. Fig. 55(b) shows the temperature increment at the focus of the 1480 nm heating laser spot as a function of its power. The measurements of temperature were performed by overlapping both the focused heating and probe (808 nm) laser beams. It can be seen that for laser powers below 60 mW, the “on-focus” temperature increased linearly, whereas above this value the relationship did not obey a linear function any more.171 The authors considered that at high laser powers additional heating was produced, which could lead to the creation of relevant convection currents and the formation of bubbles. By applying a power of 60 mW, a 2D thermal image of the microchannel in the surroundings of the 1480 nm laser spot was recorded by scanning the 808 nm laser along a 900 × 900 μm2 area around the heating laser spot. It was observed that the laser-induced heating caused an increase of the temperature in a large area surrounding the laser spot (Fig. 54(c)), far from the microchannel itself, due to thermal diffusion.171
Luminescence nanothermometers operating in the I-BW can be also used as a tool for unveiling the thermal properties of the nanoparticles themselves, such as the determination of their thermal resistance. Thermal resistance is a key parameter to model the heat transfer at the nanoscale.150 In order to achieve this, Savchuk et al.150 applied Ho3+,Tm3+:KLu(WO4)2 nanoparticles, excited with an 808 nm laser, as upconversion luminescent nanothermometers based on the 696 nm emission of Tm3+ and the 755 nm emission of Ho3+, both located in the I-BW (Table 1).
The 808 nm laser was focused on the surface of the nanoparticles, generating, simultaneously, upconversion luminescent emissions and heat, due to radiative and non-radiative processes, respectively. A beam splitter was used to redirect a part of the emitted signal to a portable spectrophotometer that recorded the upconversion emission generated by the nanoparticles (Fig. 56(a) for the schematic representation of the experimental procedure used). The intensities of these emissions were recorded as a function of time and were converted into temperature by calculating the intensity ratio between the emissions of Ho3+ and Tm3+, following eqn (19). The temperature increment (ΔT(t)) generated in the nanoparticles by the excitation laser was measured as a function of the concentration of the emitting ions within the host (1 at% Ho3+, 5 at% Tm3+ (black squares) and 1 at% Ho3+, 15 at% Tm3+ (green circles) in Fig. 56(b)). The results showed that ΔT(t) generated was smaller for the nanoparticles with a smaller amount of Tm3+ ions, suggesting a positive correlation between the heat generated due to non-radiative Tm3+-to-Ho3+ ET and Ho3+-to-Tm3+ BET (Fig. 9(a)) and the Tm3+ concentration.
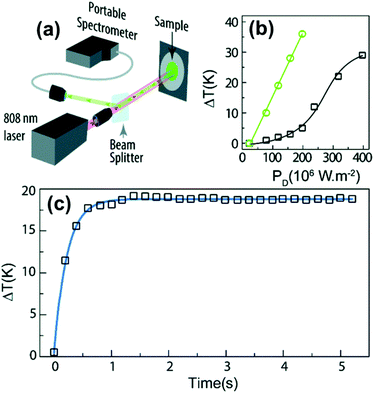 | ||
| Fig. 56 Determination of the thermal resistance of nanoparticles by lanthanide-doped luminescent nanothermometers operating in the I-BW. (a) Scheme of the experimental procedure used. (b) Temperature increase induced as a function of the different laser powers applied, and as a function of the concentration of the two emitting ions in the nanoparticles: 1 at% Ho3+, 5 at% Tm3+ (black squares) and 1 at% Ho3+, 15 at% Tm3+ (green circles) in KLu(WO4)2. (c) Heating curve obtained for the 1 at% Ho3+, 5 at% Tm3+-doped KLu(WO4)2 nanoparticles excited with the 808 nm laser operating with a power density of 318 × 106 W m−2. The blue line corresponds to the best fit of experimental data following the Fourier law. Reprinted with permission from ref. 150. Copyright 2018, The Royal Society of Chemistry. | ||
In addition, the temperature plateau observed at high power densities above 300 × 106 W m−2 and not observed in the sample with a higher Tm3+ concentration seemed to be related to a saturation effect on the Tm3+ absorption at 808 nm.
The heat dissipation could be modelled following the classical Fourier law, resulting in a temperature increase given by:286,287
 | (52) |
By fitting this equation to the heating curve of the 1 at% Ho3+, 5 at% Tm3+:KLu(WO4)2 particles in contact with air, presented in Fig. 56(c), a temperature increase ΔTm = 18.3 ± 0.2 K and a thermal time constant τ = 0.223 ± 0.004 s were obtained, corresponding to a thermal resistance of R = (9.50 ± 0.17) × 107 K W−1.150 In addition, the extraction of τ allowed for the determination of the temporal resolution of the luminescent nanothermometers, δT = 0.0033 ± 0.0007 s, calculated using eqn (5), (2)–(4), orders of magnitude faster than the thermometers based on scanning thermal microscopy (0.1 s,288 and 1.5 s),289,290 and Raman spectroscopy (90 s).291
8. Concluding remarks
Lanthanide-doped luminescent materials have triggered the development of highly sensitive luminescent thermometers, particularly if the operating regime of their emissions is located within the BWs. In this review, several strategies towards obtaining better temperature-sensing performances within the BWs have been analyzed.Hence, for the choice of the excitation wavelength, the selection of a NIR source is highly recommended, allowing for deeper penetration depths and better temperature readings, implying no phototoxicity or photobleaching effects, enhancing significantly the interest in these luminescent thermometers in biological/biomedical applications. Related to the choice of hosts for the Ln3+ ions, a strategy that results in highly sensitive thermometers is the use of active core@active shell nanostructures. Another choice is the combination of the emissions of Ln3+ ions with those arising from transition metal ions or quantum dots, acting as a reference and as highly thermally quenched probes, respectively. Also, coating Ln3+-doped nanothermometers with an inert shell (including silica) can result in higher intensities and better temperature-sensing performances due to the reduced thermal quenching resulting from the influence of surface defects and ligands. Related to the choice of the Ln3+ ions, a proper selection of the concentration of the ion to be used and the operating biological window in which one wants to work is required. The intentional introduction of impurities inside the hosts (such as in the case of Y3+ in Nd3+:CaF2,245,276 or Gd3+ in Nd3+:SrF2)163 might lead to reduced thermal quenching effects, and upon a proper selection of the concentration of these impurities, to a better thermometric performance. In terms of Ln3+ ions included as emitters, Nd3+ and Tm3+ are the ones that attracted most of the attention (Table 1 for example). Nevertheless, a better choice for efficient luminescent nanothermometers is that constituted by dual emitting centers, since they provide better thermal sensitivity and allow the incorporation of multifunctionalities in these nanoparticles.
Despite the big number of works devoted to the development of luminescent thermometers operating in the BW spectral ranges, and the demonstration of amazing applications for them, there are still challenges that remain unsolved. From the synthetic point of view, a vast amount of research is devoted to the synthesis of fluoride-doped hosts, either in the form of bare, core@shell or multishell nanostructures, through the thermal decomposition of trifluoroacetate precursors to achieve control over their sizes and shapes. This synthetic approach suffers from the toxicity of the by-products and final products generated in the reactions,103 and an additional surface functionalization of the obtained nanoparticles is required for their potential use in biomedical applications.103 Therefore, new synthetic routes towards biocompatible nanomaterials are highly desirable. Furthermore, new choices for hosts for the Ln3+ ions should also be proposed.
Concerning the thermometric performance of the Ln3+-doped luminescent nanothermometers, clearly some discrepancies in the evaluation of their performances (calculation of the thermometric parameter or Srel) appear. In this way, it would be recommended that all authors follow the same procedures in order to be able to compare properly the performance of the different luminescent thermometers proposed. Additional strategies to boost the thermal sensitivity of the Ln3+-doped nanothermometers, such as the use of induced structural stress by lattice self-adaptation in heterojunctions producing a lattice distortion at the interface between two materials,292 dopant-induced local site symmetry distortions,293 and the effect of anisotropic interfacial strain in mismatched core–shell nanoparticles,294 which are sensitive to temperature changes, are really interesting. Up to now, these strategies have only been applied for luminescence thermometry in the visible range, and thus attempts to implement these strategies within the biological window spectral regions should be considered.
In addition, besides Srel and δT, a very low number of publications reported about their resolution (either spatial or temporal), reproducibility and repeatability. These parameters are also important to facilitate the implementation of the Ln3+-doped luminescent thermometers in real biological/biomedical applications outside of laboratories. Another very important parameter that should be taken into account when developing a novel luminescent thermometer is the quantum yield, both absolute and relative. A good quantum yield would allow for an easier detection scheme for the emissions generated by the luminescent thermometers by using cheaper detectors and lower laser excitation powers, simplifying also the protocols of use of these luminescent nanoparticles, and facilitating their use by non-experts in these subjects. As can be seen in this review, the absolute quantum yield has not been yet reported for any Ln3+-doped luminescent thermometer. Thus, an additional effort is required to take this parameter into account.
From Tables 1–5 presented in this review, it can be noted that an important number of the luminescent thermometers presented are based on using Yb3+ ion as a sensitizer. Lanthanide ions such as Er3+ or Tm3+ are typically encountered in materials co-doped with Yb3+ in order to enhance the intensity of their photoluminescence since Yb3+ presents a strong absorption band at around 980 nm, with an absorption cross section higher than that of these ions. However, the use of this excitation source is not suitable for biological/biomedical applications due to the self-heating effects generated by the absorption of the energy of the excitation source by water present in the biological tissues through the absorption band of this molecule at the same wavelength.148 Different strategies have been developed to substitute this excitation source in order to make lanthanide-doped nanomaterials more biological tissue-friendly. It is worth mentioning the replacement of Yb3+ by Nd3+ or Tm3+ ions acting as sensitizers. The absorption cross section of Nd3+ at 800 nm (≈10−19 cm2) is one order of magnitude higher than that of Yb3+ at 980 nm (≈10−20 cm2).204 Furthermore, at this wavelength the absorption coefficient of water is around 20 times smaller than that at 980 nm.206 In this way, the overheating effect in biological tissues can be highly reduced. Concerning the choice of Tm3+ as a sensitizer, a successful strategy has been successfully developed by co-doping these systems with Ho3+.150,266 Tm3+ has a strong absorption band at 808 nm that can be directly pumped by diode lasers, and the energy transfer processes between Tm3+ and Ho3+ allow use of the emissions of these two ions for luminescence thermometry purposes.295 Hence, these combinations of Ln3+ ions are highly attractive for biomedical applications.
From the biological/biomedical applications point of view, the studies published up to now are mostly focused on the II-BW spectral region because of the deeper penetration depths that can be achieved. However, according to Naczynski et al.126 and other recent publications, this parameter should be even better at longer wavelengths,296 in the III- and IV-BW spectral ranges. Therefore, these spectral regions should be further explored in the future.
In this context, luminescence thermometers fully operative within the BWs, especially those excited within the II, III and IV BWs, and generating emissions in the same spectral regions, would be very important to advance towards their real application in the biomedical field, because they will allow for a deeper penetration depth in biological tissues105,123,124 that would allow for a full diagnosis and treatment of diseases. Nevertheless, the research work done in this area is very scarce, and the number of lanthanide ions that can be used for this purpose is limited. In fact, the Ln3+ ions which can fulfill these conditions are mainly Tm3+ and Er3+ due to their ability to absorb energy within these BW regions (Tm3+ at 1210 nm,297 1319 nm,128 and 1640 nm,297 and Er3+ at 1500–1550 nm).298 This strategy has been successfully applied in in vivo biosensing applications by combining Er3+ with other lanthanide ions, such as Ho3+ and Nd3+, in NaErF4@NaYF4:Ho@NaYF4 or NaErF4@NaYF4:Nd@NaYF4 core–shell nanoarchitectures, and taking advantage of their emissions located in the II-BW (1180 nm of Ho3+, 1060 nm of Nd3+, and 980 nm of Er3+) after the energy of the 1530 nm excitation source was absorbed by Er3+.298 Furthermore, it has been confirmed that the penetration depth in biological tissues (in chicken pectoral muscle in that particular case) is two times higher when using an excitation source at 1319 nm than when using a 800 nm excitation source in Tm3+-doped nanoparticles.128
In addition, for the biological/biomedical applications, the biological tissues in which these luminescent thermometers have been applied are different (chicken breast,63,166,171,174,245,266,299 pork fat,164,300 phantom tissue,157,163,301 or mice126,223,302), leading to different and non-comparable penetration depths (Fig. 57) due to the different responses to the interaction with the light of their biological components. Thus, extensive research should be developed to understand the similarities and differences in the interaction of light with the different biological tissues to extract reliable conclusions in this area. Nevertheless, and regardless of the nature of the biological tissue, when operating at longer wavelengths, in general, the penetration depth increased, considering only those examples in which chicken breast was used as a subject of study, as can be seen in Fig. 57. Also from this figure, it can be seen that the majority of the luminescent nanothermometers developed up to now operating within the BW spectral ranges, including also these materials used only to determine the penetration depth in biological tissues, were based on Nd3+-doped materials, when other choices are also possible, like the combination of Ho3+ and Tm3+ ions, for instance, to develop multifunctional nanoparticles such as self-assessed photothermal agents.
Nevertheless, there are some current challenges for luminescent nanothermometers when used inside biological tissues that should be addressed for future biomedical applications, such as the distortion of the shape of the spectra recorded for these luminescent nanothermometers produced when they are recorded through the biological tissues.303 Possible solutions for this drawback could be the calibration of the luminescent nanothermometers when already embedded in the biological medium, as proposed recently by Shen et al.303 or the use of lifetime luminescence nanothermometry, which is not affected by changes in the optical properties of the surrounding medium, including biological tissues, by the concentration of the luminescent nanothermometers or by the excitation power density used.227
Furthermore, in in vitro applications, concepts related to the temperature flocculation at the nanoscale, the disagreement between the calculated and the experimental temperature, and the understanding of the thermal conductivity in a cell,304 should be addressed. In fact, the discrepancies in in vitro applications could also affect the in vivo applications.304
Finally, another research direction that should be further taken into account would be exploring the application of these luminescent thermometers outside the biological/biomedical fields, since their reported applicability in this direction is scarce.
As a final note, we would like to highlight, according to all the data analyzed in this review, which strategies would provide a better performance for the luminescent nanothermometers operating in the BWs. It is clear that to maximize the relative thermal sensitivity of the luminescent thermometer, and consequently minimize the temperature resolution, the most effective strategy consists of maximizing the separation between the emission lines used in the thermometer when the band-shape luminescent thermometry method is used. If this is done by using emissions arising from two non-thermally coupled electronic levels that are apart a distance higher than the upper limit defining the thermally coupled range of energies, the performance of the thermometer would be even better. In fact, by combining two different emission centers, and especially if emissions arising from transition metals are involved, the highest thermal sensitivities reported up to now are achieved, although these systems are quite complex, and we still have a low understanding of the factors that govern the temperature-sensing properties. Nevertheless, there are other aspects that have to be taken into account to develop efficient and practical luminescent nanothermometers, such as the use of emission lines with similar intensities in the thermometer, that would facilitate their recording and analysis with enough guarantees. Another important aspect to consider, especially when developing these luminescent thermometers for biological/biomedical applications, is that the maximum of their relative thermal sensitivity should be in the range of 350–400 K, and not at room temperature, as happens with the majority of the luminescent thermometers developed up to now. All these aspects are important to analyze when considering developing luminescent thermometers operating in the III- and IV-BW, where the Srel achieved up to now is still low, although the number of publications devoted to developing luminescence thermometers in this spectral range is still very low, or null in the case of the IV-BW.
After this analysis, we believe that working with Nd3+ and Ho3+,Tm3+-doped and codoped materials is a promising approach to not only promote the thermometric performance of the luminescent nanothermometers, but also to develop multifunctional platforms that can combine thermal sensing and photothermal therapy, for instance. Furthermore, using lifetime thermometry in these systems would allow current challenges on the biomedical application of these materials to be addressed, such as the spectral distortion. Finally, novel strategies towards the challenge of increasing the low brightness of Ln3+-doped materials should also be addressed. Up to now core–shell and core–multishell nanoarchitectures offered a boost in the brightness of the emissions generated by lanthanide ions and a significant enhancement of their temperature-sensing performance. However, other strategies that can improve this brightness, such as pairing them with plasmonic structures, use of organic-dye sensitization, and/or coupling them with semiconductors,107,108 might be explored.
Conflicts of interest
There are no conflicts to declare.Acknowledgements
This work was supported by the Spanish Government under projects MAT2016-75716-C2-1-R (AEI/FEDER, UE) and by the Generalitat de Catalunya under project 2017SGR755. A. N. acknowledges financial support from the Generalitat de Catalunya under grant 2017FI_B00620, 2018FI_B100161 and 2019 FI_B2 00154.References
- S. W. Allison and G. T. Gillies, Rev. Sci. Instrum., 1997, 68, 2615–2650 CrossRef CAS.
- A. H. Khalid and K. Kontis, Sensors, 2008, 8, 5673–5744 CrossRef CAS PubMed.
- S. Uchiyama, C. Gota, T. Tsuji and N. Inada, Chem. Commun., 2017, 53, 10976–10992 RSC.
- D. Jaque, L. Martínez-Maestro, B. del Rosal, P. Haro-Gonzalez, A. Benayas, J. L. Plaza, E. Martín-Rodríguez and J. García-Solé, Nanoscale, 2014, 6, 9494–9530 RSC.
- K. M. McCabe and M. Hernandez, Pediatr. Res., 2010, 67, 469–475 CrossRef PubMed.
- O. S. Wolfbeis, Adv. Mater., 2008, 20, 3759–3763 CrossRef CAS.
- P. R. Childs, J. Greenwood and C. Long, Rev. Sci. Instrum., 2000, 71, 2959–2978 CrossRef CAS.
- Grand View Research Inc., https://www.marketsandmarkets.com/Market-Reports/temperature-sensor-market-522.html (accessed on 10 July 2020).
- Y. Yue and X. Wang, Nano Rev., 2012, 3, 11586–11597 CrossRef PubMed.
- D. Jaque and F. Vetrone, Nanoscale, 2012, 4, 4301–4326 RSC.
- S. S. Laha, A. R. Naik, E. R. Kuhn, M. Alvarez, A. Sujkowski, R. J. Wessells and B. P. Jena, Nano Lett., 2017, 17, 1262–1268 CrossRef CAS PubMed.
- X. Wang, O. S. Wolfbeis and R. J. Meier, Chem. Soc. Rev., 2013, 42, 7834–7869 RSC.
- M. Quintanilla and L. M. Liz-Marzan, Nano Today, 2018, 19, 126–145 CrossRef CAS.
- A. E. Albers, E. M. Chan, P. M. McBride, C. M. Ajo-Franklin, B. E. Cohen and B. A. Helms, J. Am. Chem. Soc., 2012, 134, 9565–9568 CrossRef CAS PubMed.
- U. Rocha, C. Jancito, W. F. Silva, I. Guedes, A. Benayas, L. Martínez-Maestro, M. Acosta-Elias, E. Bovero, F. C. J. M. van Veggel, J. García-Solé and D. Jaque, ACS Nano, 2013, 7, 1188–1199 CrossRef CAS PubMed.
- K. Okabe, N. Inada, C. Gota, Y. Harada, T. Funatsu and S. Uchiyama, Nat. Commun., 2012, 3, 705 CrossRef PubMed.
- P. R. N. Childs, in Thermometry at the Nanoscale: Techniques and Selected Applications, ed. L. D. Carlos and F. Palacio, The Royal Society of Chemistry, Cambridge, 2016, ch. 1, vol. 38, pp. 1–22 Search PubMed.
- R. J. DeBerardinis, J. J. Lum, G. Hatzivassiliou and C. B. Thompson, Cell Metab., 2008, 7, 11–20 CrossRef CAS PubMed.
- M. Karnebogen, D. Singer, M. Kallerhoff and R. H. Ringert, Thermochim. Acta, 1993, 229, 147–155 CrossRef.
- G. A. Sotiriou, F. Starsich, A. Dasargyri, M. C. Wurnig, F. Krumeich, A. Boss, J. C. Leroux and S. E. Pratsinis, Adv. Funct. Mater., 2014, 24, 2818–2827 CrossRef CAS.
- C. D. S. Brites, A. Millán and L. D. Carlos, in Handbook on the Physics and Chemistry of Rare Earths, ed. B. Jean-Claude and P. K. Vitalij, Elsevier, 2016, vol. 49, pp. 339–427 Search PubMed.
- F. Vetrone, R. Naccache, A. Zamarrón, A. J. de la Fuente, F. Sanz-Rodríguez, L. Martínez-Maestro, E. Martín-Rodríguez, D. Jaque, J. García-Solé and J. A. Capobianco, ACS Nano, 2010, 4, 3254–3258 CrossRef CAS PubMed.
- R. Sakaguchi, S. Kiyonaka and Y. Mori, Curr. Opin. Biotechnol., 2015, 31, 57–64 CrossRef CAS PubMed.
- D. G. Cahill, Rev. Sci. Instrum., 2004, 75, 5119–5122 CrossRef CAS.
- P. Löw, B. Kim, N. Takama and C. Bergaud, Small, 2008, 4, 908–914 CrossRef PubMed.
- S. H. Kim, J. Noh, M. K. Jeon, K. W. Kim, L. P. Lee and S. I. Woo, J. Micromech. Microeng., 2006, 16, 526–530 CrossRef CAS.
- M. Corke, A. D. Kersey, D. A. Jackson and J. D. C. Jones, Electron. Lett., 1983, 19, 471–473 CrossRef.
- K. Kim, W. Jeong, W. Lee and P. Reddy, ACS Nano, 2012, 6, 4248–4257 CrossRef CAS PubMed.
- J. R. Greenwood, P. R. N. Childs and P. Chaloner, Gold Bull., 1999, 32, 85–89 CrossRef CAS.
- Y. Gao and Y. Bando, Nature, 2002, 415, 599–599 CrossRef CAS PubMed.
- B. Klinkert and F. Narberhaus, Cell. Mol. Life Sci., 2009, 66, 2661–2676 CrossRef CAS PubMed.
- G. Mills, H. Zhou, A. Midha, L. Donaldson and J. M. R. Weaver, Appl. Phys. Lett., 1998, 72, 2900–2902 CrossRef CAS.
- A. Hammiche, M. Reading, H. M. Pollock, M. Song and D. J. Hourston, Rev. Sci. Instrum., 1996, 67, 4268–4274 CrossRef CAS.
- P. D. Tovee, M. E. Pumarol, M. C. Rosamond, R. Jones, M. C. Petty, D. A. Zeze and O. V. Kolosov, Phys. Chem. Chem. Phys., 2014, 16, 1174–1181 RSC.
- J. Kortmann, S. Sczodrok, J. Rinnenthal, H. Schwalbe and F. Narberhaus, Nucleic Acids Res., 2011, 39, 2855–2868 CrossRef CAS PubMed.
- F. Narberhaus, T. Waldminghaus and S. Chowdhury, FEMS Microbiol. Rev., 2006, 30, 3–16 CrossRef CAS PubMed.
- S. Chowdhury, C. Maris, F. H. T. Allain and F. Narberhaus, EMBO J., 2006, 25, 2487–2497 CrossRef CAS PubMed.
- C. D. S. Brites, P. P. Lima, N. J. O. Silva, A. Millán, V. S. Amaral, F. Palacio and L. D. Carlos, Nanoscale, 2012, 4, 4799–4829 RSC.
- D. Ananias, C. D. S. Brites, L. D. Carlos and J. Rocha, Eur. J. Inorg. Chem., 2016, 2016, 1967–1971 CrossRef CAS.
- M. A. Omary and H. H. Patterson, in Encyclopedia of Spectroscopy and Spectrometry, ed. J. C. Lindon, G. E. Tranter and D. W. Koppenaal, Academic Press, Oxford, 3rd edn, 2017, pp. 636–653 Search PubMed.
- J. A. DeLuca, J. Chem. Educ., 1980, 57, 541–545 CrossRef CAS.
- S. A. Wade, S. F. Collins and G. W. Baxter, J. Appl. Phys., 2003, 94, 4743–4756 CrossRef CAS.
- B. Dong, B. Cao, Y. He, Z. Liu, Z. Li and Z. Feng, Adv. Mater., 2012, 24, 1987–1993 CrossRef CAS PubMed.
- F. Hu, J. Cao, X. Wei, X. Li, J. Cai, H. Guo, Y. Chen, C. K. Duan and M. Yin, J. Mater. Chem. C, 2016, 4, 9976–9985 RSC.
- M. Leroux, N. Grandjean, B. Beaumont, G. Nataf, F. Semond, J. Massies and P. Gibart, J. Appl. Phys., 1999, 86, 3721–3728 CrossRef CAS.
- N. Ishiwada, S. Fujioka, T. Ueda and T. Yokomori, Opt. Lett., 2011, 36, 760–762 CrossRef CAS PubMed.
- M. Quintanilla, A. Benayas, R. Naccache and F. Vetrone, in Thermometry at the Nanoscale: Techniques and Selected Applications, ed. L. D. Carlos and F. Palacio, The Royal Society of Chemistry, Cambridge, 2016, ch. 5, vol. 38, pp. 124–166 Search PubMed.
- C. D. S. Brites, S. Balabhadra and L. D. Carlos, Adv. Opt. Mater., 2019, 7, 1801239–1801269 CrossRef.
- X. He, J. Gao, S. S. Gambhir and Z. Cheng, Trends Mol. Med., 2010, 16, 574–583 CrossRef CAS PubMed.
- J. S. Donner, S. A. Thompson, M. P. Kreuzer, G. Baffou and R. Quidant, Nano Lett., 2012, 12, 2107–2111 CrossRef CAS PubMed.
- V. V. Nazarenko, A. Remeeva, A. Yudenko, K. Kovalev, A. Dubenko, I. M. Goncharov, P. Kuzmichev, A. V. Rogachev, P. Buslaev, V. Borshchevskiy, A. Mishin, G. V. Dhoke, U. Schwaneberg, M. D. Davari, K. E. Jaeger, U. Krauss, V. Gordeliy and I. Gushchin, Photochem. Photobiol. Sci., 2019, 18, 1793–1805 CrossRef CAS PubMed.
- O. A. Savchuk, O. F. Silvestre, R. M. R. Adão and J. B. Nieder, Sci. Rep., 2019, 9, 7535–7546 CrossRef PubMed.
- S. Kiyonaka, T. Kajimoto, R. Sakaguchi, D. Shinmi, M. Omatsu-Kanbe, H. Matsuura, H. Imamura, T. Yoshizaki, I. Hamachi, T. Morii and Y. Mori, Nat. Methods, 2013, 10, 1232–1238 CrossRef CAS PubMed.
- M. Nakano, Y. Arai, I. Kotera, K. Okabe, Y. Kamei and T. Nagai, PLoS One, 2017, 12, 172344–172358 Search PubMed.
- C. Gota, K. Okabe, T. Funatsu, Y. Harada and S. Uchiyama, J. Am. Chem. Soc., 2009, 131, 2766–2767 CrossRef CAS PubMed.
- T. Hayashi, K. Kawamoto, N. Inada and S. Uchiyama, Polymers, 2019, 11, 1305–1317 CrossRef CAS PubMed.
- S. Uchiyama, T. Tsuji, K. Kawamoto, K. Okano, E. Fukatsu, T. Noro, K. Ikado, S. Yamada, Y. Shibata, T. Hayashi, N. Inada, M. Kato, H. Koizumi and H. Tokuyama, Angew. Chem., Int. Ed., 2018, 57, 5413–5417 CrossRef CAS PubMed.
- S. M. Borisov and O. S. Wolfbeis, Anal. Chem., 2006, 78, 5094–5101 CrossRef CAS PubMed.
- C. Tan and Q. Wang, Inorg. Chem. Commun., 2011, 14, 515–518 CrossRef CAS.
- H. Peng, M. I. J. Stich, J. Yu, L. Sun, L. H. Fischer and O. S. Wolfbeis, Adv. Mater., 2010, 22, 716–719 CrossRef CAS PubMed.
- X. Zhu, W. Feng, J. Chang, Y. W. Tan, J. Li, M. Chen, Y. Sun and F. Li, Nat. Commun., 2016, 7, 10437–10447 CrossRef CAS PubMed.
- Y. Takei, S. Arai, A. Murata, M. Takabayashi, K. Oyama, S. Ishiwata, S. Takeoka and M. Suzuki, ACS Nano, 2014, 8, 198–206 CrossRef CAS PubMed.
- E. N. Cerón, D. H. Ortgies, B. del Rosal, F. Ren, A. Benayas, F. Vetrone, D. Ma, F. Sanz-Rodríguez, J. G. Solé, D. Jaque and E. M. Rodríguez, Adv. Mater., 2015, 27, 4781–4787 CrossRef PubMed.
- C. D. S. Brites, P. P. Lima, N. J. O. Silva, A. Millán, V. S. Amaral, F. Palacio and L. D. Carlos, Adv. Mater., 2010, 22, 4499–4504 CrossRef CAS PubMed.
- T. Sekiguchi, S. Sotoma and Y. Harada, Biophys. Physicobiol., 2018, 15, 229–234 CrossRef CAS PubMed.
- Y. K. Tzeng, P. C. Tsai, H. Y. Liu, O. Y. Chen, H. Hsu, F. G. Yee, M. S. Chang and H. C. Chang, Nano Lett., 2015, 15, 3945–3952 CrossRef CAS PubMed.
- G. Kucsko, P. C. Maurer, N. Y. Yao, M. Kubo, H. J. Noh, P. K. Lo, H. Park and M. D. Lukin, Nature, 2013, 500, 54–58 CrossRef CAS PubMed.
- Z. Wang, D. Ananias, A. Carné-Sánchez, C. D. S. Brites, I. Imaz, D. Maspoch, J. Rocha and L. D. Carlos, Adv. Funct. Mater., 2015, 25, 2824–2830 CrossRef CAS.
- D. Zhao, X. Rao, J. Yu, Y. Cui, Y. Yang and G. Qian, Inorg. Chem., 2015, 54, 11193–11199 CrossRef CAS PubMed.
- J. Rocha, C. D. S. Brites and L. D. Carlos, Chem. – Eur. J., 2016, 22, 14782–14795 CrossRef CAS PubMed.
- Y. Cui, F. Zhu, B. Chen and G. Qian, Chem. Commun., 2015, 51, 7420–7431 RSC.
- N. Chandrasekharan and L. A. Kelly, J. Am. Chem. Soc., 2001, 123, 9898–9899 CrossRef CAS PubMed.
- J. Feng, K. Tian, D. Hu, S. Wang, S. Li, Y. Zeng, Y. Li and G. Yang, Angew. Chem., Int. Ed., 2011, 50, 8072–8076 CrossRef CAS PubMed.
- R. Samy, T. Glawdel and C. L. Ren, Anal. Chem., 2008, 80, 369–375 CrossRef CAS PubMed.
- R. Victor, P. Woisel and R. Hoogenboom, Mater. Today, 2016, 19, 44–55 CrossRef.
- C. Pietsch, U. S. Schubert and R. Hoogenboom, Chem. Commun., 2011, 47, 8750–8765 RSC.
- V. A. Vlaskin, N. Janssen, J. van Rijssel, R. Beaulac and D. R. Gamelin, Nano Lett., 2010, 10, 3670–3674 CrossRef CAS PubMed.
- L. M. Maestro, E. M. Rodríguez, F. S. Rodríguez, M. C. I. la Cruz, A. Juarranz, R. Naccache, F. Vetrone, D. Jaque, J. A. Capobianco and J. G. Solé, Nano Lett., 2010, 10, 5109–5115 CrossRef CAS PubMed.
- L. M. Maestro, C. Jacinto, U. R. Silva, F. Vetrone, J. A. Capobianco, D. Jaque and J. G. Solé, Small, 2011, 7, 1774–1778 CrossRef CAS PubMed.
- P. Haro-González, W. T. Ramsay, L. Martínez-Maestro, B. del Rosal, K. Santacruz-Gomez, M. C. I. de la Cruz, F. Sanz-Rodríguez, J. Y. Chooi, P. R. Sevilla and M. Bettinelli, Small, 2013, 9, 2162–2170 CrossRef PubMed.
- S. Li, K. Zhang, J. M. Yang, L. Lin and H. Yang, Nano Lett., 2007, 7, 3102–3105 CrossRef CAS PubMed.
- X. Wang, Q. Liu, Y. Bu, C. S. Liu, T. Liu and X. Yan, RSC Adv., 2015, 5, 86219–86236 RSC.
- S. Kiyonaka, R. Sakaguchi, I. Hamachi, T. Morii, T. Yoshizaki and Y. Mori, Nat. Methods, 2015, 12, 801–802 CrossRef CAS PubMed.
- G. Baffou, H. Rigneault, D. Marguet and L. Jullien, Nat. Methods, 2014, 11, 899–901 CrossRef CAS PubMed.
- K. S. Soni, S. S. Desale and T. K. Bronich, J. Controlled Release, 2016, 240, 109–126 CrossRef CAS PubMed.
- E. Hemmer, A. Benayas, F. Légaré and F. Vetrone, Nanoscale Horiz., 2016, 1, 168–184 RSC.
- A. Rassamesard, Y. F. Huang, H. Y. Lee, T. S. Lim, M. C. Li, J. D. White, J. H. Hodak, T. Osotchan, K. Y. Peng, S. A. Chen, J. H. Hsu, M. Hayashi and W. Fann, J. Phys. Chem. C, 2009, 113, 18681–18688 CrossRef CAS.
- R. A. Bohara, in Hybrid Nanostructures for Cancer Theranostics, ed. R. Ashok Bohara and N. Thorat, Elsevier, 2019, ch. 1, pp. 1–16 Search PubMed.
- D. Jaque, B. del Rosal, E. Martín-Rodríguez, L. Martinez Maestro, P. Haro-González and J. García-Solé, Nanomedicine, 2014, 9, 1047–1062 CrossRef CAS PubMed.
- B. del Rosal, E. Ximendes, U. Rocha and D. Jaque, Adv. Opt. Mater., 2017, 5, 1600508–1600522 CrossRef.
- M. H. Alkahtani, F. Alghannam, L. Jiang, A. Almethen, A. A. Rampersaud, R. Brick, C. L. Gomes, M. O. Scully and P. R. Hemmer, Nanophotonics, 2018, 7, 1423–1454 CAS.
- C. Bradac, S. F. Lim, H. C. Chang and I. Aharonovich, Adv. Opt. Mater., 2020, 8, 2000183–2000212 CrossRef CAS.
- E. Petryayeva, W. R. Algar and I. L. Medintz, Appl. Spectrosc., 2013, 67, 215–252 CrossRef CAS PubMed.
- H. Zhao, A. Vomiero and F. Rosei, Small, 2020, 16, 2000804–2000822 CrossRef CAS PubMed.
- K. M. Tsoi, Q. Dai, B. A. Alman and W. C. W. Chan, Acc. Chem. Res., 2013, 46, 662–671 CrossRef CAS PubMed.
- X. Qiu, X. Zhu, X. Su, M. Xu, W. Yuan, Q. Liu, M. Xue, Y. Liu, W. Feng and F. Li, Adv. Sci., 2019, 6, 1801834–1801842 CrossRef PubMed.
- A. Teitelboim and D. Oron, ACS Nano, 2016, 10, 446–452 CrossRef CAS.
- D. Jaque and J. G. Solé, in Thermometry at the Nanoscale: Techniques and Selected Applications, ed. L. D. Carlos and F. Palacio, The Royal Society of Chemistry, Cambridge, 2016, ch. 4, vol. 38, pp. 83–123 Search PubMed.
- J. C. G. Buenzli and S. V. Eliseeva, Chem. Sci., 2013, 4, 1939–1949 RSC.
- L. D. Carlos, R. A. Ferreira, V. d. Z. Bermudez and S. J. Ribeiro, Adv. Mater., 2009, 21, 509–534 CrossRef CAS PubMed.
- J. Zhou, J. L. Leano Jr., Z. Liu, D. Jin, K. L. Wong, R. S. Liu and J. C. G. Bünzli, Small, 2018, 14, 1801882–1801911 CrossRef PubMed.
- G. Chen, C. Yang and P. N. Prasad, Acc. Chem. Res., 2013, 46, 1474–1486 CrossRef CAS PubMed.
- A. Gnach, T. Lipinski, A. Bednarkiewicz, J. Rybka and J. A. Capobianco, Chem. Soc. Rev., 2015, 44, 1561–1584 RSC.
- R. R. Anderson and J. A. Parrish, J. Invest. Dermatol., 1981, 77, 13–19 CrossRef CAS PubMed.
- A. M. Smith, M. C. Mancini and S. Nie, Nat. Nanotechnol., 2009, 4, 710–711 CrossRef CAS PubMed.
- J. C. G. Bünzli, Acc. Chem. Res., 2006, 39, 53–61 CrossRef PubMed.
- R. Marin, D. Jaque and A. Benayas, Nanoscale Horiz., 2021, 6, 209–230 RSC.
- R. Marin and D. Jaque, Chem. Rev., 2021, 121, 1425–1462 CrossRef CAS PubMed.
- P. V. d. Santos, M. T. d. Araujo, A. S. Gouveia-Neto, J. A. M. Neto and A. S. B. Sombra, Appl. Phys. Lett., 1998, 73, 578–580 CrossRef.
- S. Collins, G. Baxter, S. Wade, T. Sun, K. Grattan, Z. Zhang and A. W. Palmer, J. Appl. Phys., 1998, 84, 4649–4654 CrossRef CAS.
- S. N. Baker, T. M. McCleskey and G. A. Baker, in Ionic Liquids IIIB: Fundamentals, Progress, Challenges, and Opportunities, American Chemical Society, 2005, ch. 14, vol. 902, pp. 171–181 Search PubMed.
- O. A. Savchuk, J. J. Carvajal, C. Cascales, M. Aguiló and F. Díaz, ACS Appl. Mater. Interfaces, 2016, 8, 7266–7273 CrossRef CAS PubMed.
- J. W. Bartlett and C. Frost, Ultrasound Obstet. Gynecol, 2008, 31, 466–475 CrossRef CAS PubMed.
- B. N. Taylor and C. E. Kuyatt, Guidelines for evaluation and expressing the uncertainty of NIST Measurement Results (NIST Technical Note 1297), 1994 Search PubMed.
- J. J. Carvajal, O. Savchuk, A. Nexha, M. C. Pujol, M. Aguiló and F. Díaz, Expanding luminescence thermometry detection range to the SWIR for biomedical applications, Optical Sensing and Detection V, SPIE, Strasbourg, France, 2018, p. 34 Search PubMed.
- Y. T. Lim, S. Kim, A. Nakayama, N. E. Stott, M. G. Bawendi and J. V. Frangioni, Mol. Imaging, 2003, 2, 50–64 CrossRef CAS PubMed.
- G. Zonios, J. Bykowski and N. Kollias, J. Invest. Dermatol., 2001, 117, 1452–1457 CrossRef CAS PubMed.
- G. M. Hale and M. R. Querry, Appl. Opt., 1973, 12, 555–563 CrossRef CAS PubMed.
- S. Prahl, Optical absorption of hemoglobin, http://omlc.ogi.edu/spectra/hemoglobin, (accessed on 14 October 2020).
- S. L. Jacques and D. J. McAuliffe, Photochem. Photobiol., 1991, 53, 769–775 CrossRef CAS PubMed.
- L. V. Wang and H. Wu, Biomedical optics: principles and imaging, John Wiley & Sons, 2012 Search PubMed.
- S. Jacques, Phys. Med. Biol., 2013, 58, 37–61 CrossRef PubMed.
- M. Chaplin, Water Structure and Science, 2016. Available online: http://www.1.lsbu.ac.uk/water/water_vibrational_spectrum.html (accessed on 14 October 2020).
- L. Shi, L. A. Sordillo, A. Rodríguez-Contreras and R. Alfano, J. Biophotonics, 2016, 9, 38–43 CrossRef CAS PubMed.
- B. del Rosal, I. Villa, D. Jaque and F. Sanz-Rodríguez, J. Biophotonics, 2016, 9, 1059–1067 CrossRef CAS PubMed.
- D. J. Naczynski, M. C. Tan, M. Zevon, B. Wall, J. Kohl, A. Kulesa, S. Chen, C. M. Roth, R. E. Riman and P. V. Moghe, Nat. Commun., 2013, 4, 2199–2209 CrossRef CAS PubMed.
- M. A. Hernandez-Rodriguez, A. D. Lozano-Gorrin, V. Lavin, U. R. Rodriguez-Mendoza and I. R. Martin, Opt. Express, 2017, 25, 27845–27856 CrossRef CAS PubMed.
- A. F. Pereira, J. Ferreira, A. S. Gouveia-Neto and C. Jacinto, Sens. Actuators, B, 2017, 238, 525–531 CrossRef CAS.
- F. Auzel, Chem. Rev., 2004, 104, 139–174 CrossRef CAS PubMed.
- Y. Chen, G. Chen, X. Liu, J. Xu, X. Zhou, T. Yang, C. Yuan and C. Zhou, Opt. Mater., 2018, 81, 78–83 CrossRef CAS.
- O. Savchuk, J. J. Carvajal, C. Cascales, P. Haro-Gonzalez, F. Sanz-Rodríguez, M. Aguilo and F. Diaz, Nanomaterials, 2020, 10, 993–1010 CrossRef CAS PubMed.
- M. Runowski, A. Shyichuk, A. Tymiński, T. Grzyb, V. Lavín and S. Lis, ACS Appl. Mater. Interfaces, 2018, 10, 17269–17279 CrossRef CAS PubMed.
- L. Xing, W. Yang, D. Ma and R. Wang, Sens. Actuators, B, 2015, 221, 458–462 CrossRef CAS.
- L. Li, F. Qin, Y. Zhou, Y. Zheng, H. Zhao and Z. Zhang, J. Lumin., 2018, 202, 301–308 CrossRef CAS.
- Y. Bu and X. H. Yan, Appl. Phys. B, 2017, 123, 59–69 CrossRef.
- W. Ge, M. Xu, J. Shi, J. Zhu and Y. Li, Chem. Eng. J., 2019, 391, 123546–123553 CrossRef.
- J. Zhang and C. Jin, Ind. Eng. Chem. Res., 2019, 58, 3490–3498 CrossRef CAS.
- J. Zhang, G. Chen, Z. Zhai, H. Chen and Y. Zhang, J. Alloys Compd., 2019, 771, 838–846 CrossRef CAS.
- L. Yu, L. Ye, R. Bao, X. Zhang and L. G. Wang, Opt. Commun., 2018, 410, 632–636 CrossRef CAS.
- N. Wang, Z. Fu, Y. Wei and T. Sheng, J. Alloys Compd., 2019, 772, 371–380 CrossRef CAS.
- E. Casagrande, M. Back, D. Cristofori, J. Ueda, S. Tanabe, S. Palazzolo, F. Rizzolio, V. Canzonieri, E. Trave and P. Riello, J. Mater. Chem. C, 2020, 8, 7828–7836 RSC.
- W. Chen, J. Cao, F. Hu, R. Wei, L. Chen and H. Guo, J. Alloys Compd., 2018, 735, 2544–2550 CrossRef CAS.
- Q. Min, W. Bian, Y. Qi, W. Lu, X. Yu, X. Xu, D. Zhou and J. Qiu, J. Alloys Compd., 2017, 728, 1037–1042 CrossRef CAS.
- H. Lu, J. Yang, D. Huang, Q. Zhou, M. Yang, X. Zhang, Y. Wang and H. Zhu, J. Lumin., 2018, 206, 613–617 CrossRef.
- Y. Fu, L. Zhao, Y. Guo and H. Yu, New J. Chem., 2019, 43, 16664–16669 RSC.
- P. Du, L. Luo and J. Yu, J. Alloys Compd., 2018, 739, 926–933 CrossRef CAS.
- A. Zhou, F. Song, F. Song, M. Feng, K. Adnan, D. Ju and X. Wang, Opt. Mater., 2018, 78, 438–444 CrossRef CAS.
- R. Wu, J. Zhou, L. Lei, S. Zhang, Z. Xiao, J. Zhang and S. Xu, Chem. Phys. Lett., 2017, 667, 206–210 CrossRef CAS.
- M. Ding, M. Zhang and C. Lu, Mater. Lett., 2017, 209, 52–55 CrossRef CAS.
- O. A. Savchuk, J. J. Carvajal, C. D. S. Brites, L. D. Carlos, M. Aguilo and F. Diaz, Nanoscale, 2018, 10, 6602–6610 RSC.
- H. Lu, H. Haoyue, Y. Gao, D. Li, G. Shi, Y. Song, Y. Wang and X. Zhang, Microchim. Acta, 2017, 184, 641–646 CrossRef CAS.
- H. Lu, H. Hao, G. Shi, Y. Gao, R. Wang, Y. Song, Y. Wang and X. Zhang, RSC Adv., 2016, 6, 55307–55311 RSC.
- D. Chen, S. Liu, X. Li, S. Yuan and P. Huang, J. Eur. Ceram. Soc., 2017, 37, 4939–4945 CrossRef CAS.
- M. Ding, D. Chen, C. Lu, J. Xi, Z. Ji and Z. Xu, Mater. Lett., 2017, 189, 5–8 CrossRef CAS.
- L. Marciniak, A. Bednarkiewicz, J. Drabik, K. Trejgis and W. Strek, Phys. Chem. Chem. Phys., 2017, 19, 7343–7351 RSC.
- G. Jiang, X. Wei, S. Zhou, Y. Chen, C. Duan and M. Yin, J. Lumin., 2014, 152, 156–159 CrossRef CAS.
- M. A. Hernández-Rodríguez, A. D. Lozano-Gorrín, I. R. Martín, U. R. Rodríguez-Mendoza and V. Lavín, Sens. Actuators, B, 2018, 255, 970–976 CrossRef.
- S. Balabhadra, M. L. Debasu, C. D. S. Brites, L. A. O. Nunes, O. L. Malta, J. Rocha, M. Bettinelli and L. D. Carlos, Nanoscale, 2015, 7, 17261–17267 RSC.
- M. Suta, Ž. Antić, V. Đorđević, S. Kuzman, M. D. Dramićanin and A. Meijerink, Nanomaterials, 2020, 10, 543–563 CrossRef CAS PubMed.
- E. A. Lalla, S. F. León-Luis, V. Monteseguro, C. Pérez-Rodríguez, J. M. Cáceres, V. Lavín and U. R. Rodríguez-Mendoza, J. Lumin., 2015, 166, 209–214 CrossRef CAS.
- P. Haro-González, I. R. Martín, L. L. Martín, S. F. León-Luis, C. Pérez-Rodríguez and V. Lavín, Opt. Mater., 2011, 33, 742–745 CrossRef.
- P. Huang, W. Zheng, D. Tu, X. Shang, M. Zhang, R. Li, J. Xu, Y. Liu and X. Chen, Adv. Sci., 2019, 6, 1802282–1802289 CrossRef PubMed.
- M. Pedroni, P. Cortelletti, I. X. Cantarelli, N. Pinna, P. Canton, M. Quintanilla, F. Vetrone and A. Speghini, Sens. Actuators, B, 2017, 250, 147–155 CrossRef CAS.
- A. Skripka, A. Morinvil, M. Matulionyte, T. Cheng and F. Vetrone, Nanoscale, 2019, 11, 11322–11330 RSC.
- L. Marciniak, A. Bednarkiewicz, D. Hreniak and W. Strek, J. Mater. Chem. C, 2016, 4, 11284–11290 RSC.
- I. E. Kolesnikov, A. A. Kalinichev, M. A. Kurochkin, D. V. Mamonova, E. Y. Kolesnikov, A. V. Kurochkin, E. Lähderanta and M. D. Mikhailov, J. Lumin., 2018, 204, 506–512 CrossRef CAS.
- L. Đačanin-Far, S. R. Lukić-Petrović, V. Đorđević, K. Vuković, E. Glais, B. Viana and M. D. Dramićanin, Sens. Actuators, A, 2018, 270, 89–96 CrossRef.
- E. Carrasco, B. del Rosal, F. Sanz-Rodríguez, Á. J. de la Fuente, P. H. Gonzalez, U. Rocha, K. U. Kumar, C. Jacinto, J. G. Solé and D. Jaque, Adv. Funct. Mater., 2015, 25, 615–626 CrossRef CAS.
- I. E. Kolesnikov, E. V. Golyeva, M. A. Kurochkin, E. Lähderanta and M. D. Mikhailov, Sens. Actuators, B, 2016, 235, 287–293 CrossRef CAS.
- G. Dantelle, M. Matulionyte, D. Testemale, A. Cantarano, A. Ibanez and F. Vetrone, Phys. Chem. Chem. Phys., 2019, 21, 11132–11141 RSC.
- A. Benayas, B. del Rosal, A. Pérez-Delgado, K. Santacruz-Gómez, D. Jaque, G. A. Hirata and F. Vetrone, Adv. Opt. Mater., 2015, 3, 687–694 CrossRef CAS.
- P. M. Gschwend, F. H. L. Starsich, R. C. Keitel and S. E. Pratsinis, Chem. Commun., 2019, 55, 7147–7150 RSC.
- D. Wawrzynczyk, A. Bednarkiewicz, M. Nyk, W. Strek and M. Samoc, Nanoscale, 2012, 4, 6959–6961 RSC.
- O. Savchuk, J. J. Carvajal, L. G. De la Cruz, P. Haro-González, M. Aguiló and F. Díaz, J. Mater. Chem. C, 2016, 4, 7397–7405 RSC.
- L. Marciniak, A. Pilch, S. Arabasz, D. Jin and A. Bednarkiewicz, Nanoscale, 2017, 9, 8288–8297 Search PubMed.
- W. Xu, H. Zhao, Z. Zhang and W. Cao, Sens. Actuators, B, 2013, 178, 520–524 CrossRef CAS.
- H. Song, Q. Han, X. Tang, X. Zhao, K. Ren and T. Liu, Opt. Mater., 2018, 84, 263–267 CrossRef CAS.
- W. Xu, Q. Song, L. Zheng, Z. Zhang and W. Cao, Opt. Lett., 2014, 39, 4635–4638 CrossRef CAS PubMed.
- A. F. Silva, F. Elan, E. L. Falcão-Filho, L. J. Q. Maia and C. B. de Araújo, J. Mater. Chem. C, 2017, 5, 1240–1246 RSC.
- W. Xu, H. Qi, L. Zheng, Z. Zhang and W. Cao, Opt. Lett., 2015, 40, 5678–5681 CrossRef PubMed.
- G. Gao, D. Busko, S. Kauffmann-Weiss, A. Turshatov, I. A. Howard and B. S. Richards, J. Mater. Chem. C, 2018, 6, 4163–4170 RSC.
- Z. Zhao, F. Hu, Z. Cao, F. Chi, X. Wei, Y. Chen, C. Duan and M. Yin, Ceram. Int., 2017, 43, 14951–14955 CrossRef CAS.
- I. Kolesnikov, D. Mamonova, A. Kalinichev, M. Kurochkin, V. Medvedev, E. Kolesnikov, E. Lahderanta and A. Manshina, Nanoscale, 2020, 12, 5953–5960 RSC.
- J. Drabik, B. Cichy and L. Marciniak, J. Phys. Chem. C, 2018, 122, 14928–14936 CrossRef CAS.
- K. Trejgis and L. Marciniak, Phys. Chem. Chem. Phys., 2018, 20, 9574–9581 RSC.
- A. S. Souza, L. A. O. Nunes, I. G. N. Silva, F. A. M. Oliveira, L. L. da Luz, H. F. Brito, M. C. F. C. Felinto, R. A. S. Ferreira, S. A. Júnior, L. D. Carlos and O. L. Malta, Nanoscale, 2016, 8, 5327–5333 RSC.
- K. Lu, Y. Yi, L. Xu, X. Sun, L. Liu and H. Li, Nanomaterials, 2020, 10, 24–36 CrossRef CAS PubMed.
- K. Lu, X. Sun, L. Xu, B. Jiang, J. Ren, J. J. Carvajal, E. Zhao, L. Liu and J. Zhang, J. Alloys Compd., 2020, 842, 155602–155610 CrossRef CAS.
- A. C. Brandão-Silva, M. A. Gomes, Z. S. Macedo, J. F. M. Avila, J. J. Rodrigues and M. A. R. C. Alencar, J. Phys. Chem. C, 2018, 122, 20459–20468 CrossRef.
- D. Chen, W. Xu, S. Yuan, X. Li and J. Zhong, J. Mater. Chem. C, 2017, 5, 9619–9628 RSC.
- M. Runowski, A. Bartkowiak, M. Majewska, I. R. Martín and S. Lis, J. Lumin., 2018, 201, 104–109 CrossRef CAS.
- A. Ćirić, J. Aleksić, T. Barudžija, Ž. Antić, V. Đorđević, M. Medić, J. Periša, I. Zeković, M. Mitrić and M. D. Dramićanin, Nanomaterials, 2020, 10, 627–637 CrossRef PubMed.
- J. Zhou, R. Lei, H. Wang, C. Chen, B. Chen, E. Pan, S. Zhao and S. Xu, ACS Appl. Nano Mater., 2020, 3, 186–194 CrossRef CAS.
- O. A. Savchuk, J. J. Carvajal, M. C. Pujol, E. W. Barrera, J. Massons, M. Aguilo and F. Diaz, J. Phys. Chem. C, 2015, 119, 18546–18558 CrossRef CAS.
- Z. Wang, H. Jiao and Z. Fu, Inorg. Chem., 2018, 57, 8841–8849 CrossRef CAS PubMed.
- G. Boulon, J. Alloys Compd., 2008, 451, 1–11 CrossRef CAS.
- J. Xu, A. Gulzar, P. Yang, H. Bi, D. Yang, S. Gai, F. He, J. Lin, B. Xing and D. Jin, Coord. Chem. Rev., 2019, 381, 104–134 CrossRef CAS.
- L. Xing, Y. Xu, R. Wang, W. Xu and Z. Zhang, Opt. Lett., 2014, 39, 454–457 CrossRef CAS PubMed.
- U. Rocha, C. Jacinto, K. U. Kumar, F. J. López, D. Bravo, J. G. Solé and D. Jaque, J. Lumin., 2016, 175, 149–157 CrossRef CAS.
- I. E. Kolesnikov, A. A. Kalinichev, M. A. Kurochkin, E. V. Golyeva, E. Y. Kolesnikov, A. V. Kurochkin, E. Lähderanta and M. D. Mikhailov, Sci. Rep., 2017, 7, 18002 CrossRef CAS PubMed.
- L. Marciniak, A. Bednarkiewicz, M. Stefanski, R. Tomala, D. Hreniak and W. Strek, Phys. Chem. Chem. Phys., 2015, 17, 24315–24321 RSC.
- S. Zheng, W. Chen, D. Tan, J. Zhou, Q. Guo, W. Jiang, C. Xu, X. Liu and J. Qiu, Nanoscale, 2014, 6, 5675–5679 RSC.
- B. d. Rosal, A. Pérez-Delgado, M. Misiak, A. Bednarkiewicz, A. S. Vanetsev, Y. Orlovskii, D. J. Jovanović, M. D. Dramićanin, U. Rocha, K. U. Kumar, C. Jacinto, E. Navarro, E. M. Rodríguez, M. Pedroni, A. Speghini, G. A. Hirata, I. R. Martín and D. Jaque, J. Appl. Phys., 2015, 118, 143104–143115 CrossRef.
- Z. Yu, W. K. Chan and T. T. Y. Tan, Small, 2020, 16, 1905265–1905286 CrossRef CAS PubMed.
- Y. Chen, X. Lin, Z. Luo and Y. Huang, Chem. Phys. Lett., 2003, 381, 598–604 CrossRef CAS.
- Y. F. Wang, G. Y. Liu, L. D. Sun, J. W. Xiao, J. C. Zhou and C. H. Yan, ACS Nano, 2013, 7, 7200–7206 CrossRef CAS PubMed.
- Y. Fan, P. Wang, Y. Lu, R. Wang, L. Zhou, X. Zheng, X. Li, J. A. Piper and F. Zhang, Nat. Nanotechnol., 2018, 13, 941–946 CrossRef CAS PubMed.
- W. Shao, G. Chen, A. Kuzmin, H. L. Kutscher, A. Pliss, T. Y. Ohulchanskyy and P. N. Prasad, J. Am. Chem. Soc., 2016, 138, 16192–16195 CrossRef CAS PubMed.
- D. K. Sardar and R. M. Yow, Phys. Status Solidi A, 1999, 173, 521–534 CrossRef CAS.
- D. K. Sardar and R. M. Yow, Opt. Mater., 1998, 10, 191–199 CrossRef CAS.
- J. G. Solé, L. L. Bausá and D. Jaque, in An Introduction to the Optical Spectroscopy of Inorganic Solids, Wiley, 2005, ch. 1, pp. 1–38 Search PubMed.
- Y. Cheng, Y. Gao, H. Lin, F. Huang and Y. Wang, J. Mater. Chem. C, 2018, 6, 7462–7478 RSC.
- J. F. Suijver, in Luminescence: From Theory to Applications, ed. C. Ronda, Wiley, 2007, ch. 6, pp. 133–177 Search PubMed.
- S. Balabhadra, M. L. Debasu, C. D. S. Brites, R. A. S. Ferreira and L. D. Carlos, J. Phys. Chem. C, 2017, 121, 13962–13968 CrossRef CAS.
- Y. Zhou, F. Qin, Y. Zheng, Z. Zhang and W. Cao, Opt. Lett., 2015, 40, 4544–4547 CrossRef CAS PubMed.
- M. Peng, X. Yin, P. A. Tanner, M. G. Brik and P. Li, Chem. Mater., 2015, 27, 2938–2945 CrossRef CAS.
- B. Wang, H. Lin, F. Huang, J. Xu, H. Chen, Z. Lin and Y. Wang, Chem. Mater., 2016, 28, 3515–3524 CrossRef CAS.
- M. G. Brik, S. J. Camardello and A. M. Srivastava, ECS J. Solid State Sci. Technol., 2014, 4, 39–43 CrossRef.
- D. Chen, Y. Zhou and J. Zhong, RSC Adv., 2016, 6, 86285–86296 RSC.
- P. Cortelletti, C. Facciotti, I. X. Cantarelli, P. Canton, M. Quintanilla, F. Vetrone, A. Speghini and M. Pedroni, Opt. Mater., 2017, 68, 29–34 CrossRef CAS.
- G. Chen, H. Qiu, P. N. Prasad and X. Chen, Chem. Rev., 2014, 114, 5161–5214 CrossRef CAS PubMed.
- M. Pedroni, F. Piccinelli, T. Passuello, S. Polizzi, J. Ueda, P. Haro-González, L. Martínez-Maestro, D. Jaque, J. García-Solé, M. Bettinelli and A. Speghini, Cryst. Growth Des., 2013, 13, 4906–4913 CrossRef CAS.
- E. C. Ximendes, W. Q. Santos, U. Rocha, U. K. Kagola, F. Sanz-Rodríguez, N. Fernández, A. d. S. Gouveia-Neto, D. Bravo, A. M. Domingo, B. del Rosal, C. D. S. Brites, L. D. Carlos, D. Jaque and C. Jacinto, Nano Lett., 2016, 16, 1695–1703 CrossRef CAS PubMed.
- L. Marciniak, A. Bednarkiewicz, D. Kowalska and W. Strek, J. Mater. Chem. C, 2016, 4, 5559–5563 RSC.
- M. Runowski, N. Stopikowska, D. Szeremeta, S. Goderski, M. Skwierczyńska and S. Lis, ACS Appl. Mater. Interfaces, 2019, 11, 13389–13396 CrossRef CAS PubMed.
- Z. Ji, Y. Cheng, X. Cui, H. Lin, J. Xu and Y. Wang, Inorg. Chem. Front., 2019, 6, 110–116 RSC.
- M. Tan, F. Li, N. Cao, H. Li, X. Wang, C. Zhang, D. Jaque and G. Chen, Small, 2020, 16, 2004118–2004128 CrossRef CAS PubMed.
- T. Wang, T. Xiao, Y. Fan, F. He, Y. Li, Y. Peng, Q. Wang, Z. Yin, Z. Yang, J. Qiu and Z. Song, J. Mater. Chem. C, 2019, 7, 13811–13817 RSC.
- L. Marciniak and A. Bednarkiewicz, Sens. Actuators, B, 2017, 243, 388–393 CrossRef CAS.
- I. Richman, J. Chem. Phys., 1964, 41, 2836–2837 CrossRef CAS.
- T. Miyakawa and D. L. Dexter, Phys. Rev. B: Solid State, 1970, 1, 70–80 CrossRef CAS.
- L. Marciniak, A. Bednarkiewicz and W. Strek, Sens. Actuators, B, 2017, 238, 381–386 CrossRef CAS.
- E. Hemmer, N. Venkatachalam, H. Hyodo, A. Hattori, Y. Ebina, H. Kishimoto and K. Soga, Nanoscale, 2013, 5, 11339–11361 RSC.
- A. M. Kaczmarek, D. Esquivel, J. Ouwehand, P. Van Der Voort, F. J. Romero-Salguero and R. Van Deun, Dalton Trans., 2017, 46, 7878–7887 RSC.
- S. Han, R. Deng, X. Xie and X. Liu, Angew. Chem., Int. Ed., 2014, 53, 11702–11715 CrossRef CAS PubMed.
- F. Wang and X. Liu, Chem. Soc. Rev., 2009, 38, 976–989 RSC.
- V. Mahalingam, F. Vetrone, R. Naccache, A. Speghini and J. A. Capobianco, Adv. Mater., 2009, 21, 4025–4028 CrossRef CAS.
- H. Wen, H. Zhu, X. Chen, T. F. Hung, B. Wang, G. Zhu, S. F. Yu and F. Wang, Angew. Chem., Int. Ed., 2013, 52, 13419–13423 CrossRef CAS PubMed.
- X. Xie, N. Gao, R. Deng, Q. Sun, Q. H. Xu and X. Liu, J. Am. Chem. Soc., 2013, 135, 12608–12611 CrossRef CAS PubMed.
- E. C. Ximendes, U. Rocha, T. O. Sales, N. Fernández, F. Sanz-Rodríguez, I. R. Martín, C. Jacinto and D. Jaque, Adv. Funct. Mater., 2017, 27, 1702249 CrossRef.
- L. Marciniak, K. Prorok, L. Francés-Soriano, J. Pérez-Prieto and A. Bednarkiewicz, Nanoscale, 2016, 8, 5037–5042 RSC.
- P. Cortelletti, A. Skripka, C. Facciotti, M. Pedroni, G. Caputo, N. Pinna, M. Quintanilla, A. Benayas, F. Vetrone and A. Speghini, Nanoscale, 2018, 10, 2568–2576 RSC.
- X. Zhou, Y. Wang, H. Wang, L. Xiang, Y. Yan, L. Li, G. Xiang, Y. Li, S. Jiang, X. Tang and X. Zhou, Sens. Biosensing Res., 2020, 29, 100345–100354 CrossRef.
- I. E. Kolesnikov, M. A. Kurochkin, A. A. Kalinichev, D. V. Mamonova, E. Y. Kolesnikov, A. V. Kurochkin, E. Lähderanta and M. D. Mikhailov, J. Alloys Compd., 2018, 734, 136–143 CrossRef CAS.
- M. Quintanilla, Y. Zhang and L. M. Liz-Marzán, Chem. Mater., 2018, 30, 2819–2828 CrossRef CAS.
- A. Skripka, A. Benayas, R. Marin, P. Canton, E. Hemmer and F. Vetrone, Nanoscale, 2017, 9, 3079–3085 RSC.
- R. Martín-Rodríguez and A. Meijerink, J. Lumin., 2014, 147, 147–154 CrossRef.
- R. Naccache, Q. Yu and J. A. Capobianco, Adv. Opt. Mater., 2015, 3, 482–509 CrossRef CAS.
- D. Ananias, F. A. Almeida-Paz, L. D. Carlos and J. Rocha, Chem. – Eur. J., 2018, 24, 11926–11935 CrossRef CAS PubMed.
- F. Seitz, J. Chem. Soc., Faraday Trans., 1939, 35, 74–85 RSC.
- N. F. Mott, Proc. R. Soc. A, 1938, 167, 384–391 Search PubMed.
- L. Wortmann, S. Suyari, T. Ube, M. Kamimura and K. Soga, J. Lumin., 2018, 198, 236–242 CrossRef CAS.
- S. Sekiyama, M. Umezawa, S. Kuraoka, T. Ube, M. Kamimura and K. Soga, Sci. Rep., 2018, 8, 16979–16991 CrossRef PubMed.
- M. Jia, Z. Fu, G. Liu, Z. Sun, P. Li, A. Zhang, F. Lin, B. Hou and G. Chen, Adv. Opt. Mater., 2020, 8, 1901173–1901180 CrossRef CAS.
- C. Matuszewska, K. Elzbieciak-Piecka and L. Marciniak, J. Phys. Chem. C, 2019, 123, 18646–18653 CrossRef CAS.
- E. C. Ximendes, A. F. Pereira, U. Rocha, W. F. Silva, D. Jaque and C. Jacinto, Nanoscale, 2019, 11, 8864–8869 RSC.
- S. Balabhadra, M. L. Debasu, C. D. S. Brites, J. Rocha and L. D. Carlos, J. Lumin., 2016, 180, 25–30 CrossRef CAS.
- E. Thimsen, B. Sadtler and M. Y. Berezin, Nanophotonics, 2017, 6, 1043–1054 CAS.
- L. Labrador-Páez, M. Pedroni, A. Speghini, J. García-Solé, P. Haro-González and D. Jaque, Nanoscale, 2018, 10, 22319–22328 RSC.
- S. V. Eliseeva and J. C. G. Bünzli, Chem. Soc. Rev., 2010, 39, 189–227 RSC.
- R. Arppe, I. Hyppänen, N. Perälä, R. Peltomaa, M. Kaiser, C. Würth, S. Christ, U. Resch-Genger, M. Schäferling and T. Soukka, Nanoscale, 2015, 7, 11746–11757 RSC.
- H. Suo, C. Guo, W. Wang, T. Li, C. Duan and M. Yin, Dalton Trans., 2016, 45, 2629–2636 RSC.
- N. Yamada, S. Shionoya and T. Kushida, J. Phys. Soc. Jpn., 1972, 32, 1577–1586 CrossRef CAS.
- Z. Xiaoting, T. Hayakawa, Y. Ishikawa, Y. Liushuan and M. Nogami, J. Alloys Compd., 2015, 644, 77–81 CrossRef.
- O. A. Savchuk, J. J. Carvajal, P. Haro-Gonzalez, M. Aguiló and F. Díaz, J. Alloys Compd., 2018, 746, 710–719 CrossRef CAS.
- A. Nexha, J. J. Carvajal, M. C. Pujol, F. Díaz and M. Aguiló, J. Mater. Chem. C, 2020, 8, 180–191 RSC.
- Y. Ma, G. Xiang, J. Zhang, Z. Liu, P. Zhou, W. Liu, X. Tang, S. Jiang, X. Zhou, L. Li, Y. Luo and Y. Jin, J. Alloys Compd., 2018, 769, 325–331 CrossRef CAS.
- G. Xiang, X. Liu, J. Zhang, Z. Liu, W. Liu, Y. Ma, S. Jiang, X. Tang, X. Zhou, L. Li and Y. Jin, Inorg. Chem., 2019, 58, 8245–8252 CrossRef PubMed.
- R. Lei, X. Liu, F. Huang, D. Deng, S. Zhao, H. Xu and S. Xu, Opt. Mater., 2018, 86, 278–285 CrossRef CAS.
- V. Jambunathan, A. Schmidt, X. Mateos, M. C. Pujol, U. Griebner, V. Petrov, C. Zaldo, M. Aguiló and F. Díaz, J. Opt. Soc. Am. B, 2014, 31, 1415–1421 CrossRef CAS.
- Q. Zhan, J. Qian, H. Liang, G. Somesfalean, D. Wang, S. He, Z. Zhang and S. Andersson-Engels, ACS Nano, 2011, 5, 3744–3757 CrossRef CAS PubMed.
- Wikipedia Contributors, Ex vivo, https://en.wikipedia.org/w/index.php?title=Ex_vivo&oldid=876353685 (accessed on 24 November 2020).
- K. Koenig, H. Liang, M. W. Berns and B. J. Tromberg, Opt. Lett., 1996, 21, 1090–1092 CrossRef CAS PubMed.
- L. Cheng, C. Wang, L. Feng, K. Yang and Z. Liu, Chem. Rev., 2014, 114, 10869–10939 CrossRef CAS PubMed.
- A. Benayas, E. Hemmer, G. Hong and D. Jaque, Near Infrared-Emitting Nanoparticles for Biomedical Applications, Springer, 2020 Search PubMed.
- M. Quintanilla, I. García, I. de Lázaro, R. García-Alvarez, M. Henriksen-Lacey, S. Vranic, K. Kostarelos and L. M. Liz-Marzán, Theranostics, 2019, 9, 7298–7312 CrossRef CAS PubMed.
- L. M. Maestro, P. Haro-González, A. Sánchez-Iglesias, L. M. Liz-Marzán, J. García-Solé and D. Jaque, Langmuir, 2014, 30, 1650–1658 CrossRef CAS PubMed.
- Wikipedia Contributors, In Vitro, https://en.wikipedia.org/wiki/In_vitro (accessed on 26 November 2020).
- S. Uchiyama and N. Inada, in Thermometry at the Nanoscale: Techniques and Selected Applications, ed. L. D. Carlos and F. Palacio, The Royal Society of Chemistry, 2016, ch. 12, pp. 353–382 Search PubMed.
- L. H. Fischer, G. S. Harms and O. S. Wolfbeis, Angew. Chem., Int. Ed., 2011, 50, 4546–4551 CrossRef CAS PubMed.
- O. Zohar, M. Ikeda, H. Shinagawa, H. Inoue, H. Nakamura, D. Elbaum, D. L. Alkon and T. Yoshioka, Biophys. J., 1998, 74, 82–89 CrossRef CAS.
- K. Oyama, M. Takabayashi, Y. Takei, S. Arai, S. Takeoka, S. i. Ishiwata and M. Suzuki, Lab Chip, 2012, 12, 1591–1593 RSC.
- Wikipedia Contributors, In Vivo, https://en.wikipedia.org/wiki/In_vivo (accessed 30 November 2020).
- U. Ozerdem and A. R. Hargens, Microvasc. Res., 2005, 70, 116–120 CrossRef CAS PubMed.
- B. J. Tromberg, O. Coquoz, J. B. Fishkin, T. Pham, E. R. Anderson, J. Butler, M. Cahn, J. D. Gross, V. Venugopalan and D. Pham, Philos. Trans. R. Soc. London, Ser. B, 1997, 352, 661–668 CrossRef CAS PubMed.
- J. H. Lienhard, A heat transfer textbook, Courier Corporation, 2013 Search PubMed.
- F. P. Incropera, T. L. Bergman and A. S. Lavine, Introduction to Heat Transfer, Wiley, New York, 5th edn, 2006 Search PubMed.
- E. Saïdi, N. Babinet, L. Lalouat, J. Lesueur, L. Aigouy, S. Volz, J. Labéguerie-Egéa and M. Mortier, Small, 2011, 7, 259–264 CrossRef PubMed.
- J.-P. Tetienne, A. Lombard, D. A. Simpson, C. Ritchie, J. Lu, P. Mulvaney and L. C. L. Hollenberg, Nano Lett., 2016, 16, 326–333 CrossRef CAS PubMed.
- I. Sedmak, I. Urbančič, J. Štrancar, M. Mortier and I. Golobič, Sens. Actuators, A, 2015, 230, 102–110 CrossRef CAS.
- V. V. Deshpande, S. Hsieh, A. W. Bushmaker, M. Bockrath and S. B. Cronin, Phys. Rev. Lett., 2009, 102, 105501–105505 CrossRef PubMed.
- X. Wu, S. Zhan, J. Han and Y. Liu, Nano Lett., 2021, 21, 272–278 CrossRef CAS PubMed.
- H. Suo, X. Zhao, Z. Zhang, R. Shi, Y. Wu, J. Xiang and C. Guo, Nanoscale, 2018, 10, 9245–9251 RSC.
- J. Zhao, X. Chen, B. Chen, X. Luo, T. Sun, W. Zhang, C. Wang, J. Lin, D. Su, X. Qiao and F. Wang, Adv. Funct. Mater., 2019, 29, 1903295–1903302 CrossRef CAS.
- M. Wang, L. Yi, G. Wang, L. Hu and J. Zhang, Solid State Commun., 2009, 149, 1216–1220 CrossRef CAS.
- L. Sordillo, Y. Pu, S. Pratavieira, Y. Budansky and R. Alfano, J. Biomed. Opt., 2014, 19, 56004–56010 CrossRef PubMed.
- H. Rodríguez-Rodríguez, S. Imanieh, F. Lahoza and I. Martin, Sol. Energy Mater. Sol. Cells, 2016, 144, 29–32 CrossRef.
- L. Liu, S. Wang, B. Zhao, P. Pei, Y. Fan, X. Li and F. Zhang, Angew. Chem., Int. Ed., 2018, 57, 7518–7522 CrossRef CAS PubMed.
- U. Rocha, K. U. Kumar, C. Jacinto, I. Villa, F. Sanz-Rodríguez, M. C. I. de la Cruz, A. Juarranz, E. Carrasco, F. C. J. M. van Veggel, E. Bovero, J. G. Solé and D. Jaque, Small, 2014, 10, 1141–1154 CrossRef CAS PubMed.
- G. Chen, J. Shen, T. Y. Ohulchanskyy, N. J. Patel, A. Kutikov, Z. Li, J. Song, R. K. Pandey, H. Ågren, P. N. Prasad and G. Han, ACS Nano, 2012, 6, 8280–8287 CrossRef CAS PubMed.
- N. N. Dong, M. Pedroni, F. Piccinelli, G. Conti, A. Sbarbati, J. Ramirez, L. Martínez-Maestro, M. C. I. de la Cruz, F. Sanz-Rodriguez, A. Juarranz, F. Chen, F. Vetrone, J. Capobianco, J. Solé, M. Bettinelli, D. Jaque and A. Speghini, ACS Nano, 2011, 5, 8665–8671 CrossRef CAS PubMed.
- R. Wang, X. Li, L. Zhou and F. Zhang, Angew. Chem., Int. Ed., 2014, 53, 12086–12090 CrossRef CAS PubMed.
- Y. Shen, J. Lifante, N. Fernández, D. Jaque and E. Ximendes, ACS Nano, 2020, 14, 4122–4133 CrossRef CAS.
- M. Suzuki and T. Plakhotnik, Biophys. Rev., 2020, 12, 593–600 CrossRef PubMed.
| This journal is © The Royal Society of Chemistry 2021 |

