DOI:
10.1039/D0GC04254D
(Paper)
Green Chem., 2021,
23, 2507-2524
Investigation of the catalytic activity and reaction kinetic modeling of two antimony catalysts in the synthesis of poly(ethylene furanoate)†
Received
16th December 2020
, Accepted 2nd March 2021
First published on 2nd March 2021
Abstract
In the last few decades, the interest in the synthesis and development of novel biobased polymers with interesting properties, able to compete with the existing petroleum-based polymers, has grown exponentially. 2,5-Furandicarboxylic acid (FDCA) is among the most studied biobased monomers and is currently the only aromatic one, when aromaticity is mandatory to obtain polymers with superior properties. However, furan-based polyesters are mainly prepared from 2,5-dimethyl furandicarboxylate (DMFD), by transesterification, adding a supplementary step in the synthesis and an extra barrier towards industrialization. Herein, we present the study of the polymerization of high-purity FDCA with EG using two different antimony catalysts (antimony oxide, Sb2O3, and antimony acetate, Sb(CH3COO)3) and different esterification and polycondensation temperatures by the traditional two-step polycondensation method. Each step was monitored by suitable characterization techniques, such as intrinsic viscosity measurements, carboxylic acid end-group analysis, nuclear magnetic resonance spectroscopy, infra-red spectroscopy and differential scanning calorimetry. Additionally, for the first time, liquid chromatography (LC) coupled with high resolution mass spectrometry (HRMS) was used in the study of FDCA polymerization. PEF oligomers produced during the esterification step were precisely identified by HRMS, providing new insights into the evolution of this step. Finally, theoretical studies were conducted to model the kinetics of the polymerization of PEF during both esterification and polycondensation stages.
1. Introduction
The 21st century is characterized by a continuous strive of societies towards a greener, i.e. more sustainable, lifestyle. In polymer chemistry, this concern is implemented by the intensive research in the field of biobased polymers, i.e. polymers synthesized from monomers produced from renewable sources.1–5 Besides environmental concerns, this trend was further motivated by the progressive depletion of fossil fuels, the high oil price and its unpredictable fluctuations.6 In this context, 2,5-furandicarboxylic acid (FDCA) has emerged as a versatile monomer, attracting the interest of both the academic and industrial communities.7 FDCA, which has been characterized as one of the twelve most important biobased monomers by the US Department of Energy,8 is considered an alternative to terephthalic acid due to their structural similarity.
Polymerization of FDCA with ethylene glycol (EG) affords poly(ethylene furanoate) (PEF).9,10 Compared to polyethylene terephthalate (PET), PEF exhibits superior thermal stability, a lower melting temperature, and significantly lower O2 and CO2 permeability, combined with excellent mechanical properties and good processability.11,12 PEF production is expected to reduce the non-renewable energy use by 40–50% and the greenhouse gas emissions by 45–55%.13 It has been estimated that, when produced at the same scale, FDCA and PEF production will be competitive with the production of terephthalic acid14 and PET,15 respectively. As a result of its biobased nature and superior physicochemical properties, there are real expectations that PEF will indeed replace PET in some applications. PEF is the spearhead of this new family of biobased polyesters;16–21 however, a wide variety of promising polymers and copolymers have been obtained from FDCA.22–35 For example, poly(propylene furanoate) (PPF) and poly(butylene furanoate) (PBF) also exhibit a high gas barrier and mechanical properties.36–52
The extended research on furan-based polyesters has resulted in a variety of starting monomers and polymerization techniques that can be employed for their synthesis.12,22,53–67 Nevertheless, until now, the most popular strategy is utilizing dimethyl 2,5-furandicarboxylate (DMFD) in traditional melt polycondensations. Several catalytic systems have been screened for the polycondensation of DMFD by different research groups, and titanium catalysts exhibited the highest catalytic activity.68,69 This is why recent publications from academia are dominated by titanium catalysts. While this approach certainly offers some advantages (milder conditions and lower coloration when DMFD is the starting material),70 it is not favored by the industry that would rather use FDCA as a starting monomer. Indeed, in this case, the esterification of FDCA to DMFD is bypassed. The atom efficiency for the polymerization of FDCA to PEF is higher compared to that for DMFD and water is produced instead of toxic methanol. Moreover, it demands a minimal adaptation of the existing PET production plants, where terephthalic acid, and not dimethyl terephthalate, is the starting monomer.71 Despite their efficiency, titanium-based catalysts result in higher coloration, compared to other metal-based catalysts, and faster degradation, while there are also some concerns regarding toxicity issues.68,69,72 Therefore, it is clear that more fundamental research needs to be conducted on the direct esterification of FDCA for the synthesis of PEF. Only a few kinetic studies have been conducted specifically on the esterification and polycondensation of FDCA.73–75 Among them, Brandão et al. studied the step-growth polymerization of PEF.74 The apparent activation energies of the polymerization steps were calculated, and it was demonstrated that the esterification step is dependent on mass transfer, while the polycondensation is more affected by kinetic effects.
Herein, we present the kinetic study of the direct polymerization of high-purity FDCA with ethylene glycol (EG) with two different catalysts and at three different temperatures. We chose to study two antimony catalysts, antimony oxide, Sb2O3, and antimony acetate Sb(CH3COO)3, which are often neglected in PEF research in favor of titanate catalysts, despite their established suitability for food packaging applications. The polymerization of FDCA with ethylene glycol was monitored by traditional methods (intrinsic viscosity measurements, end-group analysis, nuclear magnetic resonance spectroscopy, infra-red spectroscopy, and differential scanning calorimetry). For the first time, to the best of our knowledge, further insight into the FDCA esterification at the molecular level was given by liquid chromatography coupled to high resolution mass spectrometry (LC-HRMS). The intermediate PEF oligomers that are formed during the esterification step of the polymerization were formally identified by HRMS providing a better understanding of the mechanism of polymerization. Finally, theoretical studies were conducted to estimate the kinetic constants of the reactions involved in PEF synthesis by FDCA polymerization.
2. Materials and methods
2.1. Materials
2,5-Furandicarboxylic acid (FDCA, 99.2%, Sunshine Limited, China), ethylene glycol (anhydrous 99.8%), and antimony acetate (Sb(CH3COO)3) and antimony trioxide (Sb2O3) catalysts were purchased from Aldrich Co (Chemie GmbH, Steinheim, Germany). Phenol and 1,1,2,2-tetrachloroethane were purchased from Alfa Aesar (Kandel, Germany).
2.2. Synthesis
2.2.1. Esterification.
30.0 g (0.19 mol) of FDCA, 35.8 g of ethylene glycol (0.58 mol, 3 equiv.) and the appropriate catalyst (Sb(CH3COO)3 or Sb2O3 (400 ppm based on Sb metal)) were introduced into a polymerization reactor. The apparatus was evacuated and filled with nitrogen three times (in order to remove the existing oxygen). The reagents were heated at 160, 170 or 190 °C under nitrogen flow (50 mL min−1) for 4 hours. At 30 minutes intervals, samples were taken from the polymerization reacting mixture for further analysis.
2.2.2. Polycondensation.
15.0 g of PEF oligomers prepared at 190 °C for 4 hours with each catalyst (Sb(CH3COO)3 or Sb2O3) were introduced into the polymerization reactor. The apparatus was evacuated and filled with nitrogen three times. The oligomers were heated at 220, 230 or 240 °C under high vacuum (5.0 Pa) for 3 hours. Samples were retrieved from the reaction mixture after 0.5, 1, 2 and 3 hours and characterized.
2.3. Characterization
2.3.1. Acid value (AV) measurements.
The carboxyl end-group content was determined by titration using a methanolic solution of potassium hydroxide (1 M) and phenol red as an indicator. For each sample, the titration was repeated three times and the mean volume was further used.
The acid value (AV) is proportional to the unreacted acid groups and it is defined as the milligrams of potassium hydroxide required to neutralize one gram of sample. The AV was calculated according to the following equation (the concentration of the KOH solution is 1 M):
| |  | (1) |
where
V is the volume of KOH solution used (in mL) and
m is the mass of the sample (in g).
The conversion was calculated according to the following equation:
| |  | (2) |
where AV
0 is the initial AV and AV
t is the AV value at each sampling interval.
2.3.2. Intrinsic viscosity (IV).
Intrinsic viscosity [η] was measured with an Ubbelohde viscometer (Schott Gerate GMBH, Hofheim, Germany) at 25 °C in a mixture of phenol and 1,1,2,2-tetrachloroethane (60/40, w/w). When the samples could not be dissolved at room temperature, they were slightly heated at 60 °C until complete dissolution. The intrinsic viscosity of polyester was calculated using the Solomon–Ciuta equation (eqn (3)) of a single point measurement:| |  | (3) |
where c is the concentration of the solution; t is the flow time of solution and t0 is the flow time of pure solvent. For each sample, three measurements were conducted, and the average value was calculated. The number average molecular weight (Mn) was calculated from the IV values applying the modified Berkowitz equation:69| | | Mn = 3.29 × 10⁴ [η]1.54. | (4) |
2.3.3. Fourier transform-infrared spectroscopy (FTIR).
FTIR spectra were obtained using a Cary670 Agilent FTIR spectrometer, ATR unit: GladiATR Pike (diamond crystal) or a PerkinElmer FTIR spectrometer (PerkinElmer, Waltham, MA, USA), model Spectrum One, in absorbance mode and in the spectral region of 500–4000 cm−1 using a resolution of 4 cm−1 and 64 co-added scans.
2.3.4. Nuclear magnetic resonance (NMR).
NMR spectra were recorded in deuterated dimethylsulfoxide (DMSO-d6) on an Agilent 500 spectrometer (Agilent Technologies, Santa Clara, CA, USA), at room temperature. Spectra were calibrated using the residual solvent peaks.
2.3.5. Differential scanning calorimetry (DSC).
Thermal analysis studies were carried out using a PerkinElmer Diamond DSC (PerkinElmer Corporation, Waltham MA, USA) updated to the DSC 8500 level, combined with an Intracooler IIP cooling system. For DSC analysis, the samples were briefly triturated with methanol to remove the excess EG. Samples of about 5 mg were used. In general, heating scans of the samples were conducted at 20 °C min−1. Tg was recorded in the second heating run.
2.3.6. Liquid chromatography-high resolution mass spectrometry (LC-HRMS).
HRMS was employed in order to achieve comprehensive structural characterization of the esterification reaction mixture. All analyses were performed on a Q Exactive Focus Orbitrap mass spectrometer, coupled with ultra-high-performance liquid chromatography (UHPLC), both from Thermo Scientific. The samples were dissolved in acetonitrile, filtered through PTFE syringe driven filters (0.22 μm) and injected into the LC Orbitrap MS/MS system. The separation of the oligomers was achieved on a Hypersil GOLD™ aQ column with dimensions 50 × 2.1 mm and a pore size of 1.9 μm (Thermo Scientific, MA, USA) at 40 °C. The mobile phase consisted of solvent A (water with 0.1% formic acid) and solvent B (methanol with 0.1% formic acid) at a flow rate of 200 μL min−1. The gradient elution program was set as follows: from 90% A (initial conditions) which stayed stable for 1.5 min to 40% in 4 min and then to 30% until 8 min. Afterwards, the mobile phase A turned to 0% within 3 min and stayed for additional 2 min, before returning to the initial conditions after 2 min with the re-equilibration of the column set at 1 min. The injection volume was set to 5 μL. The parameters of the heated electron-spray ion source (HESI) were: capillary temperature, 320 °C; S-lens RF level, 50; spray voltage, 3.5 kV; and the flow rate for the sheath, auxiliary and sweep gas, 45, 10 and 2 (au), respectively. All HESI parameters were optimized in the source auto-default option of the instrument after setting the LC flow rate at 200 μL min−1.
All samples were analyzed in both positive and negative ionization modes. Full scan mass spectrum (FS-MS) data acquisition was performed in order to obtain the exact mass of each oligomer, setting the resolution to 70![[thin space (1/6-em)]](https://www.rsc.org/images/entities/char_2009.gif) 000 FWHM, over a mass range of 60–900 m/z, and the mass error (Δ) below 5 ppm. Simultaneously, a data-dependent MS2 experiment was performed with the resolution set at 17
000 FWHM, over a mass range of 60–900 m/z, and the mass error (Δ) below 5 ppm. Simultaneously, a data-dependent MS2 experiment was performed with the resolution set at 17![[thin space (1/6-em)]](https://www.rsc.org/images/entities/char_2009.gif) 500 FWHM and the isolation width for the parent ion of interest at 1.0 m/z to obtain the fragmentation patterns of the formed oligomers and to confirm the findings of FS-MS. Technically, the molecular formulas of the expected oligomers were imported in an inclusion list that automatically generates the theoretical accurate mass, corresponding to their pseudo-molecular (protonated or deprotonated) ions. To induce the fragmentation, the collision energy (CE) in the high dissociation cell (HCD) was stepped at 20, 35 and 40 eV. All data and analyses were acquired and performed, respectively, using Thermo Xcalibur™ software (version 4.1).
500 FWHM and the isolation width for the parent ion of interest at 1.0 m/z to obtain the fragmentation patterns of the formed oligomers and to confirm the findings of FS-MS. Technically, the molecular formulas of the expected oligomers were imported in an inclusion list that automatically generates the theoretical accurate mass, corresponding to their pseudo-molecular (protonated or deprotonated) ions. To induce the fragmentation, the collision energy (CE) in the high dissociation cell (HCD) was stepped at 20, 35 and 40 eV. All data and analyses were acquired and performed, respectively, using Thermo Xcalibur™ software (version 4.1).
3. Results and discussion
In the two-step polycondensation polymerization of FDCA with ethylene glycol, in the first step, FDCA is esterified using EG while in the second step transesterification processes (polycondensation) take place, according to Scheme 1. Besides the catalyst used, the polymerization temperature is a crucial parameter that affects not only the extent of the reaction, but also the color of the final PEF polymer. It has been evidenced that FDCA decomposes at high temperature via decarboxylation processes, which is one of the causes of the coloration of PEF. Our group has previously studied the thermal stability of FDCA by thermogravimetric analysis (TGA) and pyrolysis-gas chromatography/mass spectroscopy (Py-GC/MS).76 It was found that the decomposition of FDCA starts at temperatures higher than 200 °C; however, mass losses were recorded at temperatures as low as 160 °C after 4 hours of isothermal heating. Therefore, we favored low temperatures (160, 170 and 190 °C) for the esterification step. Besides, it has recently been demonstrated that FDCA is satisfyingly soluble in EG above 140 °C.77
 |
| | Scheme 1 Polymerization of 2,5-furandicarboxylic acid with ethylene glycol. The first step, the esterification, affords oligomers. The second step, the polycondensation, yields poly(ethylene furanoate). | |
3.1. Esterification
Esterification was performed in the presence of Sb2O3 or Sb(CH3COO)3, at 160, 170 or 190 °C and samples were taken every 30 minutes to monitor the progress of the reaction. The consumption of the –COOH groups of FDCA was evaluated by titration and 1H NMR and the conversion was accordingly calculated. IR and DSC were also used to observe the evolution of the reacting mixture. Additionally, the monomers, dimers and trimers present in the reacting mixture were identified and quantified by LC-HRMS spectroscopy. Finally, based on these measurements, theoretical modelling was performed.
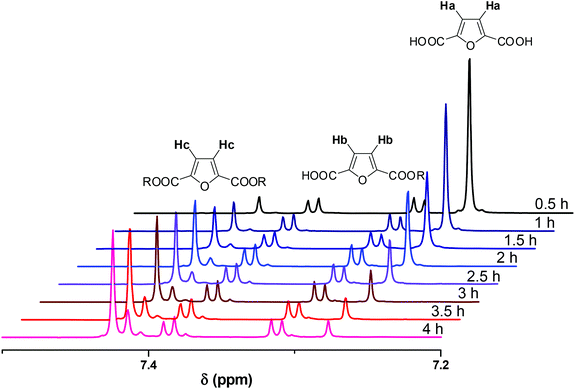
NMR spectra were recorded in DMSO-d6. A representative example of spectra of the crude reaction mixture is shown in Fig. 1. The aromatic region is appropriate to follow the progress of the reaction as the aromatic protons of the furanic unit are easily distinguishable. The aromatic protons of FDCA appear as a single peak at 7.27 ppm (protons a), while the corresponding protons of the di-esterified furanic ring appear at 7.42 ppm (protons c). The aromatic ring where only one COOH moiety has been esterified is detected by the two double peaks (one for each proton) at 7.31 and 7.39 ppm (protons b). As the reaction progressed, the peak at 7.27 ppm diminished. The peaks of the mono-ester initially increased, but, after a while, the mono-ester peaks tended to remain constant in favor of the peak of the di-ester which progressively dominated the spectrum. The conversion was calculated by comparing the aromatic protons of the mono- and di-ester with the total amount of aromatic protons, according to eqn (5):
| |  | (5) |
where
a is the integral of the FDCA protons,
b are the protons of the mono-ester and
c are the protons of the di-ester.
 |
| | Fig. 1
1H NMR spectra of the crude reaction mixture of the esterification conducted at 160 °C, in the presence of Sb2O3. | |
The calculated conversions for each catalyst and each temperature are presented in Fig. 2 and in Tables S1 and S2.† The results obtained by titrimetry and NMR were in good agreement. At 160 °C Sb2O3 seemed to be slightly more active than Sb(CH3COO)3; however the catalytic activity of the two catalysts is comparable at higher temperatures. We could say that, for the esterification step of the polymerization, the temperature, rather than the catalyst, has a higher impact on the conversion and that, within the studied timeframe (4 hours), a high temperature was necessary to achieve the complete conversion of FDCA. This is reasonable since this reaction is an autocatalyzed one (esterification reactions are catalyzed by acids) and EG is present in a large excess.78,79 The following characterization studies are indicatively illustrated by the polymerizations catalyzed by Sb2O3.
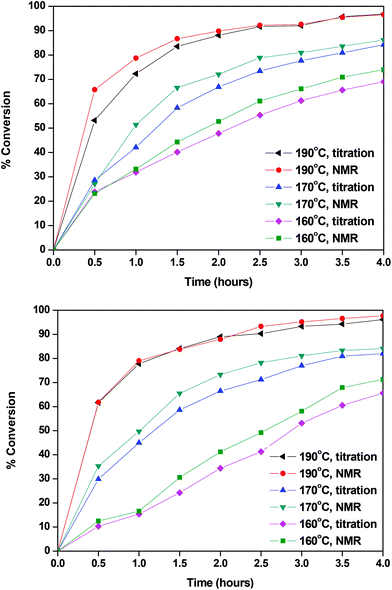 |
| | Fig. 2 Conversions calculated with Sb2O3 (up) and Sb(CH3COO)3 (down). | |
The FTIR spectra of neat FDCA along with the spectra from various stages of the reaction are presented in Fig. 3. In the spectrum of FDCA, a broad absorption band, attributed to the OH stretching vibration of the carboxylic acid group of FDCA, is easily noticeable at 2500–3000 cm−1. As the reaction progresses, the intensity of the peak decreases, confirming the conversion of the end groups. Simultaneously, a new absorption band can be observed around 3360 cm−1. This band corresponds to the –OH end groups of the esterified intermediates. These results are in accordance with the titration and 1H NMR trends shown above.
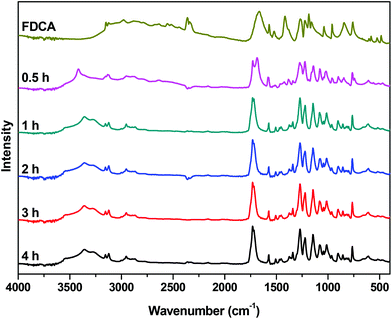 |
| | Fig. 3 FTIR spectra of the crude reaction mixture of the esterification catalyzed by Sb2O3 at 190 °C, at different reaction times. | |
The peak that corresponds to the carbonyl groups is the second notable feature of these spectra. For FDCA, the peak that correlates with the C![[double bond, length as m-dash]](https://www.rsc.org/images/entities/char_e001.gif) O stretching vibration of the carboxylic acid is observed at 1665 cm−1. After half an hour, two overlapping peaks are clearly visible in the carbonyl region of the spectrum: at 1690 cm−1 (COOH) and at 1727 cm−1 (COOR), reflecting the conversion calculated by NMR and end-group analysis. As the reaction proceeds, the peak at 1690 cm−1 further decreases and the peak of the ester carbonyl groups at 1727 cm−1 dominates.
O stretching vibration of the carboxylic acid is observed at 1665 cm−1. After half an hour, two overlapping peaks are clearly visible in the carbonyl region of the spectrum: at 1690 cm−1 (COOH) and at 1727 cm−1 (COOR), reflecting the conversion calculated by NMR and end-group analysis. As the reaction proceeds, the peak at 1690 cm−1 further decreases and the peak of the ester carbonyl groups at 1727 cm−1 dominates.
The DSC thermographs are complementing the 1H NMR data and acid value measurements. Indicatively, the DSC curves obtained at 170 and 190 °C with the Sb2O3 catalyst are shown in Fig. 4. In all thermographs, at both reaction temperatures (170 and 190 °C), two main peaks can be seen. At 190 °C, in the early stages of esterification, a low intensity peak appears around 140 °C and, as the reaction progresses, its intensity decreases. We believe that this peak corresponds to 5-((2-hydroxyethoxy)carbonyl)furan-2-carboxylic acid, i.e. FDCA mono-ester with EG, monomer M1 in Scheme 2. Indeed, it is the first esterification product that is formed, and thus its presence is probable in the early stages of the reaction. Conversely, in the latest stages, as the conversion of the –COOH end groups tends to 100%, its concentration is dropping. The melting temperature depression compared with FDCA is rather big (m.p. 342 °C for FDCA); but comparing it with similar findings in the literature, mainly terephthalic acid (TA) and its mono-ester 4-((2-hydroxyethoxy)carbonyl)benzoic acid (m.p. 427 °C for TA, 180 °C for the ester)80 and isophthalic acid (IA) and its mono-ester 3-((2-hydroxyethoxy)carbonyl)benzoic acid (m.p. 341 °C for IA, 132 °C for the ester),81 the Tm value seems reasonable. The melting peak at 120 °C could be attributed to the diester, bis(2-hydroxyethyl) furan-2,5-dicarboxylate (M2 in Scheme 2); however the reported m.p. in the literature is significantly lower (91 °C).82 Therefore, it probably corresponds to a dimer or trimer which is formed in the later stages of the esterification. Similar trends can be observed at 170 °C. The thermograms of the reaction at 160 °C (not shown) are dominated by a very broad peak around 140 °C, probably encompassing the peak at 120 °C. These results are in good agreement with the XRD patterns of the collected samples (please see Fig. S1 in the ESI†). At short reaction time, the recorded patterns indicate that almost amorphous materials are obtained, while their crystalline peaks are increasing with time, as the esterification progresses. The patterns are almost identical for both catalysts.
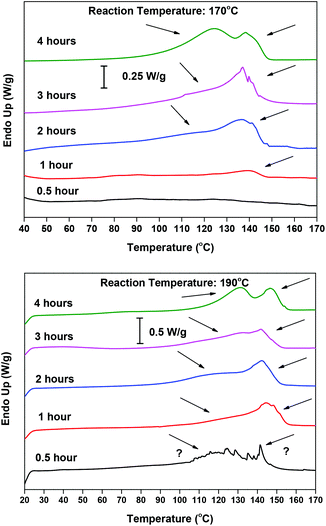 |
| | Fig. 4 DSC thermograms of the reaction samples of the esterification step, catalyzed by Sb2O3 at 170 °C (up) and 190 °C (down), at different reaction times. | |
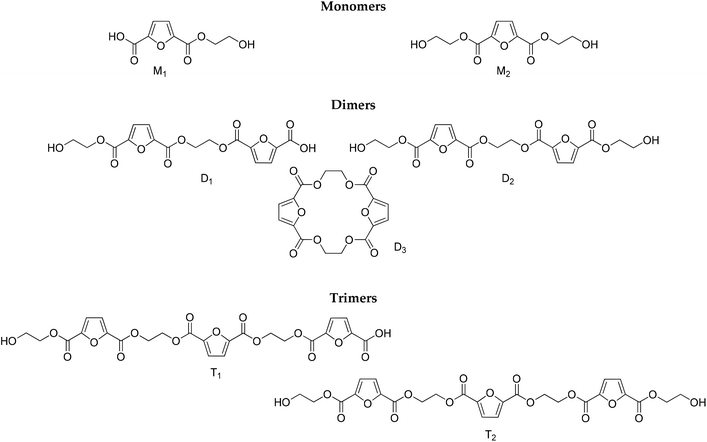 |
| | Scheme 2 Structures identified by LC-HRMS. | |
To complement the results obtained by NMR and titrimetry, and to distinguish among the different structures that are progressively formed as the esterification proceeds, LC-HRMS analysis was performed. The structures of the oligomers that have been identified are depicted in Scheme 2. They have been divided into three groups (monomers, dimers and trimers) according to the number of furanic rings they bear. It is noteworthy that no traces of diethylene glycol by-products were detected.
Despite the unavailability of reference standards, LC-HRMS provided an array of key features to carry out a confident identification of the expected oligomers, namely, the accurate mass measurements (4 decimals, mass error <5 ppm), isotopic patterns, and characteristic fragments for each compound. For the comprehensive investigation of the obtained total ion chromatograms (TICs, please see ESI Fig. S2†) of the injected samples corresponding to various time intervals and different temperatures, in both positive and negative modes (ESI), mass filters were applied. Thus, the extrapolation of critical information was enabled with the aid of the generated extracted ion chromatograms (XICs). Table 1 summarizes the retention times, and the MS and MS2 data for the tentative identification of the oligomers.
Table 1 Retention times, elemental composition, experimental and theoretical mass information, mass error deviation and double bond and ring equivalent number (RDB) of the detected oligomers
| Formula |
t
R (min) |
Elemental composition |
m/z (accurate mass) |
RDBE |
Δ (ppm) |
| Theor. |
Exp. |
| Precursor ions in bold. |
|
FDCA
|
|
C
6
H
4
O
5
|
5.43
|
C
6
H
5
O
5
+
|
157.0131
|
157.0132
|
4.5
|
0.3127
|
| C5H2O2 |
|
C5H3O2+ |
95.0128 |
95.0132 |
4.5 |
4.4212 |
|
|
|
Monomers
|
|
C
8
H
8
O
6
|
5.46
|
C
8
H
9
O
6
+
|
201.0394
|
201.0403
|
4.5
|
−2.800
|
| C5H2O2 |
|
C5H3O2+ |
95.0128 |
95.0133 |
4.5 |
5.5454 |
| C6H2O4 |
|
C6H3O4+ |
139.0026 |
139.0026 |
5.5 |
−0.1555 |
|
C
10
H
12
O
7
|
5.43
|
C
10
H
13
O
7
+
|
245.0656
|
245.0653
|
10
|
−1.1493
|
| C6H2O4 |
|
C6H3O4+ |
139.0026 |
139.0025 |
5.5 |
−0.3750 |
| C5H2O2 |
|
C5H3O2+ |
95.0128 |
95.0133 |
4.5 |
5.3045 |
|
|
|
Dimers
|
|
C
16
H
14
O
11
|
6.46
|
C
16
H
13
O
11
−
|
381.0463
|
381.0470
|
10.5
|
3.265
|
| C5H2O3 |
|
C5H3O3+ |
111.0077 |
111.0076 |
4.5 |
−0.2327 |
| C9H4O3 |
|
C9H5O3 |
161.0233 |
161.0236 |
7.5 |
1.5791 |
|
C
18
H
18
O
12
|
6.56
|
C
18
H
19
O
12
+
|
427.0871
|
427.0867
|
9.5
|
−2.296
|
| C6H2O4 |
|
C6H3O4+ |
139.0026 |
139.0025 |
5.5 |
−0.5946 |
|
C
16
H
12
O
10
|
7.23
|
C
16
H
13
O
10
+
|
365.0503
|
365.0503
|
10.5
|
−1.593
|
|
|
|
Trimers
|
|
C
24
H
20
O
16
|
7.08
|
C
24
H
19
O
16
−
|
563.0679
|
563.0687
|
15.5
|
2.399
|
|
C
26
H
24
O
17
|
7.17
|
C
26
H
25
O
17
+
|
609.1086
|
609.1075
|
14.5
|
−2.863
|
Among the injected samples, those obtained at 190 °C exhibit more distinctive peaks, implying that higher amounts of the oligomers are formed compared to the lower temperatures. This is in good agreement with the findings of the rest of the instrumental analyses also indicating that the temperature plays a major role in the conversion of FDCA (Fig. 5).
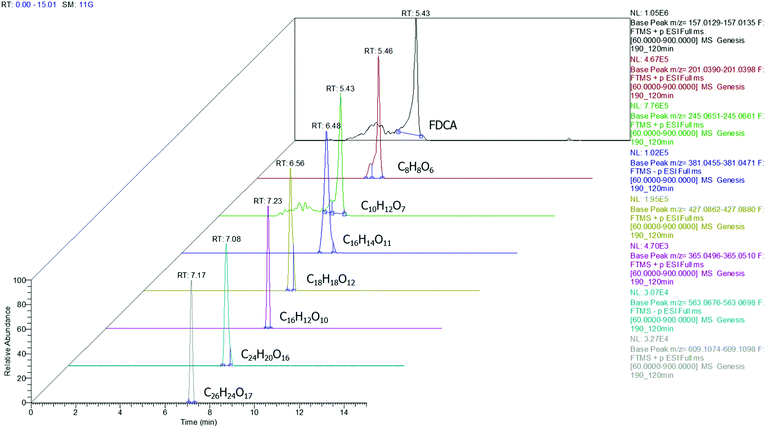 |
| | Fig. 5 Extracted ion chromatograms for FDCA and oligomers detected at a sample corresponding to 190 °C (3D depiction). | |
According to the data presented in Fig. 5, FDCA is eluted at tR 5.43 min, when its protonated ion [C6H5O5]+ with a m/z of 157.0132 is detected, with a mass error of 0.3127 ppm. It is remarkable that for every positive finding of FDCA in the recorded chromatograms from all injections, a subsequent fragmentation of the molecule has been induced, leading to the formation of the characteristic fragments [C5H3O2]+ with m/z 95.0134, pronouncing the tentative identification of FDCA. In addition, two monomers, with formulas of the protonated ions [C8H9O6]+ and [C10H13O7]+, were eluted at similar retention times (5.46 and 5.43 min, respectively) in positive ionization mode, exhibiting a mass error below 3 ppm and at least two fragments each, a fact that increases the confidence level of the measurements. Despite the similarity of the retention times between the two monomers, HRMS facilitates the distinction and unambiguous identification, thereby proving its strength for such applications, thanks to the accurate mass measurement at a high resolution as well as the presence of different fragments. As seen in Table 1, the fragment ions of both monomers are the same, due to the similar structure and nature of the precursor molecules yet formed in different abundance and accompanied by different mass errors. Regarding the dimers, two out of three detected molecules were acquired in positive ESI (C18H19O12+, C16H13O10+) and one in negative ESI (C16H13O11−), at tR 6.56, 7.23 and 6.53, respectively. As the tR increases, compounds with higher molecular weight are identified; hence two trimers were identified later in the chromatograms; more specifically, one trimer with m/z [C24H19O16]− and one with [C26H25O17]+ at tR 7.08 and 7.17, respectively. Both trimers were found at a slightly lower abundance compared to the other oligomers and as a result, the intensity threshold was not enough to induce fragmentation. A typical example of the process followed from the chromatogram to the spectrum of the fragment ions is given in Fig. 6. The mass spectra for all the investigated compounds are included in the ESI.†
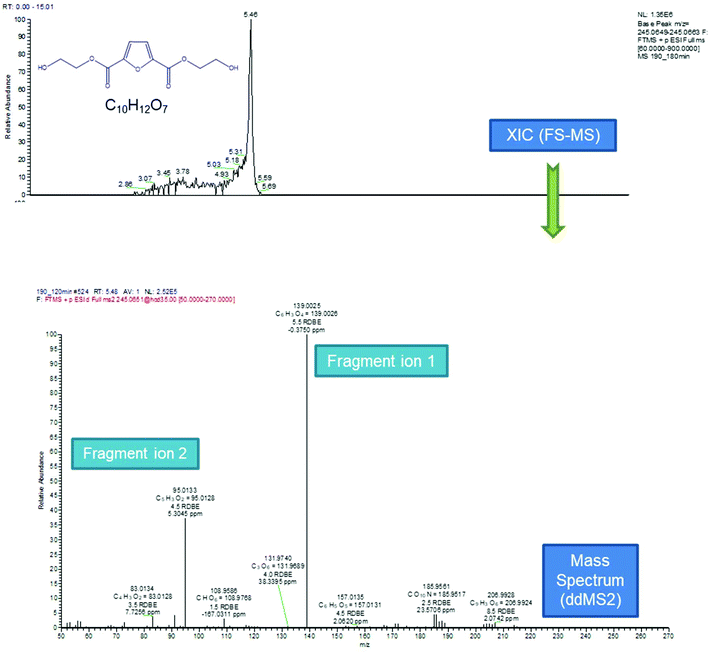 |
| | Fig. 6 Process followed from the extracted ion chromatogram to the spectrum of the fragment ions. | |
In order to construct the kinetic profiles of monomers, dimers and trimers along with FDCA, their relative abundance expressed as the peak area was employed. The concentration profiles with time, based on the LC-HRMS analysis, are presented in Fig. 7. These results are in complete agreement with the ones reported until now. The amount of FDCA steadily decreases as the esterification progresses; FDCA is consumed significantly faster at 190 °C than at lower temperatures. As FDCA decreases, other species appear. Monomers, which include the mono- and di-ester of FDCA, are the first compounds to be formed. At 160 and 170 °C, the concentration of monomers increases rapidly initially and more slowly towards the end of the esterification step. The same trend is observed at 190 °C for the first two hours, while in the last couple of hours the monomer concentration decreases. This is expected since monomers react with each other or with FDCA to yield longer oligomers. According to these results, monomers, and especially the bis(2-hydroxyethyl)furan-2,5-dicarboxylate, dominate the reacting mixture throughout the esterification step.
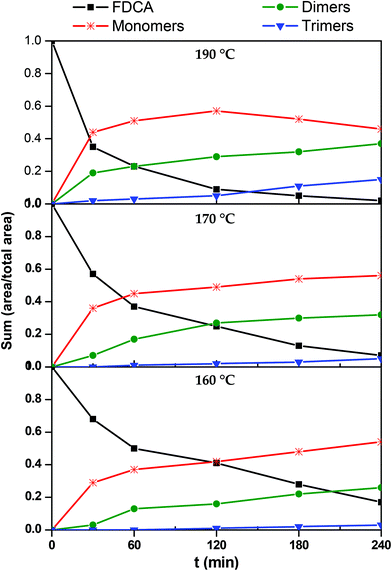 |
| | Fig. 7 Kinetic profiles of 2,5-furandicarboxylic acid (FDCA), monomers (M), dimers (D) and trimers (T) during the esterification reaction. | |
Progressively, as esterification takes place, dimers and trimers are formed. Their concentration increases steadily throughout the esterification step. The higher the temperature, the sooner the production of these oligomers is initiated. For example, at 190 °C trimers are detected in the reacting mixture from the first 30 minutes, while at 160° they are formed only after the first two hours. Similar remarks can also be made for dimers, though, not surprisingly, they form earlier and faster than trimers.
3.2. Transesterification – polycondensation
Once the esterification step of FDCA was studied, we investigated the second step of the polymerization where the molecular weight is being progressively built up. Since a higher conversion was achieved and longer oligomers were formed at 190 °C, this temperature was chosen to prepare two oligomer batches catalyzed by Sb2O3 and Sb(CH3COO)3, respectively. These oligomers were further subjected to transesterification at 3 different temperatures: 220, 230 and 240 °C. Samples were retrieved from the polymerization reactor at 30, 60, 120 and 180 minutes. Intrinsic viscosity (IV) was measured and the samples were further characterized by DSC and IR.
The IV of the samples was measured in a phenol/1,1,2,2-tetrachloroethane mixture as indicated in the experimental part and the results are presented in Fig. 8. It is obvious that at all temperatures and regardless of the catalyst, IV increases with time. The higher the temperature, the higher the values of IV achieved. When comparing the two catalysts, we can see that the IV values obtained in the presence of Sb2O3 are much more important than the ones obtained when using Sb(CH3COO)3. Therefore, according to IV measurements, Sb2O3 has a higher catalytic activity compared to Sb(CH3COO)3. Overall, one could argue that the obtained IV values are not very high; however the aim of the present study was not to obtain high molecular weight PEF and additionally, the polymerization procedure was interrupted each time a sample was retrieved from the reacting mixture. Despite their brevity, those interruptions affected the overall procedure resulting in a lower molecular weight.
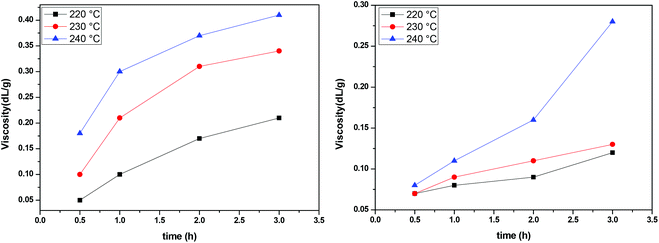 |
| | Fig. 8 Increase of intrinsic viscosity with time at different temperatures, catalyzed by Sb2O3 (left) and Sb(CH3COO)3 (right). | |
Besides IV measurements, all samples were characterized by IR. The trends observed in all spectra are similar and one of them is indicatively presented in Fig. 9. The band corresponding to the carbonyl of the furan ring, at ca. 1720 cm−1, is not affected by the polycondensation reaction, while the band around 3500 cm−1 is progressively decreasing. This is expected since most of the oligomers formed at the end of the esterification step are esters with hydroxyl-ended chains. The ester carbonyl groups are not affected by the transesterification reaction, while the concentration of hydroxyl groups decreases progressively as oligomers react to form polymers and EG is released (since the polycondensation takes place under vacuum, EG is immediately removed from the reacting mixture).
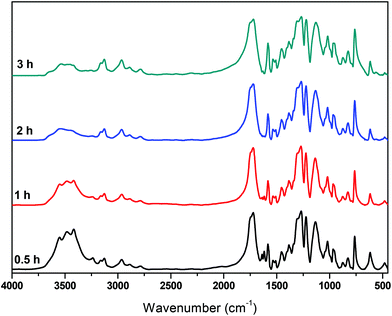 |
| | Fig. 9 FTIR spectra of the polycondensation catalyzed by Sb2O3, at 190 °C, at different reaction times. | |
Finally, these results were complemented with DSC measurements, Fig. 10. As the polycondensation progresses and the length and molecular weight of the polymeric chains increase, Tg and Tm progressively shift to higher temperatures. When the reaction is catalyzed by Sb(CH3COO)3, at 220 °C and at short reaction time (0.5 h) Tg is around 54 °C. By increasing reaction time and temperature Tg reaches approximately 76 °C (3 h, 240 °C). Similarly, Tm increases from 185 °C to 195 °C. A corresponding trend is observed when the polycondensation is catalyzed by Sb2O3, though higher temperatures were recorded. After 3 h at 240 °C, PEF with a Tg at 85 °C and a Tm at 203 °C is obtained. The higher Tg and Tm obtained with Sb2O3 indicate a higher molecular weight. These data are in accordance with the IV results, where PEF of higher molecular weight is obtained when the reaction is catalyzed by Sb2O3 compared to Sb(CH3COO)3, suggesting the superior catalytic performance of Sb2O3.
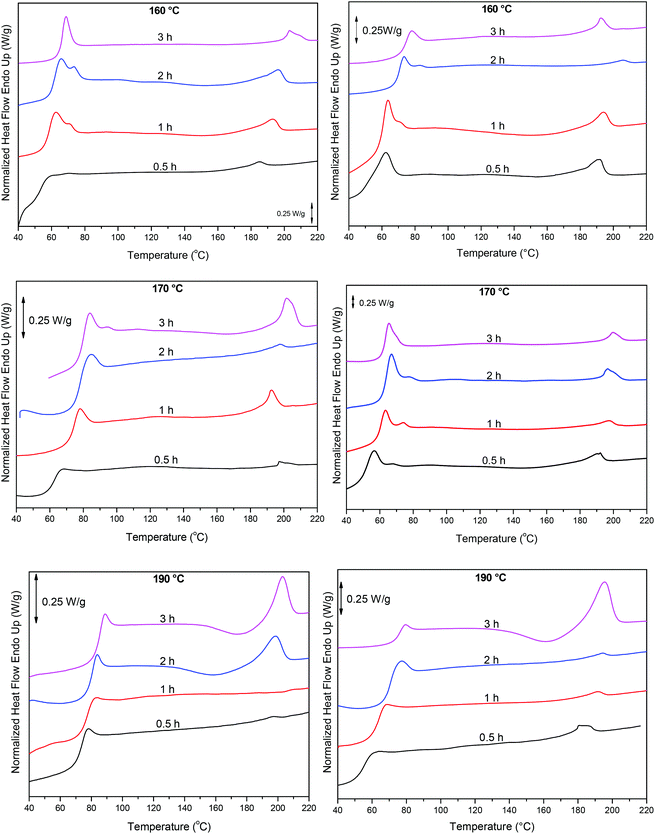 |
| | Fig. 10 DSC thermograms of the condensation step at different reaction times and temperatures, catalyzed by Sb2O3 (left) and Sb(CH3COO)3 (right). | |
4. Kinetic modeling of the processes
There is a whole hierarchy of methods for modeling the pair of esterification and transesterification reactions. The simplest approach is to assume a global reaction with an n-th order kinetics of disappearance of –COOH.76 However, the majority of the modeling efforts attempts to model separately the two reactions, so this is the approach that has been adopted in the present study.
4.1. Esterification reaction
There are three general approaches for modeling the esterification reaction in the literature. They are (in order of decreasing complexity and detail):83 (i) the molecular species model which gives the exact concentration for all species produced during the reaction; (ii) the functional group model which gives information only on the global degree of oligomerization; and (iii) the overall effective reaction model which describes only the consumption of the reactants. The fact that the esterification products have been identified allows to write down the exact set of reactions occurring during esterification. Let us designate as F and A the two reactants (FDCA and EG respectively), while M, D, and T will stand for the products, monomers, dimers and trimers, respectively. Finally, the subscript under the letter denotes the specific type of the i-mers (see the description in Scheme 2). There is a system of 9 reactions that gives the evolution of all the identified components. A category (i) approach implies the direct solution of the 9 ordinary differential equations that describe the reaction set. This means that 9 kinetic constants must be estimated from a limited set of data (underspecified problem). The standard approach to overcome this difficulty in reaction engineering is the model reduction (called lumping) in order to ensure compatibility with the experimental data, allowing the extraction of kinetic parameters.
Another complication in modeling esterification regards the removal of water and A due to evaporation during the reaction. The removal model may be quite complicated, involving thermodynamic equilibrium and mass transfer considerations.77 This may be very important in the case of removal of A. However, in the present experimental set-up only water is removed and since there is no direct measurement of it, the removal process is included in the lumping procedure. In other words, approach (iii) will be followed in this study. It was found, employing the conversion degree data, that the single reaction model used for different esterification reactions is not appropriate to describe the present data. A two-step lumped model is thus proposed here:
This model reflects the finding that –COOH reacts at a different rate in a molecule with two –COOH (F) compared to a molecule with one –COOH (M1). In the following discussion, all the concentrations are normalized by the initial concentration of F (denoted as [F]0) in order to render the analysis independent from initial concentrations. The equations that describe the evolution of the concentrations are:
| |  | (7a) |
| |  | (7b) |
| |  | (7c) |
| |  | (7d) |
The fractional conversion of COOH is computed as 1 − [F] − [M1]/2 since each M1 molecule has half COOH groups than each F molecule. The pseudo-first order reaction constants K1 and K2 are related to the intrinsic second order reaction constants K1in and K2in by K1 = K1in[F]0, K2 = K2in[F]0. The above system of ordinary differential equations has initial conditions (at t = 0) [F] = 1, [A] = 3, [M1] = [M2] = 0 and is solved numerically using the explicit Euler method. The coefficients K1 and K2 are chosen (fitted in a general sense since no exact objective function can be constructed) in order to give a qualitative agreement to the conversion data derived by the two experimental techniques. The comparison between model results and experimental data appears in Fig. 11. The selected values are K1 = 0.2, 0.7, 2.1 h−1 and K2 = 0.15, 0.2 and 0.6 h−1 for temperature T equal to 160, 170 and 190 °C, respectively. The same values were found for the second catalyst except K1 at 160 °C which is 0.3 instead of 0.2. It is clear that the second reaction is a few times slower than the first one. Assuming a mean (for the two catalysts) value of K1 at 160 °C equal to 0.25, the Arrhenius plots (appearing in Fig. 12) were constructed and the two constants K1 and K2 were found to exhibit an Arrhenius temperature dependence Ki = Ki0![[thin space (1/6-em)]](https://www.rsc.org/images/entities/char_2009.gif) exp(−Ei/RgT) (i = 1, 2) with E1/Rg = 13
exp(−Ei/RgT) (i = 1, 2) with E1/Rg = 13![[thin space (1/6-em)]](https://www.rsc.org/images/entities/char_2009.gif) 844 K, E2/Rg = 9520 K (Rg is the gas constant). It appears that the first reaction is more sensitive to temperature than the second one. The resulting Arrhenius temperature dependence confirms that the selected reaction scheme is not an empirical one and has a physical basis (i.e. it accounts for the dominant steps of the complete reaction scheme). It is noted that the employed reaction scheme is the same as the one employed in ref. 77. However, the choice there was to assume that K2 = K1 and to use as additional fitting parameters the mass transfer coefficients of A and W from liquid to gas phase. The fact that the (resulting from fitting) mass transfer coefficient of W was found to be independent of experimental conditions while the mass transfer coefficient of A differs up to 30 times among the experiments raises questions about the validity of the approach in.77
844 K, E2/Rg = 9520 K (Rg is the gas constant). It appears that the first reaction is more sensitive to temperature than the second one. The resulting Arrhenius temperature dependence confirms that the selected reaction scheme is not an empirical one and has a physical basis (i.e. it accounts for the dominant steps of the complete reaction scheme). It is noted that the employed reaction scheme is the same as the one employed in ref. 77. However, the choice there was to assume that K2 = K1 and to use as additional fitting parameters the mass transfer coefficients of A and W from liquid to gas phase. The fact that the (resulting from fitting) mass transfer coefficient of W was found to be independent of experimental conditions while the mass transfer coefficient of A differs up to 30 times among the experiments raises questions about the validity of the approach in.77
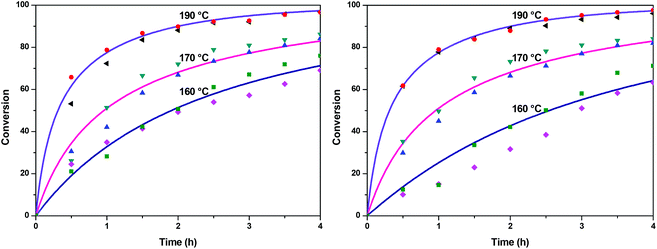 |
| | Fig. 11 Comparison between model (solid lines) and experimental (symbols) conversions of esterification reaction with (a) Sb2O3 and (b) Sb(CH3COO)3. | |
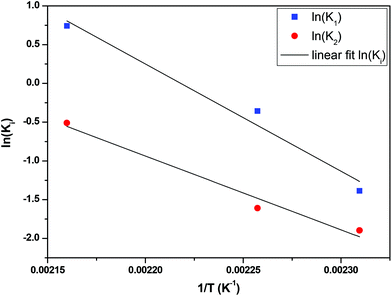 |
| | Fig. 12 Arrhenius plot for the constants K1 and K2 of esterification reaction. | |
The above global reaction scheme cannot predict the evolution of the concentration of the identified oligomers. This could be done in principle by the detailed reaction system for oligomers. However, the experimental information is still not enough to allow simultaneous determination of the 9 kinetic coefficients. Instead a different lumped reaction scheme focused on oligomer evolution is employed, with a smaller number of kinetic constants to make their determination from the experimental data feasible. The following reaction scheme is considered (produced water does not appear in the following scheme because it does not participate in the kinetic equations and due to lumping its exact stoichiometric coefficient is unknown):
where M refers to M
1 + M
2, D refers to D
1 + D
2 + D
3 and T refers to T
1 + T
2. The evolution of concentrations can be found from the following system of ordinary differential equations.
| |  | (9a) |
| |  | (9b) |
| |  | (9c) |
| |  | (9d) |
| |  | (9e) |
where the concentrations are once more normalized to [F]
0 and the coefficients
ki (inverse time units) are equal to the intrinsic second order reaction coefficients multiplied by [F]
0. The initial conditions for the above system (at
t = 0) are [F] = 1, [A] = 3, [M] = [D] = [T] = 0. It is solved numerically using the explicit Euler method. The normalized concentrations can be used to find the molar fractions in the reaction mixture (dividing each of them with their sum).
In order to compare the experimentally determined weight fractions with the model results, they must be transformed to molar fractions. This is done by using the average molecular weight of the different types of monomers, dimers and trimers appearing in Scheme 2. This is only an approximation since the exact concentration of each species is not known but the error is not appreciable since the molecular weights do not vary a lot among the different forms of i-mers. The parameters k1, k2, and k3 were extracted by fitting the model to the data. The comparison between experimental and model molar fractions is shown in Fig. 13 for the three temperatures. The comparison for the trimers is not shown due to their small fractions but it is stated that there is an agreement up to a molar fraction of 0.01. The deviation is somewhat larger only for the highest temperature and time and the model overpredicts the trimer concentration by not taking into account the possibility of (a small amount) of larger molecules. The values of the extracted constants are for 160 °C: k1 = 0.19, k2 = 1.3, k3 = 0.105 h−1; for 170 °C: k1 = 0.29, k2 = 1.5, k3 = 0.12 h−1; for 190 °C: k1 = 0.6, k2 = 3.45, k3 = 0.24 h−1. We calculated the index R2 to quantify the quality of fitting. Its average value for the three curves of each temperature is R2 = 0.92, 0.94, 0.92 for T = 190 °C, 170 °C and 160 °C respectively. By observing the experimental data in Fig. 13 it can be argued that the larger part of deviation of R2 from unity is due to the data uncertainty (scatter) rather than to the performance of the model.
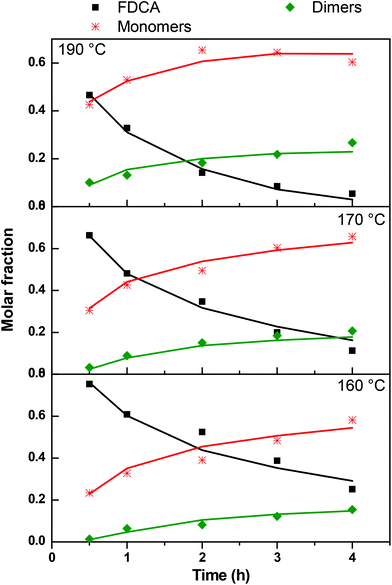 |
| | Fig. 13 Comparison between model (solid lines) and experimental data (symbols) of molar fraction evolution of FDCA (F), monomers (M), dimers (D) and trimers (T) during the esterification reaction. | |
The kinetic constants increase with temperature, so they were placed in an Arrhenius plot and it was found that an Arrhenius temperature dependence is closely followed. These plots are shown in Fig. 14. The corresponding activation energies found for the three reactions constants are E1/Rg = 6780 K, E2/Rg = 7655 K, and E3/Rg = 5726 K respectively. Summarizing a consistent set of 5 reaction constants following Arrhenius dependence was derived from the existing experimental data by constructing two properly lumped reaction schemes. Such an achievement would not be possible using the detailed reaction scheme due to a large number of undetermined parameters. The successful modelling and parameter estimation using experimental data for the i-mer evolution of the esterification reaction of FDCA with EG is an essential innovation of the present work.
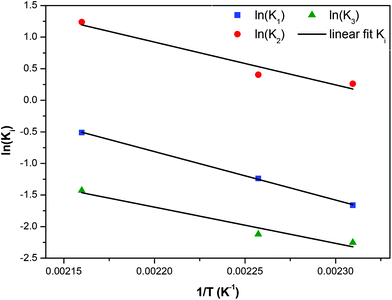 |
| | Fig. 14 Arrhenius plot for the constants of reaction scheme (8). | |
4.2. Transesterification – polycondensation reaction
In the present case of reactants there is only one functional group that reacts, so the functional group and the empirical global reaction approaches coincide. Typically, a second order global reaction is assumed.84 As an example, in ref. 74 a second order reaction is employed combined to a thermodynamic-mass transfer model for EG (necessary for the experimental setup therein). The fact that the fit leads to the initial mass transfer coefficient varying up to 12 orders of magnitude among the employed experimental conditions suggests that a more general reaction kinetic model must be considered. The transesterification reaction is a linear chain polymerization reaction and the second order implies that the reaction constants do not depend on the chain length of the reactant molecules. This assumption was relaxed by assuming a rate constant decreasing with the chain length of reactants as follows Ki,j = K0(i−λ + j−λ) where i and j are the chain lengths of the reacting molecules. The coagulation population balance with the above rate was derived, and the monodisperse method of moments was applied in order to end up with the following equation for the evolution of the average molecular weight Xw.69| |  | (10) |
where KR = K0C0Mw0, Mw0 is the monomer molecular weight and C0 is the initial monomer concentration. In order to compare the model results to the experimental ones, the molecular weight Xw0 at time t = t0 (equal to 0.5 h in the present case) is considered known and equal to the experimental one. Its subsequent evolution must be described by eqn (9) in which equation can be integrated from t0 to t to give:| |  | (11) |
The above expression is fitted to the experimental molecular weight evolution curves (comparison between the model and experimental data appears in Fig. 15). The averaged fitting coefficient R2 for the three temperatures is 0.96 and 0.92 for Sb2O3 and Sb(CH3COO)3, respectively, which are rather acceptable values. The results for antimony oxide are quite expected. A temperature independent value of λ = 1 (typical of this type of reaction69) is found with values of KR increasing with temperature as follows: KR = 1.5 × 10⁶ h−1, 8 × 10⁶ h−1 and 12 × 106 h−1 for T = 220, 230 and 240 °C, respectively. This exponent denotes the decrease of the mobility of the molecules as their molecular weight increases. A quite strange behavior is observed for antimony acetate. The reaction proceeds very slowly (and quite similarly) for 220 °C and 230 °C. In this case the small extent of the reaction and scatter of the data allows fitting using any value of λ (ill-posed problem). The simplest choice is to assume λ = 0. Surprisingly the reaction becomes accelerated (like a self-catalyzed one) at 240 °C leading to a quite unusual value of λ = −0.9. The second catalyst appears to have not only small yield but also uncontrollable behavior and for these reasons it is not appropriate for the present process.
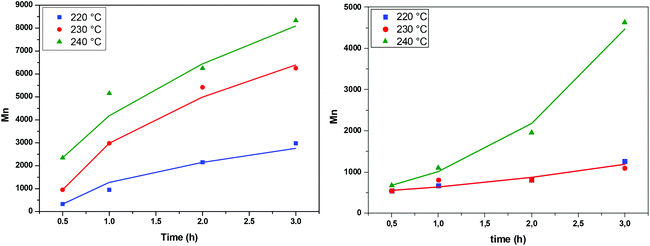 |
| | Fig. 15 Evolution of average molecular weight during the transesterification step at different temperatures, catalyzed by Sb2O3 (left) and Sb(CH3COO)3 (right). Comparison between model (solid lines) and experimental data (symbols). | |
5. Conclusions
In the present work, the catalytic activity of two industrial, safe for food packaging applications, antimony catalysts, antimony trioxide, Sb2O3, and antimony acetate, Sb(CH3COO)3, in the two-step polymerization of FDCA with EG for the production of PEF was investigated. The progress of the esterification step was monitored by end-group analysis (titration of –COOH groups), as well as NMR and FTIR spectroscopy. Based on the obtained conversions, it was deduced that, for the first step of the polymerization, i.e. the esterification of FDCA with EG to afford PEF oligomers, Sb2O3 seems more active than Sb(CH3COO)3 at lower temperatures (160 °C). Increasing the temperature smoothens the differences between the catalysts and at 190 °C satisfactory conversions are obtained. For the first time the structure of the PEF oligomers formed during the first step of the polymerization was identified by LC-HRMS and the evolution of their concentrations with reaction time was determined. HRMS investigations demonstrated that at 190 °C, in the presence of Sb2O3, dimers and trimers had already formed within the first 30 minutes. In the second step of the polymerization, the difference between the two catalysts is much more pronounced, with Sb2O3 exhibiting the highest activity. Not surprisingly, a higher temperature also contributes to the formation of higher molecular weight polymers. These experimental observations were complemented by theoretical kinetic investigations and the rate constants for the different reactions taking place during the polymerization were calculated.
Funding
This publication is based upon work from COST Action FUR4Sustain, CA18220, supported by COST (European Cooperation in Science and Technology).
Conflicts of interest
There are no conflicts to declare.
References
- H. Storz and K.-D. Vorlop, Landbauforsch. Appl. Agric. For. Res., 2013, 63, 321 Search PubMed.
- G. Walther, High-performance polymers from nature: catalytic routes and processes for industry, ChemSusChem, 2014, 7, 2081 CrossRef CAS PubMed.
- D. K. Schneiderman and M. A. Hillmyer, 50th anniversary perspective: there is a great future in sustainable polymers, Macromolecules, 2017, 50, 3733 CrossRef CAS.
- R. Mülhaupt, Green polymer chemistry and bio-based plastics: dreams and reality, Macromol. Chem. Phys., 2013, 214, 159 CrossRef.
- A. Llevot, P. K. Dannecker, M. Von Czapiewski, L. C. Over, Z. Söyler and M. A. R. Meier, Renewability is not enough: recent advances in the sustainable synthesis of biomass-derived monomers and polymers, Chem. – Eur. J., 2016, 22, 11510 CrossRef CAS PubMed.
- G. Q. Chen and M. K. Patel, Plastics derived from biological sources: present and future: a technical and environmental review, Chem. Rev., 2012, 112, 2082 CrossRef CAS PubMed.
- W. P. Dijkman, D. E. Groothuis and M. W. Fraaije, Enzyme-catalyzed oxidation of 5-hydroxymethylfurfural to furan-2,5-dicarboxylic acid, Angew. Chem., Int. Ed., 2014, 53, 6515 CrossRef CAS PubMed.
- J. J. Bozell and G. R. Petersen, Technology Development for the Production of Biobased Products from Biorefinery Carbohydrates - The US Department of Energy's “Top 10” Revisited, Green Chem., 2010, 12(4), 539 RSC.
- A. Gandini, A. J. D. Silvestre, C. P. Neto, A. F. Sousa and M. Gomes, The furan counterpart of poly(ethylene terephthalate): An alternative material based on renewable resources, J. Polym. Sci., Part A: Polym. Chem., 2009, 47(11), 295 CrossRef CAS.
- J. G. van Berkel, N. Guigo, H. A. Visser and N. Sbirrazzuoli, Chain Structure and Molecular Weight Dependent Mechanics of Poly(ethylene 2,5-furandicarboxylate) Compared to Poly(ethylene terephthalate), Macromolecules, 2018, 51(21), 8539 CrossRef.
- X. Fei, J. Wang, J. Zhu, X. Wang and X. Liu, Bio-based Poly(ethylene 2,5-furanoate): No Longer an Alternative, but an Irreplaceable Polyester in the Polymer Industry, ACS Sustainable Chem. Eng., 2020, 8(23), 8471 CrossRef.
- K. Loos, R. Zhang, I. Pereira, B. Agostinho, H. Hu, D. Maniar, N. Sbirrazzuoli, A. J. D. Silvestre, N. Guigo and A. F. Sousa, A Perspective on PEF Synthesis, Properties, and End-Life, Front. Chem., 2020, 8, 585 CrossRef PubMed.
- A. J. J. E. Eerhart, A. P. C. Faaij and M. K. Patel, Replacing fossil based PET with biobased PEF; process analysis, energy and GHG balance, Energy Environ. Sci., 2012, 5, 6407 RSC.
-
E. de Jong, M. A. Dam, L. Sipos and G.-J. M. Gruter, Furandicarboxylic Acid (FDCA), A Versatile Building Block for a Very Interesting Class of Polyesters, ACS Symp. Ser., 2012, vol 1105, pp. 1–13 Search PubMed.
- A. J. J. E. Eerhart, M. K. Patel and A. P. C. Faaij, Fuels and plastics from lignocellulosic biomass via the furan pathway: an economic analysis, Biofuels, Bioprod. Biorefin., 2015, 9(3), 307 CrossRef.
- C. F. Araujo, M. M. Nolasco, P. J. A. Ribeiro-Claro, S. Rudić, A. J. D. Silvestre, P. D. Vaz and A. F. Sousa, Inside PEF: Chain Conformation and Dynamics in Crystalline and Amorphous Domains, Macromolecules, 2018, 51(9), 3515 CrossRef.
- E. Forestier, C. Combeaud, N. Guigo, G. Monge, J.-M. Haudin, N. Sbirrazzuoli and N. Billon, Strain-induced crystallization of poly(ethylene 2,5-furandicarboxylate). Mechanical and crystallographic analysis, Polymer, 2020, 187, 122126 CrossRef.
- J. G. van Berkel, N. Guigo, J. J. Kolstad and N. Sbirrazzuoli, Biaxial Orientation of Poly(ethylene 2,5-furandicarboxylate): An Explorative Study, Macromol. Mater. Eng., 2018, 303(3), 1700507 CrossRef.
- D. G. Papageorgiou, N. Guigo, V. Tsanaktsis, S. Exarhopoulos, D. N. Bikiaris, N. Sbirrazzuoli and G. Z. Papageorgiou, Fast Crystallization and Melting Behavior of a Long-Spaced Aliphatic Furandicarboxylate Biobased Polyester, Poly(dodecylene 2,5-furanoate), Ind. Eng. Chem. Res., 2016, 55(18), 5315 CrossRef.
- E. Forestier, C. Combeaud, N. Guigo, N. Sbirrazzuoli and N. Billon, Understanding of strain-induced crystallization developments scenarios for polyesters: Comparison of poly(ethylene furanoate), PEF, and poly(ethylene terephthalate), PET, Polymer, 2020, 203, 122755 CrossRef.
- L. Maini, M. Gigli, M. Gazzano, N. Lotti, D. N. Bikiaris and G. Z. Papageorgiou, Structural Investigation of Poly(ethylene furanoate) Polymorphs, Polymer, 2018, 10(3), 296 Search PubMed.
- G. Z. Papageorgiou, D. G. Papageorgiou, Z. Terzopoulou and D. N. Bikiaris, Production of bio-based 2,5-furan dicarboxylate polyesters: Recent progress and critical aspects in their synthesis and thermal properties, Eur. Polym. J., 2016, 83, 202 CrossRef.
- Z. Terzopoulou, L. Papadopoulos, A. Zamboulis, D. G. Papageorgiou, G. Z. Papageorgiou and D. N. Bikiaris, Tuning the Properties of Furandicarboxylic Acid-Based Polyesters with Copolymerization: A Review, Polymer, 2020, 12(6), 1209 Search PubMed.
- A. F. Sousa, N. Guigo, M. Pożycka, M. Delgado, J. Soares, P. V. Mendonça, J. F. J. Coelho, N. Sbirrazzuoli and A. J. D. Silvestre, Tailored design of renewable copolymers based on poly(1,4-butylene 2,5-furandicarboxylate) and poly(ethylene glycol) with refined thermal properties, Polym. Chem., 2018, 9, 722 RSC.
- M. Soccio, M. Costa, N. Lotti, M. Gazzano, V. Siracusa, E. Salatelli, P. Manaresi and A. Munari, Novel fully biobased poly(butylene 2,5-furanoate/diglycolate) copolymers containing ether linkages: Structure-property relationships, Eur. Polym. J., 2016, 81, 397 CrossRef.
- H. Xie, L. Wu, B.-G. Li and P. Dubois, Modification of Poly(ethylene 2,5-furandicarboxylate) with Biobased 1,5-Pentanediol: Significantly Toughened Copolyesters Retaining High Tensile Strength and O2 Barrier Property, Biomacromolecules, 2019, 20(1), 353 CrossRef PubMed.
- M. J. Soares, P.-K. Dannecker, C. Vilela, J. Bastos, M. A. R. Meier and A. F. Sousa, Poly(1,20-eicosanediyl 2,5-furandicarboxylate), a biodegradable polyester from renewable resources, Eur. Polym. J., 2017, 90, 301 CrossRef.
- L. Genovese, N. Lotti, V. Siracusa and A. Munari, Poly(Neopentyl Glycol Furanoate): A Member of the Furan-Based Polyester Family with Smart Barrier Performances for Sustainable Food Packaging Applications, Materials, 2017, 10(9), 1028 CrossRef PubMed.
- M. Matos, A. F. Sousa, A. C. Fonseca, C. S. R. Freire, J. F. J. Coelho and A. J. D. Silvestre, A New Generation of Furanic Copolyesters with Enhanced Degradability: Poly(ethylene 2,5-furandicarboxylate)–co–poly(lactic acid) Copolyesters, Macromol. Chem. Phys., 2014, 215(22), 2175 CrossRef.
- Y. Jiang, D. Maniar, A. J. J. Woortman and K. Loos, Enzymatic synthesis of 2,5-furandicarboxylic acid-based semi-aromatic polyamides: enzymatic polymerization kinetics, effect of diamine chain length and thermal properties, RSC Adv., 2016, 6, 67941 RSC.
- L. Genovese, M. Soccio, N. Lotti, A. Munari, A. Szymczyk, S. Paszkiewicz, A. Linares, A. Nogales and T. A. Ezquerra, Effect of chemical structure on the subglass relaxation dynamics of biobased polyesters as revealed by dielectric spectroscopy: 2,5-furandicarboxylic acid vs. trans-1,4-cyclohexanedicarboxylic acid, Phys. Chem. Chem. Phys., 2018, 20, 15696 RSC.
- D. Maniar, K. F. Hohmann, Y. Jiang, A. J. J. Woortman, J. van Dijken and K. Loos, Enzymatic Polymerization of Dimethyl 2,5-Furandicarboxylate and Heteroatom Diamines, ACS Omega, 2018, 3(6), 7077 CrossRef PubMed.
- G. Guidotti, L. Genovese, M. Soccio, M. Gigli, A. Munari, V. Siracusa and N. Lotti, Block Copolyesters Containing 2,5-Furan and trans-1,4-Cyclohexane Subunits with Outstanding Gas Barrier Properties, Int. J. Mol. Sci., 2019, 20(9), 2187 CrossRef PubMed.
- Y. Jiang, D. Maniar, A. J. J. Woortman, G. O. R. Alberda Van Ekenstein and K. Loos, Enzymatic Polymerization of Furan-2,5-Dicarboxylic Acid-Based Furanic-Aliphatic Polyamides as Sustainable Alternatives to Polyphthalamides, Biomacromolecules, 2015, 16(11), 3674 CrossRef PubMed.
- G. Guidotti, M. Soccio, M.-C. García-Gutiérrez, E. Gutiérrez-Fernández, T. A. Ezquerra, V. Siracusa, A. Munari and N. Lotti, Evidence of a 2D-Ordered Structure in Biobased Poly(pentamethylene furanoate) Responsible for Its Outstanding Barrier and Mechanical Properties, ACS Sustainable Chem. Eng., 2019, 7(21), 17863 CrossRef.
- S. Chen, R. Zou, L. Li, J. Shang, S. Lin and J. Lan, Preparation of biobased poly(propylene 2,5-furandicarboxylate) fibers: Mechanical, thermal and hydrolytic degradation properties, J. Appl. Polym. Sci., 2021, 138(18), e50345 CrossRef.
- H. Hu, R. Zhang, A. Sousa, Y. Long, W. B. Ying, J. Wang and J. Zhu, Bio-based poly(butylene 2,5-furandicarboxylate)-b-poly(ethylene glycol) copolymers with adjustable degradation rate and mechanical properties: Synthesis and characterization, Eur. Polym. J., 2018, 106, 42 CrossRef.
- M. Soccio, D. E. Martínez-Tong, A. Alegría, A. Munari and N. Lotti, Molecular dynamics of fully biobased poly(butylene 2,5-furanoate) as revealed by broadband dielectric spectroscopy, Polymer, 2017, 128, 24 CrossRef.
- P. A. Klonos, L. Papadopoulos, D. Tzetzis, A. Kyritsis, G. Z. Papageorgioud and D. N. Bikiaris, Thermal, nanoindentation and dielectric study of nanocomposites based on poly(propylene furanoate) and various inclusions, Mater. Today Commun., 2019, 20, 100585 CrossRef.
- M. Matos, A. F. Sousa, N. H. C. S. Silva, C. S. R. Freire, M. Andrade, A. Mendes and A. J. D. Silvestre, Furanoate-Based Nanocomposites: A Case Study Using Poly(Butylene 2,5-Furanoate) and Poly(Butylene 2,5-Furanoate)-co-(Butylene Diglycolate) and Bacterial Cellulose, Polymer, 2018, 10(8), 810 Search PubMed.
- P. Skoczinski, M. K. Espinoza Cangahuala, D. Maniar, R. W. Albach, N. Bittner and K. Loos, Biocatalytic Synthesis of Furan-Based Oligomer Diols with Enhanced End-Group Fidelity, ACS Sustainable Chem. Eng., 2020, 8(2), 1068 CrossRef.
- M. Matos, A. F. Sousa, P. V. Mendonça and A. J. D. Silvestre, Co-Polymers based on Poly(1,4-butylene 2,5-furandicarboxylate) and Poly(propylene oxide) with Tuneable Thermal Properties: Synthesis and Characterization, Materials, 2019, 12(2), 328 CrossRef PubMed.
- G. Guidotti, M. Soccio, N. Lotti, M. Gazzano, V. Siracusa and A. Munari, Poly(propylene 2,5-thiophenedicarboxylate) vs. Poly(propylene 2,5-furandicarboxylate): Two Examples of High Gas Barrier Bio-Based Polyesters, Polymer, 2018, 10(7), 785 Search PubMed.
- Y. Jiang, A. J. J. Woortman, G. O. R. Alberda van Ekenstein and K. Loos, A biocatalytic approach towards sustainable furanic–aliphatic polyesters, Polym. Chem., 2015, 6, 5198 RSC.
- M. Gigli, F. Quartinello, M. Soccio, A. Pellis, N. Lotti, G. M. Guebitz, S. Licoccia and A. Munari, Enzymatic hydrolysis of poly(1,4-butylene 2,5-thiophenedicarboxylate) (PBTF) and poly(1,4-butylene 2,5-furandicarboxylate) (PBF) films: A comparison of mechanisms, Environ. Int., 2019, 130, 104852 CrossRef PubMed.
- B. Robles-Hernández, M. Soccio, I. Castrillo, G. Guidotti, N. Lotti, Á. Alegría and D. E. Martínez-Tong, Poly(alkylene 2,5-furanoate)s thin films: Morphology, crystallinity and nanomechanical properties, Polymer, 2020, 204, 122825 CrossRef.
- N. Poulopoulou, N. Guigo, N. Sbirrazzuoli, D. G. Papageorgiou, D. N. Bikiaris, G. N. Nikolaidis and G. Z. Papageorgiou, Towards increased sustainability for aromatic polyesters: Poly(butylene 2,5-furandicarboxylate) and its blends with poly(butylene terephthalate), Polymer, 2020, 123157 Search PubMed.
- G. Guidotti, M. Soccio, M. C. García-Gutiérrez, T. Ezquerra, V. Siracusa, E. Gutiérrez-Fernández, A. Munari and N. Lotti, Fully Biobased Superpolymers of 2,5-Furandicarboxylic Acid with Different Functional Properties: From Rigid to Flexible, High Performant Packaging Materials, ACS Sustainable Chem. Eng., 2020, 8(25), 9558 CrossRef PubMed.
- M. Vannini, P. Marchese, A. Celli and C. Lorenzetti, Fully biobased poly(propylene 2,5-furandicarboxylate) for packaging applications: excellent barrier properties as a function of crystallinity, Green Chem., 2015, 17, 4162 RSC.
- J. C. Morales-Huerta, A. Martínez de Ilarduya and S. Muñoz-Guerra, Sustainable Aromatic Copolyesters via Ring Opening Polymerization: Poly(butylene 2,5-furandicarboxylate-co-terephthalate)s, ACS Sustainable Chem. Eng., 2016, 4(9), 4965 CrossRef.
- S. Mahmud, J. Wang, N. Shao, Z. Xiong, R. Zhang and J. Zhu, Nucleation and crystallization of poly(propylene 2,5-furan dicarboxylate) by direct blending of microcrystalline cellulose: improved tensile and barrier properties, Cellulose, 2020, 27, 9436 CrossRef.
- J. C. Morales-Huerta, A. Martínez de Ilarduya, S. León and S. Muñoz-Guerra, Isomannide-Containing Poly(butylene 2,5-furandicarboxylate) Copolyesters via Ring Opening Polymerization, Macromolecules, 2018, 51(9), 3340 CrossRef.
- A. F. Sousa, M. Matos, C. S. R. Freire, A. J. D. Silvestre and J. F. J. Coelho, New copolyesters derived from terephthalic and 2,5-furandicarboxylic acids: A step forward in the development of biobased polyesters, Polymer, 2013, 54(2), 513 CrossRef.
- A. F. Sousa, A. C. Fonseca, A. C. Serra, C. S. Freire, A. J. D. Silvestre and J. Coelho, New unsaturated copolyesters based on 2,5-furandicarboxylic acid and their crosslinked derivatives, Polym. Chem., 2016, 7, 1049 RSC.
- M. Soccio, N. Lotti, A. Munari, E. Rebollar and D. E. Martínez-Tong, Wrinkling poly(trimethylene 2,5-furanoate) free-standing films: Nanostructure formation and physical properties, Polymer, 2020, 202, 122666 CrossRef.
- M. Matos, A. F. Sousa and A. J. D. Silvestre, Improving the Thermal Properties of Poly(2,5-furandicarboxylate)s Using Cyclohexylene Moieties: A Comparative Study, Macromol. Chem. Phys., 2017, 218(5), 1600492 CrossRef.
- J. C. Morales-Huerta, A. Martínez de Ilarduya and S. Muñoz-Guerra, Partially Renewable Poly(butylene 2,5-furandicarboxylate-co-isophthalate) Copolyesters Obtained by ROP, Polymer, 2018, 10(5), 483 Search PubMed.
- J. C. Morales-Huerta, A. Martínez de Ilarduya and S. Muñoz-Guerra, Poly(alkylene 2,5-furandicarboxylate)s (PEF and PBF) by ring opening polymerization, Polymer, 2016, 87, 148 CrossRef.
- N. Lotti, A. Munari, M. Gigli, M. Gazzano, V. Tsanaktsis, D. N. Bikiaris and G. Z. Papageorgiou, Thermal and structural response of in situ prepared biobased poly(ethylene 2,5-furan dicarboxylate) nanocomposites, Polymer, 2016, 103, 288 CrossRef.
- D. Maniar, F. Silvianti, V. M. Ospina, A. J. J. Woortman, J. van Dijken and K. Loos, On the way to greener furanic-aliphatic poly(ester amide)s: Enzymatic polymerization in ionic liquid, Polymer, 2020, 205, 122662 CrossRef.
- A. F. Sousa, J. F. J. Coelho and A. J. D. Silvestre, Renewable-based poly((ether)ester)s from 2,5-furandicarboxylic acid, Polymer, 2016, 98, 119 CrossRef.
- G. Z. Papageorgiou, N. Guigo, V. Tsanaktsis, D. G. Papageorgiou, S. Exarhopoulos, N. Sbirrazzuoli and D. N. Bikiaris, On the bio-based furanic polyesters: Synthesis and thermal behavior study of poly(octylene furanoate) using fast and temperature modulated scanning calorimetry, Eur. Polym. J., 2015, 68, 115 CrossRef.
- V. Tsanaktsis, D. N. Bikiaris, N. Guigo, S. Exarhopoulos, D. G. Papageorgiou, N. Sbirrazzuoli and G. Z. Papageorgiou, Synthesis, properties and thermal behavior of poly(decylene-2,5-furanoate): a biobased polyester from 2,5-furan dicarboxylic acid, RSC Adv., 2015, 5, 7459 RSC.
- A. Martínez de Ilarduya and S. Muñoz Guerra, Ring opening polymerization of macrocyclic oligoesters derived from renewable sources, Polym. Chem., 2020, 11, 4850 RSC.
- D. Maniar, Y. Jiang, A. J. J. Woortman, J. van Dijken and K. Loos, Furan–Based Copolyesters from Renewable Resources: Enzymatic Synthesis and Properties, ChemSusChem, 2019, 12(5), 990 CrossRef PubMed.
- J. C. Morales-Huerta, A. Martínez de Ilarduya and S. Muñoz-Guerra, Blocky poly(ε-caprolactone-co-butylene 2,5-furandicarboxylate) copolyesters via enzymatic ring opening polymerization, J. Polym. Sci., Part A: Polym. Chem., 2018, 56(3), 290 CrossRef.
- J. C. Morales-Huerta, C. B. Ciulik, A. Martínez de Ilarduya and S. Muñoz-Guerra, Fully bio-based aromatic–aliphatic copolyesters: poly(butylene furandicarboxylate-co-succinate)s obtained by ring opening polymerization, Polym. Chem., 2017, 8, 748 RSC.
- G. J. M. Gruter, L. Sipos and M. A. Dam, Accelerating Research into Bio-Based FDCA-Polyesters by Using Small Scale Parallel Film Reactors, Comb. Chem. High Throughput Screening, 2012, 15(2), 180 CrossRef PubMed.
- Z. Terzopoulou, E. Karakatsianopoulou, N. Kasmi, V. Tsanaktsis, N. Nikolaidis, M. Kostoglou, G. Z. Papageorgiou, D. A. Lambropoulou and D. N. Bikiaris, Effect of catalyst type on molecular weight increase and coloration of poly(ethylene furanoate) biobased polyester during melt polycondensation, Polym. Chem., 2017, 8(44), 6895 RSC.
- R. J. I. Knoop, W. Vogelzang, J. van Haveren and D. S. van Es, High molecular weight poly(ethylene-2,5-furanoate); critical aspects in synthesis and mechanical property determination, J. Polym. Sci., Part A: Polym. Chem., 2013, 51(19), 4191 CrossRef.
- M. B. Banella, J. Bonucci, M. Vannini, P. Marchese, C. Lorenzetti and A. Celli, Insights into the Synthesis of Poly(ethylene 2,5-Furandicarboxylate) from 2,5-Furandicarboxylic Acid: Steps toward Environmental and Food Safety Excellence in Packaging Applications, Ind. Eng. Chem. Res., 2019, 58(21), 8955 CrossRef.
- Z. Terzopoulou, E. Karakatsianopoulou, N. Kasmi, M. Majdoub, G. Z. Papageorgiou and D. N. Bikiaris, Effect of catalyst type on recyclability and decomposition mechanism of poly(ethylene furanoate) biobased polyester, J. Anal. Appl. Pyrolysis, 2017, 126, 357 CrossRef.
- M. Lomeli-Rodriguez, M. Martin-Molina, M. Jimenez-Pardo, Z. Nasim-Afzal, S. I. Cauet, T. E. Davies, M. Rivera-Toledo and J. A. Lopez-Sanchez, Synthesis and kinetic modeling of biomass-derived renewable polyesters, J. Polym. Sci., Part A: Polym. Chem., 2016, 54(18), 2876 CrossRef.
- A. L. T. Brandão, B. F. Oechsler, F. W. Gomes, F. G. Souza Jr. and J. C. Pinto, Modeling and parameter estimation of step-growth polymerization of poly(ethylene-2,5-furandicarboxylate), Polym. Eng. Sci., 2018, 58(5), 729 CrossRef.
-
M. Toshiaki, K. Masayuki, K. Takeyuki and M. Norifumi, US Pat, US20140024793A1, 2013 Search PubMed.
- V. Tsanaktsis, G. Z. Papageorgiou and D. N. Bikiaris, A Facile Method to Synthesize High-Molecular-Weight Biobased Polyesters from 2,5-Furandicarboxylic Acid and Long-Chain Diols, J. Polym. Sci., Part A: Polym. Chem., 2015, 53(22), 2617 CrossRef.
- A. S. Joshi, N. Alipourasiabi, Y.-W. Kim, M. R. Coleman and J. G. Lawrence, Role of enhanced solubility in esterification of 2,5-furandicarboxylic acid with ethylene glycol at reduced temperatures: energy efficient synthesis of poly(ethylene 2,5-furandicarboxylate), React. Chem. Eng., 2018, 3, 447 RSC.
- T. Yamada and Y. Imamura, Simulation of Continuous Direct Esterification Process between Terephthalic Acid and Ethylene Glycol, Polym.-Plast. Technol. Eng., 1989, 28(7–8), 811 CrossRef.
- H. Patel, G. Feix and R. Schomäcker, Modeling of Semibatch Esterification Process for Poly(ethylene terephthalate) Synthesis, Macromol. React. Eng., 2007, 1(4), 502 CrossRef.
- M. Krumpolc and J. Malek, Esterification of Benzenecarboxylic Acids with Ethylene Glycol. 4. Kinetics of the initial stage of polyesterification of terephthalic acid with ethylene glycol catalyzed by zinc oxide, Makromol. Chem., 1973, 171(1), 69 CrossRef.
-
A. E. Ardis and A. A. Vaitekunas, DE Pat, DE1198343B, 1965 Search PubMed.
- M. Gomes, A. Gandini, A. J. D. Silvestre and B. Reis, Synthesis and Characterization of Poly(2,5-furan dicarboxylate)s Based on a Variety of Diols, J. Polym. Sci., Part A: Polym. Chem., 2011, 49(17), 3759 CrossRef.
- D. N. Bikiaris and D. S. Achilias, Synthesis of poly(alkylene succinate) biodegradable polyesters I. Mathematical modelling of the esterification reaction, Polymer, 2006, 47(13), 4851 CrossRef.
- D. N. Bikiaris and D. S. Achilias, Synthesis of poly(alkylene succinate) biodegradable polyesters, Part II: Mathematical modelling of the polycondensation reaction, Polymer, 2008, 49(11), 3677 CrossRef.
Footnote |
| † Electronic supplementary information (ESI) available. See DOI: 10.1039/d0gc04254d |
|
| This journal is © The Royal Society of Chemistry 2021 |
 Open Access Article
 a,
Alexandra
Zamboulis
 a,
Nejib
Kasmi
a,
Mohamed
Wahbi
a,
Christina
Nannou
a,
Nejib
Kasmi
a,
Mohamed
Wahbi
a,
Christina
Nannou
 b,
Dimitra A.
Lambropoulou
 b,
Margaritis
Kostoglou
c,
George Z.
Papageorgiou
 d and
Dimitrios N.
Bikiaris
 *a
*a


![[thin space (1/6-em)]](https://www.rsc.org/images/entities/char_2009.gif) 000 FWHM, over a mass range of 60–900 m/z, and the mass error (Δ) below 5 ppm. Simultaneously, a data-dependent MS2 experiment was performed with the resolution set at 17
000 FWHM, over a mass range of 60–900 m/z, and the mass error (Δ) below 5 ppm. Simultaneously, a data-dependent MS2 experiment was performed with the resolution set at 17![[thin space (1/6-em)]](https://www.rsc.org/images/entities/char_2009.gif) 500 FWHM and the isolation width for the parent ion of interest at 1.0 m/z to obtain the fragmentation patterns of the formed oligomers and to confirm the findings of FS-MS. Technically, the molecular formulas of the expected oligomers were imported in an inclusion list that automatically generates the theoretical accurate mass, corresponding to their pseudo-molecular (protonated or deprotonated) ions. To induce the fragmentation, the collision energy (CE) in the high dissociation cell (HCD) was stepped at 20, 35 and 40 eV. All data and analyses were acquired and performed, respectively, using Thermo Xcalibur™ software (version 4.1).
500 FWHM and the isolation width for the parent ion of interest at 1.0 m/z to obtain the fragmentation patterns of the formed oligomers and to confirm the findings of FS-MS. Technically, the molecular formulas of the expected oligomers were imported in an inclusion list that automatically generates the theoretical accurate mass, corresponding to their pseudo-molecular (protonated or deprotonated) ions. To induce the fragmentation, the collision energy (CE) in the high dissociation cell (HCD) was stepped at 20, 35 and 40 eV. All data and analyses were acquired and performed, respectively, using Thermo Xcalibur™ software (version 4.1).


![[double bond, length as m-dash]](https://www.rsc.org/images/entities/char_e001.gif) O stretching vibration of the carboxylic acid is observed at 1665 cm−1. After half an hour, two overlapping peaks are clearly visible in the carbonyl region of the spectrum: at 1690 cm−1 (COOH) and at 1727 cm−1 (COOR), reflecting the conversion calculated by NMR and end-group analysis. As the reaction proceeds, the peak at 1690 cm−1 further decreases and the peak of the ester carbonyl groups at 1727 cm−1 dominates.
O stretching vibration of the carboxylic acid is observed at 1665 cm−1. After half an hour, two overlapping peaks are clearly visible in the carbonyl region of the spectrum: at 1690 cm−1 (COOH) and at 1727 cm−1 (COOR), reflecting the conversion calculated by NMR and end-group analysis. As the reaction proceeds, the peak at 1690 cm−1 further decreases and the peak of the ester carbonyl groups at 1727 cm−1 dominates.


![[thin space (1/6-em)]](https://www.rsc.org/images/entities/char_2009.gif) exp(−Ei/RgT) (i = 1, 2) with E1/Rg = 13
exp(−Ei/RgT) (i = 1, 2) with E1/Rg = 13![[thin space (1/6-em)]](https://www.rsc.org/images/entities/char_2009.gif) 844 K, E2/Rg = 9520 K (Rg is the gas constant). It appears that the first reaction is more sensitive to temperature than the second one. The resulting Arrhenius temperature dependence confirms that the selected reaction scheme is not an empirical one and has a physical basis (i.e. it accounts for the dominant steps of the complete reaction scheme). It is noted that the employed reaction scheme is the same as the one employed in ref. 77. However, the choice there was to assume that K2 = K1 and to use as additional fitting parameters the mass transfer coefficients of A and W from liquid to gas phase. The fact that the (resulting from fitting) mass transfer coefficient of W was found to be independent of experimental conditions while the mass transfer coefficient of A differs up to 30 times among the experiments raises questions about the validity of the approach in.77
844 K, E2/Rg = 9520 K (Rg is the gas constant). It appears that the first reaction is more sensitive to temperature than the second one. The resulting Arrhenius temperature dependence confirms that the selected reaction scheme is not an empirical one and has a physical basis (i.e. it accounts for the dominant steps of the complete reaction scheme). It is noted that the employed reaction scheme is the same as the one employed in ref. 77. However, the choice there was to assume that K2 = K1 and to use as additional fitting parameters the mass transfer coefficients of A and W from liquid to gas phase. The fact that the (resulting from fitting) mass transfer coefficient of W was found to be independent of experimental conditions while the mass transfer coefficient of A differs up to 30 times among the experiments raises questions about the validity of the approach in.77


