 Open Access Article
Ionic conduction mechanism of a lithium superionic argyrodite in the Li–Al–Si–S–O system†
Wenze
Huang
 a,
Lindong
Cheng
 b,
Satoshi
Hori
a,
Kota
Suzuki
 ab,
Masao
Yonemura
c,
Masaaki
Hirayama
ab and
Ryoji
Kanno
*ab
aAll-Solid-State Battery Unit, Institute of Innovation Research, Tokyo Institute of Technology, 4259 Nagatsuta, Midori-ku, Yokohama 226-8503, Japan. E-mail: kanno@echem.titech.ac.jp
bDepartment of Chemical Science and Engineering, School of Materials and Chemical Technology, Tokyo Institute of Technology, 4259 Nagatsuta, Midori-ku, Yokohama 226-8502, Japan
cNeutron Science Laboratory (KENS), Institute of Materials Structure Science, High Energy Accelerator Research Organization (KEK), 203-1 Shirakata, Tokai, Ibaraki 319-1106, Japan
First published on 22nd April 2020
Abstract
We report the conduction mechanism in oxygen-substituted lithium conductors composed of the Li6.15Al0.15Si1.35S6−xOx (LASSO) system, which is a novel member of the argyrodite-type family and has superionic conductivities, making it suitable for all-solid-state batteries. The crystal structures, ionic conductivities, and electrochemical properties of these systems were examined using powder X-ray and neutron diffractometry combined with impedance spectroscopy and cyclic voltammetry measurements. The optimal Li6.15Al0.15Si1.35S5.4O0.6 (x = 0.6) material exhibited a high ionic conductivity of 1.24 mS cm−1 at 25 °C with a low activation energy of 36.6 kJ mol−1. Rietveld refinement and maximum-entropy-method analysis using neutron diffraction data revealed unique interstitial Li+ and O2−/S2− site disorder, which led to a flatter energy landscape for migrating Li+ ions and, thus, a low percolation threshold for three dimensional (3D) Li-ion diffusion. Oxygen substitution also stabilized the structure, and a wide electrochemical window from −0.1 V to 5 V vs. Li/Li+ was achieved. The significant improvements in the ionic conductivity and stability owing to structural changes after cation and anion substitutions reveal an important strategy toward the development of argyrodite-type superionic conductors.
Introduction
All-solid-state batteries have attracted considerable attention because of their potential to tremendously improve device safety by replacing highly flammable liquid electrolytes with solid-state inorganic ionic conductors.1,2 Lithium ion conductors that could be used as solid electrolytes are the key materials for all-solid-state devices.1,3,4 Despite significant research efforts, the number of candidates for electrolytes with high ionic conductivities (>1 mS cm−1) is still limited, with only thio-LISICONs,5–8 lithium argyrodites,9–13 Li10GeP2S12 (LGPS)-type materials,14–17 and Li7P3S11 glass-ceramics18,19 showing good potential. However, most of these are thiophosphates, which are highly volatile at high temperatures, posing challenges for their synthesis.20 Additionally, the multiplicity of phosphorus oxidation states in thiophosphates is one of the reasons for their high chemical instabilities toward electrode materials.21–24 Thus, it is of great interest to search for phosphorus-free lithium ion conductors with high ionic conductivities and chemical stabilities, which must also use low-cost and abundant materials for practical applications.Recently, phosphorus-free argyrodite-type materials have been discovered that consist of low-cost and earth-abundant elements, such as Li2S–Al2S3–SiS2 (LASS).25 By replacing the P5+ cations with Al3+/Si4+ in order to introduce more Li+ into the argyrodite structure, these materials exhibit superior ionic conductivity on the order of 10−4 S cm−1 at room temperature, which is three orders of magnitude higher than those of the thio-LISICON phases of the Li2S–Al2S3–SiS2 system.7 In classical lithium argyrodites, such as Li6PS5X (X = Cl, Br, I),9,13 two distinct Li+ positions have been identified, namely the 48h and 24g Wyckoff sites that form lithium diffusion cages. However, our group found a unique interstitial Li+ site at the 16e Wyckoff site between the cages of the Li-rich LASS argyrodite structure,25 comparable to those found in Ag and Cu argyrodite analogs, such as γ-Ag7PSe626 and γ-Cu7PSe6.27 The effect of this interstitial Li+ on the lithium ionic conductivity has not yet been discussed comprehensively. Another issue to be solved is the effect of the inclusion of oxygen in the material, which was detected in the synthesized sample in our previous report.25 Oxygen doping can enhance the electrochemical stability of lithium ion conductors against lower reduction potentials, as suggested by recent studies.28,29
Herein, the effectiveness of substituting Al3+/Si4+ for P5+ (cation substitution) and O2− for S2− (anion substitution) when tailoring and optimizing material properties is considered. We synthesized the solid–solution Li6.15Al0.15Si1.35S6−xOx (LASSO) to clarify its composition–structure–property relationships, with the goal of improving our understanding of the ionic conduction mechanism for phosphorus-free argyrodite-type materials using a combination of Rietveld refinement and maximum-entropy-method (MEM) analysis. On the basis of the results, we observe that: (1) the interstitial Li-ions at structural joints with nearby Li-ions allow for concerted diffusion, which is suggested to lead to a flatter energy landscape for the migrating Li-ions; and (2) oxygen substitution creates anion site disorder, resulting in a low percolation threshold for 3D Li-ion diffusion. Both effects synergistically help to increase the Li-ion conductivity to above 1 mS cm−1 in the optimal material, making Li6.15Al0.15Si1.35S5.4O0.6 (x = 0.6) among the best phosphorus-free superionic conductors reported so far.
Experimental
Li2S (Mitsuwa Chemical Co., Ltd, >99.9% purity), Al2S3 (Kojundo Chemical Laboratory Co., Ltd, >98% purity), Si2S (Mitsuwa Chemical Co., Ltd, >99% purity), and Li2O (Kojundo Chemical Laboratory Co., Ltd, >99% purity) were the starting materials used to synthesize Li6.15Al0.15Si1.35S6−xOx (LASSO). These powders were weighed in stoichiometric ratios in an Ar-filled glovebox and then mechanically mixed in a sealed stainless steel pot for 30 min at 370 rpm using a vibration milling apparatus (CMT Co., Ltd, TI-100). The obtained mixtures were pelletized, placed in a carbon tube, and sealed at 15 Pa in a carbon-coated quartz tube, followed by annealing at 1000 °C for 1 h, after which they were quenched in iced water.Powder X-ray diffraction (XRD) patterns of the synthesized samples were obtained using a Rigaku SmartLab X-ray diffractometer with CuKα1 radiation. Synchrotron XRD experiments were performed on the BL19B2 beamline at the SPring-8 facility (Japan) at a wavelength of 0.5 Å. Specimens were sealed under Ar in quartz capillaries (diameter: 0.3 mm), and a Debye–Scherrer diffraction camera was used to acquire data. Neutron diffraction data were acquired using the SPICA time-of-flight (TOF) neutron-powder diffractometer at the J-PARC facility (Japan). Samples (∼0.5 g) were placed in cylindrical vanadium cells (diameter: 6 mm; height: 55 mm). Lattice and structural parameters were refined using the Z-Rietveld software (Ver. 1.1.0).30 Nuclear density distributions were calculated by MEM analysis using crystal structure factors, and standard deviations were obtained by Rietveld refinement. All MEM calculations were performed using the Z-MEM algorithm in the Z-Code software package,31 which employs the conventional Sakata–Sato algorithm with a zeroth-order single-pixel approximation.32 The Z-three-dimensional algorithm was used to generate the nuclear density maps of the structures.33 The MEM analysis data were visualized with the VESTA software package.34
The ionic conductivity of each sample was determined by the AC-impedance method. The samples used were pelletized (diameter: 10.1 mm; thickness: ∼1 mm) at 91 MPa. The pellet was then pressed at 181 MPa and 400 °C for 2 h, followed by natural cooling to room temperature. Conductivities were measured using frequency-response analyzers (Solartron 1260 and 1287) with an applied voltage of 10 mV in the 1 Hz to 10 MHz frequency range, at temperatures between −45 and 110 °C. All the processes were conducted in an Ar atmosphere.
The electrochemical windows were evaluated by cyclic voltammetry measurements. Experiments involving the Li/solid electrolyte (SE)/Al cells were conducted between −0.1 and 5.0 V and at 25 °C using a lithium reference electrode and at a scan rate of 1 mV s−1.
All-solid-state batteries were constructed using our samples as the SE, a mixture of LiNiO3-coated LiCoO2 and LGPS14 as the composite cathode (7![[thin space (1/6-em)]](https://www.rsc.org/images/entities/char_2009.gif) :
:![[thin space (1/6-em)]](https://www.rsc.org/images/entities/char_2009.gif) 3 weight ratio), and In–Li as the anode. The anode (lithium foil [thickness: 0.1 mm, diameter: 5 mm], indium foil [thickness: 0.1 mm, diameter: 10 mm] with a Cu mesh current collector), and the composite cathode with Al mesh and Al foil current collectors were pressed onto opposite sides of the solid electrolyte pellet. The electrochemical properties of the cells were evaluated using a TOSCAT-3100 battery tester (Toyo System). Cycling was performed between 1.9 and 3.6 V vs. the In–Li anode (≈0.6 V vs. Li/Li+) at an applied current of 0.2C and 25 °C.
3 weight ratio), and In–Li as the anode. The anode (lithium foil [thickness: 0.1 mm, diameter: 5 mm], indium foil [thickness: 0.1 mm, diameter: 10 mm] with a Cu mesh current collector), and the composite cathode with Al mesh and Al foil current collectors were pressed onto opposite sides of the solid electrolyte pellet. The electrochemical properties of the cells were evaluated using a TOSCAT-3100 battery tester (Toyo System). Cycling was performed between 1.9 and 3.6 V vs. the In–Li anode (≈0.6 V vs. Li/Li+) at an applied current of 0.2C and 25 °C.
Results and discussion
Material synthesis
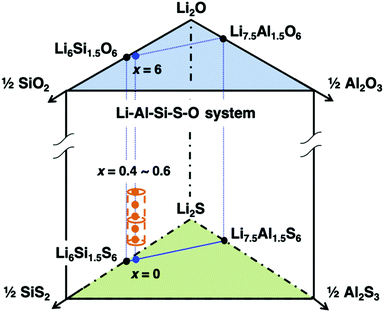
The mono-phasic region of the argyrodite structure was searched based on the formation diagram for the Li–Al–Si–S–O system. A schematic composition diagram of the Li–Al–Si–S–O system is depicted in Fig. 1. Nominal oxygen substitution of the argyrodite-type structure (cubic argyrodite, space group F![[4 with combining macron]](https://www.rsc.org/images/entities/char_0034_0304.gif) 3m) was determined to be beneficial, where x ranged from 0.4 to 0.6. Within this range, the reproducibility of the argyrodite phase was much higher than that of the Li–Al–Si–S system,25 which required careful control of both the composition and the cooling process. This strongly implies that oxygen substitution can further stabilize the argyrodite structure, thereby increasing the reproducibility of the argyrodite phase at room temperature.
3m) was determined to be beneficial, where x ranged from 0.4 to 0.6. Within this range, the reproducibility of the argyrodite phase was much higher than that of the Li–Al–Si–S system,25 which required careful control of both the composition and the cooling process. This strongly implies that oxygen substitution can further stabilize the argyrodite structure, thereby increasing the reproducibility of the argyrodite phase at room temperature.
A representative X-ray diffraction pattern for Li6.15Al0.15Si1.35S5.4O0.6 is shown in Fig. 2(a); the pattern can be indexed as an argyrodite phase using the Li7PS6 reference (ICSD#421130, also shown in Fig. 2(a)). Fig. 2(b) shows the lattice parameters of solid solutions with the formula Li6.15Al0.15Si1.35S6−xOx as a function of the nominal oxygen substitution content, x. The lattice parameter decreased with increasing x due to the replacement of S2− anions with the smaller O2− anions (ionic radii: S (coordination number, C.N. = 4) = 1.84 Å, O (C.N. = 4) = 1.38 Å35). However, there were no changes in the parameter from x = 0.6 to x = 0.8, indicating the solubility limit for oxygen compositions. Additional diffraction patterns for Li6.15Al0.15Si1.35S6−xOx (x = 0.4–0.9) are indicated in the ESI† (Fig. S1). When x = 0.4, an amorphous phase was detected, along with Li2S and Li4SiS4 impurities. As x was increased from 0.4 to 0.6, the amount of the amorphous phase decreased; i.e., the crystallinity of the argyrodite phase improved. At the same time, the amount of impurities also decreased. As x was increased from 0.6 to 0.8, no changes could be detected from the X-ray diffraction pattern, which was consistent with the results of the lattice parameter. When x was further increased to 0.9, the diffraction patterns mainly indicated the presence of the starting material, Li2S, along with some argyrodite phase and Li4SiS4 impurities. In summary, the XRD patterns demonstrate that even small changes in oxygen content can have an impact on the formation of a pure phase, as oxygen substitution can stabilize the argyrodite structure in this system.
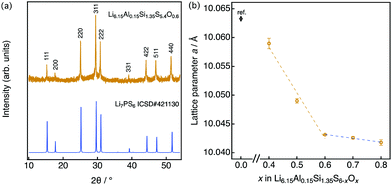 | ||
| Fig. 2 (a) X-ray diffraction pattern for Li6.15Al0.15Si1.35S5.4O0.6 along with the pattern of argyrodite Li7PS6 (ICSD: 421130), which is indexed as the cubic argyrodite phase. (b) Lattice parameter for Li6.15Al0.15Si1.35S6−xOx as a function of the nominal oxygen content x. The lattice data for x = 0 are taken from the literature.25 | ||
Ionic conductivity
Fig. 3(a) shows the lithium ionic conductivity of LASSO at room temperature as a function of x. The oxygen-substituted samples showed significant improvement over previous results (where (x = 0)25), with ionic conductivities up to five times higher. The maximum ionic conductivity of Li6.15Al0.15Si1.35S6−xOx was observed at x = 0.6. This composition–conductivity dependence corresponds to the phase purity of the argyrodite: when the oxygen content is too low, an amorphous phase exists within the sample, while secondary phases exist when the oxygen content is too high. Fig. 3(b) displays the complex impedance (Nyquist) and the Arrhenius plots of Li6.15Al0.15Si1.35S5.4O0.6 (x = 0.6), which exhibited the highest ionic conductivity, as determined at temperatures between −45 and 110 °C. Ionic conductivities were calculated from the impedance plots, which are characteristic of pure ionic conductors; they each consist of a semicircle and a spike, which corresponds to contributions from the bulk/grain boundaries and the electrode, respectively. As the bulk and grain boundaries cannot be deconvoluted, hence the conductivity was obtained by summing the grain boundary and bulk resistances. The ionic conductivity was 1.24 × 10⁻³ S cm−1 with an activation energy of 36.6 kJ mol−1 for Li6.15Al0.15Si1.35S5.4O0.6 at 25 °C, almost four orders of magnitude higher than that for the thio-LISICONs in the Li4+xAlxSi1−xS4 system,7 which is among the highest value among phosphorus-free silicon sulfides.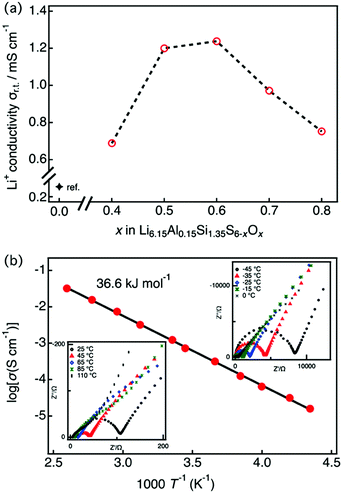 | ||
| Fig. 3 (a) Lithium ion conductivity of LASSO as a function of the nominal x, as obtained by impedance spectroscopy at 25 °C. The conductivity data for x = 0 was obtained from the literature.25 (b) Impedance plots for conductivity data between −45 and 110 °C (insets) and the Arrhenius plot for Li6.15Al0.15Si1.35S5.4O0.6. Conductivities were obtained by summing the grain-boundary and bulk resistances. | ||
Conduction mechanism based on structural analysis
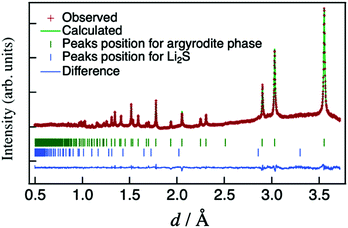
In order to understand the conduction mechanism, the crystal structure of the composition with the highest conductivity, namely Li6.15Al0.15Si1.35S5.4O0.6 (Li6.15M1.5S5.4O0.6, M = Al0.1Si0.9), was refined by the Rietveld method using neutron-diffraction data obtained at 25 °C. The refined neutron-diffraction patterns of Li6.15Al0.15Si1.35S5.4O0.6 are shown in Fig. 4. The structure of HT-Li4.1Al0.1Si0.9S425 (space group: F![[4 with combining macron]](https://www.rsc.org/images/entities/char_0034_0304.gif) 3m, No. 216) was used as a model for the initial values during refinement (Li in the 48h and 16e sites, M (Al/Si) in the 48h, 16e, and 4b sites, and S/O in the 16e, 4c, and 4a sites). After the refinement, an agreement factor Rwp of 1.1610% (goodness of fit S = 1.83) was finally obtained, indicating that the refinement was satisfactory for the structural models employed in this study. Table S1 (ESI†) lists the refined lattice and structural parameters for the refinement, along with the R factors. Additional lattice and structural parameters for Li6.15Al0.15Si1.35S6−xOx (x = 0, x = 0.8) are indicated in the ESI† (Tables S2 and S3).
3m, No. 216) was used as a model for the initial values during refinement (Li in the 48h and 16e sites, M (Al/Si) in the 48h, 16e, and 4b sites, and S/O in the 16e, 4c, and 4a sites). After the refinement, an agreement factor Rwp of 1.1610% (goodness of fit S = 1.83) was finally obtained, indicating that the refinement was satisfactory for the structural models employed in this study. Table S1 (ESI†) lists the refined lattice and structural parameters for the refinement, along with the R factors. Additional lattice and structural parameters for Li6.15Al0.15Si1.35S6−xOx (x = 0, x = 0.8) are indicated in the ESI† (Tables S2 and S3).
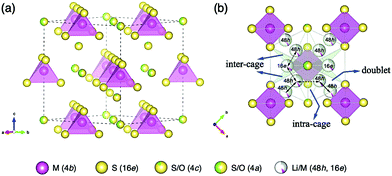
Fig. 5(a) shows the framework of Li6.15Al0.15Si1.35S5.4O0.6 with an argyrodite-type structure, which mainly consists of M(4b)S4(16e) (M = Al0.1Si0.9) tetrahedra with isolated S/O ions at the 4a and 4c sites. Disordered Li/M ions are distributed at the tetrahedral 48h and 16e sites, forming three possible migration pathways in the argyrodite structure, as shown in Fig. 5(b). These pathways might be through the doublet jump between 48h and 48h sites (solid line), the intra-cage jump between 48h and 48h′ sites (dashed line), and the inter-cage jump across 48h–16e–48h′′ sites (dotted line), which are similar pathways to those indicated previously elsewhere in the literature.25
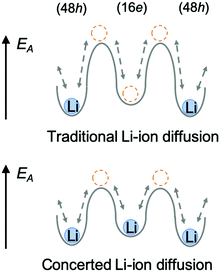
In the argyrodite structure, the doublet and intra-cage jumps occur within a local lithium diffusion cage, while the inter-cage jumps link adjacent cages to enable long-range diffusion, which is considered to be the rate-limiting step and, consequently, determines the macroscopic lithium ion conductivity.36 Compared with the classical argyrodite structure,37 the aliovalent substitution of Al3+/Si4+ and Li+ for P5+ increases the Li+ concentration, and alters the distribution of Li ions in the structure. A unique interstitial Li+ site (16e) was found in the Li-rich argyrodite Li6.15Al0.15Si1.35S5.4O0.6 at the middle position of the inter-cage jump, which can be regarded to be a high-energy interstitial site compared with the equilibrium sites (48h). The potential modification of the energy landscape enabled by this interstitial 16e site is drawn schematically in Fig. 6. As experimentally and theoretically suggested,38,39 the Li ions in the high-energy interstitial sites (16e) and those in the equilibrium sites (48h) experience strong coulombic repulsions due to their proximity (∼1.7 Å), which may lead to closer site energies for these positions and enable concerted Li-ion diffusion. Compared with traditional Li-ion diffusion, this concerted migration of multiple Li-ions is suggested to have a flatter energy landscape because of strong ion–ion interactions and the unique mobile configuration,39 thereby favoring macroscopic Li diffusion. This could be one of the origins of the superionic conductivities of our materials.
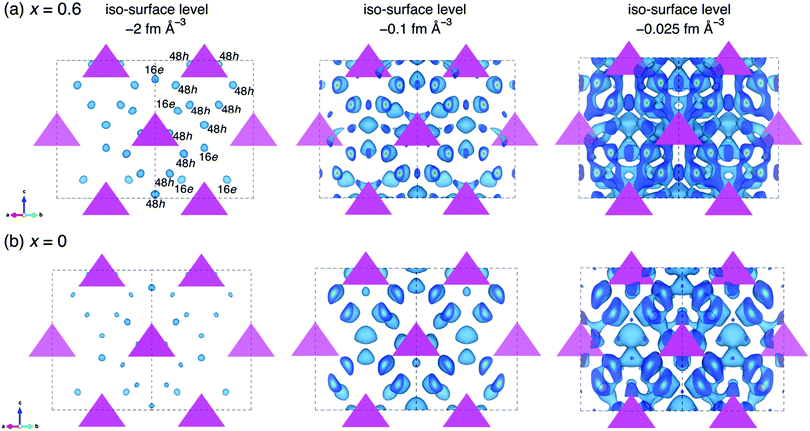
To understand the effect of oxygen doping on the ionic conductivities of our materials, MEM analyses both for the oxygen doped and non-doped structure were conducted based on the refined data in order to visualize the nuclear scattering density distributions in the crystal structures. Fig. 7 shows the nuclear distribution maps for Li6.15Al0.15Si1.35S6−xOx, (a) x = 0.6 and (b) x = 0. The tetrahedra represent the MS4 (M = Al0.1Si0.9) units that form the argyrodite framework, and the equi-contour surfaces of the lithium nuclear density distribute in the structure. At an iso-surface level of −2 fm Å−3, Li+ at the 48h and 16e sites can be identified in both the oxygen-doped (x = 0.6) and un-doped (x = 0) samples based on the scattering amplitude distribution map. The oxygen-doped sample shows a higher Li+ nuclear density than the non-doped sample. As the iso-surface level is increased to −0.1 fm Å−3, the Li+ sites in the oxygen-doped sample tend to connect with one another, while those in the non-doped sample remain isolated. When the iso-surface level is further increased to −0.025 fm Å−3, 3D lithium diffusion is evident in the oxygen-doped sample, including the doublet, intra-cage, and inter-cage jumps, while the non-doped sample only shows local diffusion pathways at this level. This analysis shows that oxygen doping in the structure of Li-argyrodite Li6.15Al0.15Si1.35S6−xOx contributes to a lower percolation threshold for 3D diffusion of Li+. Similar phenomena have been observed in halogen-substituted Li-argyrodites,40 where Cl− (or Br−)-substituted argyrodites exhibit much higher ionic conductivities than I−-substituted ones. This was ascribed to the anion side-disorder created by substitution,36 although the latter ones have larger lattice parameters.
In our structural analysis, we found that the oxygen ions were not evenly distributed at the 4a and 4c sites. Around 20% of the oxygen ions were substituted at the 4c sites, while the remainder were found at the 4a sites, showing a high degree of anion site-disorder. This anion site-disorder in the local environment may also modify the potential energy landscape for migrating ions, leading to further dramatic increases in conductivity.12 When compared with the parent material, Li6.15Al0.15Si1.35S6,25 the oxygen substitution in Li6.15Al0.15Si1.35S5.4O0.6 lowers the activation energy from 40 kJ mol−1 to 36.6 kJ mol−1 (see Fig. 3(b)), which is consistent with the large improvement in ionic conductivity (up to a five-fold increase after oxygen doping). Although more experimental and theoretical work is needed to further evaluate the effects of anion site-disorder, it is suggested that O2−/S2− site-disorder may have a similar effect to that seen for the halogen-containing analogues, where the activation energy (percolation threshold) for the migrating Li+ is lowered, leading to a significant improvement in ionic conductivity.
Thermal and electrochemical stability
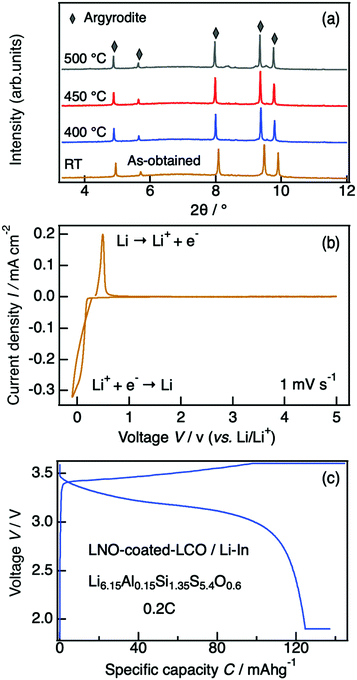
The thermodynamic evolution of Li6.15Al0.15Si1.35S5.4O0.6 was evaluated by in situ high-temperature synchrotron X-ray diffractometry. Minor structural changes were observed during the heating process, but the argyrodite structure was maintained after annealing at 500 °C (Fig. 8(a)). The major phase was a cubic argyrodite-type phase even at 600 °C, where its non-oxygen doped HT-Li4.1Al0.1Si0.9S4 counterpart had already decomposed completely into Li4SiS4 and Li2S secondary phases (see Fig. S2, ESI†).25 This result again indicates that oxygen substitution can significantly improve the thermal stabilities of sulfide-based electrolytes, providing improved safety even when applications require high-temperature working environments.The electrochemical window of our material was evaluated by cyclic voltammetry. Fig. 8(b) shows the cyclic voltammogram for a Li/Li6.15Al0.15Si1.35S5.4O0.6/Al cell. The cathodic and anodic currents at around 0 V correspond to lithium deposition and dissolution, respectively. No significant currents by side reactions were observed from −0.1 V to 5 V, indicating that no severe electrolyte decomposition occurred in this voltage range.
Li6.15Al0.15Si1.35S5.4O0.6 was examined as a solid electrolyte in an all-solid-state battery. Fig. 8(c) shows the charge–discharge curves of the fabricated cell, which consisted of Li6.15Al0.15Si1.35S5.4O0.6 as the electrolyte, a Li–In metal anode, and a LiNbO3-coated LiCoO2/LGPS cathode, at a charge–discharge rate of 0.2C at 25 °C. A reversible capacity of over 120 mA h g−1 was observed, showing a good coulombic efficiency that corresponds to the theoretical value for LiCoO2. This battery demonstrates feasible stable performance when employing phosphorus-free Li-argyrodite as a solid electrolyte.
Conclusions
In this study, the conduction mechanism of the phosphorus-free Li6.15Al0.15Si1.35S6−xOx (LASSO) argyrodite-type material was investigated, which confirmed that superionic conductivity can be obtained through cation and anion substitution effects. Using a combination of neutron diffraction, analyzed by Rietveld refinement and the maximum-entropy-method, and impedance spectroscopy, we observed that changes in Li+ occupancies and O2−/S2− site disorder correlate with ionic conductivity. Two impacts of the composition on the conductivity were discussed. Firstly, when compared with conventional Li-argyrodite, the higher Li+ concentration in LASSO resulted in unique interstitial Li+ sites, allowing for concerted Li+ migration, possibly due to a flatter energy landscape for Li+ migration. Secondly, inclusion of oxygen anions created O2−/S2− site disorder, which lowered the percolation threshold for 3D Li+ diffusion. Both of these effects modified the energy landscape for Li+ migration and synergistically contributed to the improvement in ionic conductivity, which was as high as 1.24 mS cm−1 at 25 °C—one of the best reported values for phosphorus-free superionic conductors. Furthermore, this oxygen-substituted conductor exhibited a wide electrochemical stability window with suitable electrode materials, and an all-solid-state battery based on this solid electrolyte was successfully assembled and cycled at a 0.2C rate. Our work shows that structural changes induced by both cation and anion substitutions can significantly improve the thermal, chemical, and electrochemical performances of solid conductors, which will prove invaluable for the optimization of existing solid conductors and the discovery of new materials, thereby facilitating their practical applications in all-solid-state batteries.Conflicts of interest
There are no conflicts to declare.Acknowledgements
This study was partly supported by a Grant-in-Aid for Scientific Research (S) from the Japan Society for the Promotion of Science (No. 17H06145). The synchrotron radiation experiments were carried out as projects approved by the Japan Synchrotron Radiation Institute (JASRI) (Proposal No. 2016B1778). The neutron scattering experiment was approved by the Neutron Scattering Program Advisory Committee of IMSS, KEK (Proposal No. 2014S10).References
- Y. Kato, S. Hori, T. Saito, K. Suzuki, M. Hirayama, A. Mitsui, M. Yonemura, H. Iba and R. Kanno, Adv. Energy Mater., 2016, 6, 1501590 CrossRef.
- J. Janek and W. G. Zeier, Nat. Energy, 2016, 1, 16141 CrossRef.
- P. Knauth, Solid State Ionics, 2009, 180, 911 CrossRef CAS.
- A. L. Robinson and J. Janek, MRS Bull., 2014, 39, 1046 CrossRef.
- R. Kanno, T. Hata, Y. Kawamoto and M. Irie, Solid State Ionics, 2000, 130, 97 CrossRef CAS.
- R. Kanno and M. Murayama, J. Electrochem. Soc., 2001, 148, A742 CrossRef CAS.
- M. Murayama, R. Kanno, M. Irie, S. Ito, T. Hata, N. Sonoyama and Y. Kawamoto, J. Solid State Chem., 2002, 168, 140 CrossRef CAS.
- M. Murayama, N. Sonoyama, A. Yamada and R. Kanno, Solid State Ionics, 2004, 170, 173 CrossRef CAS.
- H. J. Deiseroth, S. T. Kong, H. Eckert, J. Vannahme, C. Reiner, T. Zaiss and M. Schlosser, Angew. Chem., Int. Ed., 2008, 47, 755 CrossRef CAS PubMed.
- Y. Inoue, K. Suzuki, N. Matsui, M. Hirayama and R. Kanno, J. Solid State Chem., 2017, 246, 334 CrossRef CAS.
- H. Schneider, H. Du, T. Kelley, K. Leitner, J. ter Maat, C. Scordilis-Kelley, R. Sanchez-Carrera, I. Kovalev, A. Mudalige, J. Kulisch, M. M. Safont-Sempere, P. Hartmann, T. Weiß, L. Schneider and B. Hinrichsen, J. Power Sources, 2017, 366, 151 CrossRef CAS.
- M. A. Kraft, S. Ohno, T. Zinkevich, R. Koerver, S. P. Culver, T. Fuchs, A. Senyshyn, S. Indris, B. J. Morgan and W. G. Zeier, J. Am. Chem. Soc., 2018, 140, 16330 CrossRef CAS PubMed.
- M. A. Kraft, S. P. Culver, M. Calderon, F. Bocher, T. Krauskopf, A. Senyshyn, C. Dietrich, A. Zevalkink, J. Janek and W. G. Zeier, J. Am. Chem. Soc., 2017, 139, 10909 CrossRef CAS PubMed.
- N. Kamaya, K. Homma, Y. Yamakawa, M. Hirayama, R. Kanno, M. Yonemura, T. Kamiyama, Y. Kato, S. Hama, K. Kawamoto and A. Mitsui, Nat. Mater., 2011, 10, 682 CrossRef CAS PubMed.
- P. Bron, S. Johansson, K. Zick, J. S. Auf der Gunne, S. Dehnen and B. Roling, J. Am. Chem. Soc., 2013, 135, 15694 CrossRef CAS PubMed.
- J. M. Whiteley, J. H. Woo, E. Y. Hu, K. W. Nam and S. H. Lee, J. Electrochem. Soc., 2014, 161, A1812 CrossRef.
- Y. L. Sun, K. Suzuki, S. Hori, M. Hirayama and R. Kanno, Chem. Mater., 2017, 29, 5858 CrossRef CAS.
- H. Yamane, M. Shibata, Y. Shimane, T. Junke, Y. Seino, S. Adams, K. Minami, A. Hayashi and M. Tatsumisago, Solid State Ionics, 2007, 178, 1163 CrossRef CAS.
- K. Homma, M. Yonemura, T. Kobayashi, M. Nagao, M. Hirayama and R. Kanno, Solid State Ionics, 2011, 182, 53 CrossRef CAS.
- J. R. Akridge, US Pat., US4465746, 1984 Search PubMed.
- F. Han, Y. Zhu, X. He, Y. Mo and C. Wang, Adv. Energy Mater., 2016, 6, 1501590 CrossRef.
- J. Auvergniot, A. Cassel, J.-B. Ledeuil, V. Viallet and V. Seznec, Chem. Mater., 2017, 29, 3883 CrossRef CAS.
- R. Koerver, I. Aygün, T. Leichtweiß, C. Dietrich, W. Zhang, J. O. Binder, P. Hartmann, W. G. Zeier and J. Janek, Chem. Mater., 2017, 29, 5574 CrossRef CAS.
- R. Koerver, F. Walther, I. Aygün, J. Sann, C. Dietrich, W. G. Zeier and J. Janek, J. Mater. Chem. A, 2017, 5, 22750 RSC.
- W. Huang, K. Yoshino, S. Hori, K. Suzuki, M. Yonemura, M. Hirayama and R. Kanno, J. Solid State Chem., 2019, 270, 487 CrossRef CAS.
- M. Evain, E. Gaudin, F. Boucher, V. Petricek and F. Taulelle, Acta Crystallogr., Sect. B: Struct. Sci., 1998, 54, 376 CrossRef.
- E. Gaudin, F. Boucher, V. Petricek, F. Taullele and M. Evain, Acta Crystallogr., Sect. B: Struct. Sci., 2000, 56, 402 CrossRef PubMed.
- Y. Sun, K. Suzuki, K. Hara, S. Hori, T.-A. Yano, M. Hara, M. Hirayama and R. Kanno, J. Power Sources, 2016, 324, 798 CrossRef CAS.
- S. Hori, K. Suzuki, M. Hirayama, Y. Kato and R. Kanno, Front. Energy Res., 2016, 4, 38 Search PubMed.
- R. Oishi, M. Yonemura, Y. Nishimaki, S. Torii, A. Hoshikawa, T. Ishigaki, T. Morishima, K. Mori and T. Kamiyama, Nucl. Instrum. Methods Phys. Res., Sect. A, 2009, 600, 94 CrossRef CAS.
- Y. Ishikawa, J. Zhang, R. Kiyanagi, M. Yonemura, T. Matsukawa, A. Hoshikawa, T. Ishigaki, S. Torii, R. Oishi-Tomiyasu and T. Kamiyama, Phys. B, 2018, 551, 472 CrossRef CAS.
- M. Sakata and M. Sato, Acta Crystallogr., Sect. A: Found. Crystallogr., 1990, 46, 263 CrossRef.
- Y. Ishikawa, M. Yonemura and T. Kamiyama, Z-3D, Textbook of Z-code Powder Diffraction Data Analysis School, High Energy Accelerator Research Organization (KEK), Tokyo, Japan, 2014 Search PubMed.
- K. Momma and F. Izumi, J. Appl. Crystallogr., 2011, 44, 1272 CrossRef CAS.
- R. D. Shannon, Acta Crystallogr., Sect. A: Cryst. Phys., Diffr., Theor. Gen. Crystallogr., 1976, 32, 751 CrossRef.
- N. J. J. de Klerk, T. Roslon and M. Wagemaker, Chem. Mater., 2016, 28, 7955 CrossRef CAS.
- H.-J. Deiseroth, J. Maier, K. Weichert, V. Nickel, S.-T. Kong and C. Reiner, Z. Anorg. Allg. Chem., 2011, 637, 1287 CrossRef CAS.
- L. Zhou, A. Assoud, Q. Zhang, X. Wu and L. F. Nazar, J. Am. Chem. Soc., 2019, 141, 19002 CrossRef CAS PubMed.
- X. He, Y. Zhu and Y. Mo, Nat. Commun., 2017, 8, 15893 CrossRef CAS.
- P. R. Rayavarapu, N. Sharma, V. K. Peterson and S. Adams, J. Solid State Electrochem., 2012, 16, 1807 CrossRef CAS.
Footnote |
| † Electronic supplementary information (ESI) available: Fig. S1 and S2, Table S1. CCDC 1987562. For ESI and crystallographic data in CIF or other electronic format see DOI: 10.1039/d0ma00115e |
| This journal is © The Royal Society of Chemistry 2020 |

