 Open Access Article
Urchin-like NiCoP coated with a carbon layer as a high-performance electrode for all-solid-state asymmetric supercapacitors†
Jingzhou
Ling
ab,
Hanbo
Zou
 *a,
Wei
Yang
 b and
Shengzhou
Chen
*b
aSchool of Chemistry and Chemical Engineering, Guangzhou University, Guangzhou, China. E-mail: zouhb@gzhu.edu.cn; Fax: +86 20 39366902; Tel: +86 20 39366906
bGuangzhou Key Laboratory for New Energy and Green Catalysis, Guangzhou University, Guangzhou, China. E-mail: szchen@gzhu.edu.cn; Fax: +86 20 39339685; Tel: +86 20 39339685
First published on 22nd May 2020
Abstract
To meet the requirements of high-performance and long lifespan supercapacitors, the development of electrode materials with better performance and stable structure is in high demand. Herein, an urchin-like NiCoP nanoarray coated with a carbon layer hybrid electrode (NiCoP@C-ULAs) has been successfully synthesized on a carbon cloth by an effective and goal-directed approach. The three-dimensional (3D) urchin-like precursor prepared via the solvothermal method integrates fascinating architectures, in which 1D nanospines favor charge transport and 2D ultrathin nanoflakes provide large active sites and short paths for ion diffusion, thus leading to the highest performance among the precursors. Subsequently, carbon coating and phosphorization were employed to synthesize the NiCoP@C-ULAs composite. The resulting NiCoP@C-ULAs exhibited a high specific area (201.9 m2 g−1), small average pore size (4.4 nm), ultrahigh specific capacity (1046 C g−1 at 1 A g−1) and superior rate capability (76.5% retention even at 20 A g−1). Remarkably, the cycling stability was enhanced from 55.1% to 86.3% at 8 A g−1 after 5000 cycles as compared with NiCoP-ULAs. The main reason for the significant improvement in the electrochemical performances is due to the unique structure and the synergistic effect of NiCoP with high specific capacity and the carbon coating with good mechanical stability. Furthermore, the all-solid-state NiCoP@C-ULAs//AC asymmetric supercapacitor delivers a high energy density of 37.1 W h kg−1 at a power density of 792.8 W kg−1 and outstanding cycling stability (91.4% of specific capacity retention after 10![[thin space (1/6-em)]](https://www.rsc.org/images/entities/char_2009.gif) 000 cycles). The LEDs could be lit up by the assembled capacitors for several minutes, which suggests that the NiCoP@C-ULA electrodes possess enormous potential as energy storage and conversion devices in future.
000 cycles). The LEDs could be lit up by the assembled capacitors for several minutes, which suggests that the NiCoP@C-ULA electrodes possess enormous potential as energy storage and conversion devices in future.
1. Introduction
With the growing demand for the consumption of energy sources, sustainable and renewable energy sources need to be developed urgently. Energy storage devices can effectively harvest energy from renewable sources and have been widely used in modern electronics, such as portable electronics, hybrid electric vehicles, and smart electricity grids.1 Supercapacitors (SCs), as an alternative to the high-power devices, have been extensively investigated owing to their advantages including high power density, fast charge–discharge process, and long cycling lifespan.2 Generally, SCs can be classified in the following three categories based on the charge storage mechanism: (1) electrical double-layer capacitors (EDLCs), which store energy via electrostatic charge adsorption and accumulate charges at the electrode–electrolyte interface; (2) pseudocapacitors, which supply energy via reversibly fast faradaic redox reactions on and near the surface of active materials; (3) hybrid supercapacitors, which combine an EDLC negative electrode (e.g., carbon-based materials) with a battery-type positive electrode (typically transition metal nickel and cobalt-based compounds). The hybrid SCs deliver more than one order of magnitude higher energy density and specific capacitance than those of EDLCs. It is well known that the battery-type electrode materials with the apparent plateau in the charge–discharge curves possess high theoretical capacity, which can dramatically increase the energy density in hybrid SCs. Thus, seeking battery-type electrode materials with prominent electrochemical performance is a major approach to promote the development of high-energy-density SCs. In the past decades, battery-type electrode materials were mainly focused on transition metal compounds such as oxides,3 hydroxides,4 sulfides,5 selenides,6 and phosphides.7The transition metal oxides and hydroxides, especially Ni and Co-based oxides, have triggered great interest of researchers due to their considerably high theoretical capacity, low cost and environmental friendliness. However, their applications in SCs are seriously impeded by their poor electrical conductivity. Generally, there are two effective ways to overcome this issue. One is the construction of hybrid composites with highly conductive materials (e.g., carbon materials and conductive polymers) and the other is converting the metal oxides and hydroxides to materials having high intrinsic conductivity. Transition metal phosphides (TMPs) are n-type semiconductor8 that are the candidates of new electroactive materials due to their metalloid properties, considerable specific capacity, high electrical conductivity, good chemical stability and redox activity.9 In particular, NiCoP possesses superior electrical conductivity, abundant active sites and faradaic redox reactions, thus showing improved electrochemical performance as compared to the corresponding single metal phosphides.10 Recently, NiCoP materials have been extensively employed in the field of Li-ion batteries,11 SCs,12 the H2 or O2 evolution reaction;13 however, the actual performance of NiCoP for SCs is still not satisfactory due to the inferior structural stability and the low contact area between ions and the material surface. Based on the energy storage mechanism, the electrode should expose active sites as much as possible so that the specific capacity can be close to the theoretical value. Furthermore, the electrode with high rate performance requires a sufficient ion supply for fast faradaic reactions, which means that the structure should provide enough open channels to allow ions to quickly reach the reaction area from the electrolyte. Thus, many researchers have developed electrode materials with high specific surface areas and ion-diffusion-favored structures, such as 3D coral-like, hierarchical and core–shell structures.12,14,15 NiCoP nanoplates coated on carbon paper substrate were synthesized by the plasma conversion of hydroxides, and they delivered a high specific capacity of 194 mA h g−1, which is higher than that of single metal phosphides (166 mA h g−1 for Ni2P and 108 mA h g−1 for CoP).10 Liang et al. reported that the hierarchical NiCo-LDH/NiCoP@NiMn-LDH hybrid material has a high specific capacitance of 2318 F g−1 at 1 A g−1 and the corresponding device (NiCo-LDH/NiCoP@NiMn-LDH//AC) has a maximum energy density of 42.2 W h kg−1 at a power density of 750 W kg−1.15 However, the NiCoP material experiences huge strain during the successive charge–discharge processes, which leads to electrode destruction in terms of structure collapse, volume expansion and electrode pulverization, and a simultaneous decrease in the capacity. To solve this problem, researchers have come up with some novel tricks. In recent years, it was reported that binary nickel cobalt oxides and hydroxides exhibit excellent stability during repeat charge–discharge processes.16–19 Thus, novel phosphide hybrid materials produced by partial phosphorization not only possess high specific capacity and excellent electrical conductivity from the phosphides but also inherit the superior stability from the oxides or hydroxides.14,20 As reported in previous literature,21–23 the conductive carbon coating is an efficient method for enhancing the performance of hybrid materials, which can expose more active sites, increase the conductivity and buffer the strain during the continuous faradaic redox processes, leading to high energy storage ability, superior rate performance and desirable stability.14,24 Nevertheless, developing NiCoP materials with excellent performance in SC applications is still a challenging task.
We have, therefore, synthesized urchin-like NiCoP nanoarrays with carbon coating arrayed on carbon cloth (NiCoP@C-ULAs). At first, the three precursors with flower-like, urchin-like and hollow structures, were obtained via a facile solvothermal approach. Among them, the urchin-like precursor delivers the highest electrochemical performance due to the unique structure, wherein the 1D nanospines provide fast electron transfer, tremendously dense 2D thin nanoflakes supply numerous active sites, and the integrated 3D urchin-like arrays on carbon cloth form the broad conductive network to improve the utilization of active materials. After phosphorization, the specific capacity of NiCoP-ULAs increased a lot, while the cycling performance was poor. Remarkably, introducing carbon coating on the NiCoP-ULAs simultaneously improved the hole uniformity and mechanical strength of the NiCoP@C-ULAs composite. Thus, it delivered a high specific capacity of 1046 C g−1 at 1 A g−1, good rate performance with 76.5% retention, and excellent cycling stability. Moreover, the as-fabricated all-solid-state NiCoP@C-ULAs//AC device exhibited an energy density of at 37.1 W h kg−1 at the power density of 792.8 W kg−1, and excellent cycling stability. LEDs can be lit up by this device for several minutes, which proves that the NiCoP@C-ULAs are promising electrode materials for energy storage and conversion devices.
2. Experimental
2.1. Materials
Nickel(II) nitrate hexahydrate (Ni(NO3)2·6H2O), cobalt(II) nitrate hexahydrate (Co(NO3)2·6H2O), acid citric, sodium hypophosphite (NaH2PO2), polyvinyl alcohol (PVA) and potassium hydroxide (KOH) were purchased from Shanghai Macklin Biochemical Co. Ltd. All chemical reagents were of analytical grade and were used without further purification. The CC and the active carbon (AC) were obtained from Shanghai Jingchong Electronic Technology Co. Ltd and Fuzhou Yihuan Carbon Co. Ltd, respectively.2.2. Synthesis of NiCo-ULAs precursors
The urchin-like Ni0.5Co0.5C2O4 nanoarray precursors (denoted as NiCo-ULAs) were directly grown on CC via a facile solvothermal process. At first, the CC substrate was carefully purified with concentrated HNO3 solution for 30 min; subsequently, it was washed several times with deionized water and ethanol, respectively. Typically, 2 mmol Ni(NO3)2·6H2O, 2 mmol Co(NO3)2·6H2O and 3 mmol citric acid were dissolved in the solution containing 22.5 mL ethanol and 7.5 mL deionized water and then sonicated vigorously for 5 min to form the transparent pink mixture. A piece of pretreated CC (3 × 3 cm2) was immersed in the above solution and sonicated continuously for 20 min. Then, the CC and the solution were transferred into a Teflon-lined stainless steel autoclave (50 mL) and maintained at 160 °C for 6 h. After cooling to ambient temperature, the sample was taken out, rinsed several times with deionized water and ethanol, and vacuum dried at 60 °C for 6 h. Finally, NiCo-ULAs precursors with the mass loading of ∼2.7 mg cm−2 were obtained. Ni0.5Co0.5C2O4 nanoflower arrays (denoted as NiCo-NFAs) and Ni0.5Co0.5C2O4 hollow nanospheres arrays (denoted as NiCo-HNSAs) were prepared with a similar process as described above except for 2 and 4 mmol citric acid, respectively. The mass loadings of NiCo-NFAs and NiCo-HNSAs were ∼2.6 mg cm−2 and 1.5 mg cm−2.2.3. Synthesis of NiCoP arrays
The NiCoP arrays were synthesized by an effective chemical vapor deposition method with phosphide. The 3 × 3 cm2 piece of NiCo-ULAs and 200 mg NaH2PO2 powders were placed in the middle and the bottom of a semi-enclosed tube, respectively. The tube was heated to 300 °C at a heating rate of 2 °C min−1 and maintained for 2 h in a N2 atmosphere. After cooling to ambient temperature under the N2 atmosphere, the product (denoted as NiCoP-ULAs) was obtained by carefully washing with water and ethanol, and then dried at 60 °C under vacuum for 6 h. The mass loading of the NiCoP-ULAs was ∼2.1 mg cm−2.2.4. Synthesis of NiCoP@C with a core–shell structure
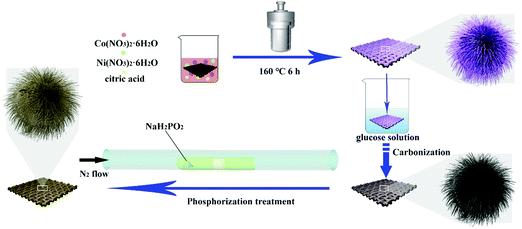
The synthesis route of the NiCoP@C-ULAs is illustrated in Fig. 1. First, the as-prepared CC covered with the NiCo-ULAs precursor was put into the 0.02 M glucose solution for 6 h and then dried naturally at ambient temperature. Afterward, the above treated CC was heated to 400 °C at a heating rate of 2 °C min−1 and calcined for 2 h in N2 atmosphere to synthesize NixCo1−xO@C-ULAs. Finally, the NixCo1−xO@C-ULAs were subjected to the same phosphorization procedure as depicted above to synthesize the NiCoP@C-ULAs. The products were washed several times with water and ethanol and dried at 60 °C. The mass loadings of NixCo1−xO@C-ULAs and NiCoP@C-ULAs on the CC were ∼1.6 and ∼1.7 mg cm−2, respectively. For comparison, the NixCo1−xO@C-NFAs and NiCoP@C-NFAs with the masses of ∼1.4 mg cm−2 and 1.5 mg cm−2, respectively, were synthesized by a similar method to the NiCo-NFAs precursor.2.5. Material characterization
The morphologies of the as-prepared materials were characterized by scanning electron microscopy (SEM, JEOL JSM-7001F) and transmission emission microscopy (TEM, JEM-2100). The crystal structure and composition were examined by powder X-ray diffraction (XRD, PANalytical PW3040/60), X-ray photoelectron spectroscopy (XPS, ESCALAB 250Xi spectrometer), and energy-dispersive X-ray spectroscopy (EDX). The specific surface areas of the samples were calculated using an ASAP2460 BET analyzer, and the total pore volumes were estimated by the Barrett–Joyner–Halenda (BJH) method.2.6. Electrochemical measurements
Electrochemical measurements were performed in a three-electrode system, where the as-prepared electrodes, Pt electrode and Hg/HgO electrode served as the working electrode, counter electrode and reference electrode, respectively, and 1 M KOH aqueous solution as the electrolyte. Cyclic voltammetry (CV) and galvanostatic charge–discharge (GCD) measurements were carried out on the electrochemical working station (PMC1000, AMETEK). Electrochemical impedance spectroscopy (EIS) tests were measured at an open-circuit voltage in the frequency range from 100 kHz to 0.01 Hz at an amplitude of 5 mV on the Solartron electrochemical workstation. The specific capacity (Qs, C g−1) was calculated from the GCD curves according to eqn (1): | (1) |
2.7. Assembly of flexible solid-state ASC devices
The as-prepared electrodes and AC served as the positive and negative electrodes of ASC devices. The AC negative electrode was prepared by a conventional technique. The mixture containing AC, acetylene black, and polytetrafluoroethylene (PTFE) with a mass ratio of 80![[thin space (1/6-em)]](https://www.rsc.org/images/entities/char_2009.gif) :
:![[thin space (1/6-em)]](https://www.rsc.org/images/entities/char_2009.gif) 10
10![[thin space (1/6-em)]](https://www.rsc.org/images/entities/char_2009.gif) :
:![[thin space (1/6-em)]](https://www.rsc.org/images/entities/char_2009.gif) 10 was pressed on nickel foam with a pressure of 20 MPa. The mass of the active materials on the anode and cathode electrodes for the ASC device was balanced using the charge balance equation q+ = q− as follows:
10 was pressed on nickel foam with a pressure of 20 MPa. The mass of the active materials on the anode and cathode electrodes for the ASC device was balanced using the charge balance equation q+ = q− as follows: | (2) |
The PVA/KOH gel electrolyte was fabricated as follows: 5 g of polyvinyl alcohol (PVA) powder was dissolved in 35 mL of deionized water, and the mixture was stirred to form a transparent solution at 50 °C. Next, 5 g KOH was dissolved in 15 mL deionized water, then the KOH solution was mixed with the PVA solution and stirred at 50 °C for 30 min. When the mixture was slowly cooled to room temperature, the as-prepared positive and AC negative electrodes were immersed in the PVA/KOH solution for 10 min and then taken out. After 20 min, they were pressed together until the electrolyte was completely solidified and the all-solid-state ASC device was successfully assembled.
For the ASC devices, the specific capacity (Qc, C g−1), energy density (E, W h kg−1) and power density (P, W kg−1) were derived from the following equations, respectively:
 | (3) |
 | (4) |
 | (5) |
 is the area under the discharge curve of the all-solid-state ASC.
3. Results and discussion
3.1. Morphology and structure characterizations
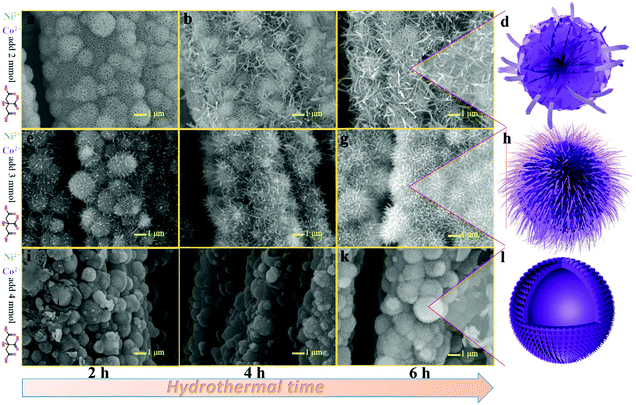
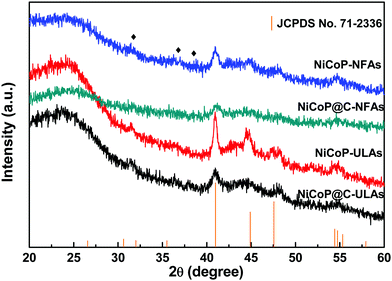
Fig. 2(a–c) show the SEM images of NiCo-NFAs obtained by adding 2 mmol citric acid at the different hydrothermal reaction times. For the sample with the reaction for 2 h, only the three-dimensional (3D) flower-like spheres with diameter of about 1 μm were uniformly covered on the CC, which consisted of staggered nanoflakes. As the reaction time reached 4 h, a few 1D nanospines appeared on the surface of the nanoflakes. When the reaction time was extended to 6 h, the 1D nanospines became denser and longer, were distributed evenly, and formed the 3D flower-like NiCo-NFAs (Fig. 2c and d). The morphology evolution of NiCo-ULAs is similar to that of NiCo-NFAs, as shown in Fig. 2(e–g). When the reaction time was 2 h, the naked cores composed of high densities of thin nanoflakes were uniformly anchored on the CC and randomly decorated by a few immature nanospines (Fig. 2e and Fig. S1, ESI†). On increasing the reaction time from 4 to 6 h, the nanospines grew longer and denser (Fig. 2f and g) and finally, the NiCo-ULAs with the overall urchin-like architecture NiCo-ULAs were formed; the schematic diagram is presented in Fig. 2h. Such a well-integrated hierarchical structure for NiCo-ULAs possesses desirable advantages. The 3D spheres composed of 2D nanoflakes can provide robust mechanical strength and high surface area as well as a shorter pathway for effective ion transport. The 1D nanospines not only increased the contact surface between the ions and active materials, but also acted as a rapid pathway for charge transport. Surprisingly, as the citric acid increased to 4 mmol, the NiCo-HNSAs with the hollow nanosphere structure was obtained after the hydrothermal reaction (Fig. 2k). Since the reaction contained two different solvents, the formation of hollow nanospheres may be ascribed to an inside-out Ostwald-ripening process and interfacial tension.25 Based on the Ostwald-ripening mechanism, the substances underneath the surface of the solid nanospheres were gradually dissolved (Fig. 2i), formed the hollow nanospheres (Fig. 2j), and finally recrystallized into the nanospines on the surface of the hollow nanospheres (Fig. 2k). The NiCo-HNSAs with such a unique hollow sphere structure is represented in Fig. 2l. The precursor morphology changed significantly on increasing the concentration of citric acid. Citric acid plays an important role in coordination chemistry as a versatile ligand. Particularly, citric acid has a strong complexing ability with metal cations, and it is widely used to stabilize the nuclei, regulate the morphology or act as an important surface exchange ligand in nanomaterial synthesis.26–29 In our work, the nucleation and growth orientation of the three precursors are strongly dependent on the complexation of nickel and cobalt ions with citric acid. The samples will selectively form the optimal construction with thermodynamic stability in the citric acid solution with suitable concentrations (2, 3 and 4 mmol).The XRD patterns of the three precursors are displayed in Fig. S2a (ESI†), and indexed to cobalt oxalate hydrate and nickel oxalate hydrate (JCPDS No. 25-0250 and 25-0528, respectively). After phosphorization, the XRD patterns of the as-prepared samples were obtained and are shown in Fig. 3. The peaks located at around 41.0°, 44.9°, and 47.6° can be indexed to the (111), (201), and (210) planes of hexagonal NiCoP (JCPDS card no. 71-2336), respectively, indicating the successful synthesis of NiCoP. Apart from the peaks at around 25° assigned to the carbon cloth substrate, the inconspicuous peaks at around 31.3°, 36.8° and 38.5° (denoted by “✦”) can be ascribed to the nickel–cobalt oxide due to the incomplete phosphorization at high temperatures. Fig. S2b (ESI†) exhibits the XRD patterns of NixCo1−xO@C-NFAs and NixCo1−xO@C-ULAs obtained through the carbonization process. The peaks of both samples are well-matched with Co3O4 (JCPDS card no. 74-2120) and NiO (JCPDS card no. 75-0197), suggesting the presence of Co3O4 and NiO species in the two samples.
Fig. 4 displays the SEM images of the as-prepared NiCo-ULAs, NiCoP-ULAs, and NiCoP@C-ULAs samples. As shown in Fig. 4a and b, NiCo-ULAs were uniformly grown on the carbon cloth and are displayed in a highly ordered distribution. After direct phosphorization, NiCoP-ULAs retained the integrated structure as compared to NiCo-ULAs, however, the surface became rougher (Fig. 4c and d). On undergoing carbonization, the structure of NixCo1−xO@C-ULAs can be better maintained as compared to NiCo-ULAs as shown in Fig. S3 (ESI†). However, the nanospines of NiCoP@C-ULAs became rough and thick, and turned into the column shape (Fig. 4e and f). The synergistic effect of carbon and NiCoP can lead to a robust structure and endure repeated charge–discharge processes. The carbon layer was fabricated on the surface of NiCoP@C-ULAs by regulating the glucose concentrations. Fig. S4 (ESI†) shows another two phosphide hybrids obtained with 0.03 and 0.04 M glucose solutions. As shown in Fig. S4c and d (ESI†), more glucose will dramatically damage the structure of the hybrid after phosphorization. Therefore, the optimal glucose concentration to synthesize NCoP@C-ULAs is 0.02 M. The NiCoP-NFAs showed similar morphology during the same fabrication process as the NiCo-ULAs series samples (displayed in Fig. S5, ESI†).
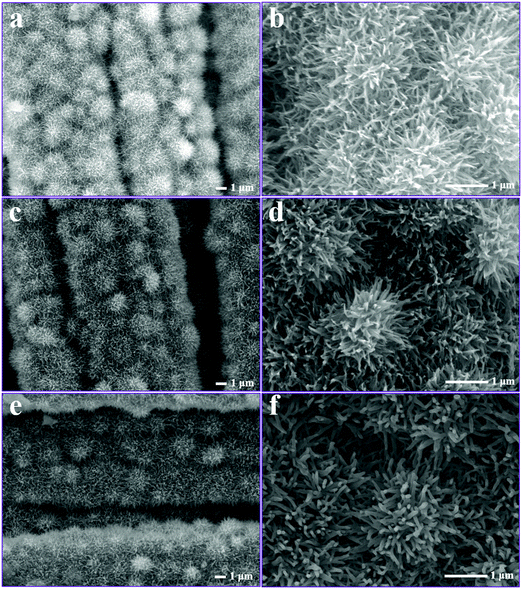 | ||
| Fig. 4 SEM images of (a and b) NiCo-ULAs, (c and d) NiCoP-ULAs, and (e and f) NiCoP@C-ULAs at low and high magnifications. | ||
To obtain more detailed information, the samples were investigated by TEM and HRTEM. As shown in Fig. S6 (ESI†), the TEM images reveal the structure and morphology evolution of the series samples derived from NiCo-NFAs and NiCo-ULAs. Fig. S6a and d (ESI†) show that the NiCo-NFAs and NiCo-ULAs are thin nanoflakes and nanospines. After the phosphorization process, the nanoflakes turned into rough and plentiful crystal particles with about 10 nm, and the sample agglomerated (Fig. S6b and e, ESI†). Remarkably, the structures of NiCoP@C-NFAs and NiCoP@C-ULAs were well retained after coating with the carbon layer (Fig. S6c and f, ESI†). The carbon matrix may serve as the barrier layer to avoid the aggregation of particles during phosphorization.
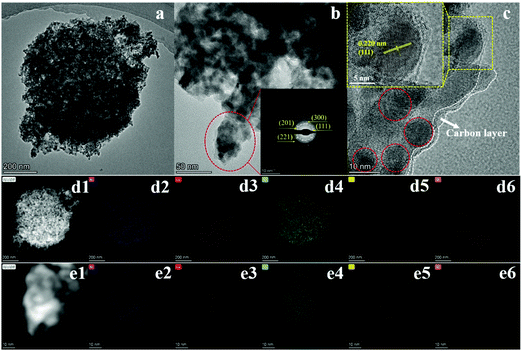
There were plenty of pores in both samples. The increasing pores could be ascribed to the decomposition of precursors to release small molecules during the carbonization and phosphorization processes.30,31 The pores are favorable for improving the performance of energy storage and catalysis.32 The TEM images of NiCoP@C-ULAs and its representative area are shown in Fig. 5a and b, respectively. The selected area electron diffraction (SAED) pattern (inset of Fig. 5b) of the nanospines displays the well-defined diffraction ring, implying that the nanospines are polycrystalline. Moreover, the HRTEM image (Fig. 5c) reveals the presence of nanocrystals with diameter of around 10 nm, and the interplanar spacing of 0.22 nm in the inset pattern can be indexed to the (111) plane of NiCoP. Obviously, the species on the edge area are indicative of the amorphous carbon layer. Fig. 5d1–d6 exhibit the high angle annular dark-field (HAADF) images of the whole NiCoP@C-ULAs and the corresponding elemental signal patterns. The Ni, Co, P and C elements are distributed evenly in the NiCoP@C-ULAs with a hierarchical structure. However, the presence of O element here may be ascribed to the incomplete phosphating and oxidation of the precursors in the ambient conditions. In addition, the elements in the nanospines are the same as those in the whole structure of NiCoP@C-ULAs (Fig. 5e1–e6), proving the homogeneous distribution of these compositions. The corresponding element content in NiCoP@C-ULAs was demonstrated by EDX analysis as displayed in Fig. S7 (ESI†).
To determine the surface elemental composition and valence states in the NiCoP@C-ULAs and NiCo-ULAs precursor, XPS measurements were employed. The XPS full spectra for NiCoP@C-ULAs are shown in Fig. 6a, which verify the presence of Ni, Co, P, O and C elements. As depicted in Fig. 6b and c, the high-resolution XPS spectrum of Ni 2p3/2 for the NiCo-ULAs precursor showed two peaks at 855.3 and 856.9 eV corresponding to Ni2+ and Ni3+, and a shakeup satellite peak. The Co 2p3/2 spectrum was deconvoluted into the spin–orbit doublet characteristics of Co2+ and Co3+ located at 782.8 and 780.7 eV, and a shakeup satellite peak. After phosphorization, the peaks assigned to different valences of Ni and Co shifted to lower band energies due to the lower electronegativity and ionization degree of metal (Ni, Co)–P bonds. This result confirms the high conversion of the NiCo-ULAs precursor into NiCoP, which is consistent with the XRD analysis. The P 2p spectra in Fig. 6d are well fitted to the pairs of P 2p1/2 and 2p3/2 peaks. The doublet peak at 129.8 eV is lower than that of elemental P at 130.2 eV,33 indicating P species with a small negative charge (Pδ−, δ is likely close to 0) in NiCoP@C-ULAs.
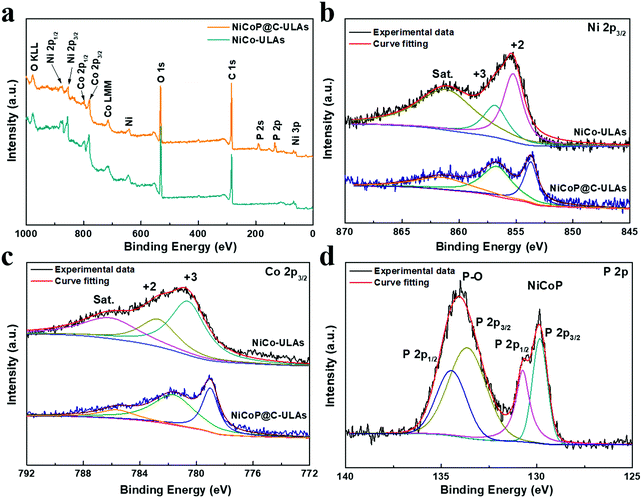 | ||
| Fig. 6 (a) XPS full spectra of NiCoP@C-ULAs and NiCo-ULAs samples, and the related high-resolution XPS spectra of (b) Ni 2p3/2, (c) Co 2p3/2; (d) P 2p in NiCoP@C-ULAs. | ||
Therefore, the Ni and Co species in metal–P bonds have partially positive charges (Niδ+, Coδ+). In addition, the doublet peak at around 134.5 eV is assigned to the P–O bonds in the phosphate species (P5+) due to the possible oxidation of NiCoP in air.34,35 Fig. S8a and b (ESI†) show the high-resolution spectra of C 1s and O 1s for NiCo-ULAs, where the C 1s spectrum exhibits the characteristic peaks located at 284.8, 285.8, and 288.9 eV, corresponding to the C–C, C–O/C–OH, and O–C![[double bond, length as m-dash]](https://www.rsc.org/images/entities/char_e001.gif) O species, respectively,25,36,37 and the O 1s spectrum displays two peaks at 530.7 and 531.7 eV in accord with the C
O species, respectively,25,36,37 and the O 1s spectrum displays two peaks at 530.7 and 531.7 eV in accord with the C![[double bond, length as m-dash]](https://www.rsc.org/images/entities/char_e001.gif) O and metal–OH species on the surface.20,38 However, in the C 1s spectrum of NiCoP@C-ULAs, the peak at 288.9 eV is greatly inconspicuous as compared to that of the NiCo-ULAs precursor. The intensity of the peak at 285.8 eV is significantly stronger than that in the NiCo-ULAs precursor, which demonstrates that the carbon species connect a large proportion of C–OH groups and the amorphous carbon is formed on the surface.23,25 Furthermore, compared to the NiCo-ULAs precursor, the O 1s peak for NiCoP@C-ULAs remains at 531.7 eV and the new peak at 533.1 eV is assigned to oxygen in P–O bonds, while the peak at 530.7 eV assigned to C
O and metal–OH species on the surface.20,38 However, in the C 1s spectrum of NiCoP@C-ULAs, the peak at 288.9 eV is greatly inconspicuous as compared to that of the NiCo-ULAs precursor. The intensity of the peak at 285.8 eV is significantly stronger than that in the NiCo-ULAs precursor, which demonstrates that the carbon species connect a large proportion of C–OH groups and the amorphous carbon is formed on the surface.23,25 Furthermore, compared to the NiCo-ULAs precursor, the O 1s peak for NiCoP@C-ULAs remains at 531.7 eV and the new peak at 533.1 eV is assigned to oxygen in P–O bonds, while the peak at 530.7 eV assigned to C![[double bond, length as m-dash]](https://www.rsc.org/images/entities/char_e001.gif) O disappears. The weak peak at 529.9 eV can be ascribed to the oxygen species in the metal oxide, which is consistent with the XRD results.
O disappears. The weak peak at 529.9 eV can be ascribed to the oxygen species in the metal oxide, which is consistent with the XRD results.
The charge storage processes involving the ion adsorption and redox reaction almost take place on the surface of electroactive materials for SCs. Therefore, the higher specific surface areas and inner pores are beneficial for increasing the contact areas of active materials with electrolyte, they facilitate the ion diffusion and shorten the ion transport pathway. Fig. 7 shows the nitrogen adsorption–desorption isotherms of the NiCo-ULAs, NiCoP-ULAs, and NiCoP@C-ULAs samples. As shown in Fig. 7a–c, all samples display a typical IV type isotherm with a distinct hysteresis loop, revealing their mesoporous feature. The Brunauer–Emmett–Teller surface areas (SBET), average pore diameter, and total pore volume of these samples are summarized in Table S1 (ESI†). The SBET of NiCo-ULAs, NiCoP-ULAs, and NiCoP@C-ULAs are 37.5, 139.1, and 201.9 m2 g−1, and their average pore diameters are 16.8, 9.1, and 4.4 nm, respectively. Generally, the small pore size is favorable for the ion diffusion, improving the electrochemical behavior. Moreover, the insets in Fig. 7a and b are the pore size distributions that were calculated by the Barrett–Joyner–Halenda (BJH) method. Obviously, the pore diameters of NiCoP-ULAs decreased greatly after the phosphorization, due to the decomposition of the precursor in the phosphorization, thus the SBET of NiCoP-ULAs increased a lot.13,39 For NiCoP@C-ULAs, the average pore size of 4.4 nm was the smallest and they were mostly concentrated below 10 nm (inset of Fig. 7c), which may be because the pores were partially filled with the carbon coating layer after carbonization and phosphorization. Furthermore, the total pore volume of NiCoP@C-ULAs was 0.231 cm3 g−1, which is lower than that of NiCoP-ULAs (0.306 cm3 g−1). It has been proved that the presence of the carbon layer in the pores decreases the pore volume. For comparison, the nitrogen adsorption–desorption isotherms for the NiCo-NFAs, NiCoP-NFAs, and NiCoP@C-NFAs are displayed in Fig. S9 (ESI†). Similarly, NiCoP@C-NFAs showed the highest SBET of 174.4 m2 g−1 and the smallest average pore size of 6.1 nm among the NiCo-NFAs, NiCoP-NFAs, and NiCoP@C-NFAs samples. To sum up, the NiCoP@C-ULAs possess greater SBET and pore volume, and smaller pore size, which can expose abundant active sites, facilitate ion transfer and achieve high energy and power storage.
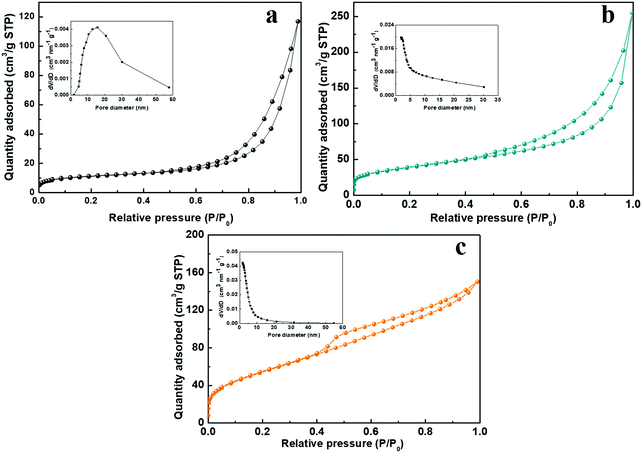 | ||
| Fig. 7 Nitrogen adsorption–desorption isotherms of the (a) NiCo-ULAs, (b) NiCoP-ULAs, and (c) NiCoP@C-ULAs. Insets of (a), (b) and (c) are their pore size distributions. | ||
3.2. Electrochemical properties in a three-electrode system
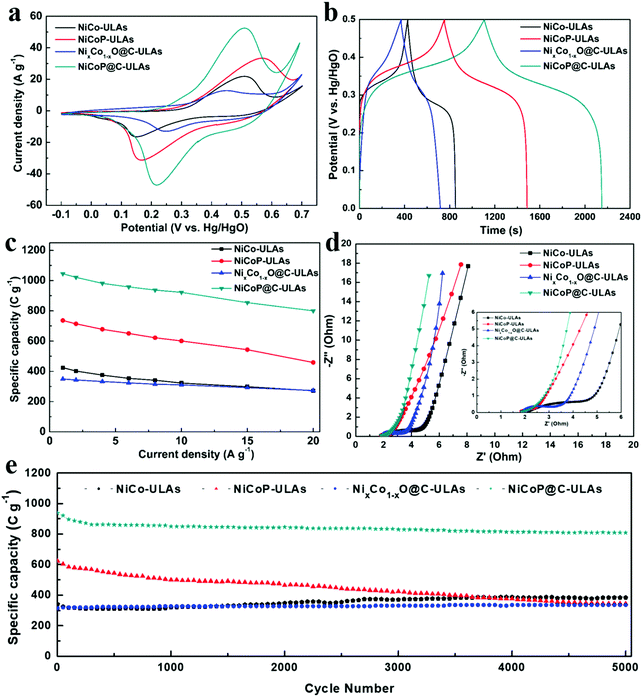
The electrochemical measurements were carried out in a three-electrode system in 1 M KOH electrolyte. The three precursors (NiCo-NFAs, NiCo-ULAs, and NiCo-HNSAs) were evaluated to determine the optimal precursor for the subsequent carbonization and phosphorization processes. Fig. S10 (ESI†) exhibits the electrochemical performance of the three precursors. As displayed in Fig. S10a (ESI†), a couple of prominent peaks were observed in all CV curves within the potential window of −0.1 to 0.7 V (vs. Hg/HgO), which arise from the reversible faradaic reactions of Ni2+/Ni3+ and Co2+/Co3+.40 It can be clearly seen that NiCo-ULAs electrode shows the largest area of the CV curve as compared to the others, implying the excellent capacity for energy storage. The GCD curves at 1 A g−1 are depicted in Fig. S10b (ESI†) and the curves show the charge and discharge plateau corresponding to the potential of the two redox peaks in CV curves. The NiCo-ULAs curve exhibits the longest discharge time, suggesting the highest specific capacity. Based on the GCD curves, the specific capacities of NiCo-NFAs, NiCo-ULAs, and NiCo-HNSAs are 401.7, 423.9, and 260.8 C g−1, respectively. The values of the specific capacity at different current densities are depicted in Fig. S10c (ESI†). The NiCo-ULAs delivered high specific capacity retention (64.1%) when the current density was in the range from 1 A g−1 to 20 A g−1, which was higher than that of NiCo-NFAs (49.6%) and slightly higher than that of NiCo-HNSAs (63.5%). The rate performance results further confirmed that the 3D urchin-like NiCo precursor composed of abundant nanoflakes and nanospines is beneficial for enhancing the ion diffusion and redox kinetics. The cycling performance is an important factor for the requirement of long lifespan SCs. As shown in Fig. S10d (ESI†), NiCo-ULAs presents superior specific capacity retention (112.62%) after 5000 cycles at a high current density of 8 A g−1, compared to that of NiCo-NFAs (87.93%) and NiCo-HNSAs (59.15%). Thus, the NiCo-NFAs and NiCo-ULAs precursors were further converted into phosphide to enhance the electrochemical properties.The electrochemical tests of the ULAs series electrodes were conducted and their electrochemical performances are shown in Fig. 8. The CV curves at a scan rate of 10 mV s−1 exhibited a couple of obvious faradaic redox peaks (Fig. 8a) due to the successive faradaic reaction of Ni and Co ions during the electrochemical test. Specifically, the mechanisms of energy storage in the alkaline electrolyte for the NiCoP-ULAs and NiCoP@C-ULAs involve the reaction of the NiCoP active material in the potential range, and the electrochemical reaction equations are represented as follows:41,42
| NiCoP + 2OH− ↔ NiP1−xOH + CoPxOH + 2e− | (6) |
| CoPxOH + OH− ↔ CoPxO + H2O + e− | (7) |
It is well known that the voltage differences between the anodic and cathodic peaks (Epp) play an important role in the catalytic activity of the electroactive materials.43,44 Obviously, the NiCo-ULAs and NiCoP-ULAs present large Epp values, suggesting their high polarization performances. After carbon coating and phosphorization, the Epp value of the NiCoP@C-ULAs electrode is much lower than the abovementioned electrodes but slightly higher than that of NixCo1−xO@C-ULAs, which reveals the excellent redox reversibility of the NiCoP@C-ULAs electrode. Remarkably, the NiCoP@C-ULAs possesses the largest CV area, implying the highest specific capability. The results demonstrate that the carbon-coating and subsequent phosphorization is an efficient strategy for improving the energy storage performance for the NiCo-ULAs precursor. The CV curves of NiCo-ULAs, NiCoP-ULAs, NixCo1−xO@C-ULAs, and NiCoP@C-ULAs at different sweep rates of 5–30 mV s−1 are displayed in Fig. S11a–d (ESI†), respectively. With the increase in the scan rate, the anodic peak and the cathodic peaks shift toward higher and lower potentials, respectively, due to the growth of the internal resistance for these electrodes during the redox reaction.45 The shapes of the CV curves for the NiCoP@C-ULAs electrode can be well maintained, even at a high scan rate of 30 mV s−1; however, the curves of the NiCoP-ULAs electrode exhibit serious polarization, which indicates that the rate performance of the NiCoP@C-ULAs is superior to that of the NiCoP-ULAs. In theory, the total capacity of an electrode is determined by the diffusion-controlled process and the capacity properties, and the degree of the capacitive effect can be quantitatively analyzed according to the following equation:
| i = avb | (8) |
As shown in Fig. 8b, the GCD curves of all samples at a current density of 1 A g−1 are almost symmetric, implying good reversibility of the redox reaction and excellent coulombic efficiency. The nonlinear GCD curves and the presence of the obvious platform indicate the typical battery-like material characteristics, which are consistent with the CV results. The specific capacities for NiCo-ULAs, NiCoP-ULAs, NixCo1−xO@C-ULAs and NiCoP@C-ULAs electrodes are 424, 732, 349 and 1046 C g−1, respectively. The NiCoP@C-ULAs electrode delivers the highest specific capacity, which suggests that the phosphorization approach can be efficient at improving the electrochemical energy storage. Compared to NiCoP-ULAs, NiCoP@C-ULAs possesses a higher specific area and uniform pores. Thus, NiCoP@C-ULAs can expose more active sites, shorten the ion transport path, and speed up the redox reactions, therefore it has the highest specific capacity. The GCD curves at various current densities from 1 to 20 A g−1 for NiCo-ULAs, NiCoP-ULAs, NixCo1−xO@C-ULAs and NiCoP@C-ULAs are displayed in Fig. S11e–h (ESI†), respectively. Based on the GCD data, the specific capacities at different current densities are calculated according to eqn (1), and plotted in Fig. 8c. The specific capacities of NiCoP@C-ULAs are 1046, 1022, 982, 959, 938, 923, 855 and 800 C g−1 at the different current densities of 1, 2, 4, 6, 8, 10, 15 and 20 A g−1, respectively, which are higher than those of other electrodes, indicating that it exhibits excellent energy storage performance. In Fig. 8c, NixCo1−xO@C-ULAs shows good rate performance (78.2%), as proved by previous literature.46,47 Significantly, the capacity retention of NiCoP@C-ULAs was 76.5% when the current density increased from 1 to 20 A g−1, which is higher than that of NiCo-ULAs (64.2%) and NiCoP-ULAs (62.1%). The result indicates that the carbon coating on NiCoP-ULAs can efficiently improve the rate capability and provide an extra path for the ion penetration.22
Electrochemical impedance spectroscopy (EIS) measurements were carried out to investigate the kinetic properties of the ULAs series electrodes. The Nyquist impedance plots of NiCo-ULAs, NiCoP-ULAs, NixCo1−xO@C-ULAs and NiCoP@C-ULAs are shown in Fig. 8d, and Fig. S13 (ESI†) depicts the corresponding equivalent circuit diagram. Generally, the EIS curve is composed of a sloping line in the low-frequency region that is related to the Warburg diffusion process and a quasi-semicircle in a high-frequency region that is associated with the charge transfer resistance (Rct). The intercept at the real axis in the high-frequency range is related to solution resistance (Rs), which is the equivalent of series resistance containing the intrinsic resistance of the electrode, the internal resistance of the electrolyte, and the contact interface resistance. NiCoP@C-ULAs and NiCoP-ULAs present similar Rs values (1.66 Ω), which are lower than NixCo1−xO@C-ULAs (1.84 Ω) and NiCo-ULAs (2.06 Ω). It is indicated that the NiCoP@C-ULAs possesses good conductivity as well as excellent contact between the active material and the CC substrate. The Rct is an important parameter for evaluating the reaction kinetic properties for electrode materials.48 In the high-frequency range, the Rct value of NiCoP@C-ULAs (0.995 Ω) is lower than that of NiCo-ULAs (3.355 Ω) and NixCo1−xO@C-ULAs (1.173 Ω), and equivalent to that of NiCoP-ULAs (0.986 Ω), which indicates that the NiCoP@C-ULAs has excellent conductivity and favors fast charge transfer during the electrochemical redox processes. In the low-frequency region, the diffusive resistance obtained from the slope of the straight line reflects the ion diffusion rate of the redox species in the electrolyte. Thus, on comparison of the NiCo-ULAs, NiCoP-ULAs and NiCoP@C-ULAs electrodes, NiCoP@C-ULAs has the lowest diffusive resistance, which is beneficial to the rate capability.
The cycling stability is a critical parameter for estimating the applications of supercapacitors. Fig. 8e shows the cycling performance of the four ULAs electrodes at a high current density of 8 A g−1. After 5000 cycles, the specific capacity of NiCo-ULAs increased to 384 C g−1 with a superior retention of 112.6%. The increased specific capacity may arise from the gradually improved ion accessibility during the charging/discharging processes, which was verified by a previous report.20 NiCoP-ULAs showed a high specific capacity of 624 C g−1 in the first cycle but gradually dropped to 344 C g−1 after 5000 cycles with 55.1% retention, which is similar to previously reported results.14,34 Moreover, the NixCo1−xO@C-ULAs delivered excellent retention (around 106.3%) of initial specific capacity after 5000 cycles; nevertheless, its specific capacity is poor. The capacity retention of the NiCoP@C-ULAs electrode was about 86.3%, which is significantly higher than that of the NiCoP-ULAs electrode, and the remaining specific capacity (809 C g−1) is the highest among the as-prepared samples after 5000 cycles. The SEM images of the NiCoP@C-ULAs electrodes after 5000 cycling tests are displayed in Fig. S15 (ESI†) for studying the structural stability. The morphology of NiCoP@C-ULAs was well-maintained without structure collapse (Fig. S15b, ESI†), however, the structure of the NiCoP-ULAs electrode was severely damaged; it agglomerated and collapsed dramatically after cycling for 5000 cycles (Fig. S15a, ESI†). The SEM results further confirmed that the carbon coating serves as a protective shell, which can impede the excessive contact between the internal active materials and the electrolyte, and prevent the agglomeration of adjacent units. For comparison, the electrochemical properties of NFAs series electrodes are displayed in Fig. S14 (ESI†). The specific capacities at various current densities, rate capabilities and cycling performances of the as-prepared NFAs and ULAs electrodes are given in Table S2 (ESI†). The NiCoP@C-NFAs exhibited higher specific capacity (934 C g−1 at 1 A g−1) as compared to the other NFAs samples and demonstrated excellent rate capability (73.9%) as well as good cycling stability (82.9% retention after 5000 cycles). The results further confirmed that the combination of phosphorization and the carbon layer is a good way to prepare materials with high electrochemical performance.
3.3. Electrochemical properties in a two-electrode system
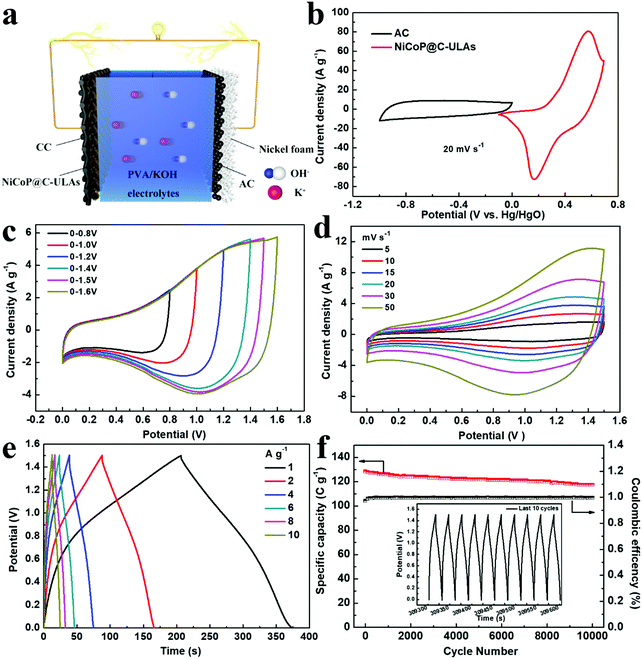
To evaluate the practical applications of the NiCoP@C-ULAs electrode, the ASC device was assembled by using the NiCoP@C-ULAs as the positive electrode, the AC-supported nickel foam as the negative electrode, and PVA/KOH as the solid electrolyte (denoted as NiCoP@C-ULAs//AC, as shown in Fig. 9a). For comparison, NiCoP@C-NFAs//AC was fabricated by the same process. Detailed information on the AC electrode is given in Fig. S16 (ESI†). It can be clearly seen that all the CV curves of the AC electrode with the nearly rectangular shape and the almost linear GCD curves indicate the typical electric double layer capacitance behavior. The AC electrode has a good specific capacity of 204 C g−1 at a current density of 1 A g−1 and 73.5% retention at 10 A g−1. The mass ratios of the positive and negative electrodes were determined based on eqn (2) and the measured data in the three-electrode system. Thus, the theoretical mass ratio of NiCoP@C-ULAs and AC was calculated as 0.195. Fig. 9b shows the CV curves of NiCoP@C-ULAs and AC within −0.1 to 0.7 V (vs. Hg/HgO) and −1 to 0 V (vs. Hg/HgO) at 20 mV s−1, respectively. It was indicated that the possible voltage of the ASC device fabricated by both electrodes can expand to 1.7 V. Furthermore, the optimum working voltage can be determined from the CV curves recorded at different potentials at 20 mV s−1 (Fig. 9c). The polarization increased as the voltage increased to 1.6 V, thus the maximum working potential was determined to be 1.5 V. As shown in Fig. 9d, the CV curves at different sweep rates from 5 to 50 mV s−1 within the potential window from 0 to 1.5 V are a quasi-rectangular shape and coupled with distinguished redox peaks, reflecting the typical hybrid capacitive behavior.49 Even at a high scan rate of 50 mV s−1, the quasi-rectangular shape was well-maintained, indicating excellent rate capability. Fig. S17a and b (ESI†) show the CV curves of the NiCoP@C-NFAs//AC ASC at different scan rates and voltage windows. The optimal operating potential of the NiCoP@C-NFAs//AC ASC is 1.5 V and the CV shapes are similar to those of NiCoP@C-ULAs//AC at various scan rates, however, the CV curve areas of the latter are smaller than those of the former.The GCD curves of NiCoP@C-ULAs//AC at various current densities are depicted in Fig. 9e. The specific capacity values are 168.5, 157.5, 146.1, 138.6, 128.5 and 121.1 C g−1 at the current densities of 1, 2, 4, 6, 8, and 10 A g−1, respectively. The ASC device shows excellent rate capability (71% retention) even at a high current density of 10 A g−1. In addition, the IR drop of NiCoP@C-ULAs//AC obtained from the discharge curves (IR drop [V] = 0.00048 + 0.02232I/M [A g−1]) are depicted in Fig. S18 (ESI†). The IR drop with slight variations, even at high current densities, is conducive to high-power-density delivery.20 For NiCoP@C-NFAs//AC ASC, the specific capacities were calculated to be 136.1, 127.3, 115.1, 105.1, 96.2, and 77.1 C g−1 at the current densities of 1, 2, 4, 6, 8, and 10 A g−1, respectively (Fig. S17c, ESI†). The cycling test was performed at a high current density of 8 A g−1 for 10![[thin space (1/6-em)]](https://www.rsc.org/images/entities/char_2009.gif) 000 cycles to evaluate the cycling lifespan of the ASC device. Fig. 9f shows the cycling performance and coulombic efficiency of the NiCoP@C-ULAs//AC device tested at a current density of 8 A g−1, and the last 10 cycles of the GCD curves are displayed in the inset of Fig. 9f. After 10
000 cycles to evaluate the cycling lifespan of the ASC device. Fig. 9f shows the cycling performance and coulombic efficiency of the NiCoP@C-ULAs//AC device tested at a current density of 8 A g−1, and the last 10 cycles of the GCD curves are displayed in the inset of Fig. 9f. After 10![[thin space (1/6-em)]](https://www.rsc.org/images/entities/char_2009.gif) 000 cycles, the specific capacity of the ASC device can retain at 91.4%, demonstrating that this ASC device has outstanding cycling stability. However, the NiCoP@C-NFAs//AC device showed inferior retention as exhibited in Fig. S17d (ESI†).
000 cycles, the specific capacity of the ASC device can retain at 91.4%, demonstrating that this ASC device has outstanding cycling stability. However, the NiCoP@C-NFAs//AC device showed inferior retention as exhibited in Fig. S17d (ESI†).
Fig. 10a shows the Ragone plots of the NiCoP@C-NFAs//AC and NiCoP@C-ULAs//AC devices. The former presents the energy density of 32.9 W h kg−1 at 871.3 W kg−1, and only 14.2 W h kg−1 at 6429.7 W kg−1. However, the latter delivers a high energy density of 37.1 W h kg−1 at the power density of 792.8 W kg−1 and the energy density of 25.1 W h kg−1 was retained when the power density increased to 7467.2 W kg−1. The as-assembled ACS devices demonstrated superior energy density and power density as compared with the reported phosphide-based ASCs (Fig. 10a) such as AC//NiCoP (32 W h kg−1 at 351 W kg−1),50 NiCoP/NiCo-OH30//PC (34 W h kg−1 at 775 W kg−1),20 AC//CoP (19 W h kg−1 at 350.8 W kg−1),51 AC//NiP@NiCo2O4 (21 W h kg−1 at 350 W kg−1),52 and those Ni and Co-based ASC devices in previous research studies (Table S3, ESI†).53–57 The four as-assembled ASCs in series were easily charged up to the maximum potential of 6 V, and they could light up six commercial LEDs (two red, yellow and green LEDs in parallel) for 10 min (Fig. 10b), which demonstrated the practical application of the ASC device.
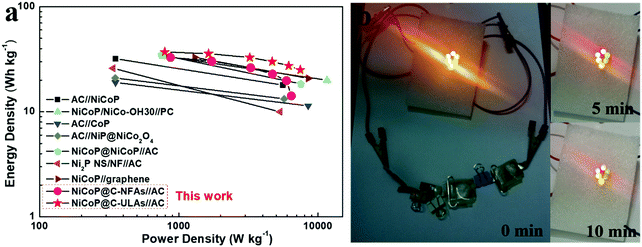 | ||
| Fig. 10 (a) Ragone plots of the NiCoP@C-ULAs//AC, NiCoP@C-NFAs//AC and reported Ni or Co-based ASC devices; (b) optical images of six LEDs lit up by NiCoP@C-ULAs//AC devices. | ||
4. Conclusions
In summary, we report a high-performance NiCoP@C-ULAs electrode material for SCs. Among the NiCo precursors, the urchin-like precursor showed the best performance because it contains abundant 1D nanospines that provide fast charge transport and 2D nanoflakes that increase contact areas with the electrolyte and shorten the ion diffusion path, and a 3D broad conductive network on carbon cloth that improves the utilization of active materials. The phosphorization and carbon coating demonstrated efficient strategies to synthesize NiCoP@C-ULAs electrode materials with high performance. The former can increase the conductivity of the precursor and expose more active sites, thus NiCoP@C-ULAs delivers high specific capacity. The latter can strengthen the mechanical stability, thus NiCoP@C-ULAs presents good cycling performance. Therefore, the NiCoP@C-ULAs electrode displayed a much higher specific capacity (1046 C g−1) at 1 A g−1 as compared to NiCo-ULAs (424 C g−1) and NiCoP-ULAs (732 C g−1), and a superior rate capability with 76.5% retention even at 20 A g−1. Remarkably, the 86.3% retention of specific capacity after 5000 cycles for the NiCoP@C-ULAs electrode increased greatly as compared to 55.1% for the NiCoP-ULAs electrode. For comparison, the NiCoP@C-NFAs displayed slightly lower electrochemical performances than the NiCoP@C-ULAs. The assembled NiCoP@C-ULAs//AC ASC exhibited a high energy density of 37.1 W h kg−1 at a power density of 792.8 W kg−1, and extraordinary cycling stability (91.4% of its initial specific capacity retention after 10![[thin space (1/6-em)]](https://www.rsc.org/images/entities/char_2009.gif) 000 cycles). Moreover, the ASC devices can easily light up the six LEDs, which manifests their potential for practical application in modern electronics. Ultimately, we believe that NiCoP@C-ULAs with good electrochemical properties is a promising material in energy storage and conversion devices.
000 cycles). Moreover, the ASC devices can easily light up the six LEDs, which manifests their potential for practical application in modern electronics. Ultimately, we believe that NiCoP@C-ULAs with good electrochemical properties is a promising material in energy storage and conversion devices.
Conflicts of interest
There are no conflicts to declare.Acknowledgements
This work was supported by the National Natural Science Foundation of China [grant number 21776051], the Guangzhou Education Bureau [grant number 1201541563], Department of Science and Technology of Guangdong Province [grant number 2017B090917002, 201802020029], the Natural Science Foundation of Guangdong (2018A030313423), Guangdong Undergraduate Innovation Experiment Project.References
- N. Choudhary, C. Li, J. Moore, N. Nagaiah, L. Zhai, Y. Jung and J. Thomas, Adv. Mater., 2017, 29, 1605336 CrossRef PubMed.
- M. Salanne, B. Rotenberg, K. Naoi, K. Kaneko, P. L. Taberna, C. P. Grey, B. Dunn and P. Simon, Nat. Energy, 2016, 1, 16070 CrossRef CAS.
- Y. Zhang, X. Jing, Q. Wang, J. Zheng, H. Jiang and C. Meng, Dalton Trans., 2017, 15048–15058 RSC.
- A.-L. Brisse, P. Stevens, G. Toussaint, O. Crosnier and T. Brousse, Materials, 2018, 11, 1178 CrossRef PubMed.
- H. Wang, M. Liang, D. Duan, W. Shi, Y. Song and Z. Sun, Chem. Eng. J., 2018, 350, 523–533 CrossRef CAS.
- Z.-B. Zhai, K.-J. Huang and X. Wu, Nano Energy, 2018, 47, 89–95 CrossRef CAS.
- Z. Liang, C. Qu, W. Zhou, R. Zhao, H. Zhang, B. Zhu, W. Guo, W. Meng, Y. Wu, W. Aftab, Q. Wang and R. Zou, Adv. Sci., 2019, 6, 1802005 CrossRef PubMed.
- X. Li, A. M. Elshahawy, C. Guan and J. Wang, Small, 2017, 13, 1701530 CrossRef PubMed.
- D. Wang, L. B. Kong, M. C. Liu, Y. C. Luo and L. Kang, Chemistry, 2015, 21, 17897–17903 CrossRef CAS PubMed.
- H. Liang, C. Xia, Q. Jiang, A. N. Gandi, U. Schwingenschlögl and H. N. Alshareef, Nano Energy, 2017, 35, 331–340 CrossRef CAS.
- Y. Bai, H. Zhang, L. Liu, H. Xu and Y. Wang, Chemistry, 2016, 22, 1021–1029 CrossRef CAS PubMed.
- Q. Zong, H. Yang, Q. Wang, Q. Zhang, Y. Zhu, H. Wang and Q. Shen, Chem. Eng. J., 2019, 361, 1–11 CrossRef CAS.
- C. Du, L. Yang, F. Yang, G. Cheng and W. Luo, ACS Catal., 2017, 7, 4131–4137 CrossRef CAS.
- Y. Shao, Y. Zhao, H. Li and C. Xu, ACS Appl. Mater. Interfaces, 2016, 8, 35368–35376 CrossRef CAS PubMed.
- H. Liang, J. Lin, H. Jia, S. Chen, J. Qi, J. Cao, T. Lin, W. Fei and J. Feng, J. Mater. Chem. A, 2018, 6, 15040–15046 RSC.
- L. Shen, Q. Che, H. Li and X. Zhang, Adv. Funct. Mater., 2014, 24, 2630–2637 CrossRef CAS.
- L. Ye, L. Zhao, H. Zhang, B. Zhang and H. Wang, J. Mater. Chem. A, 2016, 4, 9160–9168 RSC.
- G. Zhang, T. Wang, X. Yu, H. Zhang, H. Duan and B. Lu, Nano Energy, 2013, 2, 586–594 CrossRef CAS.
- Z. Wu, Y. Zhu and X. Ji, J. Mater. Chem. A, 2014, 2, 14759–14772 RSC.
- X. Li, H. Wu, A. M. Elshahawy, L. Wang, S. J. Pennycook, C. Guan and J. Wang, Adv. Funct. Mater., 2018, 28, 1800036 CrossRef.
- Y. Zhang, C. Sun, H. Su, W. Huang and X. Dong, Nanoscale, 2015, 7, 3155–3163 RSC.
- R. Zou, M. F. Yuen, L. Yu, J. Hu, C. S. Lee and W. Zhang, Sci. Rep., 2016, 6, 20264 CrossRef CAS PubMed.
- J. Lin, Y. Liu, Y. Wang, H. Jia, S. Chen, J. Qi, C. Qu, J. Cao, W. Fei and J. Feng, J. Power Sources, 2017, 362, 64–72 CrossRef CAS.
- X. Xu, J. Liu, Z. Liu, Z. Wang, R. Hu, J. Liu, L. Ouyang and M. Zhu, Small, 2018, 14, e1800793 CrossRef PubMed.
- M. Xu, Q. Xia, J. Yue, X. Zhu, Q. Guo, J. Zhu and H. Xia, Adv. Funct. Mater., 2018, 29, 1807377 CrossRef.
- Z. Shen, J. Liu, F. Hu, S. Liu, N. Cao, Y. Sui, Q. Zeng and Y. Shen, CrystEngComm, 2014, 16, 3387–3394 RSC.
- S. Thirumalairajan, K. Girija, I. Ganesh, D. Mangalaraj, C. Viswanathan, A. Balamurugan and N. Ponpandian, Chem. Eng. J., 2012, 209, 420–428 CrossRef CAS.
- I. A. Mudunkotuwa and V. H. Grassian, J. Am. Chem. Soc., 2010, 132, 14986–14994 CrossRef CAS PubMed.
- S. Li, J. Zheng, Z. Hu, S. Zuo, Z. Wu, P. Yan and F. Pan, RSC Adv., 2015, 5, 72857–72862 RSC.
- X. Zhang, A. Wu, X. Wang, C. Tian, R. An and H. Fu, J. Mater. Chem. A, 2018, 6, 17905–17914 RSC.
- A. Liao, H. He, L. Tang, Y. Li, J. Zhang, J. Chen, L. Chen, C. Zhang, Y. Zhou and Z. Zou, ACS Appl. Mater. Interfaces, 2018, 10, 10141–10146 CrossRef CAS PubMed.
- H. Yan, Y. Xie, Y. Jiao, A. Wu, C. Tian, X. Zhang, L. Wang and H. Fu, Adv. Mater., 2018, 30, 1704156 CrossRef PubMed.
- H. Liang, A. N. Gandi, D. H. Anjum, X. Wang, U. Schwingenschlogl and H. N. Alshareef, Nano Lett., 2016, 16, 7718–7725 CrossRef CAS PubMed.
- K. Zhou, W. Zhou, L. Yang, J. Lu, S. Cheng, W. Mai, Z. Tang, L. Li and S. Chen, Adv. Funct. Mater., 2015, 25, 7530–7538 CrossRef.
- X. Chen, M. Cheng, D. Chen and R. Wang, ACS Appl. Mater. Interfaces, 2016, 8, 3892–3900 CrossRef CAS PubMed.
- D. He, G. Liu, A. Pang, Y. Jiang, H. Suo and C. Zhao, Dalton Trans., 2017, 46, 1857–1863 RSC.
- D. Zhang, J. Zhang, H. Wang, C. Cui, W. Jiao, J. Gao and Y. Liu, J. Alloys Compd., 2019, 806, 1419–1429 CrossRef CAS.
- V. H. Nguyen and J.-J. Shim, Mater. Chem. Phys., 2016, 176, 6–11 CrossRef CAS.
- Y. Zeng, Y. Wang, G. Huang, C. Chen, L. Huang, R. Chen and S. Wang, Chem. Commun., 2018, 54, 1465–1468 RSC.
- F. Zhang, H. Meng, W. Zhang, M. Wang, J. Li and X. Wang, Int. J. Hydrogen Energy, 2018, 43, 3203–3215 CrossRef CAS.
- Y. Lan, H. Zhao, Y. Zong, X. Li, Y. Sun, J. Feng, Y. Wang, X. Zheng and Y. Du, Nanoscale, 2018, 10, 11775–11781 RSC.
- Y. Zhu, Q. Zong, Q. Zhang, H. Yang, Q. Wang and H. Wang, Electrochim. Acta, 2019, 299, 441–450 CrossRef CAS.
- S. Agnihotri, G. Bajaj, S. Mukherji and S. Mukherji, Nanoscale, 2015, 7, 7415–7429 RSC.
- T. T. Nguyen, J. Balamurugan, N. H. Kim and J. H. Lee, J. Mater. Chem. A, 2018, 6, 8669–8681 RSC.
- W. Liu, H. Niu, J. Yang, K. Cheng, K. Ye, K. Zhu, G. Wang, D. Cao and J. Yan, Chem. Mater., 2018, 30, 1055–1068 CrossRef CAS.
- X. Wang, C. Yan, A. Sumboja and P. S. Lee, Nano Energy, 2014, 3, 119–126 CrossRef CAS.
- C. Yuan, J. Li, L. Hou, X. Zhang, L. Shen and X. W. D. Lou, Adv. Funct. Mater., 2012, 22, 4592–4597 CrossRef CAS.
- Y. Wang, S. Fan, S. Wu, C. Wang, Z. Huang and L. Zhang, ACS Appl. Mater. Interfaces, 2018, 10, 42372–42379 CrossRef CAS PubMed.
- Y. Shao, M. F. El-Kady, J. Sun, Y. Li, Q. Zhang, M. Zhu, H. Wang, B. Dunn and R. B. Kaner, Chem. Rev., 2018, 118, 9233–9280 CrossRef CAS PubMed.
- Y.-M. Hu, M.-C. Liu, Y.-X. Hu, Q.-Q. Yang, L.-B. Kong and L. Kang, Electrochim. Acta, 2016, 215, 114–125 CrossRef CAS.
- Y. Hu, M. Liu, Q. Yang, L. Kong and L. Kang, J. Energy Chem., 2017, 26, 49–55 CrossRef.
- X. Li, R. Ding, L. Yi, W. Shi, Q. Xu and E. Liu, Electrochim. Acta, 2016, 222, 1169–1175 CrossRef CAS.
- R. Ding, X. Li, W. Shi, Q. Xu and E. Liu, Chem. Eng. J., 2017, 320, 376–388 CrossRef CAS.
- K. Le, Z. Wang, F. Wang, Q. Wang, Q. Shao, V. Murugadoss, S. Wu, W. Liu, J. Liu and Q. Gao, Dalton Trans., 2019, 48, 5193–5202 RSC.
- D. Wang, L.-B. Kong, M.-C. Liu, W.-B. Zhang, Y.-C. Luo and L. Kang, J. Power Sources, 2015, 274, 1107–1113 CrossRef CAS.
- Y. Liu, Q. Lu, Z. Huang, S. Sun, B. Yu, U. Evariste, G. Jiang and J. Yao, J. Alloys Compd., 2018, 762, 301–311 CrossRef CAS.
- D. Zhao, H. Fang, A. Umar and W. Xiang, New J. Chem., 2018, 42, 7399–7406 RSC.
Footnote |
| † Electronic supplementary information (ESI) available. See DOI: 10.1039/d0ma00058b |
| This journal is © The Royal Society of Chemistry 2020 |

