 Open Access Article
Heterostructure of two different 2D materials based on MoS2 nanoflowers@rGO: an electrode material for sodium-ion capacitors†
Kiruthiga
Ramakrishnan
a,
Chandrasekaran
Nithya
 *a and
Ramasamy
Karvembu
 b
b
aDepartment of Energy and Environment, National Institute of Technology, Tiruchirappalli – 620015, India
bDepartment of Chemistry, National Institute of Technology, Tiruchirappalli – 620015, India. E-mail: nithyajcs@gmail.com
First published on 5th September 2018
Abstract
Sodium ion capacitors are under extensive investigation as companionable pre-existing lithium ion batteries and sodium ion batteries. Finding a suitable host for sodium ion storage is still a major challenge. In this context, here we report a MoS2 nanoflowers@rGO composite produced via a hydrothermal method followed by an ultra sonication process as a sodium ion symmetric hybrid supercapacitor. The structural and electrochemical performances of the electrode material were investigated to establish its applicability in sodium ion capacitors. The electrochemical performance was evaluated using metallic sodium in a half cell configuration which delivered a maximum specific capacitance of 226 F g−1 at 0.03 A g−1. When examined as a symmetric hybrid electrode (full cell) it delivered a maximum capacitance of 55 F g−1 at 0.03 A g−1. This combination may be a new gateway for upcoming research work which deals with sodium ion storage applications. The results confirmed that the as-synthesized MoS2 nanoflowers@rGO heterostructure electrode exhibited notable electrochemical behaviour.
Introduction
Currently, extensive attention has been paid to energy storage and energy conversion, as a consequence of increasingly technology dependent human lives and advancement in the world economy. Batteries and supercapacitors are significant energy storage devices for hybrid electric vehicles and portable electronics.1,2 Among these, supercapacitors store electrical energy on the basis of charge accumulation on large surface area materials, known as electrical double layer capacitors (EDLCs), or through fast redox (faradaic) reactions, where they are called pseudocapacitors. Supercapacitors based on novel electrode nanomaterials have shown remarkable progress owing to their ultrafast charge–discharge rate, long cycle life and high power density. However, significant advancements are required to improve the energy density of supercapacitors. The energy and power density of supercapacitors are mainly governed by the elementary charge storage mechanism and the resultant kinetics at the electrode/electrolyte interface. Generally, the performance of supercapacitors is basically dependent on the electrode materials.3–8As proficient energy storage devices, supercapacitors should be able to constrain active components. In contrast to batteries, supercapacitors are rich in power density but still have lower energy density than batteries.9,10 Hence, investigations are being carried out to enhance both energy and power density by combining battery and supercapacitor technologies through the smart combination of electrode materials.
Of these materials, sodium ion supercapacitors (NICs) are listed as one of the hotspots in the field of energy storage devices. The use of capacitive storage based on sodium ion systems is smart and cost-effective and they are competent substitutes for other systems.11,12 The properties of the materials used in the devices are essential for determining the performance of the supercapacitors.
Metal oxides have been extensively investigated as active materials for supercapacitors due to their high specific capacitance and ease of fabrication.13 Recently, metal nitrides, carbides and sulphides have arisen as new and promising electrode materials for high-performance supercapacitors. Among the metal sulphides, NiS, Co9S8, MoS2, WS2, and SnS2 have been considered for energy storage applications of which MoS2 may be of special interest.14–17 It has many key advantages like high theoretical capacity, good rate capability and good cyclability. Metal sulphides with structural features analogous to graphene have gained further attention recently on account of their distinctive structural, electronic, and electrochemical properties.18–22
Moreover, MoS2 can offer capacitive properties. It has a theoretical capacity higher than that of graphite and higher ionic conductivity compared to metal oxides. Hence, MoS2 could be a better choice for sodium ion storage applications. The layered structure of MoS2 has a tendency to restack due to its large surface energy correlated with weak van der Waals attraction. It can be assumed that this layered structure facilitates the appropriate insertion of foreign atoms and provides stability to the whole structure, which is beneficial for the electrochemical stability. Further, poor electrical conductivity impedes its performance in energy storage applications.23–25 This can be overcome by making composites with carbon matrixes which can offer enhanced electrical conductivity, mechanical strength and thermal stability. Herein, we have reported a sodium ion symmetric hybrid supercapacitor based on a MoS2@rGO composite.
Molybdenum disulphide has a similar structure to reduced graphene oxide, with excellent physical and electrical properties. It has emerged as an attractive candidate to be mixed with reduced graphene oxide to form a composite with improved characteristics. The combination of MoS2 with rGO is seen as a fundamental tactic for enhancing the electrochemical performance of active materials. The reduced graphene oxide will provide an efficient pathway for the diffusion of sodium ions and also firmly hold the active material during cycling. Due to its aforementioned properties, rGO can be exploited as an ideal support for graphene like MoS2. Most importantly, the rGO matrix can not only effectively enhance the conductivity and stability of the active materials but can also significantly hamper the aggregation of MoS2 sheets.26–30
Results and discussion
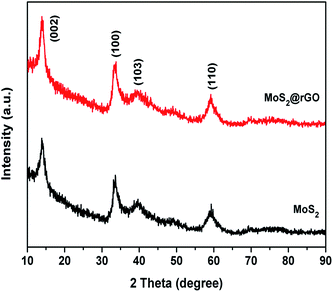
Fig. 1 shows the XRD patterns of MoS2 and the MoS2@rGO composite. The XRD pattern of MoS2 is indexed with a hexagonal structure with the space group P63/mmc (ICSD ref. no: 01-075-1539). The peaks at 14.12°, 33.60°, 39.59°, and 59.16° correspond to the (002), (100), (103) and (110) planes of MoS2, respectively. The peak at 14.03° relates to the (002) plane, confirming the hexagonal layered structure of MoS2.31 The diffraction peaks of rGO do not appear in the XRD of the MoS2@rGO composite, which confirms the lower content of rGO in the composite. The XRD pattern of rGO (as shown in Fig. S1†) consists of a broadened peak located at around 25.15°, corresponding to 002 diffraction of the graphitic layered structure as a result of GO reduction, with the shifting of the peak at 2θ = 10.56° attributable to disordered graphene layers with few structural defects.Fig. S2† depicts the thermogravimetric curves of MoS2 and the MoS2@rGO composite. The minor weight loss region around 160 °C is due to absorbed water molecules. For MoS2, the weight loss around 300 °C is mainly due to the oxidation of MoS2 into MoO3 and the remaining weight is 59.3% of the initial weight. In the composite, the weight remaining is 45.6%, which confirms that the composite contains 13.7% rGO.
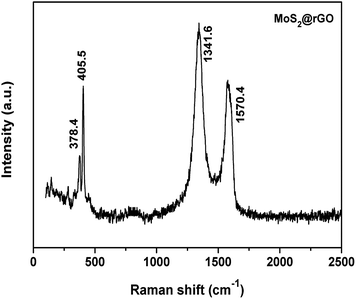
Raman spectroscopy was employed here to evaluate the existence of rGO in the composite and the hexagonal layered structure of MoS2. Fig. 2 shows the Raman spectrum of the MoS2@rGO composite. The peaks appearing at 379.4 and 405.5 cm−1 confirm the in-plane vibrational modes of the S–Mo–S bond. The energy difference between the two peaks of MoS2 can reveal the number of layers of MoS2. The obtained value of 26.1 cm−1 confirmed that the MoS2 contains few layers.32 Further, the D band (1341.6 cm−1) and the G band (1570.4 cm−1) reveal the presence of rGO in the composite. Fig. S3 (see ESI†) depicts the Raman spectrum of pure rGO. The characteristic D and G bands were observed at 1338 and 1593 cm−1, respectively. The ID/IG value of rGO is 1.13, which results in more defective graphene layers in rGO.
The morphology of the as synthesized materials was analysed using field emission scanning electron microscopy (FESEM) and high resolution transmission electron microscopy (HRTEM). The image shown in Fig. 3a reveals the sheet- or leaf-like morphology of rGO. The flower-with-petals-like morphology of bare MoS2 at two different magnifications is shown in Fig. 3b and c, which represent the uniformity of the MoS2 particles. In the composite (Fig. 3d), the MoS2 flowers are scattered and firmly held by the rGO sheets. HRTEM images of the samples are shown in Fig. 4. The image of rGO is in good agreement with the results obtained from the FESEM image. Fig. 4b and c demonstrate the uniform array of MoS2 nanoflowers at different magnifications. In the case of the composite, MoS2 creases with the rGO sheets (Fig. 4d).
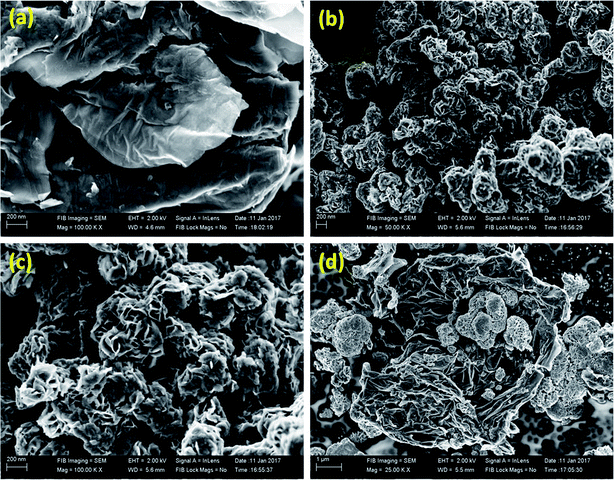 | ||
| Fig. 3 FESEM images of (a) rGO, (b & c) MoS2 at different magnifications and (d) MoS2@rGO composite. | ||
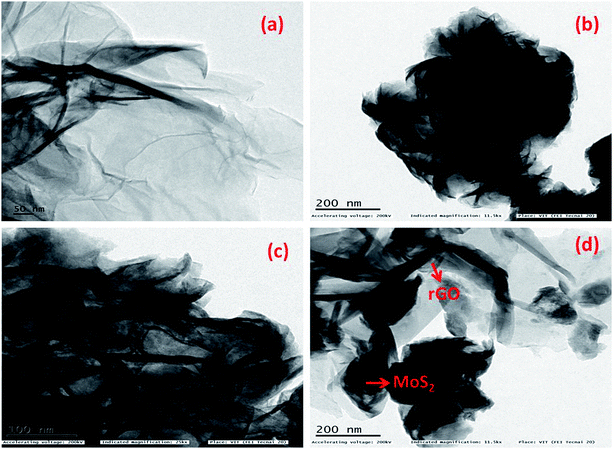 | ||
| Fig. 4 HRTEM images of (a) rGO, (b & c) MoS2 at different magnifications and (d) MoS2@rGO composite. | ||
In order to evaluate the sodium ion storage properties of MoS2 nanoflowers@rGO, half cell studies were carried out between potential limits of 0.01 and 2.6 V at different current densities. The electrochemical performance of the half cell is shown in Fig. 5. The charge storage is accomplished by faradaic reaction of the MoS2 nanoflowers. The charge–discharge profile of the MoS2@rGO composite is shown in Fig. 5a. The distorted linear (or) sloping curve is evidence for the pseudocapacitive behavior of the composite electrode. Furthermore, the cell was examined at different current densities (Fig. 5b). While the current density increases from 0.03 to 4.02 A g−1, the specific capacitance decreases from 226 to 25 F g−1. Good capacitance retention of 78% was observed (Fig. 5c) even after 2000 cycles at a current density of 0.1 A g−1.
Fig. S4† shows the charge/discharge profiles of composites with different proportions of rGO. For comparison, MoS2@rGO composites were prepared with different weight percentages (i.e., MoS2–rGO: 80–20% and 90–10%). Of these, the composite containing 15% rGO shows good specific capacitance. The maximum attained capacitances were 142 F g−1 (for 80–20%), 226 F g−1 (for 85–15%) and 135 F g−1 (for 90–10%) at 0.03 A g−1. From these charge/discharge profiles we clearly understood that the optimized composition of rGO is 15% for obtaining better electrochemical performance.
Further cyclic voltammetry studies were carried out to investigate the pseudocapacitive behavior of a single electrode at various scan rates between the potential limits of 0.01 and 2.6 V, which are shown in Fig. 5d. The energy storage mechanism in supercapacitors is a surface phenomenon. Thus, from lower to higher scan rates, the specific capacitance value decreases and it can be found that the slight deviation of the curve at higher scan rates is due to the polarization effects which further hinder the diffusion of ions into the electrode. At lower scan rates, sufficient time is available for diffusion, leading to higher specific capacitance. Furthermore, the linear variation of current with applied scan rate is evidence for the capacitive behaviour of the composite electrode.33
Electrochemical impedance spectra of MoS2 and MoS2 nanoflowers@rGO are shown in Fig. S5.† The depressed semicircle in the high-medium frequency region and straight line in the low frequency region of the Nyquist plot is attributed to the high electrical conductivity and the fast charge transfer reaction results in the good electrochemical performance of MoS2@rGO. The straight line in the low frequency region (Warburg region) corresponds to the sodium ion diffusion process as well as the ideal capacitive behaviour of the composite electrode. The diffusion coefficient (D) value of the MoS2@rGO composite electrode was calculated using the following equation.34,35
| D = R2T2/2A2n4F4C2σ2 | (1) |
So far, many efforts have been made to apply MoS2 as an electrode in aqueous supercapacitors (as shown in Table S1†). Karade et al. prepared ultrathin MoS2 nanoflakes via a chemical bath deposition method with a capacitance of 576 F g−1 at 5 mV s−1 in 0.5 M Na2SO4.37 Ramadoss et al. reported mesoporous MoS2 with a maximum capacitance of 376 and 403 F g−1 at 1 mV s−1 in 1 M Na2SO4 and 1 M KCl, respectively.38 Ilanchezhiyan et al. synthesized MoS2 nanospheres with a specific capacitance of 122 at 5 mV s−1 in 1 M Na2SO4.39 Soon et al. achieved a maximum capacitance of 100 F g−1 at 1 mV s−1 in 0.5 M H2SO4.40 But the reports available for MoS2 in non-aqueous electrolytes for sodium ion supercapacitors are few in number. Wang et al. constructed a Na-ion pseudocapacitor with a MoS2/graphene composite which delivered a capacitance of 50 F g−1 at 1.5 C in 1 M NaClO4 (in PC + FEC) electrolyte.28 Cook et al. examined the pseudocapacitive behaviour of mesoporous MoS2 for sodium ion storage and reported a specific capacity of 118 mA h g−1 at 1 mV s−1 in a half cell configuration with 1 M NaClO4 (in PC) electrolyte and concluded that MoS2 is the ultimate candidate to host the larger alkali ions because its large van der Waals gap and nanoscale architecture can lead to charge storage via a pseudocapacitive mechanism.27 In this work we used NaPF6 (in EC + DEC) as the electrolyte and achieved a maximum capacitance of 226 F g−1 in a half cell configuration.
The electrochemical performance of pristine MoS2 (both half cell and full cell) is shown in Fig. S6.† Pristine MoS2 delivered a maximum capacitance of 119 and 24 F g−1 at 0.03 A g−1 in the half cell and the full cell configuration, respectively, with similar pseudocapacitive behaviour, which was confirmed by charge–discharge and CV studies. Further, 56% (half cell) and 23% (full cell) of the initial capacitance was observed after 2000 cycles. We also fabricated the capacitor without MoS2 nanoflowers and investigated its electrochemical performance. The charge discharge profile of rGO (full cell) is shown in Fig. S7.† In the full cell configuration, it delivered a maximum capacitance of 22 F g−1 at 0.03 A g−1.
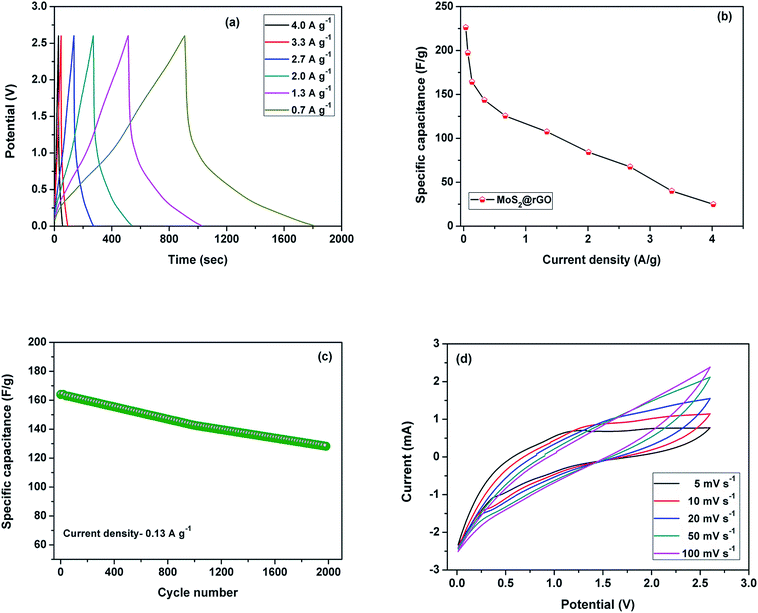
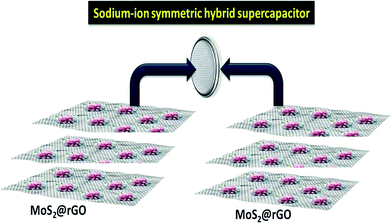
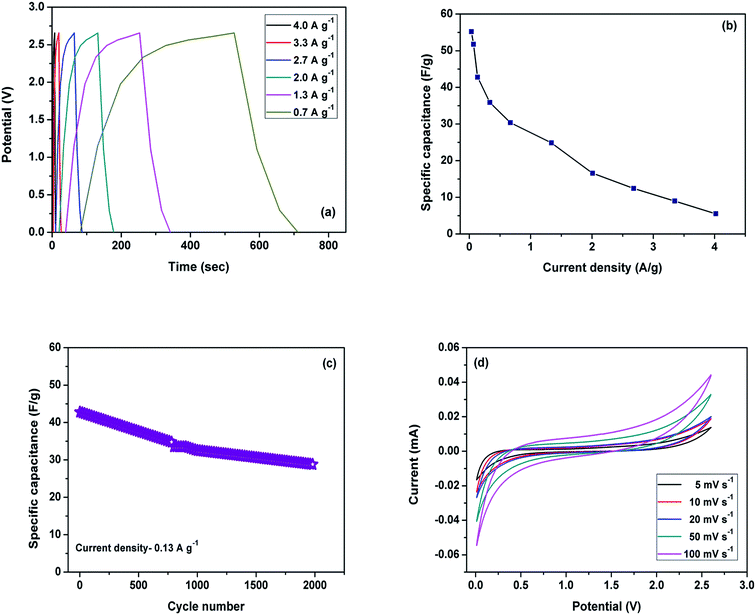
A further symmetric sodium ion capacitor (full cell configuration, Scheme 1) was fabricated in which two identical electrodes were used (MoS2 nanoflowers@rGO composite). Galvanostatic charge–discharge measurements were carried out at various current densities as a function of time vs. voltage (Fig. 6a). The maximum specific capacitance achieved at a current density of 0.03 A g−1 was 55 F g−1, which decreased to only 6 F g−1, even at a high current density of 4.02 A g−1. A full cell has different electrochemical behaviour compared to that of a half cell. The reason may be attributed to the limited supply of reversible sodium in the case of the full cell. The initial coulombic efficiency of the full cell was 79%. The low coulombic efficiency may be assigned to the formation of a solid electrolyte interface during the initial charge–discharge process and may also be due to an irreversible intercalation reaction during the initial charge–discharge cycle.28 For comparison, the symmetric sodium ion capacitors were assembled using rGO, pristine MoS2 and MoS2@rGO electrodes and delivered specific capacitances of 22, 24 and 55 F g−1, respectively, at a current density of 0.03 A g−1. The enhancement of the electrochemical performance of the MoS2@rGO composite when compared to pristine MoS2 is mainly due to the rGO network, which serves as a conductive matrix as well as contributing some capacity, which leads to the good electrochemical performance of the composite.
The specific capacitances at different applied current densities is plotted in Fig. 6b. The cycling stability of the electrode was evaluated at a current density of 0.1 A g−1. After 2000 cycles, it retained 67% of the initial capacitance (Fig. 6c). Even after prolonged cycling, the flower-like morphology has been retained with some disorder, which may be due to the PVDF binder and conductive carbon used for the coating process, which was confirmed by HRTEM analysis (as shown in Fig. S8a & b†). The performance of the full cell was evaluated using CV studies at different scan rates, as shown in Fig. 6d. The CV curves were recorded at various scan rates (5–100 mV s−1) in a potential window of 0.01 to 2.6 V. The CV curves are rectangular and identical in shape, indicating ideal capacitive characteristics and implying good reversibility of the electrode. The sodium ion symmetric hybrid supercapacitor consisting of the MoS2@rGO composite delivers a maximum energy density of 52 W h kg−1 and power density of 60 W kg−1 at 0.03 A g−1. The prominent electrochemical performance of the MoS2@rGO composite in both the half cell and full cell configurations is mainly attributed to the rGO network, which can reduce the diffusion path length and boost ion transfer during the electrochemical reaction. Further, it induces the interfacial contact between the active particles, the electronic conductivity and the mechanical strength to hold the MoS2 particles. Additionally, the structure of the MoS2 nanoflower may provide easy access for electrolyte ions.
Experimental
Synthesis of MoS2, rGO and the MoS2@rGO nanocomposite
MoS2 was synthesized using a hydrothermal method in which ammonium heptamolybdate and thiourea (mass ratio = 3![[thin space (1/6-em)]](https://www.rsc.org/images/entities/char_2009.gif) :
:![[thin space (1/6-em)]](https://www.rsc.org/images/entities/char_2009.gif) 4) were dissolved separately in double distilled water.41 Then, both the solutions were mixed to form a homogeneous mixture under stirring. Afterwards, the mixture was sonicated for 2 h and transferred to a 200 ml Teflon-lined autoclave and heated at 180 °C for 28 h. The obtained black suspension was filtered and washed several times with water and dried in a hot air oven.
4) were dissolved separately in double distilled water.41 Then, both the solutions were mixed to form a homogeneous mixture under stirring. Afterwards, the mixture was sonicated for 2 h and transferred to a 200 ml Teflon-lined autoclave and heated at 180 °C for 28 h. The obtained black suspension was filtered and washed several times with water and dried in a hot air oven.
Graphene oxide (GO) was synthesized using a modified Hummers method.42,43 Reduced graphene oxide (rGO) was prepared by reduction of graphene oxide. In this process, the synthesized GO was dispersed in double distilled water and sonicated for 2 h. Then, sodium borohydride (NaBH4) was added to it under sonication. After the addition of NaBH4, it was stirred vigorously for 8 h. The precipitate that formed was filtered, dried at 60 °C for 48 h and ground well.
The molybdenum disulphide–reduced graphene oxide composite (MoS2@rGO) was synthesized in a ratio of 85![[thin space (1/6-em)]](https://www.rsc.org/images/entities/char_2009.gif) :
:![[thin space (1/6-em)]](https://www.rsc.org/images/entities/char_2009.gif) 15 from as synthesized MoS2 and rGO. 0.15 g of rGO was dispersed in DI water under sonication for 1 h. 0.85 g of MoS2 powder was added and allowed to sonicate for about 2 h. Further to this, the mixture was stirred for 24 h and the resulting black solid was separated by filtration and washed with DI water followed by ethanol to remove most residual ions. Finally it was dried at 80 °C for 24 h, and then the product was obtained as a fine powder after grinding. For comparison, composites with different compositions (80
15 from as synthesized MoS2 and rGO. 0.15 g of rGO was dispersed in DI water under sonication for 1 h. 0.85 g of MoS2 powder was added and allowed to sonicate for about 2 h. Further to this, the mixture was stirred for 24 h and the resulting black solid was separated by filtration and washed with DI water followed by ethanol to remove most residual ions. Finally it was dried at 80 °C for 24 h, and then the product was obtained as a fine powder after grinding. For comparison, composites with different compositions (80![[thin space (1/6-em)]](https://www.rsc.org/images/entities/char_2009.gif) :
:![[thin space (1/6-em)]](https://www.rsc.org/images/entities/char_2009.gif) 20 and 90
20 and 90![[thin space (1/6-em)]](https://www.rsc.org/images/entities/char_2009.gif) :
:![[thin space (1/6-em)]](https://www.rsc.org/images/entities/char_2009.gif) 10) were also prepared using the same procedure.
10) were also prepared using the same procedure.
Structural characterization
The crystal structure of the material was evaluated using an X-ray diffractometer (XRD, Bruker D8) with Cu Kα radiation (λ = 1.5406 Å), employing an operating voltage of 40 kV and a current of 20 mA between 10 and 90° at a scan rate of 2° min−1. Thermogravimetric analysis was conducted (PerkinElemer/TGA4000) from room temperature to 900 °C at a heating rate of 20 °C min−1 in an air atmosphere to obtain the proportion of rGO present in the composite. Morphology and particle size were characterized using a Field Emission Scanning Electron Microscope (FESEM, CARL ZEISS-Neon 40 microscope) and a High Resolution Transmission Electron Microscope (TEM, FEI Technai-20 G2 microscope). The Raman spectra of the samples were recorded at room temperature on a Renishaw InVia laser Raman microscope with a He–Ne laser (λ = 633 nm).Electrochemical characterization
The electrochemical behaviour of the synthesized material was analyzed using CR2032 coin type cells. The composite electrode was prepared by mixing 80 wt% active material with 10 wt% super P carbon (conductivity additive) and a 10 wt% PVDF (polyvinylidene fluoride) binder in NMP (N-methyl pyrrolidone) solvent. The obtained slurry was coated on Cu foil and used as a working electrode. The mass loadings of the active material for MoS2 and MoS2@rGO were 1.17 and 1.49 mg cm−2, respectively. In the half cell configuration, sodium metal was used as a reference electrode. The electrolyte used was 0.75 M NaPF6 in EC![[thin space (1/6-em)]](https://www.rsc.org/images/entities/char_2009.gif) :
:![[thin space (1/6-em)]](https://www.rsc.org/images/entities/char_2009.gif) DEC (1
DEC (1![[thin space (1/6-em)]](https://www.rsc.org/images/entities/char_2009.gif) :
:![[thin space (1/6-em)]](https://www.rsc.org/images/entities/char_2009.gif) 1 v/v) mixture. The electrodes were separated by a polypropylene membrane (separator). Coin cells were assembled in an argon-filled glove box with an oxygen and water content of less than 1 ppm. To construct a symmetrical MoS2@rGO based sodium ion capacitor, both sides used the same electrodes. The cyclic voltammograms were recorded using a Bio-Logic instrument (SP-240) with different scan rates from 5–100 mV s−1 and electrochemical impedance spectra were measured using a Bio-Logic instrument (SP-250) in the frequency range between 100 kHz and 5 mHz. The cells were galvanostatically cycled using a battery tester (NEWARE) between 0.01 and 2.6 V. The specific capacitance of the single electrode was calculated according to the following equation.
1 v/v) mixture. The electrodes were separated by a polypropylene membrane (separator). Coin cells were assembled in an argon-filled glove box with an oxygen and water content of less than 1 ppm. To construct a symmetrical MoS2@rGO based sodium ion capacitor, both sides used the same electrodes. The cyclic voltammograms were recorded using a Bio-Logic instrument (SP-240) with different scan rates from 5–100 mV s−1 and electrochemical impedance spectra were measured using a Bio-Logic instrument (SP-250) in the frequency range between 100 kHz and 5 mHz. The cells were galvanostatically cycled using a battery tester (NEWARE) between 0.01 and 2.6 V. The specific capacitance of the single electrode was calculated according to the following equation.| C = 4IΔt/mΔV | (2) |
| E = (1/2)C(ΔV)2 | (3) |
| P = E/t | (4) |
Conclusions
In summary, a MoS2 nanoflower@rGO composite has been prepared using a simple and scalable hydrothermal method followed by an ultra sonication process. The better electrochemical performance of MoS2 nanoflower@rGO is mainly owing to the sodium ion storage via the pseudocapacitive nature of MoS2 and also the structural integrity, strong mechanical support and conductive pathway provided by the rGO network. MoS2 nanoflowers@rGO delivers good electrochemical performance in terms of specific capacitance with various current densities and long-term cycling stability in half cell as well as in full cell configurations. The composite electrode delivered a maximum specific capacitance of 226 F g−1 (in the half cell) and 55 F g−1 (in the full cell) at 0.03 A g−1. The sodium ion symmetric hybrid supercapacitor device made up of MoS2 nanoflowers@rGO electrodes delivered a maximum energy density of 52 W h kg−1 and a power density of 60 W kg−1 at 0.03 A g−1. The above mentioned observations and results offer ideas regarding a new pathway for a simple, cost effective MoS2 nanoflowers@rGO composite electrode material for high performance energy storage devices which can fulfil future energy needs.Conflicts of interest
There are no conflicts to declare.Acknowledgements
We acknowledge the Department of Science and Technology (DST), India for support of this work under the DST-INSPIRE Faculty Award Project (Grant No. IFA-12-CH-42). One of the authors, Dr C. Nithya, wishes to thank the Department of Science and Technology (DST), India for the award of DST-Women Scientist.Notes and references
- M. Sevilla and R. Mokaya, Energy Environ. Sci., 2014, 7, 1250–1280 RSC.
- P. Yang and W. Mai, Nano Energy, 2014, 8, 274–290 CrossRef CAS.
- P. Simon, Y. Gogotsi and B. Dunn, Science, 2014, 343, 1210–1211 CrossRef CAS PubMed.
- B. Xu, H. Wang, Q. Zhu, N. Sun, B. Anasori, L. Hu, F. Wang, Y. Guan and Y. Gogotsi, Energy Storage Mater., 2018, 12, 128–136 CrossRef.
- M. Saraf, R. Rajak and S. M. Mobin, J. Mater. Chem. A, 2016, 4, 16432–16445 RSC.
- A. Gigot, M. Fontana, M. Serrapede, M. Castellino, S. Bianco, M. Armandi, B. Bonelli, C. F. Pirri, E. Tresso and P. Rivolo, ACS Appl. Mater. Interfaces, 2016, 8, 32842–32852 CrossRef CAS PubMed.
- E. Pomerantseva and Y. Gogotsi, Nat. Energy, 2017, 2, 1–6 Search PubMed.
- M. Saraf, K. Natarajan and S. M. Mobin, RSC Adv., 2017, 7, 309–317 RSC.
- H. Jiang, P. S. Lee and C. Li, Energy Environ. Sci., 2013, 6, 41–53 RSC.
- J. Jiang, Y. Li, J. Liu, X. Huang, C. Yuan and X. W. D. Lou, Adv. Mater., 2012, 24, 5166–5180 CrossRef CAS PubMed.
- V. Aravindan, M. Ulaganathan and S. Madhavi, J. Mater. Chem. A, 2016, 4, 7538–7548 RSC.
- Z. Chen, V. Augustyn, X. Jia, Q. Xiao, B. Dunn and Y. Lu, ACS Nano, 2012, 6, 4319–4327 CrossRef CAS PubMed.
- G. Wang, L. Zhang and J. Zhang, Chem. Soc. Rev., 2012, 41, 797–828 RSC.
- F. Clerici, M. Fontana, S. Bianco, M. Serrapede, F. Perrucci, S. Ferrero, E. Tresso and A. Lamberti, ACS Appl. Mater. Interfaces, 2016, 8, 10459–10465 CrossRef CAS PubMed.
- A. Lamberti, F. Clerici, M. Fontana and L. Scaltrito, Adv. Energy Mater., 2016, 6, 1–6 Search PubMed.
- A. Lamberti, Mater. Sci. Semicond. Process., 2018, 73, 106–110 CrossRef CAS.
- P. R. Jothi, R. R. Salunkhe, M. Pramanik, S. Kannan and Y. Yamauchi, RSC Adv., 2016, 6, 21246–21253 RSC.
- M. Saraf, K. Natarajan, A. K. Saini and S. M. Mobin, Dalton Trans., 2017, 46, 15848–15858 RSC.
- R. Zhou, C. J. Han and X. M. Wang, J. Power Sources, 2017, 352, 99–110 CrossRef CAS.
- E. G. S. Firmiano, A. C. Rabelo, C. J. Dalmaschio, A. N. Pinheiro, E. C. Pereira, W. H. Schreiner and E. R. Leite, Adv. Energy Mater., 2014, 4, 1–8 Search PubMed.
- M. Saraf, K. Natarajan and S. M. Mobin, ACS Appl. Mater. Interfaces, 2018, 10, 16588–16595 CrossRef CAS PubMed.
- Z. Chen, R. Wu, M. Liu, H. Wang, H. Xu, Y. Guo, Y. Song, F. Fang, X. Yu and D. Sun, Adv. Funct. Mater., 2017, 27(1702046), 1–13 Search PubMed.
- D. Su, S. Dou and G. Wang, Chem. Commun., 2014, 50, 4192–4195 RSC.
- B. Qu, C. Ma, G. Ji, C. Xu, J. Xu, Y. S. Meng, T. Wang and J. Y. Lee, Adv. Mater., 2014, 26, 3854–3859 CrossRef CAS PubMed.
- J. Xiao, D. Choi, L. Cosimbescu, P. Koech, J. Liu and J. P. Lemmon, Chem. Mater., 2010, 22, 4522–4524 CrossRef CAS.
- X. Wang, Y. Li, Z. Guan, Z. Wang and L. Chen, Chem.–Eur. J., 2015, 21, 6465–6468 CrossRef CAS PubMed.
- J. B. Cook, H. S. Kim, Y. Yan, J. S. Ko, S. Robbennolt, B. Dunn and S. H. Tolbert, Adv. Energy Mater., 2016, 6(1501937), 1–12 Search PubMed.
- Y. X. Wang, S. L. Chou, D. Wexler, H. K. Liu and S. X. Dou, Chem.–Eur. J., 2014, 20, 9607–9612 CrossRef CAS PubMed.
- X. Xie, Z. Ao, D. Su, J. Zhang and G. Wang, Adv. Funct. Mater., 2015, 25, 1393–1403 CrossRef CAS.
- T. S. Sahu, Q. Li, J. Wu, V. P Dravid and S. Mitra, J. Mater. Chem. A, 2017, 5, 355–363 RSC.
- P. Ramesh Kumar, Y. H. Jung and D. K. Kim, RSC Adv., 2015, 5, 79845–79851 RSC.
- X. Xiong, W. Luo, X. Hu, C. Chen, L. Qie, D. Hou and Y. Huang, Sci. Rep., 2015, 5(9254), 1–6 Search PubMed.
- R. Kumuthini, R. Ramachandran, H. A. Therese and F. Wang, J. Alloys Compd., 2017, 705, 624–630 CrossRef CAS.
- R. Kiruthiga, C. Nithya, K. P. Bindhya, N. Kumar and S. Gopukumar, ACS Sustainable Chem. Eng., 2017, 5, 5090–5098 CrossRef.
- R. Kiruthiga, C. Nithya, R. Karvembu and B. Venkata Rami Reddy, Electrochim. Acta, 2017, 256, 221–231 CrossRef.
- Y. Teng, H. Zhao, Z. Zhang, L. Zhao, Y. Zhang, Z. Li, Q. Xia, Z. Du and K. Swierczek, Carbon, 2017, 119, 91–100 CrossRef CAS.
- S. S. Karade, D. P. Dubal and B. R. Sankapal, RSC Adv., 2016, 6, 39159–39165 RSC.
- A. Ramadoss, T. Kim, G. S. Kim and S. J. Kim, New J. Chem., 2014, 38, 2379–2385 RSC.
- P. Ilanchezhiyan, G. Mohan Kumar and T. W. Kang, J.Alloys Compd., 2015, 634, 104–108 CrossRef CAS.
- J. M. Soon and K. P. Loh, Electrochem. Solid-State Lett., 2007, 10(11), A250–A254 CrossRef CAS.
- J. Li, Y. Hou, X. Gao, D. Guan, Y. Xie, J. Chen and C. Yuan, Nano Energy, 2015, 16, 10–18 CrossRef CAS.
- X. Zhu, Y. Zhu, S. Murali, M. D. Stoller and R. S. Rouff, ACS Nano, 2011, 5, 3333–3338 CrossRef CAS PubMed.
- W. S. Hummers and R. E. Offeman, J. Am. Chem. Soc., 1958, 80, 1339 CrossRef CAS.
- W. Qian, F. Sun, Y. Xu, L. Qiu, C. Liu, S. Wang and F. Yan, Energy Environ. Sci., 2014, 7, 379–386 RSC.
Footnote |
| † Electronic supplementary information (ESI) available: XRD of GO and rGO, TG curves of MoS2 and MoS2@rGO composite, Raman spectrum of rGO, charge discharge curves of MoS2@rGO composites, Nyquist plots of MoS2 and MoS2@rGO composite, electrochemical performance of pristine MoS2vs. Na/Na+ (half cell and full cell), charge discharge curve of rGO (full cell). HRTEM image and SAED pattern of MoS2@rGO composite electrode after cycling. See DOI: 10.1039/c8na00104a |
| This journal is © The Royal Society of Chemistry 2019 |

