Subsecond detection of guanosine using fast-scan cyclic voltammetry†
Michael T.
Cryan
 and
Ashley E.
Ross
 *
*
University of Cincinnati, Department of Chemistry, 312 College Dr., 404 Crosley Tower, Cincinnati, OH 45221-0172, USA. E-mail: Ashley.ross@uc.edu; Tel: +513-556-9314
First published on 23rd November 2018
Abstract
Guanosine is an important neuromodulator and neuroprotector in the brain and is involved in many pathological conditions, including ischemia and neuroinflammation. Traditional methods to detect guanosine in the brain, like HPLC, offer low limits of detection and are robust; however, subsecond detection is not possible. Here, we present a method for detecting rapid fluctuations of guanosine concentration in real-time using fast-scan cyclic voltammetry (FSCV) at carbon-fiber microelectrodes. The optimized waveform scanned from −0.4 V to 1.3 V and back at a rate of 400 V s−1 and application frequency of 10 Hz. Potential limits were chosen to increase selectivity of guanosine over the structurally similar interferent adenosine. Two oxidation peaks were detected with the optimized waveform: the primary oxidation reaction occurred at 1.3 V and the secondary oxidation at 0.8 V. Guanosine detection was stable over time with a limit of detection of 30 ± 10 nM, which permits its use to monitor low nanomolar fluctuations in the brain. To demonstrate the feasibility of the method for in-tissue detection, guanosine was exogenously applied and detected within live rat brain slices. This paper demonstrates the first characterization of guanosine using FSCV, and will be a valuable method for measuring signaling dynamics during guanosine neuromodulation and protection.
Introduction
Guanine-based purines are traditionally described as intracellular modulators in the brain. Despite their important role in G protein-dependent signal transduction, recent evidence shows that guanine-based purines can act extracellularly to modulate neurotransmission.1–3 Guanosine, a purine nucleoside and metabolite of guanosine triphosphate (GTP), has been suggested as an effective neuromodulator and neuroprotector within the central nervous system.1,4,5 Extracellular guanosine concentration rapidly increases and can remain elevated for several days following instances of injury or inflammation in the brain.6–9 Additionally, guanosine has been shown to modulate glutamate transport, an important feature in attenuating neurodegenerative conditions such as Alzheimer's disease and counteracting glutamate excitotoxicity.10 Although guanosine signaling is integral for a healthy brain, the precise mechanisms of rapid extracellular signaling are not well-understood, partly due to a lack of selective and temporally-resolved detection techniques for guanosine. Here, we present a method to selectively detect guanosine with 100 ms temporal resolution using fast-scan cyclic voltammetry.Traditionally, guanosine has been studied using techniques with slower time resolution. HPLC with or without coupling to microdialysis has remained a popular detection technique for purines due to its robustness and low nanomolar limits of detection.11–13 When coupled to microdialysis sampling, this method has the ability to separate multiple purines from complex biological matrices. Although selective, HPLC is not amenable to capturing real-time neurochemical events due to slow temporal resolution ranging in the orders of minutes to hours. In addition, microdialysis probes are often large (50–500 μm) which result in increased local tissue damage at the sampling site.14,15 Tissue damage from microdialysis probes have been shown to cause local ischemia and glial cell activation.15 An ideal sensor for measurements within the brain would be small and noninvasive with low limits of detection.
The nucleobase guanine has been previously characterized using electrochemical methods.16–18 Guanine's interaction with various carbon-based electrodes and its oxidation pathway have been well-studied using cyclic voltammetry.16 Determination of guanine in DNA samples has been achieved using adsorptive stripping voltammetry at glassy carbon electrodes.17 This method has shown both good selectivity for guanine and low limits of detection. All guanine characterization has been conducted using slower scan rates (on the order of mV s−1) which are not amenable to real-time detection required for measuring neurotransmission.
Fast-scan cyclic voltammetry (FSCV) at carbon-fiber microelectrodes is an electrochemical technique that has been used to study neurotransmission dynamics in the brain due to its millisecond time resolution.19–22 Cylindrical carbon-fiber microelectrodes are typically small, ranging from 7–10 μm in diameter, which allows for spatially-resolved detection with limited tissue damage. FSCV is most often used to study dopamine dynamics in the brain19,23–25 and in recent years, an increasing body of literature has focused on studying transient adenosine events.21,26,27 Like guanosine, adenosine is a purine nucleoside that has profound effects on the brain. Oxidation of adenosine occurs on the purine ring,21 therefore it is expected that guanosine would be easily oxidized with FSCV; yet careful optimization of the potential parameters are needed for increasing selectivity for guanosine.
Here we present an optimized method for selective detection of guanosine using FSCV at carbon-fiber microelectrodes. The potential window, scan rate, and frequency were independently optimized for sensitive and selective detection of guanosine amongst common interferents, like adenosine. We observed that guanosine has both diffusion- and adsorption-controlled interactions at the electrode. Low limits of detection were achieved and guanosine detection remained stable over time. To demonstrate the ability of our method to monitor guanosine fluctuations in the brain, guanosine was exogenously applied to live brain slices. This paper demonstrates the first optimized method for guanosine detection with 100 ms temporal resolution, establishing a future technique for monitoring endogenous release of guanosine during neurological conditions such as neuroinflammation and stroke.
Experimental methods
Chemicals
All reagents were purchased from Fisher Scientific (Fair Lawn, NJ, USA) unless otherwise noted. All aqueous solutions were made using deionized water (Milli-Q, Millipore, Billerica, MA, USA), and 10 mM stock solutions of guanosine, adenosine, guanine, GTP, ATP, and histamine were made by dissolution in 0.1 M HCl. A 10 mM solution of hydrogen peroxide was made by dissolution of 30% stock solution in Tris buffer. All solutions were stored at 4° C and diluted in Tris buffer daily to make working solutions. Tris buffer contained 15 mM Tris(hydroxymethyl)aminomethane, 1.25 mM NaH2PO4, 2.0 mM Na2SO4, 3.25 mM KCl, 140 mM NaCl, 1.2 mM CaCl2 dihydrate, and 1.2 mM MgCl2 hexahydrate at a physiological pH of 7.4. For brain tissue slice experiments, data were collected in artificial cerebrospinal fluid (aCSF) solution consisting of 2.5 mM KCl, 1.2 mM NaH2PO4, 2.4 mM CaCl2 dihydrate, 1.2 mM MgCl2 hexahydrate, 126 mM NaCl, 11 mM D-glucose, 25 mM sodium bicarbonate, and 15 mM Tris.Electrode fabrication
Carbon-fiber microelectrodes were made from 7 μm T-650 fibers (gift from Mitsubishi Chemical Carbon Fiber and Composites Inc., Sacramento, CA, USA). Fibers were aspirated into 1.2 × 0.68 mm glass capillaries (A&M Systems, Sequim, WA, USA) and pulled into two with a vertical Narishige PE-22 Electrode Puller (Tokyo, Japan). Carbon fibers were manually cut using a microscope to 50–100 μm from the glass seal. Electrodes were bathed in isopropyl alcohol for at least 10 min prior to being used and were backfilled with 1 M KCl supporting electrolyte.Fast-scan cyclic voltammetry
Voltammograms were collected using the WaveNeuro potentiostat (Pine Instruments, Durham, NC, USA). All experiments were conducted using a 5 MΩ headstage except for the scan rate experiment and low concentration interferent study, which used a 1 MΩ headstage. High-Definition Cyclic Voltammetry (HDCV) software was used to collect data (University of North Carolina-Chapel Hill, courtesy of R. Mark Wightman) with a PC1e-6363 multifunction I/O board (National Instruments, Austin, TX, USA). The waveform optimized for guanosine scanned from −0.4 V up to 1.3 V (against Ag/AgCl) and back down at a rate of 400 V s−1 and a frequency of 10 Hz. Scan rates above 400 V s−1 were filtered with a 5 kHz lowpass filter, while scan rates at and below 400 V s−1 were filtered with a 2 kHz lowpass filter. All data has been background-subtracted to eliminate non-faradaic current. Electrodes were calibrated via flow injection analysis as has been previously described28 using a Fusion 100 Two-Channel Chemyx syringe pump (Stafford, TX, USA) with a flow rate of 1 ml min−1. Injections lasting approximately 3 s were made to best mimic transient neurochemical changes.Brain slice experiment
All animal procedures were approved by the Institutional Animal Care and Use Committee (IACUC) at the University of Cincinnati and were done in accordance to The Guide for the Care and Use of Laboratory Animals (the Guide) by the National Research Council. Female C57BL/6 mice between the ages of 6–12 weeks old (Charles River Laboratories, Wilmington, MA, USA) were housed in a vivarium and given food and water ab libitum. Slices of the caudate putamen were collected as previously reported.29 Mice were anesthetized with isoflurane (Henry Shrein, Melville, NY, USA) and euthanized by decapitation on the day of the experiment. The brain was removed and placed in ice-cold oxygenated (95% O2 and 5% CO2) aCSF for approximately 2 min. To slice, the brain was mounted onto the stage using glue, and 400 μm thick coronal slices of the caudate putamen were prepared using a Leica VT1000 S vibratome (Chicago, IL, USA). The vibratome was set to a speed of 90 and frequency of 3. Slices were kept in oxygenated aCSF maintained at 37° C for approximately 1 hour prior to the experiment.For the experiment, slices were placed in a temperature-controlled Warner Instruments chamber set to 37° C. Slices were perfused with oxygenated aCSF at a rate of 2 ml min−1 using a Watson-Marlow 205S peristaltic pump (Wilmington, MA, USA). The carbon-fiber microelectrode was placed on the tissue and lowered 75 μm using a micromanipulator (Narishige). The electrode was allowed to equilibrate for 20 min prior to exogenous application. A Parker Hannifin Picospritzer III (Hollis, NH, USA) was used to deliver 50 μM guanosine to the tissue 100 μm away from the electrode by a pulled glass capillary with a 15–20 μm opening. Pressure was set to 10 psi, with 800 ms ejections. Guanosine was delivered to a total of 6 separate slices (2 mice) and successfully detected in all 6.
Statistics
All stats were conducted with GraphPad Prism v. 7.0 (GraphPad Software Inc., La Jolla, CA, USA). Statistical p-values were significant at 95% confidence level (p < 0.05). Values are reported as the mean ± standard error of the mean (SEM), with n representing the sample size in terms of electrodes or brain slices.Results and discussion
Guanosine detection using FSCV
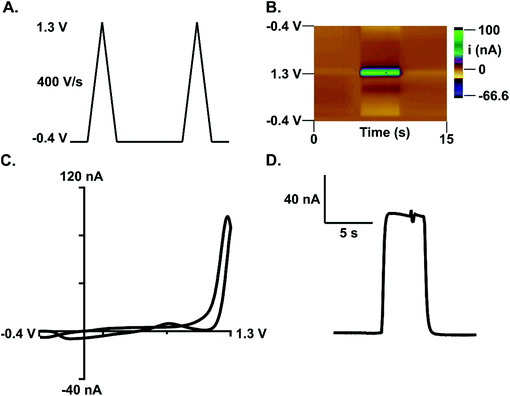
Subsecond detection of guanosine was optimized using fast-scan cyclic voltammetry (FSCV) at carbon-fiber microelectrodes. With FSCV, a triangular waveform is applied to a carbon-fiber microelectrode at rapid scan rates to induce both analyte oxidation and reduction. For guanosine detection, the electrode was scanned from −0.4 V (holding potential) to 1.3 V (switching potential) vs. a Ag/AgCl reference electrode. The waveform was applied at 400 V s−1 every 100 ms (Fig. 1A). A primary oxidation peak at the switching potential (1.3 V) and a secondary oxidation peak (0.8 V) were observed (Fig. 1B and C). Similar to adenosine detection with FSCV,21 guanosine's primary peak occurs on the back scan at this waveform. However, extending the switching potential to 1.45 V shifts the oxidative peak for guanosine to the forward scan. Peak shifting to the back scan at a shorter potential window at the same scan rate indicates that guanosine exhibits slow electron transfer kinetics. All subsequent analysis was done on the primary oxidation peak. The current vs. time trace for guanosine indicates a rapid increase in current when the analyte is introduced at the electrode followed by a rapid return to baseline after analyte removal (Fig. 1D). This data shows successful oxidation of guanosine which provides insight into its oxidation mechanism.Guanosine oxidation scheme
Oxidation of guanosine occurs on the guanine moiety. Guanine oxidation has previously been investigated at carbon-based electrodes using voltammetry.16,18 This reaction involves two two-electron oxidations which give rise to the two peaks observed on the cyclic voltammogram (Fig. 1C and Scheme 1). The first oxidation step (−2e−, −2H+) forms 8-oxoguanosine (Fig. 1C, 1.3 V); this initial step is rate-determining within the overall reaction and has previously shown a dependence on scan rate.16,18 A radical species has been shown to form following the first electron transfer, and this species may dimerize and be detected at higher potentials;16 however, this reaction was only observed at very high concentrations of guanosine. Once formed, 8-oxoguanosine can then undergo a reversible two-electron oxidation to form product II (Fig. 1C, 0.8 V, Scheme 1). No reduction peak was observed at the applied potentials. Formation of the second product occurs at 0.8 V, and is highly favored.16 Peak positions are shifted to more positive potentials than what has been previously reported, which is likely due to the faster scan rates. The timing of the oxidation steps are confirmed by the peak positions on the color plot and associated cyclic voltammograms (Fig. S1†). Only the primary peak is visible immediately after the analyte is introduced to the electrode at approximately 5 s (Fig. S1B†). The secondary peak, which is absent on the initial cyclic voltammogram, is visible shortly after the 8-oxoguanosine is oxidized (Fig. S1C†). The oxidation scheme proposed in this work matches the previous literature for guanine oxidation16,18 and is similar to what is observed for adenosine using FSCV.21Waveform optimization and characterization
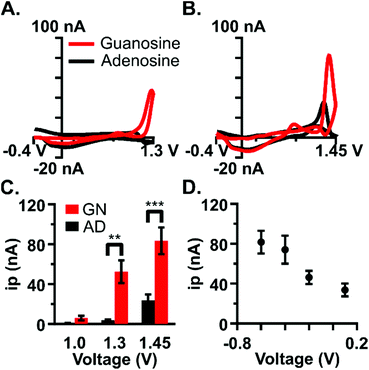
Waveform parameters were independently optimized to maximize the current at the analysis peak (1.3 V) and establish selectivity for guanosine over adenosine. Adenosine is similar in structure and function to guanosine, serving a comparable role in the brain as a neuromodulator and neuroprotector.21 Adenosine is released during instances of metabolic stress and brain injury events such as ischemia, excitotoxicity, substance-induced toxicity, and trauma30 and evidence suggests that adenosine and guanosine may work together to modulate neurotransmission.31–33 Previous work has been done to characterize adenosine detection using FSCV and to detect rapid fluctuations of adenosine in the brain.21,26,27,34 Due to the similarity in structure and function between the two purine nucleosides, a key component of this study was to establish a novel waveform selective for guanosine while minimizing current due to adenosine.The upper limit of the potential window, the switching potential, was specifically optimized to both maximize the faradaic current and establish selectivity for guanosine. Primary peak current increased as a function of the switching potential for both purines (Fig. 2C, n = 5). Guanine's primary oxidation peak occurs at 0.8 V using slow-scan cyclic voltammetry;17 however, with FSCV, a negligible amount of current was obtained at a 1.0 V switching potential likely due to the faster scan rates. As expected, adenosine oxidation did not occur using the 1.0 V switching potential. Current values were shown to be dependent on switching potential and analyte (two-way ANOVA, p < 0.0005, F = 7.137 with Bonferroni post-test). Significantly more current was generated for guanosine than for adenosine at 1.3 V (Fig. 2A and C, two-way ANOVA, p < 0.0023 with Bonferroni post-test) likely because the adenine moiety has an oxidation potential of 1.2 V using slow-scan voltammetry and is shifted to higher potentials at the faster scan rates. Cyclic voltammograms show minimal current for adenosine at 1.3 V (Fig. 2A); however, both purines readily oxidize at 1.45 V. Adenosine detection with FSCV is most often at a 1.45 or 1.5 V switching potential.21,26 Therefore, the 1.3 V switching potential was chosen as optimal to minimize interference from adenosine. This voltage is low enough to avoid the oxidation of adenosine that is seen at 1.45 V and significantly eliminates the signal coalescence that appears at higher potentials (Fig. 2B). Overall, carbon-fiber microelectrodes were 12-fold more selective to guanosine than for adenosine at the 1.3 V switching potential, and 3-fold more selective at 1.45 V. The selectivity enhancement at 1.3 V supported its use as the switching potential for the optimized waveform.
The lower portion of the potential window, the holding potential, facilitates the preconcentration of analyte onto the electrode. This potential was optimized for guanosine detection given its important role in preconcentration. As expected, an increase in the holding potential resulted in a decrease in peak current (Fig. 2D, n = 5). The optimal holding potential was chosen as −0.4 V because substantial current is detected using this voltage and there was no significant difference in current between −0.6 V and −0.4 V (paired t-test, p = 0.1810).
The applied scan rate can provide insight into how the analyte is interacting with the surface of the microelectrode. The Randles–Sevcik equation postulates that diffusion-controlled analytes will exhibit a linear rise in current with respect to the square root of the scan rate, while adsorption-controlled analytes show a linearity in current with respect to the scan rate. Six experimental scan rates were tested, ranging from 50 to 800 V s−1, and the diffusion- and adsorption-controlled plots were graphed (n = 4). The current vs. square root of the scan rate plot provided a higher r2 value (Fig. 3A and Fig. S2†), suggesting diffusion-controlled kinetics. Scan rate optimization requires a compromise between temporal resolution and shifts in peak positions that occur at higher scan rates; therefore, the scan rate for guanosine remained at 400 V s−1, which is the traditional scan rate used in FSCV.
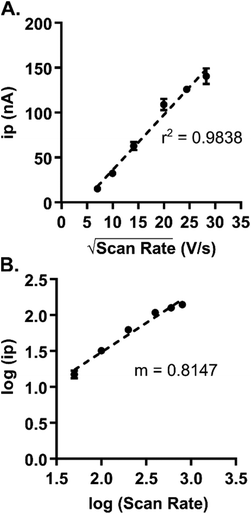 | ||
| Fig. 3 Varying the scan rate provides insight into guanosine's interaction with the microelectrode. (A) Current increases as a function of the square root of scan rate. The r2 value for this plot was higher than that for the current vs. scan rate plot (Fig. S2†), which predicts that guanosine is diffusion-controlled. (B) A log–log plot of current vs. scan rate had a slope of 0.8147, which indicates that actually a combination of diffusion- and adsorption-controlled processes likely occur at the microelectrode. (n = 4). | ||
Interactions at the electrode surface are often complicated and not easily interpretable. Previous literature has suggested that the guanine moiety can be adsorption-controlled at unmodified carbon-based electrodes.16 To investigate the extent to which guanosine adsorbs, an additional analysis plotting the log of current vs. the log of the scan rate was used to evaluate if a combination of adsorption and diffusion was occurring. Slope of this plot, rather than linearity, gives insight into the kinetics. Diffusion-controlled interactions result in slopes of 0.5, whereas a slope of 1.0 describes an adsorption-controlled process. A slope in between indicates a combination of these interactions at the electrode. The experimental slope value of the log–log plot was 0.8147, which suggests a combination of both interactions, supporting previous studies conducted for guanine at carbon-based electrode surfaces.16
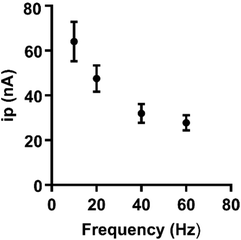
The frequency of waveform application affects the time for preconcentration of the analyte at the electrode surface. Purely diffusion-controlled analytes are not significantly affected by the application frequency;19 however, analytes which depend on adsorption to the electrode are. To assess the extent to which frequency affects the peak oxidative current, frequency was varied from 10 to 60 Hz (Fig. 4, n = 5). Peak oxidative current decreased as a function of frequency for guanosine, which supports that adsorption of guanosine at the electrode is indeed occurring. To minimize any loss in sensitivity, 10 Hz was chosen as an optimal frequency. Overall, the optimized waveform for guanosine starts at a −0.4 V holding potential, ramps to 1.3 V, and comes back down at a rate of 400 V s−1 and a frequency of 10 Hz. Both sensitivity and stability of guanosine detection were assessed at this waveform.
Sensitivity of guanosine detection
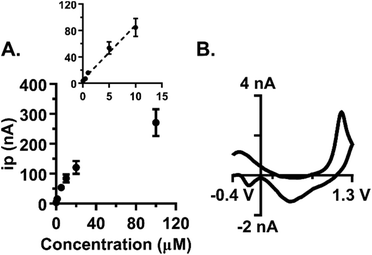
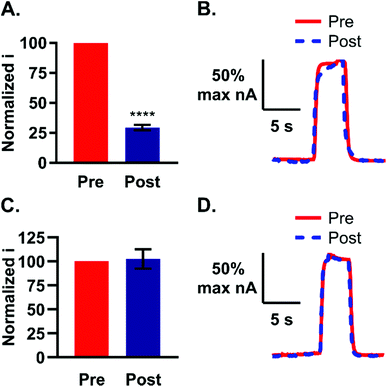
Low nanomolar limits of detection (LOD) are needed for sensing neurochemical changes in the brain. The LOD for guanosine at the optimized waveform was determined by examining the peak oxidative current as a function of concentration in the range of 50 nM to 100 μM (Fig. 5A, n = 7). The linear region of the plot was then isolated by excluding the 20 and 100 μM samples from the analysis (Fig. 5A, inset, r2 = 0.98). The LOD was calculated as three times the noise and was 30 ± 10 nM (n = 7). The slope of the line defines the sensitivity and was 8.3 nA μM−1. At a concentration of 50 nM, the primary oxidation peak for guanosine is clearly visible on the cyclic voltammogram (Fig. 5B). Basal levels are region-dependent and can range between 13–240 nM, with substantial increases following an insult to the brain.13,35–37 Our method offers limits of detection within this range, which permits its use to monitor guanosine fluctuations in the brain.Polymerization at the electrode surface can be detrimental to electrode sensitivity.16,20 Li et al. previously showed that guanosine can oligomerize upon formation of a one-electron radical during oxidation.16 Although formation of a polymer on the electrode was not evident after quick (5 s) exposures to guanosine, we tested the extent to which both non-physiological and physiological levels of guanosine would foul the electrode after prolonged cyclization. To test the effect of high concentrations: electrodes were pretested with 5 μM guanosine, followed by soaking in 100 μM guanosine for 10 min with waveform application (n = 4). The electrode was immediately post-tested with 5 μM guanosine after cyclization. Oxidative peak current was normalized to the pre-test current and on average, the post-test current was 29 ± 4.0% of the pre-test current (Fig. 6A). The resulting 71% reduction in peak current was significant (paired t-test, p < 0.0001). Reduction in current indicates the formation of a polymer layer on the surface of the electrode at high concentrations. In addition, the current vs. time traces before and after cyclization in 100 μM guanosine showed a slowed temporal response which indicates that a thick layer has formed on the electrode during polymerization (Fig. 6B).
To test the extent to which guanosine could polymerize in vivo, physiologically-relevant concentrations were tested over a longer length of time. For this experiment, electrodes were pretested with 5 μM guanosine followed by cyclization in 100 nM guanosine for 1 h and immediately post-tested with the same concentration. The post-test current was normalized to the pre-test and plotted as before (Fig. 6C, n = 3). No significant decrease in guanosine detection after 1 h cyclization at low concentrations was observed (Fig. 6C, p > 0.05). In addition, the pre- and post-test current vs. time profiles showed no indication of a slowed electrode response (Fig. 6D), as was the case with the higher concentration (Fig. 6B). Low, basal levels of guanosine in the brain are thus not expected to foul the electrode during longer sampling times.
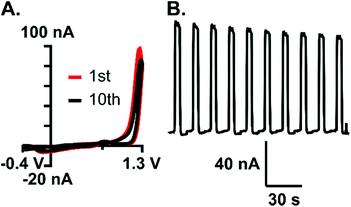
Stability and selectivity
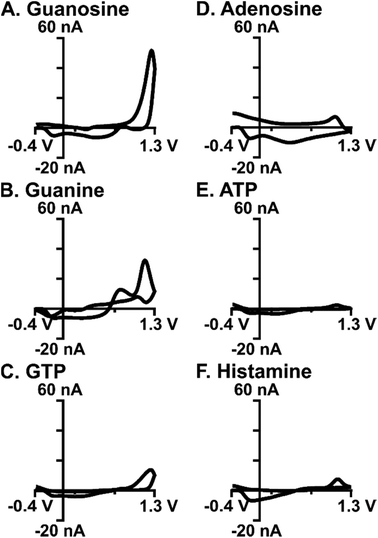
The stability of analyte detection is important for measuring rapid fluctuations in the brain with accuracy. To assess stability to rapid fluctuations in guanosine, each electrode (n = 4) was subjected to 10 sequential boluses of guanosine with no wait time in between, similar to experiments done before for both adenosine and melatonin.20,21 An example CV and current vs. time trace for 10 repeated injections showed minimal degradation in peak current (Fig. 7). The relative standard deviation (RSD) was calculated for each electrode, with an average RSD of 8.8%, indicating good reproducibility. This experiment proved that rapid fluctuations of guanosine could be detected with minimal loss in sensitivity. This finding also supports that significant polymerization isn't occurring at low concentrations, which would lead to a rapid loss in stability.Selective detection of guanosine amongst common interferents is important for confident recording within a complex matrix like the brain. Cyclic voltammograms for common biological interferents, including adenosine, guanine, GTP, ATP, histamine (Fig. 8A–F), and hydrogen peroxide (Fig. S3†), were evaluated using the optimized waveform. A key component of this study was to minimize current due to adenosine, which was accomplished using the 1.3 V switching potential (Fig. 2A); as such, the current for adenosine was negligible on the cyclic voltammogram and on average, was 12-fold less (Fig. 8D, n = 10). Oxidation occurs on the nucleobase for both guanosine and guanine; however, primary oxidation occurs at 1.3 V for guanosine and 1.0 V for guanine (Fig. 8B). This difference in oxidation peak potentials allows for some separation within a mixture (Fig. S4†). The two phosphorylated molecules, ATP and GTP, did not produce substantial current using the optimized waveform due to the presence of negatively-charged phosphate groups. Phosphates create an unfavorable electrostatic environment for electrode interaction, given that the majority of time during the waveform is spent at a negative potential (Fig. 8C and E). On average, the current for ATP and GTP were 18-fold and 4-fold less, respectively (n = 3). Histamine is an electroactive neurotransmitter that readily oxidizes at the switching potential; however, minimal current is observed when only scanned to 1.3 V (Fig. 8F) and on average, was 6-fold less than guanosine (n = 3). Hydrogen peroxide is a reactive oxygen species believed to modulate dopaminergic neurotransmission, with a primary oxidation at 1.2 V.38 Although this voltage falls within the potential window used here, the unmodified carbon-fiber microelectrodes were, on average, 3-fold more selective for guanosine (Fig. S3,†n = 3).
Selectivity was maintained at physiologically-relevant concentrations. To validate that interferences could be distinguished at physiologically-relevant concentrations, each analyte was tested at low nanomolar concentrations. All analytes were tested at 300 nM (Fig. S5†), except for hydrogen peroxide which was tested at 1.5 μM (Fig. S3†) to better mimic physiological levels. Results were comparable to high concentrations, with the waveform being most selective for guanosine. The purines adenosine and ATP were undetectable at this waveform at physiological levels. Overall, this waveform is better for detecting guanosine than other purines and neurochemicals which oxidize at the switching potential.
Guanosine detection in brain slices
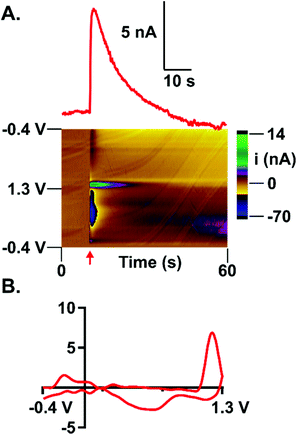
Guanosine release into the extracellular space is thought to help modulate neurosignaling to maintain homeostasis and mediate excitotoxicity during acute and chronic insults to the brain.1,2,4,5,10,37 Rapid release of guanosine from astrocytes following ischemia and hypoxia has been shown to accumulate at significantly higher levels than adenosine, providing evidence that guanosine is as important, if not more, than adenosine as a neuroprotector during cerebral events.3 Exogenous local application of analyte using a micropipette near the electrode is a common tool for method validation in brain tissue and can be used to mimic transient release.20,22,29 Exogenous guanosine was locally applied at the electrode to mimic transient guanosine release and to demonstrate the feasibility of our method to detect guanosine within the complex matrix of the brain (Fig. 9, for experimental setup see Fig. S6†). A picospritzing pipette back-filled with 50 μM guanosine was positioned approximately 100 μm from the carbon-fiber microelectrode in a murine slice of the caudate putamen. Large concentrations are needed due to diffusional loss.39 Guanosine was successfully detected in 6 out of 6 slices and all showed a rapid decay in current after exogenous application (Fig. 9A). A rapid return to baseline is indicative of reuptake into the cell with minor influences from diffusion. Guanosine has been shown to interact with equilibrative nucleoside transporters (ENTs) which are present in the caudate putamen and are likely the cause of the rapid reuptake.40–42 Further studies are needed to quantify the kinetics of guanosine transport within this region. Overall, we show the first optimized method for real-time detection of guanosine in the brain, which can be applied to study guanosine signaling dynamics in both healthy tissue and during pathological events.Conclusion
Guanosine's role in neuromodulation, neuroprotection, and nociception has become popular recently, garnering attention as a potential therapeutic target. In this work, we developed a method to measure fluctuations in guanosine concentration in real-time using fast-scan cyclic voltammetry at carbon-fiber microelectrodes. The waveform presented here is selective for guanosine over other neurochemicals including adenosine, the other purinergic nucleoside. Low nanomolar limits of detection were achieved, which provides evidence for the utility of this method for in vivo detection. Guanosine was exogenously applied to the caudate putamen, and evidence of rapid reuptake was observed. Guanosine interacts with adenosine receptors in the brain, and no known guanosine receptor exists. Further investigations into the mechanisms of release could provide evidence for a potential guanosine receptor. Guanosine detection with FSCV will allow real-time measurements of rapid fluctuations during both healthy and diseased states.Conflicts of interest
There are no conflicts of interest to declare.Acknowledgements
The authors would like to thank the Department of Chemistry at the University of Cincinnati for supporting this work.References
- V. Di Liberto, G. Mudò, R. Garozzo, M. Frinchi, V. Fernandez-Dueñas, P. Di Iorio, R. Ciccarelli, F. Caciagli, D. F. Condorelli, F. Ciruela and N. Belluardo, Front. Pharmacol., 2016, 7, 158 CrossRef PubMed.
- M. P. Rathbone, P. J. Middlemiss, J. W. Gysbers, C. Andrew, M. A. R. Herman, J. K. Reed, R. Ciccarelli, P. Di Iorio and F. Caciagli, Prog. Neurobiol., 1999, 59, 663–690 CrossRef CAS PubMed.
- R. Ciccarelli, P. D. Iorio, P. Giuliani, I. D'Alimonte, P. Ballerini, F. Caciagli and M. P. Rathbone, Glia, 1999, 25, 93–98 CrossRef CAS PubMed.
- L. E. B. Bettio, J. Gil-Mohapel and A. L. S. Rodrigues, Purinergic Signalling, 2016, 12, 411–426 CrossRef CAS PubMed.
- D. Lanznaster, T. Dal-Cim, T. Piermartiri and C. Tasca, Aging Dis., 2016, 7, 657–679 CrossRef PubMed.
- G. Hansel, A. C. Tonon, F. L. Guella, L. F. Pettenuzzo, T. Duarte, M. M. M. F. Duarte, J. P. Oses, M. Achaval and D. O. Souza, Mol. Neurobiol., 2015, 52, 1791–1803 CrossRef CAS PubMed.
- B. Bellaver, D. G. Souza, L. D. Bobermin, C.-A. Gonçalves, D. O. Souza and A. Quincozes-Santos, Purinergic Signalling, 2015, 11, 571–580 CrossRef CAS PubMed.
- R. Chang, A. Algird, C. Bau, M. P. Rathbone and S. Jiang, Neurosci. Lett., 2008, 431, 101–105 CrossRef CAS PubMed.
- T. Dal-Cim, F. K. Ludka, W. C. Martins, C. Reginato, E. Parada, J. Egea, M. G. López and C. I. Tasca, J. Neurochem., 2013, 126, 437–450 CrossRef CAS PubMed.
- M. E. dos S. Frizzo, D. R. Lara, A. de S. Prokopiuk, C. R. Vargas, C. G. Salbego, M. Wajner and D. O. Souza, Cell. Mol. Neurobiol., 2002, 22, 353–363 CrossRef CAS PubMed.
- H. Kazoka, J. Chromatogr. Sci., 2001, 39, 265–268 CAS.
- A. Maria Ghe, G. Chiavari and C. Bergamini, Talanta, 1988, 35, 911–913 CrossRef CAS PubMed.
- Á. Dobolyi, A. Reichart, T. Szikra, G. Nyitrai, K. A. Kékesi and G. Juhász, Neurochem. Int., 2000, 37, 71–79 CrossRef PubMed.
- Y. Wang and A. C. Michael, J. Neurosci. Methods, 2012, 208, 34–39 CrossRef CAS PubMed.
- A. Jaquins-Gerstl and A. C. Michael, J. Neurosci. Methods, 2009, 183, 127–135 CrossRef PubMed.
- Q. Li, C. Batchelor-McAuley and R. Compton, J. Phys. Chem. B, 2010, 114, 7423–7428 CrossRef CAS PubMed.
- H.-S. Wang, H.-X. Ju and H.-Y. Chen, Anal. Chim. Acta, 2002, 461, 243–250 CrossRef CAS.
- Z. Wang, S. Xiao and Y. Chen, J. Electroanal. Chem., 2006, 589, 237–242 CrossRef CAS.
- B. D. Bath, D. J. Michael, B. J. Trafton, J. D. Joseph, P. L. Runnels and R. M. Wightman, Anal. Chem., 2000, 72, 5994–6002 CrossRef CAS PubMed.
- A. L. Hensley, A. R. Colley and A. E. Ross, Anal. Chem., 2018, 90, 8642–8650 CrossRef CAS PubMed.
- B. E. K. Swamy and B. J. Venton, Anal. Chem., 2007, 79, 744–750 CrossRef CAS PubMed.
- A. L. Sanford, S. W. Morton, K. L. Whitehouse, H. M. Oara, L. Z. Lugo-Morales, J. G. Roberts and L. A. Sombers, Anal. Chem., 2010, 82, 5205–5210 CrossRef CAS PubMed.
- M. L. Huffman and B. J. Venton, Analyst, 2009, 134, 18–24 RSC.
- D. L. Robinson, Clin. Chem., 2003, 49, 1763–1773 CrossRef CAS.
- A. M. Belle, C. Owesson-White, N. R. Herr, R. M. Carelli and R. M. Wightman, ACS Chem. Neurosci., 2013, 4, 761–771 CrossRef CAS PubMed.
- A. E. Ross and B. J. Venton, Analyst, 2012, 137, 3045 RSC.
- A. E. Ross and B. J. Venton, Anal. Chem., 2014, 86, 7486–7493 CrossRef CAS PubMed.
- A. M. Strand and B. J. Venton, Anal. Chem., 2008, 80, 3708–3715 CrossRef CAS PubMed.
- A. E. Ross and B. J. Venton, J. Neurochem., 2015, 132, 51–60 CrossRef CAS PubMed.
- A. de Mendonça, A. M. Sebastião and J. A. Ribeiro, Brain Res. Rev., 2000, 33, 258–274 CrossRef.
- A. P. Schmidt, D. R. Lara and D. O. Souza, Pharmacol. Ther., 2007, 116, 401–416 CrossRef CAS PubMed.
- E. K. Jackson and Z. Mi, J. Pharmacol. Exp. Ther., 2014, 350, 719–726 CrossRef PubMed.
- E. K. Jackson, D. Cheng, T. C. Jackson, J. D. Verrier and D. G. Gillespie, Am. J. Physiol.: Cell Physiol., 2012, 304, C406–C421 CrossRef PubMed.
- M. L. Pajski and B. J. Venton, Purinergic Signalling, 2013, 9, 167–174 CrossRef CAS PubMed.
- Z. Kovács, A. Dobolyi, G. Juhász and K. A. Kékesi, Neurochem. Res., 2010, 35, 452–464 CrossRef PubMed.
- Á. Dobolyi, A. Reichart, T. Szikra, N. Szilágyi, A. K. Kékesi, T. Karancsi, P. Slégel, M. Palkovits and G. Juhász, Neurochem. Int., 1998, 32, 247–256 CrossRef PubMed.
- A. P. Schmidt, A. E. Böhmer, F. A. Soares, I. P. Posso, S. B. Machado, F. F. Mendes, L. V. C. Portela and D. O. Souza, Neurosci. Lett., 2010, 474, 69–73 CrossRef CAS PubMed.
- M. Spanos, J. Gras-Najjar, J. M. Letchworth, A. L. Sanford, J. V. Toups and L. A. Sombers, ACS Chem. Neurosci., 2013, 4, 782–789 CrossRef CAS PubMed.
- N. R. Zahniser, G. A. Larson and G. A. Gerhardt, J. Pharmacol. Exp. Ther., 1999, 289, 266–277 CAS.
- K. Nagasawa, F. Kawasaki, A. Tanaka, K. Nagai and S. Fujimoto, Glia, 2007, 55, 1397–1404 CrossRef PubMed.
- C. M. Anderson, W. Xiong, J. D. Geiger, J. D. Young, C. E. Cass, S. A. Baldwin and F. E. Parkinson, J. Neurochem., 1999, 73, 867–873 CrossRef CAS PubMed.
- C. M. Anderson, S. A. Baldwin, J. D. Young, C. E. Cass and F. E. Parkinson, Mol. Brain Res., 1999, 70, 293–297 CrossRef CAS PubMed.
Footnote |
| † Electronic supplementary information (ESI) available. See DOI: 10.1039/c8an01547c |
| This journal is © The Royal Society of Chemistry 2019 |

