
Effect of droplet lifetime on where ions are formed in electrospray ionization†
Zijie
Xia
and
Evan R.
Williams
 *
*
Department of Chemistry, University of California, Berkeley, California 94720-1460, USA. E-mail: erw@berkeley.edu; Tel: +1 (510) 643-7161
First published on 22nd November 2018
Abstract
The location of gaseous ion formation in electrospray ionization under native mass spectrometry conditions was investigated using theta emitters with tip diameters between 317 nm and 4.4 μm to produce droplets with lifetimes between 1 and 50 μs. Mass spectra of β-lactoglobulin do not depend on instrument source temperatures between 160 and 300 °C with the smallest tips. A high charge-state distribution is observed for larger tips that produce droplets with lifetimes ≥10 μs and this distribution increases at higher source temperatures. These and other results show that gaseous protein ions originating from the smallest droplets are formed outside of the mass spectrometer whereas the majority of protein ions formed from the larger droplets are formed inside of the mass spectrometer where thermal heating of the droplet and concomitant protein unfolding inside of the droplet occurs. These results show that small emitter tips are advantageous in native mass spectrometry by eliminating effects of thermal destabilization of proteins in droplets inside of the mass spectrometer, eliminating the effects of non-specific protein dimerization and aggregation that can occur in larger droplets that contain more than one protein molecule, and significantly reducing salt adduction.
Introduction
Despite the widespread use of electrospray ionization (ESI) to produce gaseous ions from a diverse range of samples for analysis by mass spectrometry (MS), the mechanism by which these ions are produced is still debated.1–3 In the ion evaporation mechanism, ions are ejected from small droplets owing to the high electric field at the droplet surface, and gaseous ions can be continuously produced throughout the droplet evaporation process.4,5 In the charged residue mechanism, gaseous ions are formed upon solvent evaporation in the late stages of the droplet lifetime.6,7 Other mechanisms based upon these principles have been proposed, such as the chain ejection model8 and the charged residue-field emission model.9 Extensive information about these mechanisms and evidence supporting various mechanisms has been reported elsewhere.5,7–9Knowledge about where ions are formed is important for understanding the effects of instrument conditions on the appearance of mass spectra and for obtaining reliable reaction rates from reactions that occur in droplet mixing experiments. Information about the conformation of proteins or other biomolecules in solution is often inferred from the resulting charge-state distributions observed in ESI mass spectra, where higher charge states indicate more unfolded conformations than lower charge states, which are indicative of more folded structures.10–12 Some instrument conditions can affect the observed charge-state distributions.13,14 For example, high electrospray potentials can lead to the formation of high charge states in otherwise native mass spectrometry conditions. These high charge states are indicative of protein denaturation in the electrospray droplets due to droplet heating outside of the mass spectrometer as a result of the high electric field. This effect is the basis of the method called electrothermal supercharging and can be enhanced at elevated electrospray source temperatures illustrating that understanding the effects of these two essential instrument parameters is critical for preserving information about molecular conformation that exists in the original solution.14,15
Many studies indicate that desolvated ions are formed at or inside of the atmospheric-interface of the mass spectrometer. Optical spectroscopic measurements by van Berkel and coworkers showed that primarily dications of octaethylporphyrin exist in the ESI plume whereas monocations were observed in the mass spectra indicating that the gaseous ions are produced inside of the atmospheric interface.16 In contrast, fluorescence measurements by Zenobi and coworkers indicated that some gaseous rhodamine 6G ions are formed in the plume.17 Chait and coworkers found that higher metal capillary interface temperatures lead to the formation of higher charge states of proteins in water/methanol solutions that contain ammonium acetate but only for some proteins without ammonium acetate.13 They hypothesized that ammonium acetate affected the droplet lifetime and attributed the change in the charge-state distribution with temperature to the droplets entering the interface prior to gaseous ion formation.13 A similar conclusion was reported from organic reactions that occur in electrospray droplets.18 Correlations between the time evolution of different intermediates and the distance between the ESI emitter and instrument inlet suggest that there is a sudden discontinuity in the droplet desolvation process that occurs in the MS inlet. Heating the transfer tube between electrospray emitter and instrument inlet or increasing instrument inlet temperature can also result in different reaction products and intermediates at the same distance, which is consistent with the influence of instrument conditions on the MS results. In recent droplet fusion experiments aimed at obtaining information about reaction rates, ion formation is assumed to occur at the entrance of the mass spectrometer and this assumption is used to establish a reaction time.19
A key advance to understanding where ion formation occurs is the ability to form droplets of different size and to measure their corresponding lifetimes. This can be done using theta emitters in which two different solutions are mixed during the electrospray ionization process.20–24 To obtain the droplet lifetimes, a unimolecular reaction with a known rate constant in solution is induced by mixing two solutions and the progress of the reaction is monitored using MS.22,23 A unimolecular process is used because droplet evaporation rapidly increases reagent concentrations with time leading to a large increase in apparent bimolecular reaction rates in droplets although other factors may also play a role.18,25 The folding of proteins initiated by mixing induced by the electrospray process has been used to establish droplet lifetimes.22,23 An acidified solution containing a protein that is significantly denatured or unfolded is mixed with either pure water or an aqueous buffered solution to induce a pH jump upon mixing. The extent of folding that occurs inside of the electrospray droplet is inferred from the resulting charge-state distributions. The droplet lifetime depends on the solution flow rate, which can be changed by varying the emitter tip diameter or backing pressure applied to the solution. This method has been used to produce droplet lifetimes between 1 and ∼40 μs using theta emitters with tip diameters ranging from 246 nm to ∼1.7 μm and a backing pressure between 5 and 40 psi.22–24 A mixing time of 1 μs is significantly shorter than that possible in conventional mixing apparatus and this mixing time can be achieved with a 1000-fold lower flow rate. This method has enabled investigations of fast peptide folding that occurs much too rapidly to be observed using other mixing methods.23,24 The lifetime of droplets can be varied by changing the distance between the emitter tip and the mass spectrometer and by changing spray potentials.18,26 Velocities of droplets have been measured optically to obtain information about how long the droplets spend outside of the mass spectrometer. In experiments in which mixing is induced upon droplet collisions, gaseous ion formation is assumed to occur at the entrance of the mass spectrometer in order to establish a droplet lifetime from these velocity measurements.19,26 Droplets formed from emitters with ∼4 μm tip diameters with lifetimes ranging from 20 to 230 μs were reported.26
In this study, theta emitters with tip diameters ranging from 317 nm to 4.4 μm are used to produce droplets with lifetimes between 1 and 50 μs. The effects of instrument source temperature on β-lactoglobulin ions produced from buffered aqueous solutions using these varying droplet sizes were investigated. Results from these experiments clearly show that gaseous ions that originate from the smallest droplets are formed outside of the mass spectrometer whereas ions originating from the larger droplets are formed inside of the heated electrospray interface of the mass spectrometer. Moreover, these results demonstrate three significant advantages for using submicron tips in native mass spectrometry: the elimination of effects of source temperature on the resulting mass spectra, significant reduction of non-volatile salt adducts, and the elimination of non-specific dimerization or aggregation that can occur when multiple protein molecules are present in the initial droplet formed from larger emitters.
Experimental method
Mass spectrometry
Mass spectra are acquired using an LTQ mass spectrometer (Thermo Fisher Scientific, Waltham, MA, USA) with nanoelectrospray ionization (nano-ESI). Borosilicate theta capillaries (1.2 mm o.d./0.9 mm i.d., 0.15 mm septum thickness, Sutter Instruments, Novato, CA, USA) were pulled into emitters with tip outer diameters of 317 ± 14 nm (shorter dimension 228 nm), 1.7 ± 0.1 μm (shorter dimension 1.1 μm), and 4.4 μm ± 0.1 μm (shorter dimension 2.1 μm) (Fig. 1). Borosilicate capillaries (1.0 mm o.d./0.78 mm i.d., Sutter Instruments, Novato, CA, USA) are pulled into single barrel emitters with tip diameter of 1.7 μm. Nano-ESI is initiated by applying a spray potential (between 600 V and 1000 V) on 0.127 mm diameter platinum wires that are inserted into the two barrels of the theta emitters or the single barrel emitters and are in contact with the solutions containing proteins. The emitter tips are placed approximately 1.5 to 2 mm away from the instrument entrance, and the spray voltage is kept as low as possible while maintaining spray stability. A spray potential of 1.3 kV is used to induce electrothermal supercharging.14 A 10 psi backing pressure of nitrogen gas is applied on all the theta emitters but not on the single barrel emitters. The instrument source temperature is adjusted from 160 °C to 300 °C, keeping the other instrument parameters constant. The fraction of unfolded protein in the ESI droplets immediately prior to ion formation is determined from the ion abundances in the charge-state distributions using eqn (1),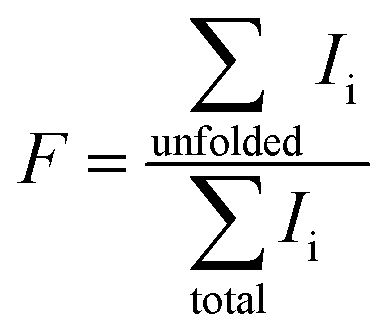 | (1) |
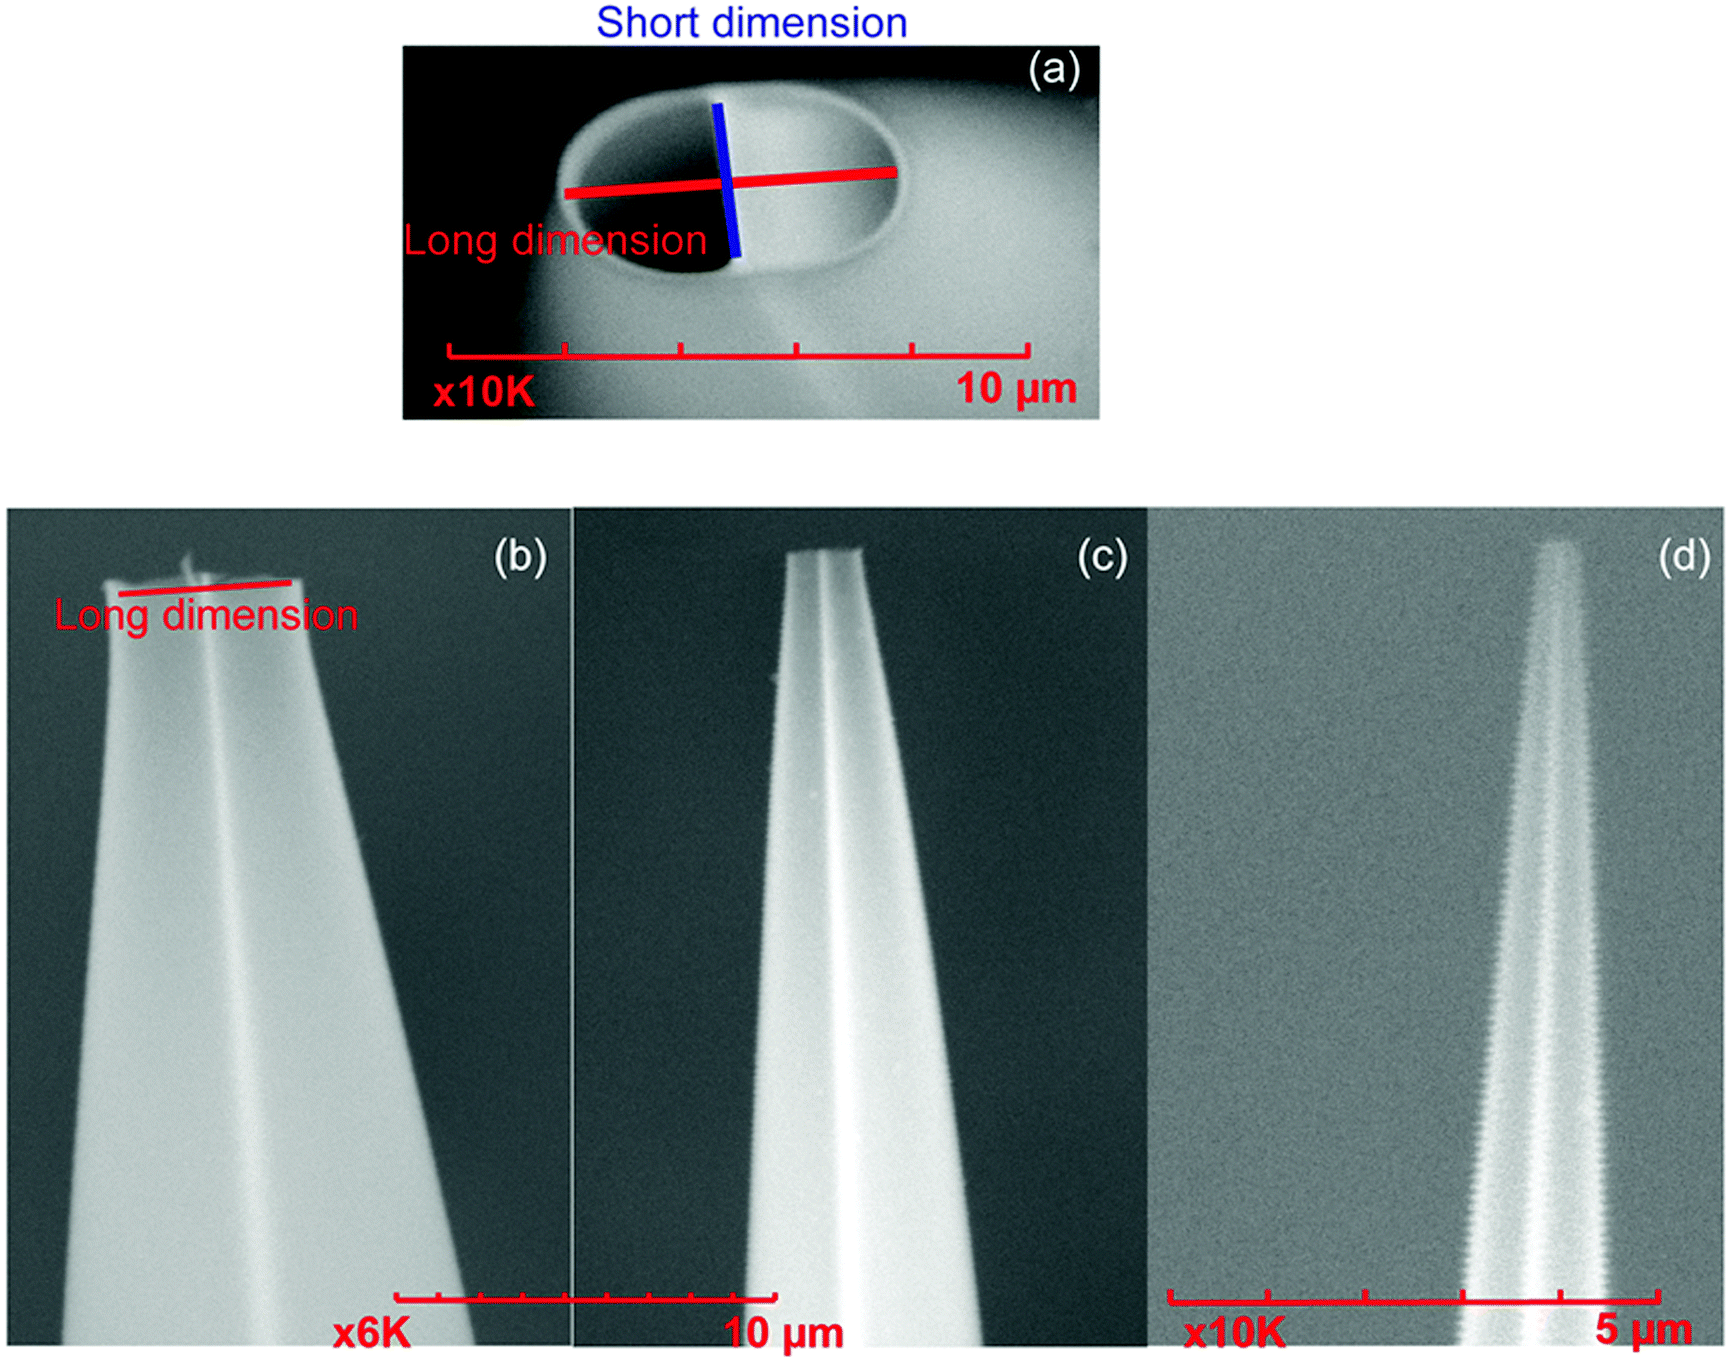 | ||
| Fig. 1 Scanning electron microscope images of theta emitters with different tip sizes (a) the end of an emitter tip showing the two channels with both the long (red) and short (blue) dimension labeled, (b) the long dimension side of a theta emitter tip that is 4.4 μm, (c) 1.7 μm, and (d) 317 nm. The short dimension of the emitters in (b), (c) and (d) are 2.1 μm, 1.1 μm, and 221 nm, respectively. | ||
Tryptophan fluorescence
Emission spectra resulting from tryptophan fluorescence of β-lactoglobulin in 100 mM AA, 10 mM AA and 100 mM ABC are obtained with a FluoroMax-3 spectrometer (Horiba Scientific, Kyoto, Japan). The sample is excited at 280 nm and the resulting emission is measured from 200 nm to 390 nm. Both the entrance and exit slit widths are 2 nm. The inner chamber temperature is raised from 25 °C to 87.5 °C (±0.2 °C tolerance) in 2.5 °C increments. The solution is equilibrated for five minutes at each temperature prior to measurements. Three emission scans are acquired, background subtracted, and averaged for each temperature. A Gaussian fit is used to obtain the wavelength of the maximum of the emission peak of β-lactoglobulin tryptophan for the emission peak using OriginPro (Northampton, MA). Temperature melt curves are generated by plotting the wavelength of the maximum of the tryptophan emission peak as a function of temperature.Results and discussion
Droplet lifetimes
The lifetimes of droplets produced by nano-ESI using theta emitters depend on several factors, including the solution flow rate, which can be controlled by changing the diameter of the emitter tip or by varying the backing pressure, the spray voltage, and the distance between the emitter tip and the entrance of the mass spectrometer.22,23,26 Droplets with lifetimes ranging from ∼1 μs to 40 μs can be produced with tip sizes between 246 nm and ∼1.7 μm using a backing pressure between 5 and 40 psi at a fixed distance of about 1 to 2 mm.22–24 In order to extend the droplet lifetimes for this study, theta emitters with tip diameters of 4.4 μm ± 0.1 μm (shorter dimension 2.1 μm) where prepared and the droplet lifetime was determined as done previously using pH-induced folding of cytochrome c using a 10 psi backing pressure.23 The lifetime of droplets produced by these larger emitters was measured by mixing an acidified solution containing cytochrome c with pure water to induce a pH jump upon droplet formation in the ESI process. Aqueous solutions of 5 μM cytochrome c at two different pH values corresponding to the initial solution (1% acetic acid; pH = 2.8) and the final mixed solution (this solution mixed 50/50 with pure water resulting in 0.5% acetic acid after mixing; pH = 3.0) were prepared and nano-ESI mass spectra were obtained (Fig. 2a and b, respectively). The charge-state distributions of cytochrome c ions in both spectra are bimodal, with the summed intensity of lower charge states (+7 to +10) corresponding to 2% ± 1% and 26% ± 1% of the total protein ion abundances in these respective solutions. Fast mixing of this initial cytochrome c solution with pure water using the 4.4 μm theta emitters induces protein folding in the nano-ESI droplets and results in 22% ± 1% of total protein ion abundance in the +7 to +10 charge states (Fig. 2c). This value is lower than the 26% ± 1% value measured under equilibrium conditions indicating that the folding process is largely, but not entirely complete.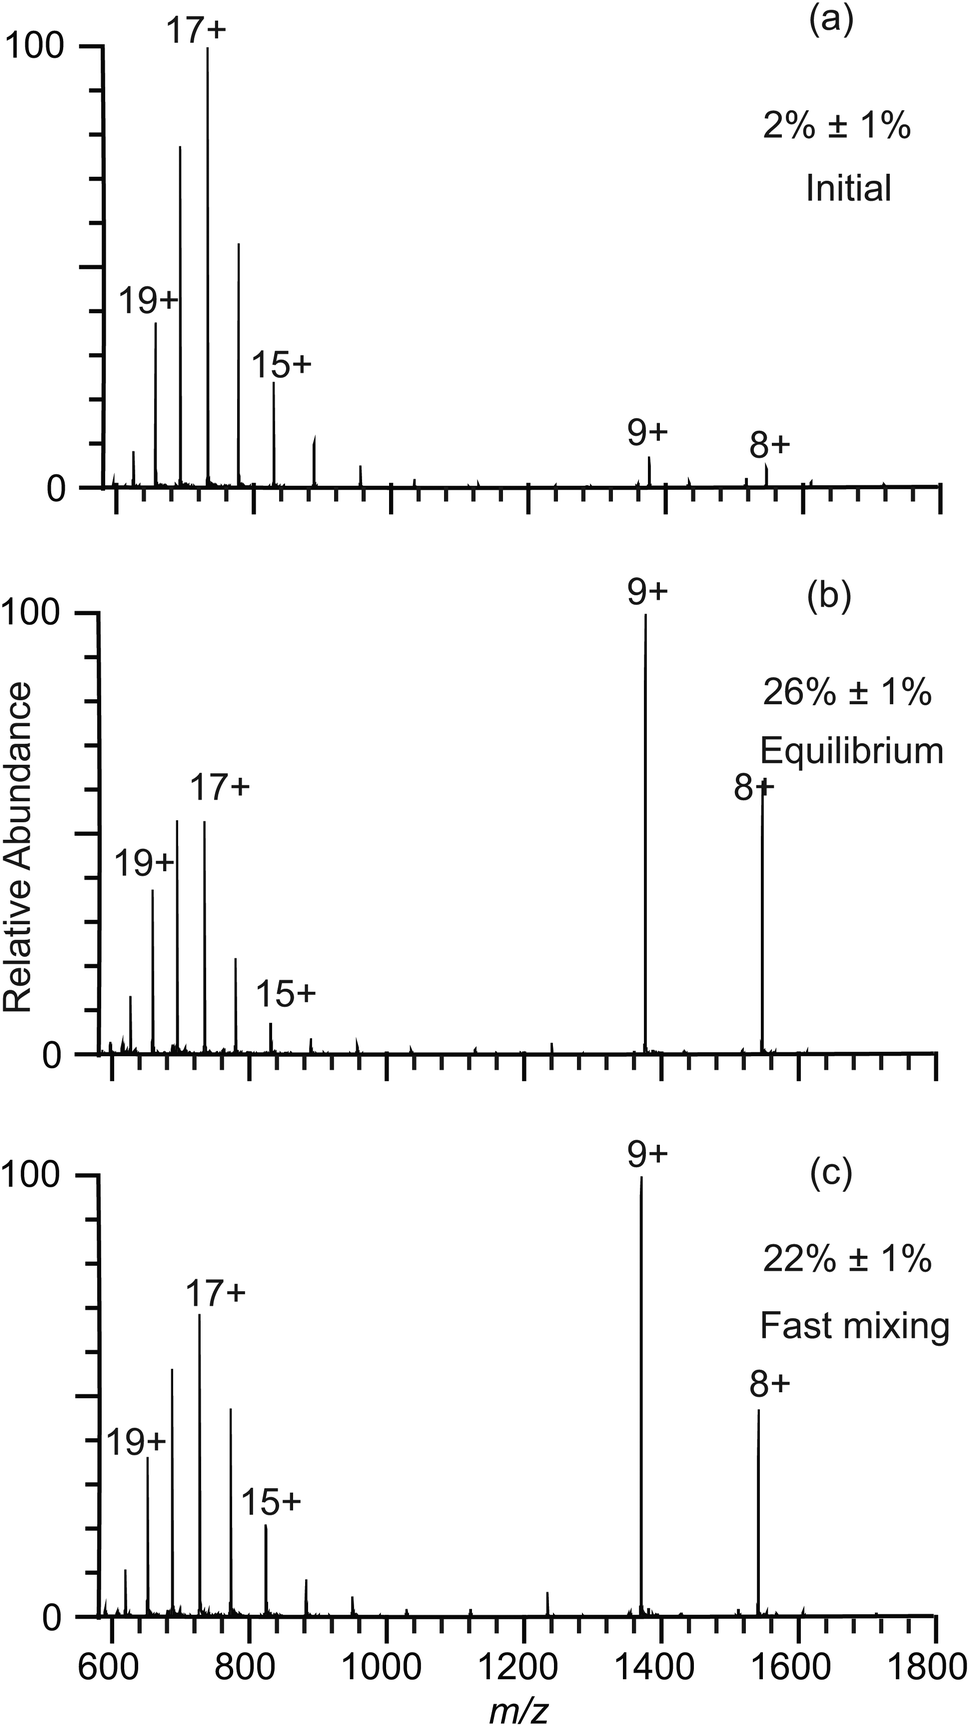 | ||
Fig. 2 Electrospray ionization mass spectra for cytochrome c refolding experiments with a 4.4 μm theta emitter with 10 psi backing pressure used to deduce droplet lifetime: spectra obtained for solutions consisting of (a) water with 1% acetic acid (pH = 2.8), (b) 1![[thin space (1/6-em)]](https://www.rsc.org/images/entities/char_2009.gif) :1 mixture of water with 1% acetic acid and pure water at equilibrium (pH = 3.0), and (c) rapid mixing of the acidified aqueous solution used in (a) and water using a theta emitter. Percentages of folded cytochrome c are labeled in the spectra. :1 mixture of water with 1% acetic acid and pure water at equilibrium (pH = 3.0), and (c) rapid mixing of the acidified aqueous solution used in (a) and water using a theta emitter. Percentages of folded cytochrome c are labeled in the spectra. | ||
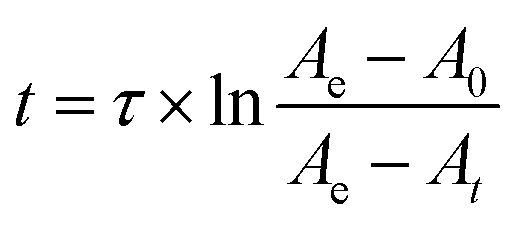
The integrated rate equation for a two-state reaction (eqn (2)) is used to model cytochrome c folding as a two-state process;
 | (2) |
Droplet lifetimes in ESI have also been estimated from micro-particle image velocimetry measurements, which showed that 4 μm theta emitters produced droplets with lifetimes between 20 μs and 320 μs depending on the spray voltage and the distance between emitter tip and the instrument entrance (between 0.5 mm and 3 mm).26 In the experiments here, the theta emitters are about 1.5 mm to 2 mm away from the instrument entrance and the droplets are formed with ∼1 kV applied to the solution. Jansson et al. reported 73 μs to 133 μs for the similar spray voltage and tip position.26 Despite the significant differences in experimental methodologies, the droplet lifetimes measured with both techniques are remarkably similar.
Effects of droplet lifetime and source temperature on protein unfolding in droplets
In order to answer the question about where desolvated gaseous protein ions are formed during electrospray ionization, theta emitters with diameters of 317 nm, 1.7 μm and 4.4 μm were used to produce droplets with lifetimes ranging from 1 μs to 50 μs.23,29 Even though both channels of the theta emitters contain the same solution, theta emitters are used in these experiments because the lifetimes of the droplets have been established with these emitters22,23,29 and knowledge of droplet lifetimes are important in understanding where desolvated ions are formed. The instrument source temperature was varied between 160 °C and 300 °C to investigate effects, if any, of thermal activation of droplets that may enter the mass spectrometer inlet system. The spray voltage was kept as low as possible while still maintaining a stable spray to avoid electrothermal supercharging.14,15 Experiments were performed with β-lactoglobulin, which is a major whey protein in cow and goat milk because the thermal stability of this protein has been widely studied under different pH and salt conditions.30–33 The melting temperature of β-lactoglobulin is reported in various studies to be between 70 and 80 °C at neutral pH.31,33 β-lactoglobulin has pI at 5.1 and is negatively charged in the aqueous buffered solutions used in these experiments.30 Thus, these protein ions in solution should not interact significantly with the glass surface of the theta emitters, which can also induce protein destabilization and partial unfolding in solution before electrospray droplet formation.34,35Results for β-lactoglobulin (10 μM in 100 mM ABC) obtained with 317 nm theta emitters at source temperatures between 160 °C and 300 °C are shown in Fig. 3a–c. Charge states between +7 and +9 are observed, and the relative abundances of these charge states do not change significantly with instrument source temperature. In striking contrast, nano-ESI spectra obtained from this same solution using 4.4 μm theta emitters show a charge-state distribution that is shifted to slightly higher charge at 160 °C (Fig. 3d) and the appearance of a second higher charge-state distribution (+11 to +17) centered at +14 that increases in relative abundance with increasing source temperature (Fig. 3e and f). The higher charge-state distribution is indicative of a small population of unfolding proteins in solution that increases with source temperature.
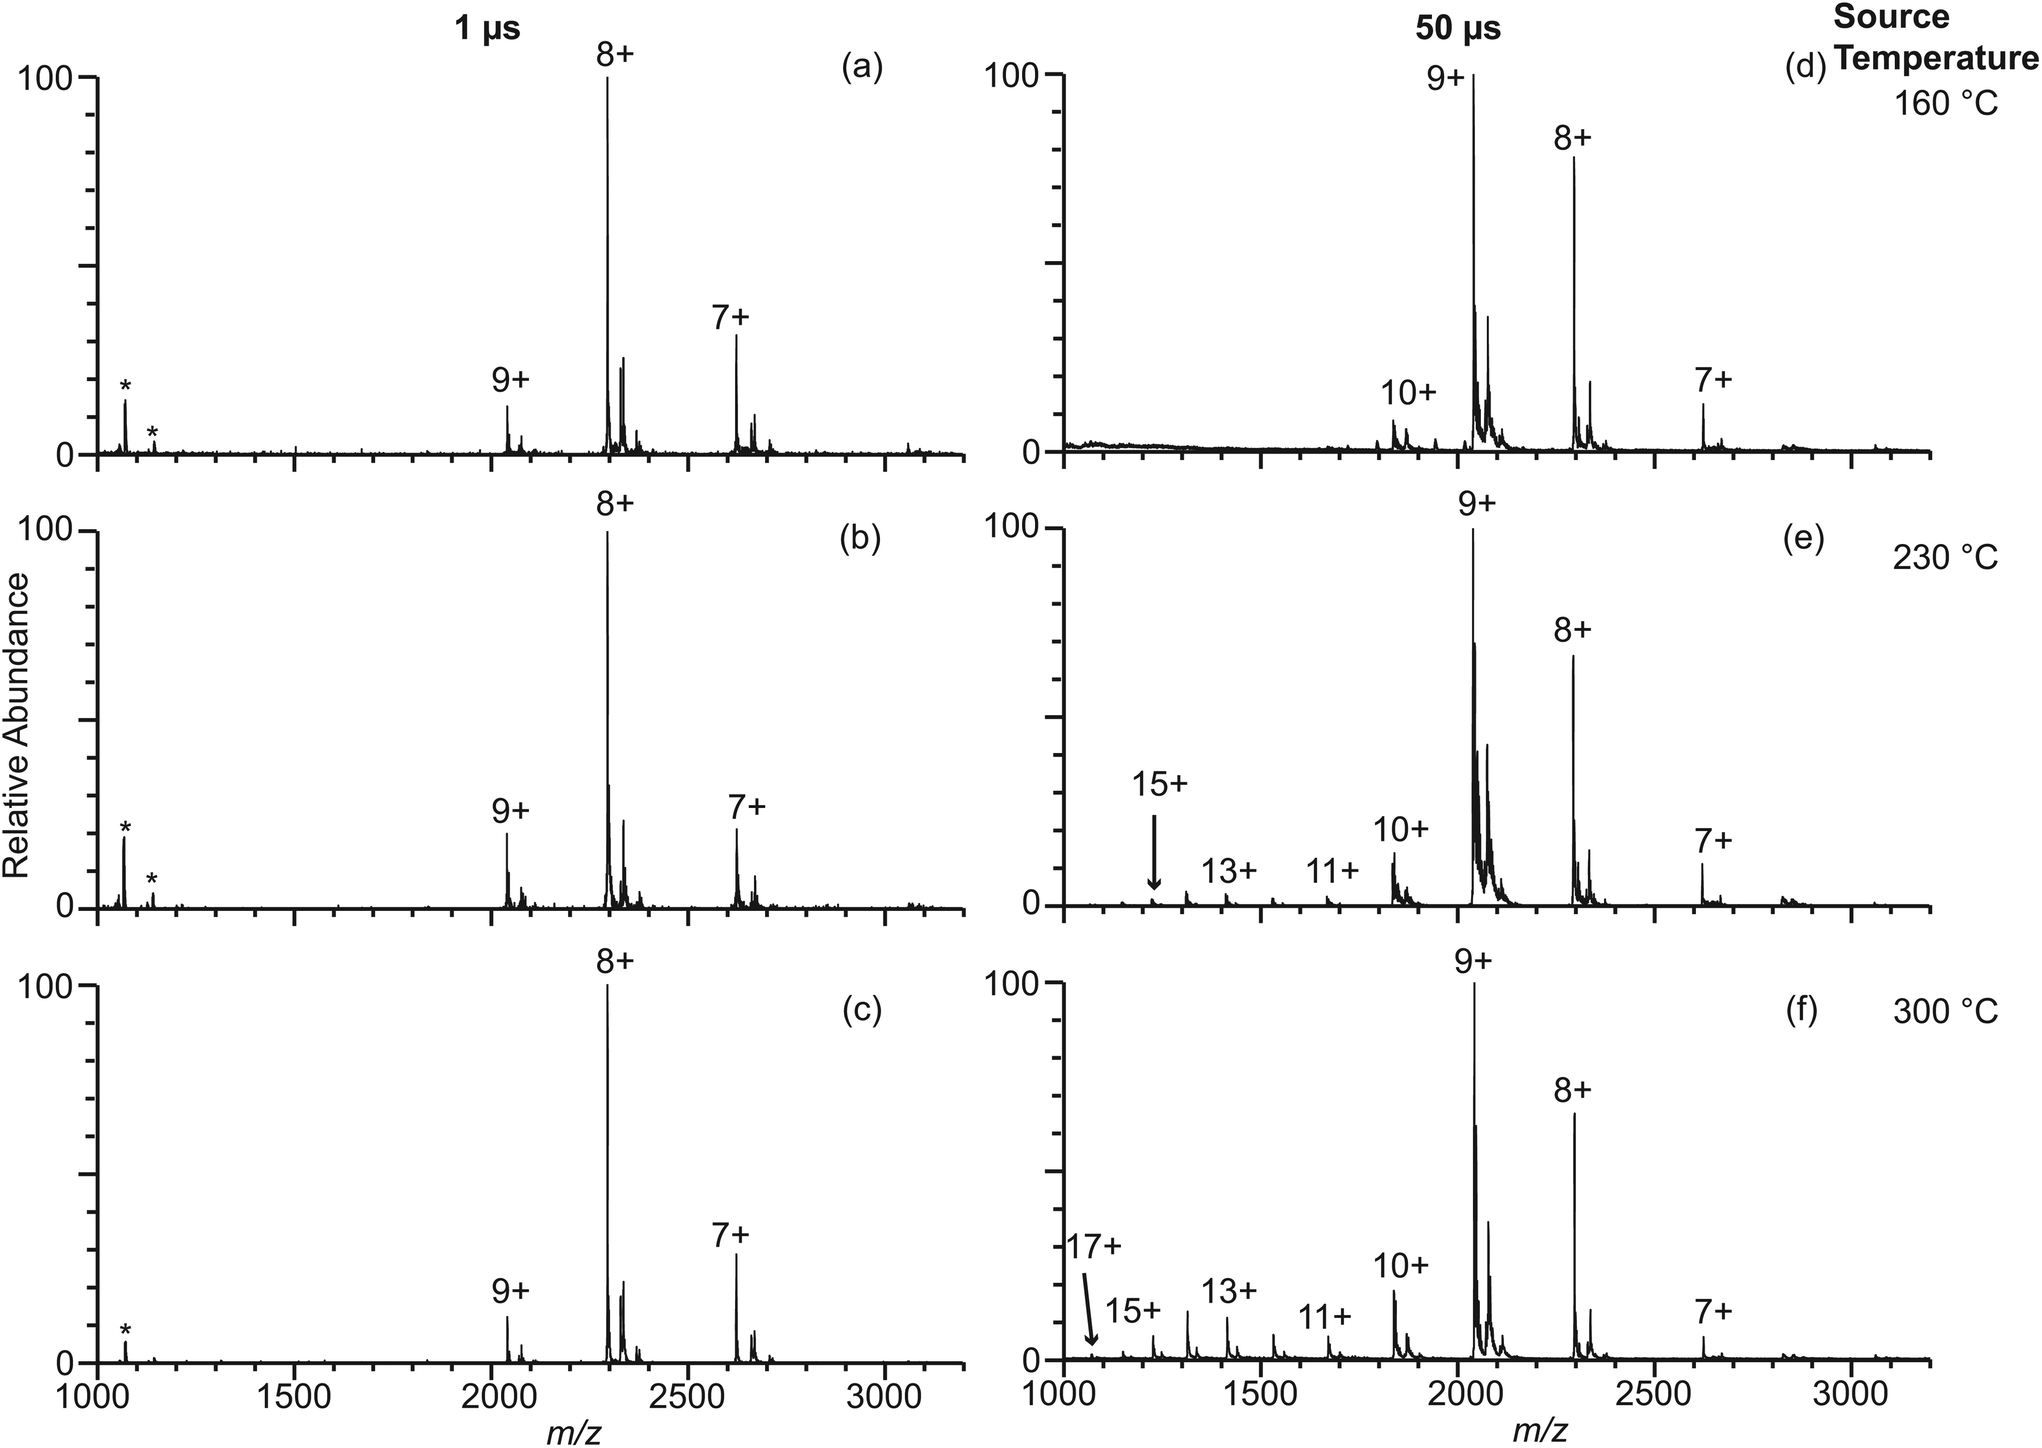 | ||
| Fig. 3 Electrospray ionization mass spectra obtained from solutions consisting of 10 μM β-lactoglobulin in 100 mM ABC using 317 nm (a–c) and 4.4 μm (d–f) theta emitters at source temperatures of 160 °C (a, d), 230 °C (b, e), and 300 °C (c, f). The lifetime of the droplets formed from 317 nm and 4.4 μm theta emitter is approximately 1 μs and 50 μs, respectively. Peaks at slightly higher m/z correspond to lactosyl covalently bound to β-lactoglobulin.46 *Indicates polydimethylsiloxane clusters that are present as an impurity. | ||
The fraction of β-lactoglobulin that is unfolded in solution was estimated from the abundances of the +11 to +17 ions divided by the total protein ion signal (eqn (1)). These values obtained from the 4.4 μm emitters are 1.7% ± 1.1%, 7.6% ± 3.4%, and 18.1% ± 1.3% at source temperatures of 160 °C, 230 °C and 300 °C, respectively. It should also be noted that the charge-state distribution of the folded form of the protein is shifted from +8 with the 317 nm emitters to +9 with the 4.4 μm suggesting that the native structure of the protein may be partially destabilized with the larger emitter at all source temperatures, although other factors may also contribute. Heating the instrument source increases the surrounding air temperature, and some heating of the solution in the emitter tip and the droplets may also occur before the droplets enter the mass spectrometer. The air temperature measured near the instrument source increases slightly from 38 °C to 48 °C when the instrument source temperature increases from 160 °C to 300 °C. This does not appear to impact the structure of the protein in the emitter tip because no change in the charge-state distribution is observed with the smallest theta emitters and this range of temperatures is below the melting transition of this protein. A similar trend in increasing unfolded population with increasing source temperature occurs with 1.7 μm theta emitters (Fig. S-1a–c†) but to a lesser extent than with the 4.4 μm theta emitters. In striking contrast, the fraction of ions corresponding to an unfolded protein formed from 317 nm theta emitters is less than 1%, and there is no trend with increasing source temperature. The trend of increasing unfolded protein population with increasing instrument source temperature indicates that the droplets generated from 1.7 μm and 4.4 μm theta emitters experience the high temperature inside the heated ion transfer tube of the instrument. As the larger droplets are heated inside the ion transfer tube of the instrument source, some protein melting or unfolding occurs inside the droplets. The population of unfolded molecules in the droplets will lead to higher charge states whereas those that are still folded will lead to the lower charge states. Once bare ions are formed, conformational changes may occur as a result of heating, but these conformational changes will not lead to changes in the ion charge states. Therefore, these charge state changes that are observed from 1.7 μm and 4.4 μm theta emitters are a result of conformational changes that occur in the droplets. Protein ion peaks are also broader from 1.7 μm and 4.4 μm emitters than the ones formed from 317 nm emitters due to sodium adducts, which is consistent with previously reported desalting effects of submicron single and theta emitters during electrospray ionization.34,36–38
The temperature inside of the ion transfer tube is likely to be much lower than the elevated set temperature owing to the heat transfer between room temperature air and the heated ion transfer tube. The droplet temperature can be further reduced as a result of evaporative cooling. Thus, the temperatures of the larger droplets inside the transfer tube are unknown. To confirm that the low charge state ions produced from the larger droplets at higher temperature are formed inside the source and not before entering the mass spectrometer, the native form of β-lactoglobulin was destabilized by adding 3% (v/v) ammonium hydroxide in 100 mM ABC (pH 10). A nano-ESI spectrum obtained with the 317 nm theta emitters at a source temperature of 160 °C shows that approximately 5% of the protein is unfolded in this solution (Fig. S-2†), consistent with the native form of the protein somewhat destabilized so that both folded and unfolded forms are in equilibrium. Even with a 300 °C source temperature, there is no significant increase of unfolded protein with the small emitters (Fig. S-2a and b†), consistent with the hypothesis that the droplets generated from the submicron theta emitters do not experience the high temperature inside the source. In striking contrast, 66% of the ion population formed using the 4.4 μm theta emitters corresponds to proteins that are unfolded in solution at a source temperature of 300 °C (Fig. S-2c and d†). This indicates that the majority of the droplets formed by the larger emitters enter the source and that heat from the source results in melting of the protein in solution inside of the mass spectrometer prior to protein ion formation. It appears from these results that the droplets are insufficiently heated even at this source temperature to completely unfold the protein in solution under these conditions, consistent with results from a prior study.13
Droplet velocities and location of ion formation
In order to more thoroughly understand why the charge-state distribution of ions formed from the smallest theta emitters are not affected by the temperature of the source whereas the droplets formed from the larger emitters are affected, the initial droplet velocities and air flow velocity through the heated ion transfer tube were determined. The initial droplet velocity with the 317 nm theta emitters is about 2 m s−1.‡ The initial velocity of droplets formed from larger emitters is even less (estimated to be about 0.25 m s−1 with the 4.4 μm theta emitters based on a flow rate of 3461 ± 509 pL s−1). The theta emitters are approximately 1.5 mm to 2 mm away from the instrument entrance, so this initial velocity is insufficient for the smallest nanodrops that have a 1 μs lifetime to reach the mass spectrometer. However, the droplets are accelerated by the applied electric field, and this force is resisted by collisions with the ambient background gas. There is also gas flow into the mass spectrometer induced by the pressure difference between where the ions are formed (∼760 Torr) and the first vacuum stage (∼0.6 Torr). The air flow into the instrument was estimated using a simplified Hagen–Poiseuille equation for viscous airflow (eqn (3)).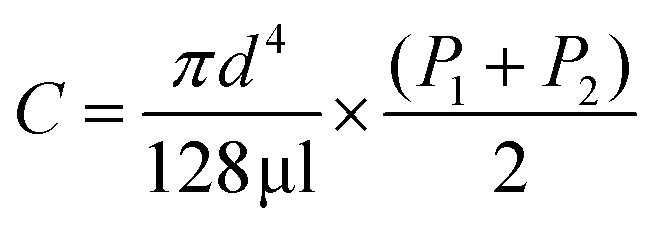 | (3) |
Significantly lower droplet velocities between 8 and 23 m s−1 were reported by Jansson et al. with 4 μm diameter emitters over a range of distance and spray voltages.26 The flow of air through the ion transfer tube should be similar in those experiments. If the droplet velocities in our experiments are at the highest velocity of 23 m s−1 reported by Jansson et al., then it would require ∼65 μs for these droplets to reach the source. However, our results indicate that the droplets formed from 1.7 μm emitters which have a lifetime of 10 μs do in fact experience the higher temperature inside the ion transfer tube. Thus, we conclude that the droplets on our experiments must be moving at a higher velocity. This discrepancy between the droplet velocities reported by Jansson et al. and the results of our experiments may be related to assumptions made in the earlier experiments. Jansson et al. reported that the droplets formed from 4 μm theta emitters are around 4.3 μm in diameter.26 However, results from other studies using similar emitters indicate that the initial size of the majority of droplets that result in charged analyte ions is about 1/10 to 1/17 of the electrospray emitter diameter.36,39,40 For example, Bush and coworkers reported that the initial droplets formed from single barrel emitters with diameters of ∼1 to 3 μm using common native electrospray conditions are approximately 60 nm in diameter.40 Jansson et al. measured the droplet sizes optically using a setup where a single pixel in their CCD camera corresponds to ∼0.8 μm.26 Thus, this optical detection method is not capable of measuring the <0.4 μm droplets that result in protein ions observed in the mass spectrometer. Although larger droplets may be formed as well, these droplets may not produce the majority of the protein ions that are observed. It should also be emphasized that reaction kinetics that have been reported previously based on optically measured velocities have included the explicit assumption that bare protein ion formation occurs at the entrance of the mass spectrometer.26 Our results reported here clearly show that this is not the case. The similar droplet lifetimes for the 4 μm emitters deduced from these two experiments may be a result of an underestimation of both the droplet velocity and the distance traveled prior to ion formation in the optical-based studies.
Buffer effect on protein unfolding in droplets
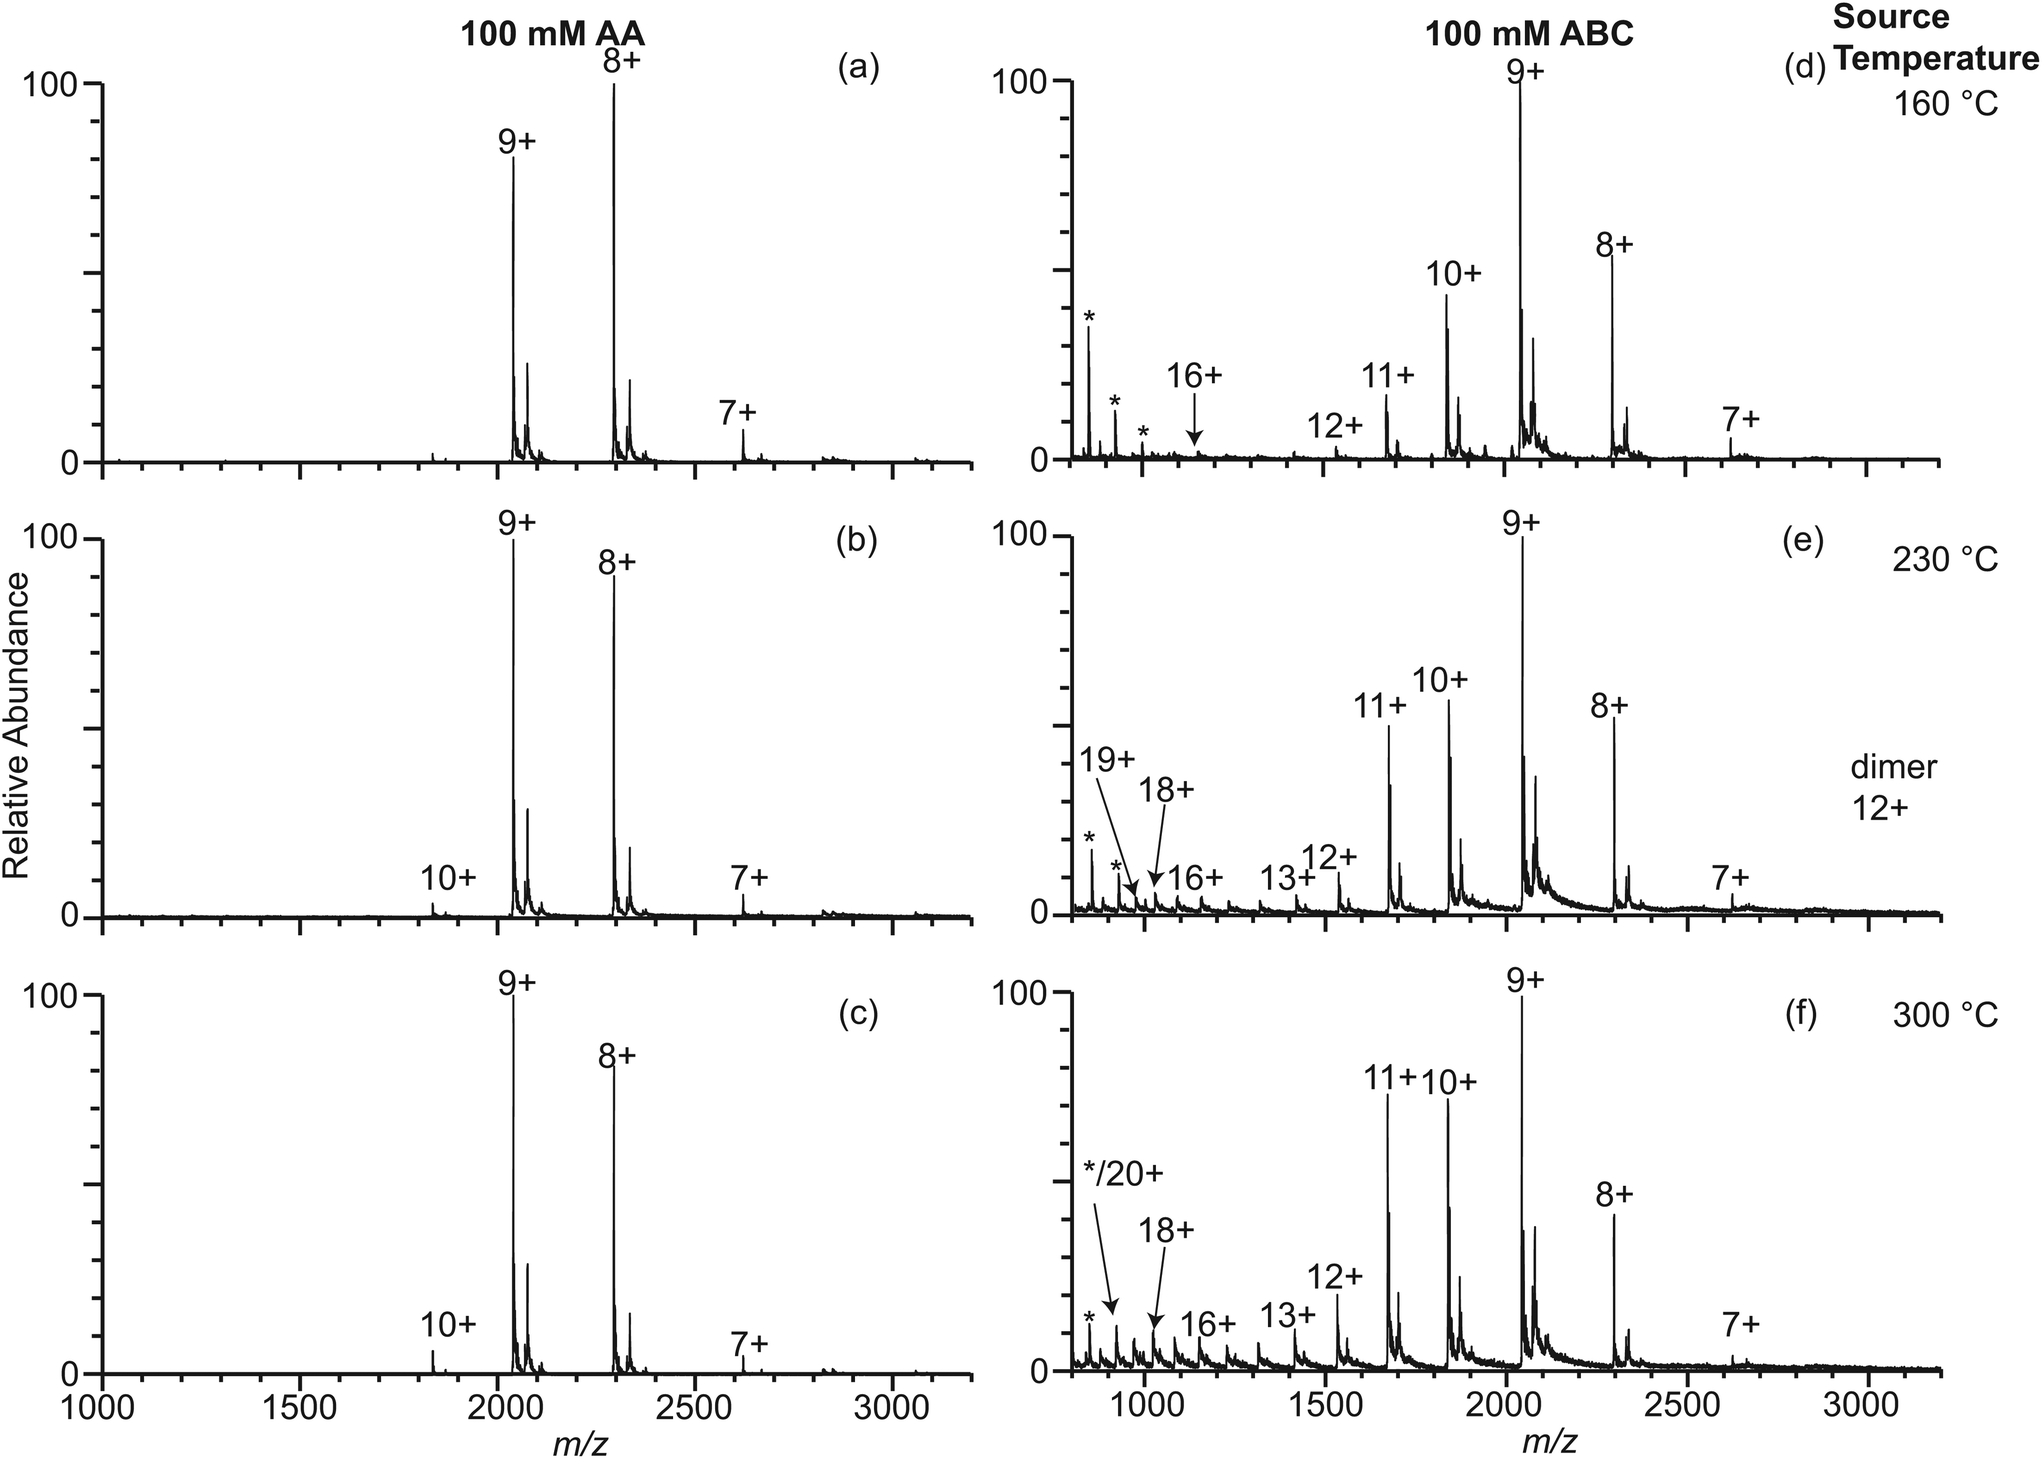
It is well known that different buffers can stabilize or destabilize the native forms of proteins. Ammonium acetate is a more commonly used buffer in native mass spectrometry experiments than ammonium bicarbonate despite the fact that ammonium acetate is a poor buffer at neutral pH.41 The effect of ammonium acetate on the extent of thermal induced protein unfolding in longer-lived droplets was investigated by measuring nano-ESI mass spectra of β-lactoglobulin (10 μM) in 100 mM AA using 317 nm, 1.7 μm, and 4.4 μm theta emitters at instrument source temperatures between 160 °C and 300 °C (Fig. 4 and Fig. S-1d–f†). With 317 nm emitters, the spectra are similar to those formed under the same conditions but with 100 mM ABC and there is no dependence on source temperature. Results with the 4.4 μm theta emitters show there is a source temperature dependence, as was the case with 100 mM ABC, but the fraction of unfolded protein is much less at higher temperatures. At 230 °C, the fraction of unfolded β-lactoglobulin is 3.4% ± 1.5%, which is approximately half that from 100 mM ABC. At 300 °C, the fraction of the unfolded protein is 7.2% ± 1.5%, again, less than half that from 100 mM ABC (Fig. 4). A similar trend of the formation of unfolded protein from 100 mM AA is observed using 1.7 μm theta emitters (Fig. S-1d–f†). The increasing trend of the unfolded protein with increasing source temperature from 100 mM AA using larger theta emitters is consistent with the hypothesis that protein ions formed from larger theta emitters are formed inside the heated ion transfer tube, which causes thermal denaturation of the protein. However, it appears that less unfolding occurs with 100 mM AA than with 100 mM ABC. This is also consistent with the +8 being the most abundant ion with AA, but the +9 is most abundant with ABC at this same emitter size. It is also interesting to note that dimer abundance is significantly higher in the spectra obtained from the AA solution. | ||
| Fig. 4 Electrospray ionization mass spectra obtained from solutions consisting of 10 μM β-lactoglobulin in 100 mM AA using 317 nm (a–c) and 4.4 μm (d–f) theta emitters at source temperature 160 °C (a, d), 230 °C (b, e), and 300 °C (c, f). The lifetime of the droplets formed from 317 nm and 4.4 μm theta emitter is approximately 1 μs and 50 μs, respectively. Peaks at slightly higher m/z correspond to lactosyl covalently bound to β-lactoglobulin.46 *Indicates polydimethylsiloxane clusters that are present as an impurity. | ||
Ionic strength can affect protein conformation and stability.42 These experiments were repeated in 10 mM AA (Fig. S-3†). There is no significant change in the charge-state distribution with source temperature using 317 nm theta emitters, but there is an increase in the abundance of unfolded protein with 4.4 μm emitters with increasing temperature. The fraction of unfolded protein formed from the 10 mM AA solution is slightly higher than that formed from the 100 mM AA solution at high source temperature with both the 1.7 μm and 4.4 μm emitters (Fig. 5). This result is consistent with lower ionic strength causing a small reduction in the stability of the folded form of the protein.
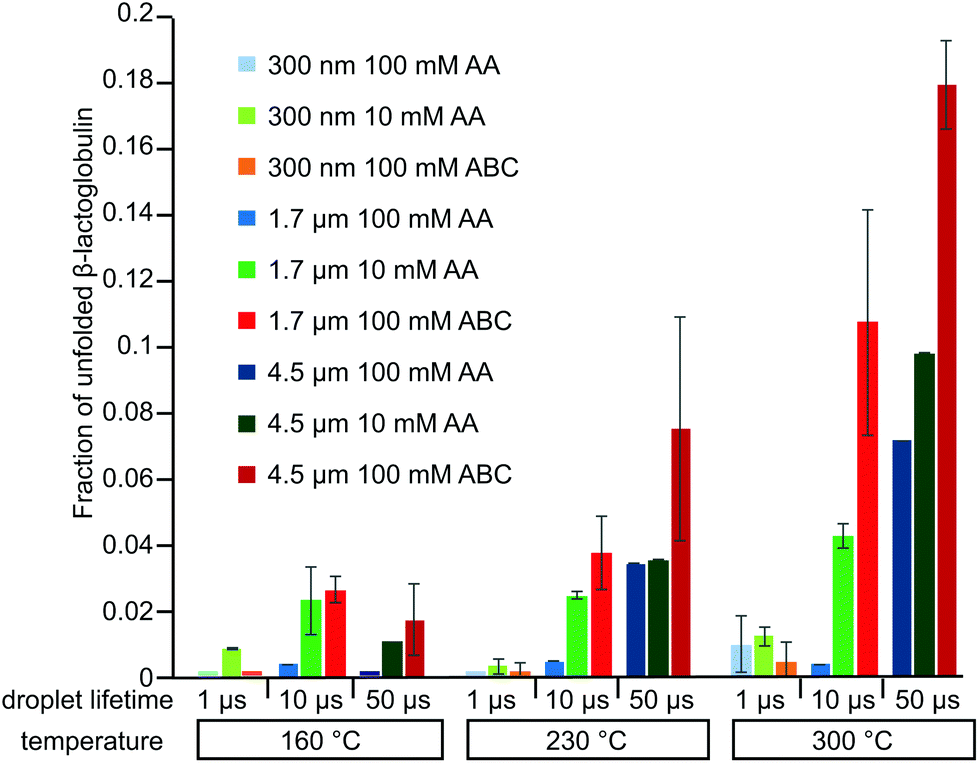 | ||
| Fig. 5 The fraction of unfolded β-lactoglobulin ions obtained from electrospray ionization using 317 nm (light shades), 1.7 μm (medium shades), and 4.4 μm (dark shades) theta emitters from solutions consisting of 10 mM AA (green), 100 mM AA (blue), and 100 mM ABC (red) at three different instrument source temperatures. | ||
The effects of these buffers on the stability of the native form of β-lactoglobulin were studied with fluorescence. Upon thermal denaturation, exposure of tryptophan to solvent typically increases the fluorescent emission intensity. However, for β-lactoglobulin, tryptophan fluorescence emission intensity decreases with increasing temperature (Fig. S-4†). This phenomenon has been attributed to the thermal deactivation of the tryptophan fluorophores or the change in tertiary structure resulting in increasing proximity between primary amines of lysine residues and tryptophan fluorophores, which leads to fluorescent quenching.31,43 A measure of β-lactoglobulin unfolding can also be obtained from the wavelength of the maximum of the tryptophan emission peak, which provides a measure of the polarity of the environment around tryptophan. As β-lactoglobulin unfolds, tryptophan that is buried inside the fully folded protein in a less polar environment transitions to exposure to polar solvent in the unfolded state.31
Temperature melting curves for β-lactoglobulin in the three different buffers were obtained by plotting the wavelength of the tryptophan emission peak maximum as a function of temperature (Fig. 6). The melting curves obtained from 10 mM AA and 100 mM AA are similar, but between 50 °C and 70 °C, the wavelength maximum is consistently higher from 10 mM AA compared to that from 100 mM AA, indicating more exposure of tryptophan to the polar solvent at lower AA concentration within this temperature range. In contrast, the melting curve obtained from 100 mM ABC shows that considerably more unfolding occurs at a lower temperature compared to either AA solution. These results show that β-lactoglobulin is thermally less stable in ABC than AA even at the same ionic strength. The fluorescence results from the three different buffers support the observation that more thermal unfolding occurs in droplets that are heated by the source for ABC than it does for AA. It is interesting that the air near the instrument source can reach 50 °C, a temperature at which some unfolding should occur in ABC, yet no significant unfolding is observed with the 317 nm theta emitters. Either the nanodrops have lifetimes that are too short to experience these elevated temperatures as droplets or evaporative cooling of the droplet may compete with resistive and ambient heating resulting in a somewhat lower temperature in the droplet compared to the ambient air.
 | ||
| Fig. 6 Temperature melt of β-lactoglobulin obtained by measuring the shift in the wavelength of the maximum fluorescence emission intensity of tryptophan in solutions consisting of 10 mM AA, 100 mM AA and 100 mM ABC at temperatures between 25 °C and 87.5 °C measured in 2.5 °C increments. | ||
Droplet size effect on protein dimerization
It is interesting to note that there is substantial dimer signal in the mass spectra obtained with the 1.7 μm and 4.4 μm theta emitters but not with the 317 nm emitters with the 100 mM AA solution (Fig. 4). β-Lactoglobulin is predominantly a dimer at physiological conditions (>50 μM protein concentration), and the dimer-monomer equilibrium depends on pH, buffer, and ionic strength.44 Because the protein concentration in these studies is low, there should be a relatively low concentration of protein dimers in solution. With the 317 nm theta emitters, less than 9% of the total protein ion signal corresponds to the β-lactoglobulin dimer. However, the dimer abundance is up to 35% with the 1.7 μm and 4.4 μm emitters (Fig. 4 and Fig. S-1d–f†). We hypothesize that the dimer abundance is related to the presence of multiple protein molecules in large droplets produced by the larger emitters. If the initial droplet diameter is ∼1/17 the diameter of the theta emitter,40 the initial droplet size for the 317 nm theta emitters is about 18 nm (approximating the theta emitter as a single barrel emitter). At this initial droplet size, only 1 out of ∼60 nanodrops that are formed contains a protein molecule. Unless the protein molecule enters the droplet in the dimeric form, it is an extremely low probability event for a droplet to contain two individual protein molecules. Thus, the protein dimer ions from 317 nm theta emitters likely exist as molecular dimers in the bulk solution.The initial droplet diameters of a 1.7 μm and 4.4 μm theta emitter are 100 nm and 261 nm, respectively. A 100 nm nanodrop contains on average slightly fewer than three protein molecules per droplet whereas a 261 nm droplet initially contains about 50 protein molecules. Because the initial droplets may contain more than two protein molecules, the formation of β-lactoglobulin dimer can occur within the droplets as solvent evaporation occurs and the concentration of protein in the shrinking droplets increases. Thus, the extent of dimer ions observed in the nano-ESI mass spectra obtained with 317 nm emitters more accurately reflects the dimer concentrations in the original solution compared to the results from larger emitter sizes when dimers are formed as droplets evaporate during the ESI process.
The abundance of the protein dimers decreases with increasing instrument source temperature. For mass spectra obtained using 4.4 μm theta emitters, the fraction of protein dimer out of total protein ion signals is 30% ± 1%, 24% ± 3%, and 19% ± 1% at source temperatures of 160 °C, 230 °C, and 300 °C, respectively. The decrease in protein dimer abundance with increasing temperature indicates that the protein dimer thermally dissociates into monomers in the droplets. Although dimeric protein ions are also observed in mass spectra obtained for β-lactoglobulin in 10 mM AA and 100 mM ABC using 1.7 μm and 4.4 μm theta emitters, the abundance of protein dimer is much lower than in 100 mM AA (Fig. 3, Fig. S-1a–c and S-3d–i†). Higher ionic strength favors dimer formation.44 The absence of dimer ions with ABC may indicate that the native structures are sufficiently destabilized that the equilibrium disfavors the formation of the dimer in this buffer.
Electrothermal supercharging mechanism
Results from these temperature melt studies provide additional insights into the mechanism of electrothermal supercharging.14,15 Prior results indicate that proteins which have native forms in bulk solution can be rapidly denatured prior to their entrance into the mass spectrometer within the droplets due to a rise in droplet temperature as a result of resistive heating of the droplet induced by higher electrospray voltages.14 The fluorescence results (Fig. 6) provide insights into why the effectiveness of this method depends on buffer identity.To determine how emitter size, source temperature, and buffer identity affect electrothermal supercharging, mass spectra of β-lactoglobulin (10 μM) from 100 mM ABC and 100 mM AA solutions were obtained using 1.7 μm single barrel emitters at three instrument source temperatures at 1.3 kV and 800 V, respectively (Fig. 7 and Fig. S-5†). Single barrel emitters were used in order to more directly compare with previous protein electrothermal supercharging results. As reported previously, very little supercharging occurs in AA regardless of source temperatures (Fig. 7a–c).15 There is a slight increase in the average charge state with increasing source temperature as was observed at lower spray voltages. It is interesting to note that the extent of thermal denaturation of the protein at high source temperature even at 1.3 kV with single barrel emitters is lower than it is with low spray voltage using similar size theta emitters. The difference is likely due to the absence of backing pressure for single barrel emitter, which should result in a shorter droplet lifetime for similar size emitters. Mortensen et al. previously showed that decreasing backing pressure from 10 psi to 5 psi decreases the droplet lifetime by half.23
 | ||
| Fig. 7 Electrospray ionization mass spectra obtained with electrothermal supercharging of 10 μM β-lactoglobulin in 100 mM ABC and 100 mM AA at a spray voltage of 1.3 kV using 1.7 μm single barrel emitters at source temperature 160 °C (a, d), 230 °C (b, e), and 300 °C (c, f). Peaks at slightly higher m/z correspond to lactosyl covalently bound to β-lactoglobulin.46 *Indicates polydimethylsiloxane clusters that are present as an impurity. | ||
Electrothermal supercharging does occur for β-lactoglobulin in ABC at 1.3 kV, and the fraction of unfolded protein increases with increasing source temperature (Fig. 7d–f). These results from the two buffers are consistent with those of previous studies.14,15 The abundances of the +10 and +11 charge states formed at 1.3 kV increase with increasing temperature and appear to correspond to unfolding intermediates. Similar results are obtained with theta emitters at 300 °C and at 1.3 kV spray voltage (Fig. S-6†) indicating that this is not unique to single barrel emitters. The difference observed between purely source temperature induced heating and electrothermal supercharging indicates that the mechanism for electrothermal supercharging may be more complex and involve the kinetics of folding and unfolding. The higher electric field in electrothermal supercharging heats up the droplets outside of the mass spectrometer. Upon entering the ion transfer tube, evaporative cooling would lead to a steady state temperature that would occur in the absence of electrothermal supercharging. This rapid heating and subsequent cooling could trap unfolding intermediates that may not otherwise be observed in conventional heating experiments. Recent ion mobility results exploring unfolding of ubiquitin upon laser heating different size droplets have provided evidence for short-lived unfolding intermediates.45
Conclusions
The lifetime of droplets formed by nano-ESI can be varied between 1 and 50 μs by changing the diameter of theta emitter tips from 317 nm to 4.4 μm. The location of where ions are formed during nano-ESI from buffered aqueous solutions, whether inside or outside of the mass spectrometer, can be determined from the extent to which high charge-state distributions are induced by increasing the electrospray interface temperature. With 317 nm tips, which produce droplets that last about 1 μs, only low charge state ions of β-lactoglobulin are observed at all instrument source temperatures for solutions consisting of ammonium acetate or ammonium bicarbonate. Very few high charge states are observed under basic conditions in which the native form of the protein is destabilized. In contrast, a higher charge-state distribution, indicative of unfolded protein molecules in solution, is observed with 1.7 and 4.4 μm theta emitters and this population increases with temperature. These results indicate that droplets with lifetimes of ∼1 μs do not survive long enough to enter the source inlet capillary and that ions are formed outside of the mass spectrometer. In contrast, droplets formed from micron size emitters with lifetimes ≥10 μs enter the mass spectrometer and are heated inside of the transfer tube prior to ion formation. This can lead to a population of unfolded proteins in solution prior to the formation of gaseous ions. Results from basic solutions in which the native form of the protein is destabilized indicate that the majority of protein ions originating from the larger droplets are formed inside of the mass spectrometer. These results are consistent with the charged residue mechanism for ion formation in native mass spectrometry. Our results also indicate that the assumption that ions are formed at the entrance of the mass spectrometer in kinetic experiments aimed at measuring rates of chemical reactions will lead to errors.A larger temperature effect is observed from larger droplets formed from ammonium bicarbonate compared to ammonium acetate solutions. Results from temperature melt studies show that the native form of β-lactoglobulin is thermally less stable in ammonium bicarbonate buffer. Electrothermal supercharging is also more effective in ammonium bicarbonate than ammonium acetate, consistent with the proposed mechanism of the voltage induced droplet heating that occurs before droplets enter the mass spectrometer.
These studies demonstrate the advantages of preparing droplets with known lifetimes. The use of small tips to produce droplets with short lifetimes has the advantage that the mass spectra obtained under native conditions do not depend on the desolvation temperature used in the mass spectrometer because ions originating from these droplets are formed outside of the mass spectrometer. These small tips have the additional advantage that effects of protein dimerization or aggregation that can occur in larger droplets are eliminated when the droplets contain on average much fewer than one protein molecule per droplet. Thus, in addition to the protein desalting effects reported earlier for submicron emitter tips,34,36–38 these small tips should be advantageous for native mass spectrometry by eliminating artifacts of protein aggregation that can occur in droplets and any adverse effects of thermal activation in the ion source.
Conflicts of interest
There are no conflicts to declare.Acknowledgements
This material is based upon work supported by the National Science Foundation Division of Chemistry under grant number CHE-1609866. The authors are also grateful for financial support from CALSOLV and thank Dr Moitrayee Bhattacharyya for helpful discussions on the fluorescence results.References
- L. Konermann, E. Ahadi, A. D. Rodriguez and S. Vahidi, Anal. Chem., 2013, 85, 2–9 CrossRef CAS PubMed.
- P. Kebarle and U. H. Verkerk, Mass Spectrom. Rev., 2009, 28, 898–917 CrossRef CAS PubMed.
- M. Wilm, Mol. Cell. Proteomics, 2011, 10, M111.009407 CrossRef PubMed.
- J. V. Iribarne and B. A. Thomson, J. Chem. Phys., 1976, 64, 2287–2294 CrossRef CAS.
- I. G. Loscertales and J. Fernández De La Mora, J. Chem. Phys., 1995, 103, 5041–5060 CrossRef CAS.
- M. Dole, L. L. Mack, R. L. Hines, D. O. Chemistry, R. C. Mobley, L. D. Ferguson and M. B. Alice, J. Chem. Phys., 1968, 49, 2240–2249 CrossRef CAS.
- B. E. Winger, K. J. Light-Wahl, R. R. Ogorzalek Loo, H. R. Udseth and R. D. Smith, J. Am. Soc. Mass Spectrom., 1993, 4, 536–545 CrossRef CAS PubMed.
- H. Metwally, Q. Duez and L. Konermann, Anal. Chem., 2018, 90, 10069–10077 CrossRef CAS PubMed.
- C. J. Hogan, J. A. Carroll, H. W. Rohrs, P. Biswas and M. L. Gross, Anal. Chem., 2009, 81, 369–377 CrossRef CAS PubMed.
- S. K. Chowdhury, V. Katta and B. T. Chait, J. Am. Chem. Soc., 1990, 112, 9012–9013 CrossRef CAS.
- R. L. Winston and M. C. Fitzgerald, Mass Spectrom. Rev., 1997, 16, 165–179 CrossRef CAS PubMed.
- I. A. Kaltashov and S. J. Eyles, Mass Spectrom. Rev., 2002, 21, 37–71 CrossRef CAS PubMed.
- U. A. Mirza and B. T. Chait, Int. J. Mass Spectrom. Ion Processes, 1997, 162, 173–181 CrossRef CAS.
- H. J. Sterling, C. A. Cassou, A. C. Susa and E. R. Williams, Anal. Chem., 2012, 84, 3795–3801 CrossRef CAS PubMed.
- C. A. Cassou, H. J. Sterling, A. C. Susa and E. R. Williams, Anal. Chem., 2013, 85, 138–146 CrossRef CAS PubMed.
- X. D. Chillier, A. Monnier, H. Bill, F. O. Gülacar, A. Buchs, S. A. McLuckey and G. J. Van Berkel, Rapid Commun. Mass Spectrom., 1996, 10, 299–304 CrossRef CAS.
- K. Chingin, V. Frankevich, R. M. Balabin, K. Barylyuk, H. Chen, R. Wang and R. Zenobi, Angew. Chem., Int. Ed., 2010, 49, 2358–2361 CrossRef CAS PubMed.
- R. M. Bain, C. J. Pulliam and R. G. Cooks, Chem. Sci., 2015, 6, 397–401 RSC.
- J. K. Lee, S. Kim, H. G. Nam and R. N. Zare, Proc. Natl. Acad. Sci. U. S. A., 2015, 112, 201503689 Search PubMed.
- L. P. Mark, M. C. Gill, M. Mahut and P. J. Derrick, Eur. J. Mass Spectrom., 2012, 18, 439–446 CrossRef CAS PubMed.
- C. M. Fisher, A. Kharlamova and S. A. McLuckey, Anal. Chem., 2014, 86, 4581–4588 CrossRef CAS PubMed.
- D. N. Mortensen and E. R. Williams, Anal. Chem., 2015, 87, 1281–1287 CrossRef CAS PubMed.
- D. N. Mortensen and E. R. Williams, J. Am. Chem. Soc., 2016, 138, 3453–3460 CrossRef CAS PubMed.
- D. N. Mortensen and E. R. Williams, Chem. Commun., 2016, 52, 12218–12221 RSC.
- M. Girod, E. Moyano, D. I. Campbell and R. G. Cooks, Chem. Sci., 2011, 2, 501 RSC.
- E. T. Jansson, Y.-H. Lai, J. G. Santiago and R. N. Zare, J. Am. Chem. Soc., 2017, 139, 6851–6854 CrossRef CAS PubMed.
- S. Zhou, B. S. Prebyl and K. D. Cook, Anal. Chem., 2002, 74, 4885–4888 CrossRef CAS PubMed.
- M. C. C. Shastry, S. D. Luck and H. Roder, Biophys. J., 1998, 74, 2714–2721 CrossRef CAS PubMed.
- D. N. Mortensen and E. R. Williams, Anal. Chem., 2014, 86, 9315–9321 CrossRef CAS PubMed.
- X. Ding, Y. Yang, S. Zhao, Y. Li and Z. Wang, Dairy Sci. Technol., 2011, 91, 213–225 CrossRef CAS.
- C. Bhattacharjee and K. P. Das, Eur. J. Biochem., 2000, 267, 3957–3964 CrossRef CAS PubMed.
- S. G. Anema and A. B. McKenna, J. Agric. Food Chem., 1996, 44, 422–428 CrossRef CAS.
- N. K. Kella and J. E. Kinsella, Biochem. J., 1988, 255, 113–118 CrossRef CAS PubMed.
- Z. Xia and E. R. Williams, J. Am. Soc. Mass Spectrom., 2018, 29, 194–202 CrossRef CAS PubMed.
- D. N. Mortensen and E. R. Williams, Anal. Chem., 2016, 88, 9662–9668 CrossRef CAS PubMed.
- A. C. Susa, Z. Xia and E. R. Williams, Anal. Chem., 2017, 89, 3116–3122 CrossRef CAS PubMed.
- A. C. Susa, Z. Xia and E. R. Williams, Angew. Chem., Int. Ed., 2017, 1–5 Search PubMed.
- A. C. Susa, J. L. Lippens, Z. Xia, J. A. Loo, I. D. G. Campuzano and E. R. Williams, J. Am. Soc. Mass Spectrom., 2018, 29, 203–206 CrossRef CAS PubMed.
- A. Schmidt, M. Karas and T. Dülcks, J. Am. Soc. Mass Spectrom., 2003, 14, 492–500 CrossRef CAS PubMed.
- K. L. Davidson, D. R. Oberreit, C. J. Hogan and M. F. Bush, Int. J. Mass Spectrom., 2017, 420, 35–42 CrossRef CAS.
- L. Konermann, J. Am. Soc. Mass Spectrom., 2017, 28, 1827–1835 CrossRef CAS PubMed.
- E. J. Cohn and J. T. Edsall, Proteins, Amino Acids and Peptides as Ions and Dipolar ions, Reinhold Publishing, New York, 1943 Search PubMed.
- J. A. Gally and G. M. Edelman, Biochim. Biophys. Acta, 1962, 60, 499–509 CrossRef CAS.
- M. Gottschalk, H. Nilsson, H. Roos and B. Halle, Protein Sci., 2009, 12, 2404–2411 CrossRef PubMed.
- T. J. El-Baba, D. W. Woodall, S. A. Raab, D. R. Fuller, A. Laganowsky, D. H. Russell and D. E. Clemmer, J. Am. Chem. Soc., 2017, 139, 6306–6309 CrossRef CAS PubMed.
- J. Leonil, D. Molle, J. Fauquant, J. L. Maubois, R. J. Pearce and S. Bouhallab, J. Dairy Sci., 1997, 80, 2270–2281 CrossRef CAS PubMed.
Footnotes |
| † Electronic supplementary information (ESI) available. See DOI: 10.1039/c8an01824c |
| ‡ The previously reported values from Mortensen et al. were mislabeled as m s−1 instead of the correct unit of mm s−1. |
| This journal is © The Royal Society of Chemistry 2019 |