 Open Access Article
Optimum operating parameters of CO2 sorption in turbulent fluidized bed regime using potassium carbonate supported on gamma alumina solid sorbent
Sutthichai Boonprasopa,
Sasinan Sangteerasintopb,
Benjapon Chalermsinsuwan ac and
Pornpote Piumsomboon
 *ac
*ac
aFuels Research Center, Department of Chemical Technology, Faculty of Science, Chulalongkorn University, 254 Phayathai Road, Patumwan, Bangkok 10330, Thailand. E-mail: pornpote.p@chula.ac.th; Fax: +66-2255-5831; Tel: +66-2218-7676
bDepartment of Chemistry, University of California, Berkeley, CA 94720, USA
cCenter of Excellence on Petrochemical and Materials Technology, Chulalongkorn University, 254 Phayathai Road, Patumwan, Bangkok 10330, Thailand
First published on 27th November 2018
Abstract
The promising solid sorbent, potassium carbonate (K2CO3) supported on gamma alumina (γ-Al2O3) was prepared through impregnation by insertion into the sorption turbulent riser to determine the optimum operating parameters. A sorption temperature of 60 °C, superficial gas velocity of 0.22 m s−1, and initial sorbent loading of 5 g were determined to be the optimum conditions so that 93 percent of the actual loaded K2CO3 could react with CO2 to obtain the highest CO2 sorption capacity at 279.95 mg of CO2/g of K2CO3. 23 factorial design plus center points were used to analyze the result of the main effect and interaction between the operating parameters. The sorption temperature, superficial gas velocity, and sorbent loading all impacted the response parameter. From the obtained interpretation, interaction between sorption temperature and superficial gas velocity, as well as between sorption temperature and initial sorbent loading, portrayed statistically significant effects on CO2 capture capacity. Calculations showed that concentration of treated gas was greatly reduced. This distinguished breakthrough behavior provided a step toward designing a continuous reactor to maximize CO2 capture. However, one major obstacle for this design was the persisting formation of hydrated potassium dawsonite, a side product of conventional heat regeneration.
1 Introduction
Ever since 2014, CO2 content in the atmosphere has been rising over 415 ppm.1 The associated risk imposed upon the environment and human health escalates as the concentration of CO2 in the atmosphere approaches the critical concentration at 580 ppm.2,3 Due to the urgency and high priority for CO2 reduction, CO2 capture and storage (CCS) technology has been adopted by a number of large industrial plants in developed countries.4–7 In the United States, the integration of Carbon Capture, Utilization, and Storage (CCUS) has generated significant revenues from selling CO2 to petroleum companies to increase crude oil yield.8–11The properly commercialized CCUS technology using liquid amine stripper columns and heat regeneration has raised investment costs of a power plant by 15–30 percent.12,13 Due to its high cost, installment of the CCUS was considered to be a burden for medium-scale power plants in developing countries, leading to demands for alternative solutions. The use of dry solid sorbents is a promising technique to increase availability of the CCUS.5
In the literature, the process cost is monitored together with the high adsorption–regeneration performance.14 In the last decade, a large number of publications focused on the characteristics and kinetics of solid alkali carbonates placed inside a porous matrix supporter, specifically potassium carbonate on gamma alumina (K2CO3/γ-Al2O3). This technique had been a recurring topic and results showed that it could potentially address the essential sorbent qualifications.15–18
From characterization results using transmission electron microscopy of γ-Al2O3, the compound had been found to form porous crystalline aggregates.19 Moreover, calcination had demonstrated that K2CO3/γ-Al2O3 exhibited favorable properties. Surface area and pore volume had shown an inverse relationship with calcine temperature, as well as the amount of K2CO3 loaded, whereas the compound's acidity exhibited an inverse relationship with calcine temperature alone.20 Previous studies had also shown that highly dispersed metal particles with small sizes demonstrated favorable activity toward CO2 sorption and activation.21
Based on kinetic studies, CO2 sorption exhibited two major routes. The first route forms KHCO3 while the second forms KAl(CO3)2(OH)2.19 Excellent regeneration properties could be obtained when KHCO3 was the only component formed.20 Zhou et al. suggested that dawsonite formation was discouraged if the sorbent passed through hydrotreatment to obtain K2CO3·1.5H2O phase before entering the sorption process.22,23 The regeneration properties of K2CO3 sorbent, such as sorption capacity after multi-cycles sorption, less regenerative energy and shorter time regeneration, had been improved continuously by many researchers.4,24–27
While development of an appropriate sorbent has been addressed, a configuration of solid sorbent aimed at maximizing both CO2 capture capacity and energy efficiency via utilization of active species is currently being further investigated. Rodríguez-Mosqueda et al. employed K2CO3 on support activated carbon honeycomb to capture CO2 in ambient air at atmospheric pressure. Capture capacity depended on operating parameters such as temperature, moisture, and CO2 content. Erto et al. and Amiri et al. used K2CO3 on support gamma alumina (K2CO3/γ-Al2O3) in fixed bed configuration as a post combustion unit. At sorption temperature of around 60 °C, substantial amount of CO2 was captured.28,29 Jaiboon et al. had found that CO2 capture using K2CO3/γ-Al2O3 capacity was highly dependent on fluidized bed regimes which could be categorized as fixed bed, bubbling, slugging, turbulent, and fast fluidized.30,31 Of the available regimes, turbulent fluidized bed (TFB) provided about 50 percent capture capacity higher than fixed bed. TFB appeared to be the most promising because it possesses high mixing property, exhibits favorable surface contact area triggered by particles and lastly, demonstrates an efficient gas–solid interaction.30,31 Boonprasop et al. showed that both heat and depressurization could be applied for K2CO3/γ-Al2O3 regeneration. The energy intensity of such regeneration was considerably lower than that of liquid amine regeneration.32,33 Qi et al. proposed a new continuous fluidized bed regime called circulating turbulent fluidized bed (CTFB), which possessed the advantages of both TFB and fast fluidization.34 Thammakul et al. and Chalermsinsuwan et al. conducted computational fluid dynamics of circulating fluidized bed configuration under CTFB for CO2 sorption.35–37 Their results showed that sorbent could complete the circulation through three important parts: CO2 sorption in riser, sorbent-gas separation in cyclone and sorbent regeneration in downer.38,39 Sengupta et al. results showed that the circulating fluidized bed configuration could perform as continuous mode.40 The transition flow of CTFB will be a new potential concept for developing an inexpensive compact unit to enhance CO2 sorption and sorbent regeneration.41,42
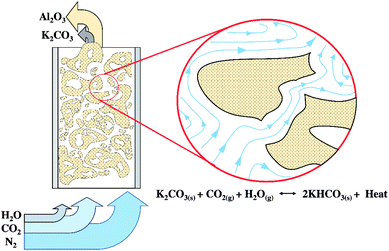
The necessity to further extend the scope of this study was addressed to determine the optimum conditions under TFB as shown in Fig. 1. Since this condition was expected to show high CO2 sorption capacity, however, the rate limiting step was the diffusion of CO2 and water through the sorbent clusters before they could react with the active specie on the sorbent.43 The statistical method could help to optimize the operating condition. The investigated operating parameters consisted of sorbent temperature (Ad. temp., °C), sorbent packing (Ad. packing, g) and superficial gas velocity (Ug, m s−1).
The data obtained from each experimental trial will be plotted as the concentration of CO2 (% volume) versus time (t, s) to show a breakthrough curve and CO2 capture capacity, mass of adsorbed CO2 per mass of active site on sorbent (mg-CO2/g-K2CO3) determined by integrating the area of absence of CO2 with respect to time. The results would be further analyzed by 2k factorial design to indicate the optimum condition of operating parameters as well as to fit regression models of sorption capacity. Lastly, the used sorbent was selected to study the regeneration property using heat regeneration for several cycles.
2 Methodology
This experiment consists of three parts. The first was the preparation of sorbent and an impregnation method to permeate sorbent active sites. This part ended with an enhancement process by calcining the precursor. The second part involved the sorption process. During this process, simulated flue gas, 12 percent of carbon dioxide gas balanced with nitrogen gas, entered a fluidized bed reactor. CO2 was adsorbed in a glass riser characterized by TFB. While some clean gas was vented out, the rest was detected in real time for the concentration of CO2 by a sensor. The last part aimed to study regeneration property of the used sorbent by heat conventional heat regeneration.2.1 Part I: preparation of sorbent by impregnation method
5 g of K2CO3 (QReC, AR grade) and γ-Al2O3 (Merck, activity stage I, average particle diameter of 131 micron) were measured and mixed with 25 mL of distilled water in flasks. The flasks were then placed in a shaker (WiseShake, model SHO-2D) with rotational speed of 230 rpm for 24 hours. The precursor, comprising of the remaining particles on filtration paper, was dehydrated in an oven (Binder, model ED 115) at 105 °C for 24 hours. In the last step, the dry precursor was pulverized and calcined in a furnace (Carbolite, CWF 13) with a heating rate of 3 °C per minute from room temperature to 600 °C and held for up to 3 hours.2.2 Part II: CO2 sorption in fluidized bed riser
Fig. 2 demonstrates a fluidized bed apparatus for CO2 sorption study. A cylinder (a) of the mixed gas with 12 ± 1 percent by volume of CO2 balanced by nitrogen (Thai-Japanese Gas) was controlled by a calibrated rotameter ((b) (Nitto, model K-2014)). The gas first entered the steam generator (c), maintained at a temperature of 60 °C while three-way valve (d) was kept at the position to vent the wet mixing gas to measure its content by an infrared sensor ((e) (CO2 METER, K-33 BLG CO2)). The real time monitoring system showed that the concentration of CO2 was constant at 12 ± 1 percent by volume with 55% RH. After 2 minutes since water content became constant, the vale (d) was twisted to the opposite position to introduce the moisten mixed gas to a sorbent bed in the glass sorption riser ((f) (outer diameter of 0.025 m)). In the riser, the gas–solid flow was characterized in TFB. CO2 was removed according to the following exothermic equilibrium equation:44| K2CO3(s) + CO2(g) + H2O(g) ↔ 2KHCO3(s) + ΔH | (1) |
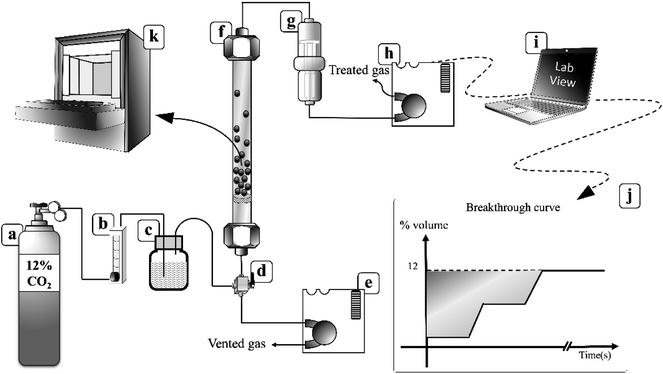 | ||
| Fig. 2 Fluidization sorption system.40 | ||
The freeboard sorbent particles and excess moisture were removed by a filter ((g), (CO2 METER, CM-0103 Extreme conditions moisture Trap and Filter)). The amount of CO2 in the treated gas, which was released from the riser, was then detected by another inferred sensor ((h), CO2 METER, K-33 BLG CO2) with a sampling rate of 1 sample per second. The real-time outputs from the sensor were % RH, gas temperature and percent by volume of CO2. These values were sent to be analyzed and stored by a code developed under the LabVIEW System Design Software ((i), National Instruments). The sorption profiles were obtained as an output from the program. The plot of break-through curves (j) was finished when the concentration of measured gas was equal to its initial concentration. The shaded area between the initial concentration line and the break-through curve were integrated to determine the capture capacity in unit of milligram of CO2 per gram of active site on sorbent (mg-CO2/g-K2CO3) by the following equation:
 | (2) |
The three operating parameters in this experiment consisted of the following: the amount of sorbent packing, ranging from 5–15 grams; the sorption temperature, ranging from 50–70 °C; and lastly, the gas flow rate, ranging from 5–7 liters per minute. The results were ultimately used to determine the optimum operating parameters by 2k factorial design plus center. A constant k was an integer number equating to the number of interested operating parameters, which consisted of sorption temperature (A), gas flow rate (B) and sorbent packing (C). Thus, the k value in this study was 3. The center point condition occurred when two of the operating parameters were fixed at the medium values, while another parameter was varied either to maximum or minimum value.
2.3 Part III: sorbent regeneration
The used sorbent with the optimum condition was collected and loaded into the crucible. Then, it was placed in the muffin furnace ((k), 3100 W power max/1800 W holding power). In each trial of regeneration, temperature was kept constant at 200 °C for 20 minutes. The regenerated sorbent was then reused to perform CO2 sorption under the optimum condition. Several regeneration cycles were conducted in this study. The effect of the optimum condition for CO2 sorption on the regeneration properties was determined through the percent of regeneration and spent sorbent characterization results.3 Results and discussion
3.1 Optimum condition for CO2 sorption
Fig. 3 showed textural properties of support γ-Al2O3 before and after impregnation. The support had a smooth surface with sharp edges while the bare sorbent could be identified as a round particle with a rough surface, as shown in Fig. 3(a) and (b) respectively. The round shape of the sorbent was due to grinding process executed in order to incorporate the support into a K2CO3 solution for a duration of 24 hours. The collision among particles cracked the extended edges and resulted in rounder particles, which enhanced CO2 sorption.45 At low calcination temperature (less than 600 °C), the energy was not high enough to decompose C![[double bond, length as m-dash]](https://www.rsc.org/images/entities/char_e001.gif) O bonding of K2CO3.46 Thus, the rough surface of the sorbent resulted from the impregnation of K2CO3, which was further stabilized by the calcination.
O bonding of K2CO3.46 Thus, the rough surface of the sorbent resulted from the impregnation of K2CO3, which was further stabilized by the calcination.
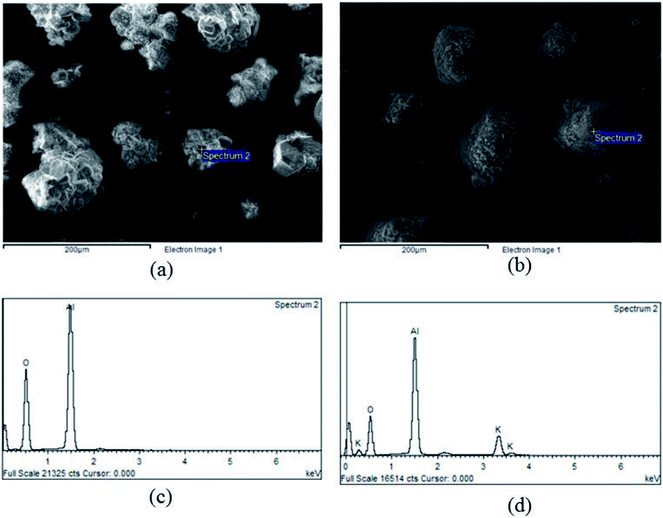 | ||
| Fig. 3 Textural properties of a sorbent before adsorbing CO2, (a) SEM image of γ-Al2O3, (b) SEM image of sorbent, (c) EDX pattern of γ-Al2O3, (d) EDX pattern of sorbent. | ||
The EDX result of support γ-Al2O3 and sorbent was shown in Fig. 3(c) and (d) On the support alumina, only oxygen and alumina peaks were found. The appearance of potassium peaks in Fig. 3(d) confirmed the completion of impregnation. In addition, the area under peaks could be used to estimate the percent loading by weight of K2CO3. After the interpretations of different electron spectrums, the average loading of K2CO3 on γ-Al2O3 was 18% by weight. Thus, it was concluded that agglomeration of active-site K2CO3 might be the cause of the rough surfaces as shown in Fig. 3(b). The average loading percent was confirmed again via X-ray fluorescence (XRF) scanning through the bulk of impregnated sorbent. XRF analysis showed the same values as those obtained from the EDX. The loading percent in this study was a crucial variable that could be used to determine the capture capacity, as seen in eqn (2).
Quantitative study of CO2 capture capacity for various sets of operating parameters are shown in Table 1. From the data, the range of capture capacity varied from 44 to 280 mg-CO2/g of K2CO3. The three selected operating parameters had a strong effect on the CO2 capture capacity of sorbent. Focusing on the column titled “Packing” in Table 1, low sorption capacity (less than 100 mg-CO2/g-sorbent) resulted from sorbent loading larger than 5 g. The effect of sorption temperature was further investigated using the comparison of two pairs of the experiments; the first pair was Run 3 and Run 7, and the second, Run 1 and Run 5. For the first pair, gas flow rate and sorbent loading were kept at the same maximized conditions. The results demonstrated that the higher the temperature, the higher the sorption capacity. In contrast, while the second pair was also subjected to the same manner as the first, different results were obtained. Whereas the capture capacity of the first pair increased as the sorption temperature increased, the second pair showed an inverse result. Thus, it could be inferred that this contradiction was due to interactions among the parameters.
| Run | Ad. temp. (°C) | Ug (m s−1) | Packing (g) | CO2 capture capacity (mg-CO2/g-K2CO3) |
|---|---|---|---|---|
| 1 | 50 | 0.31 | 5 | 249.21 |
| 2 | 50 | 0.31 | 15 | 97.79 |
| 3 | 50 | 0.13 | 5 | 100.66 |
| 4 | 50 | 0.13 | 15 | 44.07 |
| 5 | 70 | 0.31 | 5 | 131.84 |
| 6 | 70 | 0.31 | 15 | 103.73 |
| 7 | 70 | 0.13 | 5 | 149.07 |
| 8 | 70 | 0.13 | 15 | 77.17 |
| 9 | 60 | 0.22 | 10 | 104.99 |
| 10 | 60 | 0.22 | 5 | 279.95 |
| 11 | 60 | 0.22 | 15 | 75.02 |
| 12 | 60 | 0.13 | 10 | 90.78 |
| 13 | 60 | 0.31 | 10 | 96.85 |
| 14 | 70 | 0.22 | 10 | 125.70 |
| 15 | 50 | 0.22 | 10 | 91.12 |
Table 1 also shows that the maximum capture capacity was obtained by Run 10, which was operated on medium values of sorption temperature and a gas flow rate, 60 °C and 0.22 m s−1 respectively, with a minimum sorbent loading of 5 g. The results in Table 1 roughly revealed some details about the main effect of each operating parameter as well as about the interaction between operating parameters, but the data was insufficient to conclude whether each parameter held any statistically significant contribution. Thus, statistical analysis of 23 factorial design plus center points was performed to accomplish the research objective.
Inversion was a method of data transformation applied in this study. The parameters that were relevant to the CO2 sorption capacity were analyzed using the analysis of variance (ANOVA). Table 2 displays an ANOVA of 23 factorial design analysis from the screened parameters obtained from the normal probability plot. The column titled “p-value”, with values less than 0.05, indicated the significance of the studied factors on the CO2 sorption capacity. The main factors and the associated interactions that significantly affected the response parameter are also shown in Table 2. These main factors are sorption temperature (A), superficial gas velocity (B) and sorbent loading (C). The interaction between sorption temperature and superficial gas velocity (AB) and that between the sorption temperature and superficial gas velocity (AC) also show their significant effects on the response. Because there was no curvature effect, the regression model of capture capacity was represented by the multivariate polynomial function as shown in the following section.
 | (3) |
| Sources | Sum of square | Degree of freedom | Mean square | F-value | P-value |
|---|---|---|---|---|---|
| Model | 2.68 × 10⁻⁴ | 6 | 4.47 × 10⁻⁵ | 13.51 | 0.0008 |
| Ad. temp. (A) | 2.34 × 10⁻⁵ | 1 | 2.34 × 10⁻⁵ | 7.07 | 0.0289 |
| Ug (B) | 3.69 × 10⁻⁵ | 1 | 3.69 × 10⁻⁵ | 11.15 | 0.0102 |
| Packing (C) | 1.55 × 10⁻⁴ | 1 | 1.55 × 10⁻⁵ | 46.75 | 0.0001 |
| Ad. temp. + Ug (AB) | 2.33 × 10⁻⁵ | 1 | 2.33 × 10⁻⁵ | 7.02 | 0.0293 |
| Ad. temp. + packing (AC) | 2.10 × 10⁻⁵ | 1 | 2.10 × 10⁻⁵ | 6.35 | 0.0358 |
| Ug + packing (BC) | 8.89 × 10⁻⁶ | 1 | 8.89 × 10⁻⁶ | 2.69 | 0.1399 |
| Curvature | 1.27 × 10⁻⁵ | 1 | 1.27 × 10⁻⁵ | 3.84 | 0.0855 |
| Residual | 2.65 × 10⁻⁵ | 8 | 3.32 × 10⁻⁶ | ||
| Total | 5.76 × 10⁻⁴ | 18 |
The R2 of the regression model of 0.91 revealed a good fit between the results from the experiment and the predicted value obtained from eqn (3).
The assessment of the adequacy of the model was supported by the analysis of normal probability and residual plot as shown in Fig. 4. In the normal plot as shown in Fig. 4(a), all plots were laid on an imaginary straight line. Moreover, the acceptance of the model was confirmed by the residual plot in Fig. 4(b), which showed no obvious pattern in the data distribution.
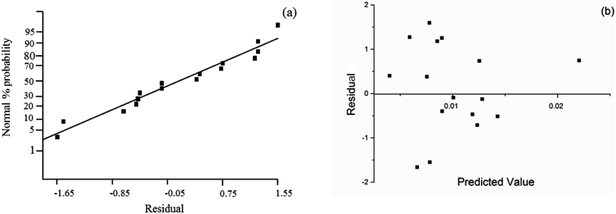 | ||
| Fig. 4 Assessment of the adequacy of regression model, (a) normal probability vs. residual, (b) residual vs. predicted value. | ||
The main effect plots are represented by the plots between the CO2 capture capacity and average value of each individual operating parameters, as shown in Fig. 5. The optimum points, observed in Fig. 5(a) and (b), were influenced by sorption temperature and superficial gas velocity respectively. Sorbent packing showed a trend that differed from those of the first two operating parameters, with increasing sorbent packing having a negative effect on the CO2 capture capacity.
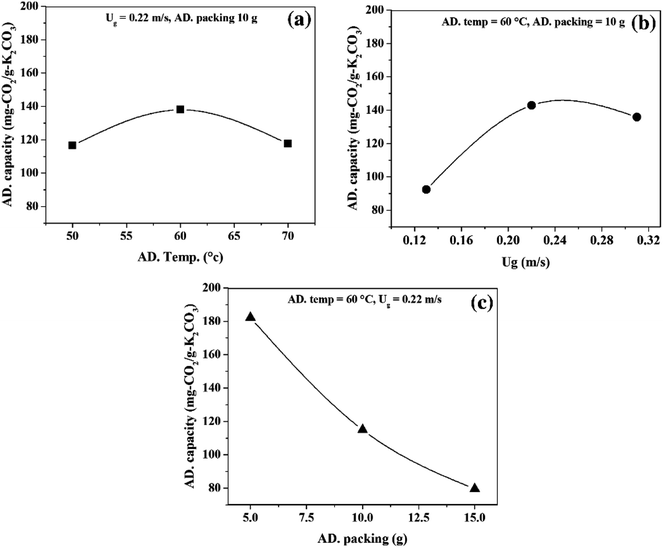 | ||
| Fig. 5 Main effect of operating parameters, (a) effect of sorption temperature, (b) effect of superficial gas velocity, (c) sorbent packing. | ||
Focusing on Fig. 5(a), increasing sorption temperature from 50 °C to 60 °C encouraged CO2 sorption capacity, but once the temperature passed 60 °C to 70 °C, the trend changed in the opposite direction. The concepts of thermodynamics and chemical kinetics of the sorption account for this phenomenon. At the first period of temperature increase, additional heat supplied the system with sufficient kinetic energy, thereby enhancing the gas diffusion through the gas film that covered sorbent particle and also the diffusion of gaseous molecules through the sorbent pore network. In addition, a portion of the energy was used to overcome the activation energy of sorption. However, thermodynamics dominated the sorption process when the sorption temperature was higher than 60 °C.9 Since the sorption was exothermically chemical equilibrium, increase in sorption temperature caused the equilibrium to shift backward. Thus, the CO2 sorption capacity was reduced when the operation was conducted beyond the optimum temperature at 60 °C.
The transport phenomena could be used to explain the optimum superficial gas velocity in Fig. 5(b).43,47 Here, the thickness of gas film resistance was seen to be reduced when velocity of gas increased in the first period. The gas molecule took a shorter time to reach the active site on the support. Thus, the increasing gas velocity from 0.11 m s−1 to 0.22 demonstrated the positive effect on the capture capacity. On the contrary, in the TFB, higher velocity is introduced thus resulting in expansion of the turbulent bed.32 The expansion of the bed at a constant initial sorbent packing was caused by the void between particles.48 This ultimately resulted in low mixing properties, which led to low CO2 capture capacity in the second period of increasing gas velocity. Thus, the result showed the optimal value of superficial gas velocity at 0.22 m s−1 for the maximum CO2 capture capacity.
As seen in Fig. 5(c), higher sorbent packing was characterized by poor mixing properties. Fluidized bed occurred when the summation of upward force (drag force) and buoyancy force is greater than particle weight (downward force). Increasing the amount of sorbent at constant superficial gas velocity reduced the magnitude of upward force acting on the sorbent particles.49 As a result, particles had less mobility. Thus, only a small number of regions in the high packing system could enhance sorption, leaving the rest of the regions with poor performance.
Fig. 6 shows the average breakthrough curve of each operating parameter. The curves depicted the variation of CO2 content of the treated gas with respect to time. The sorption period occurred during the time from 0 to 30 seconds since detection of increasing CO2 concentration and later, CO2 became constant at breakthrough concentration (12 percent by volume). The sorption that occurred in the first 10 seconds was considered to be the most important step because it contributed to about 50 percent of the total CO2 capture capacity. Thus, by focusing on the sorption period, quantitative results on the treated gas and the effects of each operating parameter could be obtained.
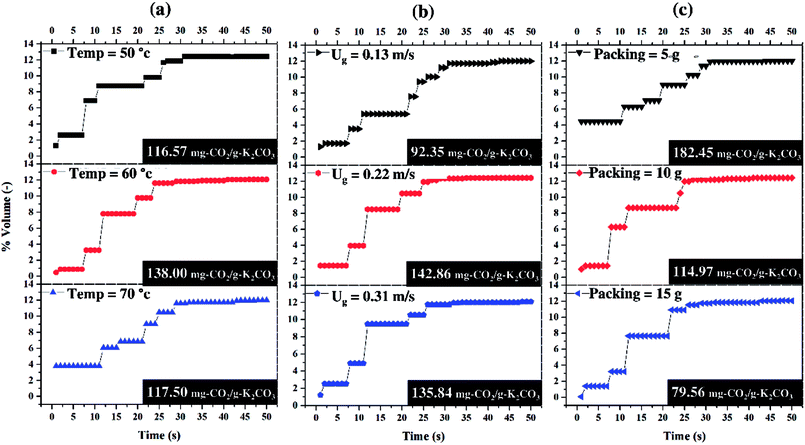 | ||
| Fig. 6 Breakthrough curves of the average main effects, (a) sorption temperature, (b) superficial gas velocity, (c) sorbent packing. | ||
Fig. 6(a) shows the effect of the sorption temperature while the ratio of CO2 feed rate to sorbent packing (F/P) was constant. The effect of the increase in sorption temperature could reduce CO2 content of the treated gas. The concentration of the treated gas at sorption temperature 60 °C was about a half of sorption temperature of 50 °C but the opposite trend occurred when sorption temperature was increased from 60 °C to 70 °C. Therefore, the optimum sorption temperature was required in order to achieve the best condition of treated gas.
Fig. 6(b) shows that CO2 concentration profile in the first 10 seconds was independent from the magnitude of superficial gas velocity (Ug). The effect of increasing Ug (F/P increased) could be seen after the tenth second. At Ug of 0.11 m s−1, there was a certain time period that the concentration of the treated gas was constant for 10 seconds before increasing monotonously until it reached the breakthrough concentration. For the profiles of higher Ug, the CO2 concentration abruptly increased to the breakthrough point. Therefore, Ug was not the recommended operating parameter for improving the treated gas condition. The similar trend of CO2 sorption profiles and total sorption capacities were obtained as the results in Ug of 0.22 and 0.31 m s−1.
Fig. 6(c) shows different trends when sorbent packing was increased or F/P was decreased. It could be seen that with the same amount of CO2 feeding, more sorbent packing leads to less amount of CO2 adsorbed per a unit of sorbent. More sorbent packing was demonstrated to enable lower CO2 capture capacity. From the economical point of view, less sorbent packing utilizes sorbent more effectively. As can be seen from the figure, 5 g of sorbent was 2.3 times the CO2 capture capacity when the sorbent packing was 15 g.
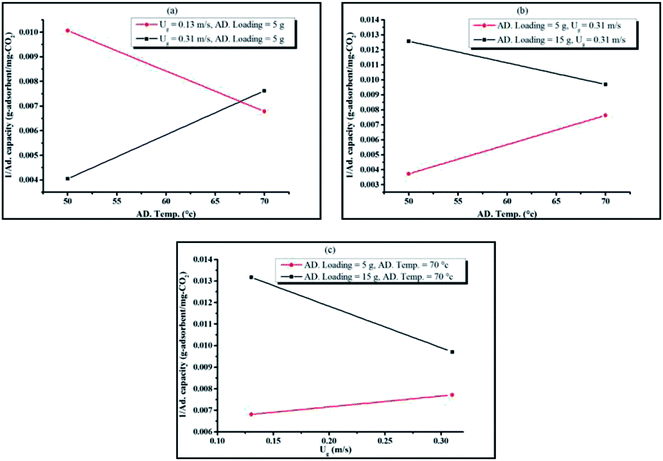
The merit of the ANOVA table was that it could identify the interaction between operating parameters that is statistically significant. Fig. 7(a)–(c) are plots between pairs of operating parameters at their maximum and minimum values versus the inverse of capture capacity, while the other parameters were plotted according to their average values.
The interaction between sorption temperature and superficial gas velocity is shown in Fig. 7(a). At minimum gas velocity, sorption reaction was promoted by the increase in temperature. Once again, mass transport could be appropriately explained by the graphs in Fig. 7(a). Because of the occurrence of a thick film gas layer at lower superficial gas velocity, gas molecules required higher temperature for kinetic energy to diffuse through the resistance film and react with the active site on the sorbent surface. At maximum gas velocity, the thin film gas layer was observed. Under this excess energy at higher temperature, then, the chemical equilibrium shifted backward.
Fig. 7(b) shows the interaction between sorbent loading and sorption temperature. High loading at the constant of gas velocity led to poorer mixing properties. Increasing sorption temperature, though, could compensate for the negative impact of the high sorbent loading system. Due to the additional heat in the system, gas molecules gained more kinetic energy and moved faster at higher temperature. This ultimately increased the probability for CO2 to be captured by K2CO3 on γ-Al2O3.
The results of the interaction between sorbent loading and gas velocity are presented in Fig. 7(c). The gas velocity provided more opportunity for CO2 to be adsorbed due to the reduction of the film layer as well as the better mixing in the turbulent bed. Thus, the enhanced capture capacity was affected by the superficial gas velocity. The figure also showed that the interaction term between sorbent loading and gas velocity slightly improved the CO2 capture capacity when the sorbent loading was higher.
The obtained results then provided fundamental groundwork for the design of a fluidized bed reactor for heterogeneous reactions. The operating parameters played a significant role in the perspectives of transport phenomena, kinetics and thermodynamics. Moreover, it could be used to optimize the system when the system was subjected to increasing superficial gas velocity and sorbent loading.
The highest sorption capacity was 279.95 mg of CO2/g of K2CO3 which was obtained by Run 10 as shown in Table 1. Fig. 8 shows the concentration profile of CO2 with respect to time in the sorption column. Due to the low gas feed rate to sorbent packing ratio, the sorption profile did not show sigmoidal shape as typically shown in fixed bed results. Within the first 19 seconds, 81.2 percent of CO2 was captured by the sorbent. The concentration of treated gas was then equivalent to its initial concentration (12% volume). Calculating the amount of the initial loading of 18 percent active species on the support revealed that the CO2 capacity obtained from Run 10 was about 93 percent of impregnated K2CO3 reacted with CO2. Thus, TFB proved to be efficient in overcoming the limitations of mass transport of heterogeneous reactions.
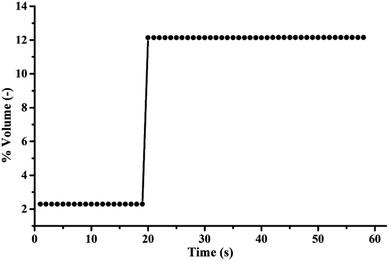 | ||
| Fig. 8 Breakthrough curve of the optimum operating condition (sorption temperature of 60 °C, superficial gas velocity of 0.22 m s−1, sorbent packing of 5 g). | ||
Fig. 9 shows XRD patterns of the sorbent both before and after the sorption in Run 10. The identification of crystalline phases was derived from JCPDS data base.32,33,40 The pattern of fresh sorbent demonstrated the peaks of K2CO3 and γ-Al2O3. After adsorption, species of KHCO3 and potassium dawsonite (KAl(CO3)(OH)2) were found. The appearance of KHCO3 confirmed the completion of the reaction as shown in eqn (1), but the appearance of dawsonite did not. Dawsonite was a common byproduct of the sorption taking place in both fixed bed and fluidized bed systems.
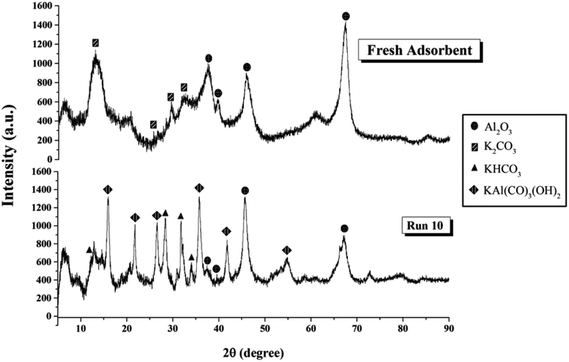 | ||
| Fig. 9 XRD pattern of sorbent before and after CO2 sorption.32,33,40 | ||
The mechanism of dawsonite formation in the sorption process was still not fully understood. Due to its high thermal stability, dawsonite was a major obstacle to sorbent regeneration. There had been several researchers who had successfully improved impregnation to avoid the occurrence of dawsonite. Using the sorbent obtained from those modified impregnation methods in the optimum operating parameters obtained from this study will be a useful information to screen out the potential commercial CO2 sorbent.
Based on the optimum condition, the next step of this field of work will be the understanding of the equilibrium limitations associated with CO2 sorption under TFB. The apparatus as shown in Fig. 2 is a foundation to developing the equilibrium testing apparatus under various fluidized bed regimes. The recirculation system must be installed to recycle the vented gas and sorbent bed. During performance of closed loop CO2 sorption, sorption temperature and pressure will be varied to further investigate equilibrium behavior. The expected output is a set of equation that fully included both kinetic and thermodynamic aspect, which can be a vital step toward a new regeneration method of CO2 capture storage technology.
3.2 Optimum condition for sorbent regeneration
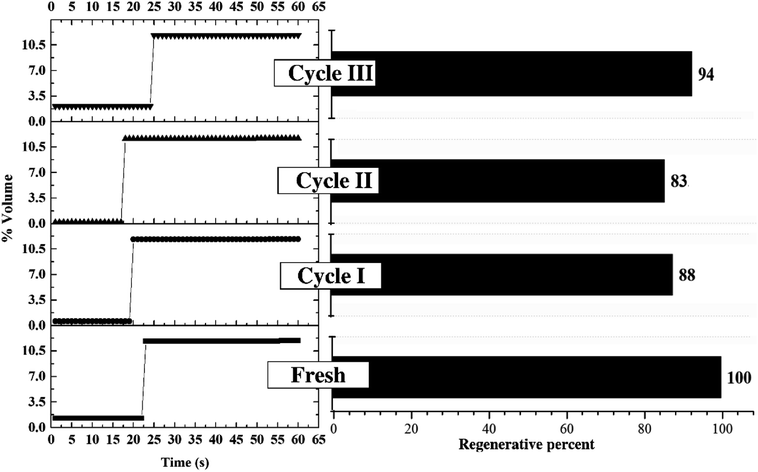
Fig. 10 depicts the performance of regenerated sorbent carried out under the optimum condition. The similar trend of breakthrough curve was found between the results from regenerated sorbents and fresh ones. Only two levels of concentration were reported on each trial of breakthrough curves. Since the sorption continuously took place in the TFB, the outlet concentrations of CO2 were kept constant at low value for 17 to 25 seconds. After sorbent active sites ran out, the outlet concentrations abruptly increased and reached breakthrough concentration in very short time. This unique characteristic on the breakthrough curves occurred due to high ratio of gas feeding to sorbent loading. This could be explained by high mixing property that improved homogeneity of heterogeneous reaction especially sorption reaction. The unique characteristic under optimum condition did not change after multi-regeneration cycles as seen on the breakthrough curves. The bar chart exhibits the regenerative percentage of regenerated sorbent. Therefore, used sorbent under optimum conditions could also be considered as a regenerable sorbent.50 The fluctuation of regenerative percent between 83 to 94 of the fresh sorbent was caused by lingering presence of water after the regeneration which was already explained by Boonprasop et al.32Fig. 11 shows textural properties of the fresh sorbent and spent sorbent after passing through the third regeneration. There were no traces of the inactive species – dawsonite – remaining after regeneration as shown by the XRD pattern of Fig. 11(a). The crystallinity of regenerated sorbent was also similar to that of fresh sorbent such that no broader peak area was found on the regenerated pattern. Fig. 11(b) shows that the major pore distribution was still meso pore and the approximated BET surface area was about the same, at 83 to 84 square meters per gram of sorbent. The characterization results could help to confirm that the sorbent employed under the optimum condition could capture CO2 with high capture capacity, and the spent sorbent could completely be regenerated by conventional heat regeneration.
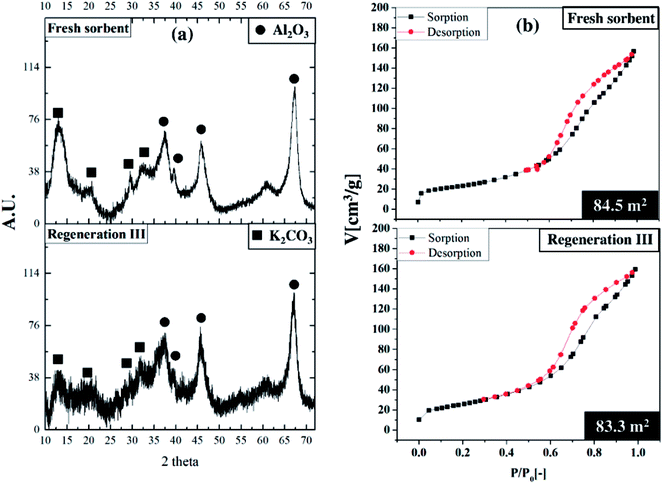 | ||
| Fig. 11 Comparative characterization study, (a) XRD patterns,32,33,40 (b) BET isotherms. | ||
4 Conclusion
Turbulent fluidized bed regime is an attractive method to improve the performance of CO2 sorption via solid sorbent due to its excellent mixing property of gas phase and solid phase. Statistically speaking, 23 factorial design plus center points demonstrated that sorption temperature, superficial gas velocity and sorbent packing all had significant impacts on CO2 sorption capacity. In addition, the interaction between sorption temperature and superficial gas velocity and the interaction between sorption temperature and sorbent packing also affected CO2 sorption capacity. The highest CO2 capacity 279.95 mg of CO2/g of K2CO3 was obtained at the following optimum condition: sorption temperature of 60 °C, superficial gas velocity of 0.22 m s−1, and sorbent loading of 5 g. At this optimum condition, 81.2 percent of CO2 was captured on 93 percent of the impregnated sorbent's active site. CO2 sorption in a turbulent fluidized bed regime obeyed the exothermic equilibrium reaction by converting K2CO3 to KHCO3, but it also produced byproduct (KAl(CO3)(OH)2). However, the spent sorbent could be well regenerated by conventional heat regeneration.Conflicts of interest
There are no conflicts to declare.Acknowledgements
The authors are very appreciative of the Post-Doctoral Scholarship, Chulalongkorn University, the Grant from the Thailand Research Fund (RSA5980052) and the Ratchadapisek Sompoch Endowment Fund, Chulalongkorn University (CU-GR_61-032_23_010) for financial support of this study.References
- G. Richner, G. Puxty, A. Carnal, W. Conway, M. Maeder and P. Pearson, Thermokinetic properties and performance evaluation of benzylamine-based solvents for CO2 capture, Chem. Eng. J., 2015, 264, 230–240 CrossRef CAS.
- M. S. Duyar, A. Ramachandran, C. Wang and R. J. Farrauto, Kinetics of CO2 methanation over Ru/γ-Al2O3 and implications for renewable energy storage applications, J. CO2 Util., 2015, 12, 27–33 CrossRef CAS.
- R. Kishor and A. K. Ghoshal, High molecular weight polyethyleneimine functionalized three dimensional mesoporous silica for regenerable CO2 separation, Chem. Eng. J., 2016, 300, 236–244 CrossRef CAS.
- L. Shan, H. Li, B. Meng, J. Meng, Y. Yu and Y. Min, Improvement of CO2 Capture Performance of Calcium-based Absorbent: Modified with Palygorskite, Chin. J. Chem. Eng., 2016, 24(9), 1283–1289 CrossRef CAS.
- R. Veneman, T. Hilbers, D. W. F. Brilman and S. R. A. Kersten, CO2 capture in a continuous gas–solid trickle flow reactor, Chem. Eng. J., 2016, 289, 191–202 CrossRef CAS.
- V. Hiremath, A. H. Jadhav, H. Lee, S. Kwon and J. G. Seo, Highly reversible CO2 capture using amino acid functionalized ionic liquids immobilized on mesoporous silica, Chem. Eng. J., 2016, 287, 602–617 CrossRef CAS.
- J. F. D. Tapia, J.-Y. Lee, R. E. H. Ooi, D. C. Y. Foo and R. R. Tan, Planning and scheduling of CO2 capture, utilization and storage (CCUS) operations as a strip packing problem, Process Saf. Environ. Prot., 2016, 104, 358–372 CrossRef CAS.
- M. M. F. Hasan, E. L. First, F. Boukouvala and C. A. Floudas, A multi-scale framework for CO2 capture, utilization, and sequestration: CCUS and CCU, Comput. Chem. Eng., 2015, 81, 2–21 CrossRef CAS.
- P. Mocellin, C. Vianello, E. Salzano and G. Maschio, Pressurized CO2 releases in the framework of carbon sequestration and enhanced oil recovery safety analysis: experiments and model, Process Saf. Environ. Prot., 2018, 116, 433–449 CrossRef CAS.
- C. Font-Palma, O. Errey, C. Corden, H. Chalmers, M. Lucquiaud, M. Sanchez del Rio, S. Jackson, D. Medcalf, B. Livesey, J. Gibbins and M. Pourkashanian, Integrated oxyfuel power plant with improved CO2 separation and compression technology for EOR application, Process Saf. Environ. Prot., 2016, 103, 455–465 CrossRef CAS.
- D. C. Y. Foo and R. R. Tan, A review on process integration techniques for carbon emissions and environmental footprint problems, Process Saf. Environ. Prot., 2016, 103, 291–307 CrossRef CAS.
- S. Kongkitisupchai and D. Gidaspow, Carbon dioxide capture using solid sorbents in a fluidized bed with reduced pressure regeneration in a downer, AIChE J., 2013, 59, 4519–4537 CrossRef CAS.
- C. Goel, H. Bhunia and P. K. Bajpai, Novel nitrogen enriched porous carbon adsorbents for CO2 capture: Breakthrough adsorption study, J. Environ. Chem. Eng., 2016, 4, 346–356 CrossRef CAS.
- W. Zhang, H. Liu, C. Sun, T. C. Drage and C. E. Snape, Performance of polyethyleneimine–silica adsorbent for post-combustion CO2 capture in a bubbling fluidized bed, Chem. Eng. J., 2014, 251, 293–303 CrossRef CAS.
- C. Qin, J. Yin, J. Ran, L. Zhang and B. Feng, Effect of support material on the performance of K2CO3-based pellets for cyclic CO2 capture, Appl. Energy, 2014, 136, 280–288 CrossRef CAS.
- J. V. Veselovskaya, V. S. Derevschikov, T. Y. Kardash, O. A. Stonkus, T. A. Trubitsina and A. G. Okunev, Direct CO2 capture from ambient air using K2CO3/Al2O3 composite sorbent, Int. J. Greenhouse Gas Control, 2013, 17, 332–340 CrossRef CAS.
- M. B. Durán-Guevara, J. Ortiz-Landeros, H. Pfeiffer, M. I. Espitia-Cabrera and M. E. Contreras-García, Potassium-based sorbents using mesostructured γ-alumina supports for low temperature CO2 capture, Ceram. Int., 2015, 41, 3036–3044 CrossRef.
- K. Kim, S. Yang, J. B. Lee, T. H. Eom, C. K. Ryu, S.-H. Jo, Y. C. Park and C.-K. Yi, Analysis of K2CO3/Al2O3 CO2 sorbent tested with coal-fired power plant flue gas: effect of SOx, Int. J. Greenhouse Gas Control, 2012, 9, 347–354 CrossRef CAS.
- Y.-x. Pan, C.-j. Liu, T. S. Wiltowski and Q. Ge, CO2 adsorption and activation over γ-Al2O3-supported transition metal dimers: a density functional study, Catal. Today, 2009, 147, 68–76 CrossRef CAS.
- S. C. Lee, Y. M. Kwon, H. J. Chae, S. Y. Jung, J. B. Lee, C. K. Ryu, C. K. Yi and J. C. Kim, Improving regeneration properties of potassium-based alumina sorbents for carbon dioxide capture from flue gas, Fuel, 2013, 104, 882–885 CrossRef CAS.
- J. Kopyscinski, M. Rahman, R. Gupta, C. A. Mims and J. M. Hill, K2CO3 catalyzed CO2 gasification of ash-free coal. Interactions of the catalyst with carbon in N2 and CO2 atmosphere, Fuel, 2014, 117, 1181–1189 CrossRef CAS.
- S. C. Lee, B. Y. Choi, C. K. Ryu, Y. S. Ahn, T. J. Lee and J. C. Kim, The effect of water on the activation and the CO2 capture capacities of alkali metal-based sorbents, Korean J. Chem. Eng., 2006, 23, 374–379 CrossRef CAS.
- C. Zhao, X. Chen and C. Zhao, Carbonation behavior of K2CO3 with different microstructure used as an active component of dry sorbents for CO2 capture, Ind. Eng. Chem. Res., 2010, 49, 12212–12216 CrossRef CAS.
- T.-H. Peng, C.-L. Lin and M.-Y. Wey, Development of a low-temperature two-stage fluidized bed incinerator for controlling heavy-metal emission in flue gases, Appl. Therm. Eng., 2014, 62, 706–713 CrossRef CAS.
- C. Zhao, X. Chen, C. Zhao, Y. Wu and W. Dong, K2CO3/Al2O3 for capturing CO2 in flue gas from power plants. Part 3: CO2 capture behaviors of K2CO3/Al2O3 in a bubbling fluidized-bed reactor, Energy Fuels, 2012, 26, 3062–3068 CrossRef CAS.
- C. Zhao, X. Chen and C. Zhao, K2CO3/Al2O3 for capturing CO2 in flue gas from power plants. Part 2: Regeneration behaviors of K2CO3/Al2O3, Energy Fuels, 2012, 26, 1406–1411 CrossRef CAS.
- C. Zhao, X. Chen and C. Zhao, K2CO3/Al2O3 for capturing CO2 in flue gas from power plants. Part 1: Carbonation behaviors of K2CO3/Al2O3, Energy Fuels, 2012, 26, 1401–1405 CrossRef CAS.
- M. Amiri, S. Shahhosseini and A. Ghaemi, Optimization of CO2 Capture Process from Simulated Flue Gas by Dry Regenerable Alkali Metal Carbonate Based Adsorbent Using Response Surface Methodology, Energy Fuels, 2017, 31, 5286–5296 CrossRef CAS.
- A. Erto, M. Balsamo, L. P. Paduano, A. Lancia and F. Di Natale, Utilization of alumina-supported K2CO3 as CO2-selective sorbent: a promising strategy to mitigate the carbon footprint of the maritime sector, J. CO2 Util., 2018, 24, 139–148 CrossRef CAS.
- O.-a. Jaiboon, B. Chalermsinsuwan, L. Mekasut and P. Piumsomboon, Effect of flow pattern on power spectral density of pressure fluctuation in various fluidization regimes, Powder Technol., 2013, 233, 215–226 CrossRef CAS.
- O.-a. Jaiboon, B. Chalermsinsuwan, L. Mekasut and P. Piumsomboon, Effect of flow patterns/regimes on CO2 capture using K2CO3 solid sorbent in fluidized bed/circulating fluidized bed, Chem. Eng. J., 2013, 219, 262–272 CrossRef CAS.
- S. Boonprasop, B. Chalermsinsuwan and P. Piumsomboon, Effect of the operating parameters on the CO2 capture capacity of potassium carbonate supported on gamma alumina (K2CO3/γ-Al2O3) using conventional heat regeneration, J. Taiwan Inst. Chem. Eng., 2017, 78, 282–289 CrossRef CAS.
- S. Boonprasop, B. Chalermsinsuwan and P. Piumsomboon, Effect of operating parameters of potassium carbonate supported on gamma alumina (K2CO3/γ-Al2O3) on CO2 capture capacity using depressurized regeneration, J. Taiwan Inst. Chem. Eng., 2018, 88, 215–225 CrossRef CAS.
- X. Qi, H. Zhu and J. Zhu, Demarcation of a new circulating turbulent fluidization regime, AIChE J., 2009, 55, 594–611 CrossRef CAS.
- B. Chalermsinsuwan, P. Piumsomboon and D. Gidaspow, A computational fluid dynamics design of a carbon dioxide sorption circulating fluidized bed, AIChE J., 2010, 56, 2805–2824 CrossRef CAS.
- B. Chalermsisuwan, T. Thummakul, D. Gidaspow and P. Piumsomboon, Characterization regime in circulating fluidized bed rector with high solid particle concentration using computational fluid dynamics, Korean J. Chem. Eng., 2014, 31, 350–363 CrossRef.
- T. Thummakul, D. Gidaspow, P. Piumsomboon and B. Chalermsinsuwan, CFD simulation of CO2 sorption on K2CO3 solid sorbent in novel high flux circulating-turbulent fluidized bed riser: parametric statistical experimental design study, Appl. Energy, 2017, 190, 122–134 CrossRef CAS.
- B. Chalermsinsuwan, D. Gidaspow and P. Piumsomboon, In-depth system parameters of transition flow pattern between turbulent and fast fluidization regimes in high solid particle density circulating fluidized bed reactor, Powder Technol., 2014, 253, 522–536 CrossRef CAS.
- B. Chalermsinsuwan, P. Kuchonthara and P. Piumsomboon, CFD modeling of tapered circulating fluidized bed reactor risers: hydrodynamic descriptions and chemical reaction responses, Chem. Eng. Process., 2010, 49, 1144–1160 CrossRef CAS.
- S. Sengupta, V. Amte, A. K. Das, M. Yadav, S. Mandal, S. Nerivetla and H. Bhunia, Circulating Fluid-Bed Studies for CO2 Capture from Flue Gas using K2CO3/Al2O3 Adsorbent, Energy Fuels, 2018, 32, 8594–8604 CrossRef CAS.
- P. Chaiwang, D. Gidaspow, B. Chalermsinsuwan and P. Piumsomboon, CFD design of a sorber for CO2 capture with 75 and 375 mircron particles, Chem. Eng. Sci., 2014, 105, 32–45 CrossRef CAS.
- B. Chalermsinsuwan, P. Kuchonthara and P. Piumsomboon, Effect of circulating fluidized bed reactor riser geometries on chemical reaction rates by using CFD simulations, Chem. Eng. Process., 2009, 165–177 CrossRef CAS.
- S. Boonprasop, D. Gidaspow, B. Chalermsinsuwan and P. Piumsomboon, CO2 capture in a multistage CFB: Part II: Riser with multiple cooling stages, AIChE J., 2017, 63, 5280–5289 CrossRef CAS.
- M. S. Cho, S. C. Lee, H. J. Chae, Y. M. Kwon, J. B. Lee and J. C. Kim, Characterization of new potassium-based solid sorbents prepared using metal silicates for post-combustion CO2 capture, Korean J. Chem. Eng., 2018, 117, 296–306 CAS.
- S. Watanabe, S. Ohsaki, T. Hanafusa, K. Takada, H. Tanaka, K. Mae and M. T. Miyahara, Synthesis of zeolitic imidazolate framework-8 particles of controlled sizes, shapes, and gate adsorption characteristics using a central collision-type microreactor, Chem. Eng. J., 2017, 313, 724–733 CrossRef CAS.
- B. Krupay and Y. Amenomiya, Alkali-promoted alumina catalysts: I. Chemisorption and oxygen exchange of carbon monoxide and carbon dioxide on potassium-promoted alumina catalysts, J. Catal., 1981, 67, 362–370 CrossRef CAS.
- S. Boonprasop, D. Gidaspow, B. Chalermsinsuwan and P. Piumsomboon, CO2 capture in a multistage CFB: Part I: Number of stages, AlChE J., 2017, 63, 5267–5279 CrossRef CAS.
- S. Boonprasop, B. Chalermsinsuwan and P. Piumsomboon, Design Parameters for Performing Circulating Turbulent Fluidization with a Single Feed Stage Fluidized Bed Reactor, Chem. Eng. Technol., 2017, 40, 177–185 CrossRef CAS.
- B. Chalermsinsuwan, S. Boonprasop, P. Nimmanterdwong and P. Piumsomboon, Revised fluidization regime characterization in high solid particle concentration circulating fluidized bed reactor, Int. J. Multiphase Flow, 2014, 66, 26–37 CrossRef CAS.
- Y. C. Park, S.-H. Jo, K.-W. Park, Y. S. Park and C.-K. Yi, Effect of bed height on the carbon dioxide capture by carbonation/regeneration cyclic operations using dry potassium-based sorbents, Korean J. Chem. Eng., 2009, 26, 874–878 CrossRef CAS.
| This journal is © The Royal Society of Chemistry 2018 |

