Janus quantum dot vesicles generated through membrane fusion†
Huimei
Li
,
Aidi
Zhang
,
Ke
Li
,
Wei
Huang
 ,
Yiyong
Mai
 *,
Yongfeng
Zhou
 * and
Deyue
Yan

School of Chemistry and Chemical Engineering, State Key Laboratory of Metal Matrix Composites, Shanghai Key Laboratory of Electrical Insulation and Thermal Ageing, Shanghai Jiao Tong University, 800 Dongchuan Road, Shanghai 200240, China. E-mail: mai@sjtu.edu.cn; yfzhou@sjtu.edu.cn
First published on 13th March 2018
Abstract
This paper reports a non-phase separation method to prepare a novel type of Janus vesicle, which contains different quantum dots (QDs) in its two hemispheres. The Janus vesicles were generated through the fusion of cyclodextrin or adamantane-functionalized hyperbranched polymer vesicles incorporated with QDs, driven by the intervesicular host–guest molecular recognition. Both the vesicle structure and the real-time membrane fusion process were revealed under fluorescence microscopy, by taking advantage of the giant size, great stability, and controllable surface functionality of the hyperbranched polymer vesicles (BPs). More interestingly, a potential magnetically controlled printing application of the Janus vesicles with Fe3O4-containing hemispheres by their monolayer patterning in water was demonstrated, which realized the first “printing” of ordered vesicles.
Introduction
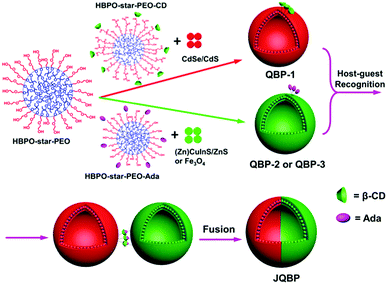
Janus particles are anisotropic objects as they provide asymmetry and can thus impart drastically different chemical or physical properties and directionality within a single particle.1 They have attracted increasing attention in recent years due to their unique properties and potential applications in interfacial stabilizers, biosensors, drug delivery, electronic paper displays, etc.1,2 To date, many kinds of Janus particles have been synthesized, including spheres, cylinders, disks, and vesicles.3 Among them, Janus vesicles (with a hollow sphere structure) have remained much less explored, and only a few successful cases of Janus polymer vesicles have been reported,4 which can be divided into three categories. (1) Vesicles with asymmetric bilayers.4a–f For instance, Eisenberg and coworkers prepared asymmetric block copolymer (BCP) vesicles by co-assembly of polystyrene-b-poly(acrylic acid) (PS-b-PAA) and PS-b-poly(4-vinylpyridine) (PS-b-P4VP), in which the longer PAA chains comprised the outer coronae while the shorter P4VP coils comprised the inner coronae.4a (2) Janus vesicles with chemically different hemispheres.4g Discher and colleagues prepared such vesicles by co-assembly of poly(butadiene)-b-PAA (PB-b-PAA) and PB-b-poly(ethylene oxide) (PB-b-PEO), followed by the addition of Ca2+ cations which induced phase separation through crossbridging PAA blocks.4g (3) Janus hybrid vesicles (or capsules) containing gold nanoparticles (AuNPs) exclusively in one hemisphere and polymers in the other.4h–l For example, Nie and coworkers fabricated such vesicles, by co-assembly of free PEO-b-PS and AuNPs coated with thiol-terminated PEO-b-PS (PEO-b-PS-SH).4k,l To our knowledge, these reported Janus polymer vesicles were formed through the microphase separation of the vesicle-forming components.Here, we report a new type of Janus vesicle, which was obtained via a non-phase separation method. The preparation involved two steps (Scheme 1). First, functional polymer vesicles (QBPs) with fluorescent quantum dots (QDs) incorporated in the membrane and molecular recognition groups of β-cyclodextrin (CD) or adamantane (Ada) on the surface were prepared by the co-assembly of amphiphilic hyperbranched multiarm copolymers (HBPO-star-PEO + HBPO-star-PEO-CD or HBPO-star-PEO + HBPO-star-PEO-Ada) and different types of QDs (CdSe/CdS, (Zn)CuInS/ZnS or Fe3O4) in aqueous solution. Second, the molecular recognition between the CD-functionalized vesicles (QBP-1) and the Ada-modified vesicles (QBP-2 or QBP-3) through the CD–Ada host–guest interaction drove the coalescence of two individual vesicles; their subsequent fusion led to the formation of Janus vesicles (JQBPs) with two hemispheres containing different QDs, respectively.
JQBPs are different from previously reported Janus polymer vesicles. First, the formation mechanism is unique. JQBPs are formed through vesicle recognition and fusion rather than microphase separation. Second, the vesicular structure is different. The reported Janus vesicles show chemistry differences on the coronae or surface, while JQBPs bear an intrinsic discrepancy inside the bilayer. Third, JQBPs contain two different QD hemispheres, which has never been documented and thus represents a novel type of Janus vesicle.
Results and discussion
The HBPO-star-PEO copolymers were synthesized by self-condensing cationic ring-opening polymerization (SCROP), which involved first the synthesis of the HBPO core and then the grafting of PEO arms around the core.5 The synthesis and characterization of the hyperbranched polymers are shown in the ESI† (Experimental section and Fig. S5–S9). The detailed structural parameters of the HBPO and HBPO-star-PEO copolymers, including the degree of branching (DB), the molar ratio of the PEO arms to the HBPO core (RA/C), and the number-average molecular weights (Mn), are listed in Table 1. HBPO-star-PEO copolymers are widely known to self-assemble into giant vesicles, denoted as branched-polymersomes (BPs), which consist of a hydrophobic HBPO wall and hydrophilic PEO coronae;5,6 the mean diameters of the BPs can be controlled in the range of 200 nm to 100 μm by adjusting RA/C.5 The grafting ratios of the CD groups in HBPO-star-PEO-CD and Ada groups in HBPO-star-PEO-CD and HBPO-star-PEO-Ada are calculated to be ∼11% and ∼15%, respectively, based on the 1H NMR spectra (Table 1).| Sample | DBa (%) | R A/C | M n (g mol−1) | PDIc | Grafting ratiod (%) |
|---|---|---|---|---|---|
| a The degree of branching (DB) of the HBPO core was calculated according to the equation DB = (D + T)/(D + L + T),7 where D, L, and T represent the integral areas of the carbon atoms in the dendritic, linear, and terminal units in the quantitative 13C NMR spectrum (Fig. S5, ESI), respectively; all the copolymer samples possess the same HBPO core. b The molar ratios of the PEO arms to the HBPO core were calculated from the 1H NMR spectra (Fig. S6–S8, ESI). In the sample names HBPO-star-PEOn, the subscript n represents RA/C. c Number-average molecular weight and polydispersity index (PDI) were obtained from GPC measurements against a polystyrene standard; the single-peak GPC curves of the samples are shown in Fig. S9 (ESI). d The grafting ratios of CD and Ada were determined by 1H NMR (Fig. S10 and S11, ESI). | |||||
| HBPO | 0.42 | — | 4200 | 1.2 | — |
| HBPO-star-PEO2 | — | 2 | 6000 | 1.3 | — |
| HBPO-star-PEO4 | — | 4 | 9100 | 1.3 | — |
| HBPO-star-PEO10 | — | 10 | 14![[thin space (1/6-em)]](https://www.rsc.org/images/entities/char_2009.gif) 000 000 |
1.2 | — |
| HBPO-star-PEO2-CD | — | 2 | — | — | 11 |
| HBPO-star-PEO4-Ada | — | 4 | — | — | 15 |
The CdSe/CdS QDs coated with oleic acid, oleylamine and trioctylphosphine (TOPO) were synthesized essentially following procedures described in the literature.8 Transmission electron microscopy (TEM) images showed a nearly spherical feature for the QDs (Fig. 1a). Statistics of ca. 200 QDs in the TEM micrographs give an average diameter of 9.6 ± 0.7 nm with a narrow size distribution (Fig. S12, ESI†). High-resolution TEM (HRTEM) images reveal high crystallinity with lattice fringes through the whole particle for the CdSe/CdS QDs (inset in Fig. 1a). The ultraviolet-visible (UV-Vis) spectrum shows an absorption maximum in THF at ca. 615 nm (Fig. S13, ESI†).8 Moreover, the CdSe/CdS QDs give a narrow photoluminescence (PL) spectrum with the emission maximum at ca. 620 nm (Fig. 1d) in THF, which corresponds to a red light emission.
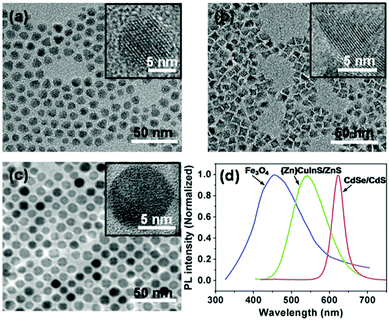 | ||
| Fig. 1 Typical TEM images of CdSe/CdS QDs (a), (Zn)CuInS/ZnS QDs (b) and Fe3O4 nanoparticles (c). The insets in (a)–(c) are the HRTEM images of the QDs. (d) PL spectra of the QDs in THF. | ||
The (Zn)CuInS/ZnS QDs coated with 1-dodecanethiol, oleic acid and stearic acid were prepared following reported procedures.9 TEM images unveil a pyramidal shape for the QDs (Fig. 1b),9 which have an average size of 8.3 ± 1.3 nm (determined by the average edge lengths of pyramids) with a narrow size distribution (Fig. S14, ESI†). The HRTEM images reveal high crystallinity for the QDs (inset in Fig. 1b). Similar to previous reports, no sharp absorption peak is observed in the UV-Vis spectrum (Fig. S15, ESI†).9 The QDs exhibit a broad PL emission with the maximum at ca. 550 nm (Fig. 1d), corresponding to a green light emission upon excitation.
The Fe3O4 nanoparticles with oleic acid ligands were synthesized according to reported procedures.10 The TEM micrographs reveal that the nanoparticles have a spherical shape with a nearly monodisperse size distribution and an average diameter of 9.0 ± 0.6 nm (Fig. 1c and Fig. S16, ESI†). The HRTEM images show distinct lattice fringe patterns, indicating a crystalline nature (inset in Fig. 1c). The UV-Vis spectrum manifests no sharp absorption (Fig. S17, ESI†).10a The Fe3O4 nanoparticles in THF exhibit a quite broad PL spectrum with the maximum at ca. 450 nm (Fig. 1d), which locates in the wavelength window of blue light.
The QD-incorporated BPs (QBPs) were prepared by the co-self-assembly of HBPO-star-PEO, HBPO-star-PEO-CD or HBPO-star-PEO-Ada, and QDs, through the film rehydration method, which is a frequently used strategy for the preparation of polymer vesicles.11 The recipes for QBP-1–3 are listed in Table S1 in the ESI.† Taking the preparation of QBP-1 as an example, HBPO-star-PEO2 (the subscript 2 denotes RA/C = 2), HBPO-star-PEO10, HBPO-star-PEO2-CD and CdSe/CdS QDs were mixed together in THF, followed by the removal of the solvent to produce a polymer/QD hybrid film, and then direct rehydration of the film generated functional QBP-1 vesicles. The QBP-1 vesicles possess a hydrophobic HBPO wall and hydrophilic PEO coronae grafted with CD groups (Fig. 1). Due to the hydrophobicity of the CdSe/CdS QDs and their sizes of around ∼10 nm suitable for the thickness of the HBPO wall (10–20 nm) of HBPO-star-PEO vesicles,5a,c the QDs could be spontaneously incorporated into the HBPO wall of QBP-1 so as to reduce their contact with water and thus decrease the total energy of the system. HBPO-star-PEO2 tends to form giant vesicles but with a limited stability in water.5a Thus, a suitable amount of HBPO-star-PEO10 with a better hydrophilicity was co-assembled into the QBP-1–3 vesicles in order to enhance their stability in aqueous solution (Table S1, ESI†).
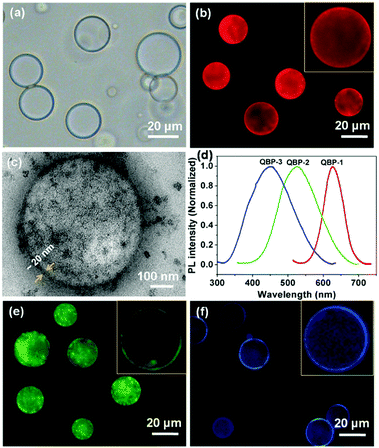
The average diameter of QBP-1, based on the statistics of ca. 200 vesicles in the optical micrographs (Fig. 2a), is 23.3 ± 7.0 μm (Fig. S18, ESI†). Under fluorescence microscope, QBP-1 vesicles show strong red fluorescence due to the incorporation of the CdSe/CdS QDs that can emit red fluorescence upon excitation (Fig. 2b). The obvious decrease in fluorescence intensity from the periphery to the center of the spheres confirms the vesicular morphology with a hollow cavity (inset of Fig. 2b). The TEM image further validates the formation of the hybrid vesicles, in which densely distributed nanoparticles are clearly seen in the vesicle wall (Fig. 2c). In addition, the wall thickness of ∼20 nm was directly measured from the TEM image (Fig. 2c). QBP-1 in aqueous solution exhibits a PL spectrum with the emission maximum at ca. 620 nm (Fig. 2d), which is basically identical to that of the CdSe/CdS QDs (Fig. 1d), indicating no apparent influence of the incorporation of the QDs on their PL wavelength range.
Akin to QBP-1, QBP-2 was prepared by co-assembly of HBPO-star-PEO2, HBPO-star-PEO10, HBPO-star-PEO4-Ada and (Zn)CuInS/ZnS QDs through the same film rehydration method (recipe in Table S1, ESI†). Fluorescence micrographs of QBP-2 clearly show green vesicles (Fig. 2e), due to the incorporation of the (Zn)CuInS/ZnS QDs in the wall. The formation of the QD vesicles was confirmed by TEM observation (Fig. S19, ESI†).
QBP-2 possesses an average diameter of 20.4 ± 8.4 μm (Fig. S20, ESI†) and a wall thickness of ∼20 nm. QBP-3 vesicles contain Fe3O4 nanoparticles in the wall and emit blue fluorescence upon excitation (Fig. 2f); they bear an average diameter of 21.0 ± 7.3 μm (Fig. S21, ESI†) and a wall thickness of ∼20 nm. For both QBP-2 and QBP-3 in aqueous solution, their normalized PL spectra appear highly similar to those of the corresponding QDs, respectively (Fig. 2d). Thus, QBP-2 and QBP-3 emit green and blue fluorescence upon excitation, the same as those from the (Zn)CuInS/ZnS and Fe3O4 QDs before incorporation, respectively. In QBP-1–3, slight aggregation of the QDs was observed, which could not be avoided in our experiments. The reason is probably due to the incompatibility between QDs and the HBPO cores of the BPs.
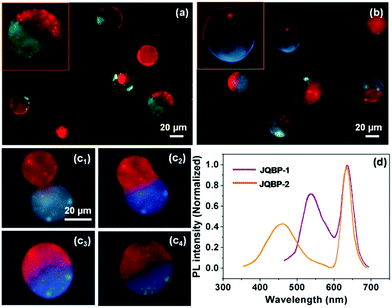
The Janus QBPs (JQBPs) were prepared by simply mixing individual aqueous solutions of the two types of the above-discussed QBPs (QBP-1/QBP-2 or QBP-1/QBP-3). Previously, we proved that BPs decorated with CD (CD-BPs) or Ada groups (Ada-BPs) could fuse with each other after coalescence through the intervesicular CD–Ada host–guest recognition.5c,d Thus, we believed that the association and fusion between the CD- and Ada-functionalized QBPs driven by the CD–Ada molecular recognition could also occur and generate JQBPs, as shown in Scheme 1. As expected, after mixing the QBP-1 and QBP-2 solutions, Janus vesicles (JQBP-1) with a half in red and the other half in green were clearly observed under a fluorescence microscope upon blue light excitation (Fig. 3a). As direct evidence, Fig. S22 (ESI†) shows a real-time fusion process of QBP-1 and QBP-2, revealing the formation mechanism of JQBP-1. The red-fluorescent QBP-1 and green-fluorescent QBP-2 fused together after their coalescence, eventually forming JQBP-1.
The average diameter of JQBP-1 was measured to be 37.3 ± 9.0 μm (Fig. S23, ESI†), which is slightly smaller than twice the mean diameter of QBP-1 or QBP-2. This is reasonable in terms of the calculation based on the equation, 4/3πRj3 = 4/3πR13 + 4/3πR23, where Rj < R1 + R2; Rj, R1, and R2 express the average radii of the Janus vesicles, QBP-1 and QBP-2, respectively. On the other hand, statistics of ca. 200 vesicles in the fluorescence photographs revealed that the number percentage of JQBP-1 increased with the aging of the QBP-1 and QBP-2 mixed solution and reached a plateau value of ∼71% after gentle stirring for ca. 6 hours (Fig. S24, ESI†). Then, the number percentage remained stable. It was found that the number percentage of JQBP-1 was affected by the concentrations of QBP-1 and QBP-2 (Fig. S24, ESI†). The value of 71% was reached when the concentrations of QBP-1 and QBP-2 were about 10 mg mL−1. A decrease in the vesicle concentration led to an apparent decrease of the number percentage of JQBP-1, while increasing the vesicle concentration (e.g. to 15 mg mL−1) also resulted in the decrease of the number percentage of JQBP-1 along with the formation of some patchy vesicles by more than two-cycle fusions of QBP-1 and QBP-2. The content of CD or Ada groups in the QBPs also influenced the formation of the JQBPs. If the grafting ratios of CD and Ada groups were increased to 20% while keeping the same recipes for QBPs, a number of patchy vesicles were formed. In contrast, a decrease in the grafting ratios of CD and Ada groups resulted in only a small amount of Janus vesicles.
Similarly, JQBP-2 was prepared by mixing the aqueous solution of QBP-1 and that of QBP-3. The resultant vesicles exhibited a half in red originating from QBP-1 and the other half in blue originating from QBP-3 upon purple light excitation under a fluorescence microscope (Fig. 3b). The average diameter of JQBP-2 is 36.1 ± 8.6 μm (Fig. S25, ESI†), which is also slightly smaller than twice the mean size of QBP-1 or QBP-3. Fig. 3c shows a real-time fusion process of the red- fluorescent QBP-1 and blue-fluorescent QBP-3 to form JQBP-2. The number percentage of JQBP-2 reached a plateau of ∼68% after mild stirring of the vesicle mixed solution for ca. 6 hours (Fig. S26, ESI†). The number percentage of JQBP-2 was also affected by the concentrations of QBP-1 and QBP-3 (Fig. S26, ESI†).
The formation of the JQBPs is highly related to the restricted mobility of QDs inside the membrane of the BPs. Taking JQBP-2 as an example (Fig. 3c), when QBP-1 with CdSe/CdS QDs and QBP-3 with Fe3O4 QDs fused with each other, the CdSe/CdS and Fe3O4 QDs anchored inside the vesicle membrane rather than diffused throughout the whole membrane due to the rigidness and large size of the QDs, which ensured the formation of the Janus QD vesicles. After the fusion, the two different classes of QDs settled in the two hemispheres without diffusion for around one week until the vesicles precipitated and collapsed because of gravity. As a control experiment, we also attempted the preparation of Janus vesicles by the fusion of red-fluorescent CD-BPs incorporated with Nile red in the wall and green-fluorescent Ada-BPs with dansyl chloride in the wall. Different from QDs, these organic dyes are much smaller and more diffusible in the vesicle membrane. In sharp contrast, after the fusion of the red-fluorescent CD-BPs and the green-fluorescent Ada-BPs, vesicles with overlapped yellow fluorescence rather than Janus structures were obtained (Fig. S27, ESI†). Evidently, this difference is attributed to the quick diffusion of Nile red and dansyl chloride throughout the membrane of the fused vesicle. The control experiment by mixing red vesicles containing CdSe/CdS QDs with green vesicles containing dansyl chloride was also conducted. It was interesting to find the formation of Janus vesicles with a hemisphere emitting red fluorescence and the other half emitting weak green fluorescence (Fig. S28, ESI†). This result further confirmed that the QDs anchored inside the vesicle membrane without diffusion, while the dansyl chloride molecules were speculated to diffuse throughout the membrane although their weak green color was screened by the strong red fluorescence from QDs.
The PL properties of the JQBPs in aqueous solutions were examined. Interestingly, the PL spectra of both JQBP-1 and JQBP-2 exhibit two emission peaks (Fig. 3d), which are highly analogous to the sum of the PL spectra of the corresponding two types of incorporated QDs, respectively. This result manifests that the emissions of the two types of QDs inside the JQBPs do not interfere with each other, and no fluorescence resonance energy transfer (FRET) occurs, which is ascribed to the fact that the two classes of QDs separate from each other by their localization in different hemispheres of the JQBPs. The fluorescence emission of the JQBPs was stable, and the PL intensities only reduced slightly with the aging of the vesicle solutions for around 10 hours (Fig. S29 and S30, ESI†).
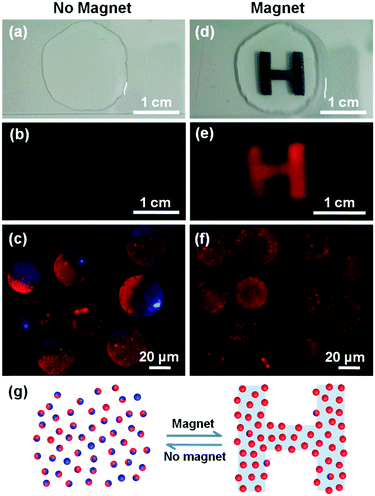
As pointed out by Granick et al., it has been a great challenge to “print” order into colloidal particles that remain suspended in liquids.12a Only very few studies achieved the controlled printing of colloidal particles.12a Grzybowski and coworkers had developed a magnetic-mould technique to print beautiful arrays of complex microstructures from colloidal objects driven by the paramagnetic solution above the patterning of magnetic fields, in which the solution becomes in fact part of the mould.12b So far, printing order into vesicles has not been achieved as yet. To this end, we demonstrated a potential application of JQBPs in magnetically controlled printing by using an aqueous solution rather than a paramagnetic solution and by taking advantage of their Janus feature and giant size (the experiment details are given in page S24, ESI†). We dropped a small amount of concentrated JQBP-2 aqueous solution on the surface of a glass slide (Fig. 4a), which emitted an emanative and weak red fluorescence (Fig. 4b) with the Janus vesicles randomly distributed in water upon UV excitation (Fig. 4c). When an H-shaped magnet was placed under the glass slide (Fig. 4d), the JQBP-2 vesicles spontaneously patterned into a red-fluorescent letter “H” upon UV excitation (Fig. 4e). Fluorescence microscopy observation revealed that the JQBP-2 vesicles in the pattern were arranged in an orderly fashion with their Fe3O4-containing hemispheres facing down and red CdSe/CdS QD hemispheres facing up (Fig. 4f). After the withdrawal of the magnet, the fluorescent “H” letter gradually vanished as the Janus vesicles lost their ordered arrangement and distributed randomly in water again. The display and fading of the letter in response to the presence and absence of the magnet were reversible as shown in Fig. 4g, and the transition process required around 2.5 minutes (see the supporting video, ESI†). Moreover, the display pattern could be varied by altering the shape of the magnet (Fig. S31, ESI†), indicating that the printing pattern of the Janus vesicles was not only reversible but also reconfigurable if a dynamic magnetic field rather than a permanent one was applied.
It should be noted that the advantage of the presented Janus vesicles in magnetically controlled printing is the formation of the monolayer vesicle pattern. The non-magnetic half sphere of JQBPs-2 prohibited the aggregation of the second vesicle layer on the top of the first layer due to the hydration repulsion. In contrast, three-dimensional close packing of vesicles would be formed in the presence of a magnetic field if the vesicles with the whole bilayers encapsulated with Fe3O4 QDs rather than Janus vesicles were used.
Conclusions
In summary, we reported a novel type of Janus vesicle with two hemispheres containing different types of QDs, which emitted photoluminescence of two distinct colors upon excitation. The giant dimensions of the hyperbranched polymer vesicles allowed the real-time observation of the vesicles under a fluorescence microscope, which disclosed a new mechanism for the formation of Janus vesicles through a membrane fusion process. The Janus QD vesicles with a Fe3O4-containing hemisphere were demonstrated in a magnetically controlled reconfigurable printing application. The Janus QD vesicles combining the advantages of polymer vesicles, quantum dots and giant sizes may also find applications in hierarchical self-assembly, external field-driven motion, and cytomimetic chemistry, especially in a real-time and vivid way.Conflicts of interest
There are no conflicts to declare.Acknowledgements
This work was financially supported by National Natural Science Foundation of China (91527304, 21320102006, 51573091, 21474062, 51773115 and 21774076), Program of the Shanghai Committee of Science and Technology (17JC1403400), Program for Shanghai Eastern Scholar, and Program of Shanghai Subject Chief Scientist (15XD1502400).Notes and references
- (a) J. Z. Du and R. K. O'Reilly, Chem. Soc. Rev., 2011, 40, 2402 RSC; (b) F. Wurm and A. F. M. Kilbinger, Angew. Chem., Int. Ed., 2009, 48, 8412 CrossRef CAS PubMed; (c) S. Jiang, Q. Chen, M. Tripathy, E. Luijten, K. S. Schweizer and S. Granick, Adv. Mater., 2010, 22, 1060 CrossRef CAS PubMed; (d) G. Loget and A. Kuhn, J. Mater. Chem., 2012, 22, 15457 RSC; (e) J. Hu, S. X. Zhou, Y. Y. Sun, X. S. Fang and L. M. Wu, Chem. Soc. Rev., 2012, 41, 4356 RSC; (f) A. Walther and A. H. E. Müller, Chem. Rev., 2013, 113, 5194 CrossRef CAS PubMed; (g) F. X. Liang, C. L. Zhang and Z. Z. Yang, Adv. Mater., 2014, 26, 6944 CrossRef CAS PubMed.
- (a) A. Walther and A. H. E. Müller, Soft Matter, 2008, 4, 663 RSC; (b) E. Duguet, A. Désert, A. Perro and S. Ravaine, Chem. Soc. Rev., 2011, 40, 941 RSC; (c) S. N. Yin, C. F. Wang, Z. Y. Yu, J. Wang, S. S. Liu and S. Chen, Adv. Mater., 2011, 23, 2915 CrossRef CAS PubMed; (d) M. Lattuadaa and T. A. Hatton, Nano Today, 2011, 6, 286 CrossRef; (e) Y. H. Feng, J. T. He, H. Wang, Y. Y. Tay, H. Sun, L. F. Zhu and H. Y. Chen, J. Am. Chem. Soc., 2012, 134, 2004 CrossRef CAS PubMed; (f) F. Wang, G. M. Pauletti, J. T. Wang, J. M. Zhang, R. C. Ewing, Y. L. Wang and D. L. Shi, Adv. Mater., 2013, 25, 3485 CrossRef CAS PubMed; (g) X. Pang, C. Wan, M. Wang and Z. Q. Lin, Angew. Chem., Int. Ed., 2014, 53, 5524 CrossRef CAS PubMed.
- (a) Z. Nie, W. Li, M. Seo, S. Q. Xu and E. Kumacheva, J. Am. Chem. Soc., 2006, 128, 9408 CrossRef CAS PubMed; (b) R. F. Shepherd, J. C. Conrad, S. K. Rhodes, D. R. Link, M. Marquez, D. A. Weitz and J. A. Lewis, Langmuir, 2006, 22, 8618 CrossRef CAS PubMed; (c) A. Walther, X. André, M. Drechsler, V. Abetz and A. H. E. Müller, J. Am. Chem. Soc., 2007, 129, 6187 CrossRef CAS PubMed; (d) M. R. Rasch, E. Rossinyol, J. L. Hueso, B. W. Goodfellow, J. Arbiol and B. A. Korgel, Nano Lett., 2010, 10, 3733 CrossRef CAS PubMed; (e) P. A. Beales, J. Nam and T. K. Vanderlick, Soft Matter, 2011, 7, 1747 RSC; (f) Q. Chen, J. K. Whitmer, S. Jiang, S. C. Bae, E. Luijten and S. Granick, Science, 2011, 331, 199 CrossRef CAS PubMed; (g) Z. Rozynek, A. Mikkelsen, P. Dommersnes and J. O. Fossum, Nat. Commun., 2014, 5, 3945 CAS.
- (a) L. B. Luo and A. Eisenberg, Angew. Chem., Int. Ed., 2002, 41, 1001 CrossRef CAS; (b) R. Stoenescu and W. Meier, Chem. Commun., 2002, 3016 RSC; (c) J. Song, L. Cheng, A. Liu, J. Yin, M. Kuang and H. Duan, J. Am. Chem. Soc., 2011, 133, 10760 CrossRef CAS PubMed; (d) P. Chambon, A. Blanazs, G. Battaglia and S. P. Armes, Macromolecules, 2012, 45, 5081 CrossRef CAS; (e) Q. M. Liu, S. Chen, J. Chen and J. Z. Du, Macromolecules, 2015, 48, 739 CrossRef CAS; (f) I. Asano, S. So and T. P. Lodge, J. Am. Chem. Soc., 2016, 138, 4714 CrossRef CAS PubMed; (g) D. A. Christian, A. Tian, W. G. Ellenbroek, I. Levental, K. Rajagopal, P. A. Janmey, A. J. Liu, T. Baumgart and D. E. Discher, Nat. Mater., 2009, 8, 843 CrossRef CAS PubMed; (h) M. Delcea, N. Madaboosi, A. M. Yashchenok, P. Subedi, D. V. Volodkin, B. G. De Geest, H. Möhwald and A. G. Skirtach, Chem. Commun., 2011, 47, 2098 RSC; (i) D. Kohler, N. Madaboosi, M. Delcea, S. Schmidt, B. G. De Geest, D. V. Volodkin, H. Möhwald and A. G. Skirtach, Adv. Mater., 2012, 24, 1095 CrossRef CAS PubMed; (j) Y. Wu, X. Lin, Z. Wu, H. Möhwald and Q. He, ACS Appl. Mater. Interfaces, 2014, 6, 10476 CrossRef CAS PubMed; (k) Y. J. Liu, Y. C. Li, J. He, K. J. Duelge, Z. Y. Lu and Z. H. Nie, J. Am. Chem. Soc., 2014, 136, 2602 CrossRef CAS PubMed; (l) L. Wang, Y. J. Liu, J. He, M. J. Hourwitz, Y. L. Yang, J. T. Fourkas, X. J. Han and Z. H. Nie, Small, 2015, 11, 3762 CrossRef CAS PubMed.
- (a) Y. F. Zhou and D. Y. Yan, Angew. Chem., Int. Ed., 2004, 43, 4896 CrossRef CAS PubMed; (b) Y. Y. Mai, Y. F. Zhou and D. Y. Yan, Small, 2007, 3, 1170 CrossRef CAS PubMed; (c) H. B. Jin, Y. L. Zheng, Y. Liu, H. X. Cheng, Y. F. Zhou and D. Y. Yan, Angew. Chem., Int. Ed., 2011, 50, 10352 CrossRef CAS PubMed; (d) H. B. Jin, Y. Liu, Y. L. Zheng, W. Huang, Y. F. Zhou and D. Y. Yan, Langmuir, 2012, 28, 2066 CrossRef CAS PubMed.
- (a) Y. F. Zhou and D. Y. Yan, Angew. Chem., Int. Ed., 2005, 44, 3223 CrossRef CAS PubMed; (b) Y. F. Zhou and D. Y. Yan, J. Am. Chem. Soc., 2005, 127, 10468 CrossRef CAS PubMed; (c) Y. F. Zhou, W. Huang, J. Y. Liu, X. Y. Zhu and D. Y. Yan, Adv. Mater., 2010, 22, 4567 CrossRef CAS PubMed; (d) W. F. Jiang, Y. F. Zhou and D. Y. Yan, Chem. Soc. Rev., 2015, 44, 3874 RSC.
- C. J. Hawker, R. Lee and J. M. J. Fréchet, J. Am. Chem. Soc., 1991, 113, 4583 CrossRef CAS.
- A. D. Zhang, Y. N. Bian, J. J. Wang, K. Y. Chen, C. Q. Dong and J. C. Ren, Nanoscale, 2016, 8, 5006 RSC.
- A. D. Zhang, C. Q. Dong, L. Li, J. J. Yin, H. Liu, X. Y. Huang and J. C. Ren, Sci. Rep., 2015, 5, 15227 CrossRef CAS PubMed.
- (a) J. Park, K. An, Y. Hwang, J. G. Park, H. J. Noh, J. Y. Kim, J. H. Park, N. M. Hwang and T. Hyeon, Nat. Mater., 2004, 3, 891 CrossRef CAS PubMed; (b) R. J. Hickey, X. Meng, P. Zhang and S. Park, ACS Nano, 2013, 7, 5824 CrossRef CAS PubMed; (c) R. J. Hickey, A. S. Haynes, J. M. Kikkawa and S. Park, J. Am. Chem. Soc., 2011, 133, 1517 CrossRef CAS PubMed.
- (a) G. Beaune, B. Dubertret, O. Clément, C. Vayssettes, V. Cabuil and C. Ménager, Angew. Chem., Int. Ed., 2007, 46, 5421 CrossRef CAS PubMed; (b) A. Blanazs, S. P. Armes and A. J. Ryan, Macromol. Rapid Commun., 2009, 30, 267 CrossRef CAS PubMed; (c) C. Sanson, O. Diou, J. Thévenot, E. Ibarboure, A. Soum, A. Brûlet, S. Miraux, E. Thiaudière, S. Tan, A. Brisson, V. Dupuis, O. Sandre and S. Lecommandoux, ACS Nano, 2011, 5, 1122 CrossRef CAS PubMed; (d) Y. Y. Mai and A. Eisenberg, Chem. Soc. Rev., 2012, 41, 5969 RSC.
- (a) C. Yu, J. Zhang and S. Granick, Nat. Mater., 2014, 13, 8 CrossRef CAS PubMed; (b) A. F. Demirörs, P. P. Pillai, B. Kowalczyk and B. A. Grzybowski, Nature, 2013, 503, 99 CrossRef PubMed.
Footnote |
| † Electronic supplementary information (ESI) available: Materials, experiment details, supporting figures and calculations, etc. See DOI: 10.1039/c8qm00059j |
| This journal is © the Partner Organisations 2018 |


