The role of caffeine as an inhibitor in the aggregation of amyloid forming peptides: a unified molecular dynamics simulation and experimental study
Bhanita Sharma,
Sourav Kalita,
Ashim Paul,
Bhubaneswar Mandal and
Sandip Paul
 *
*
Department of Chemistry, Indian Institute of Technology, Guwahati, India. E-mail: sandipp@iitg.ernet.in; Fax: +91 361 258 2349; Tel: +91 361 258 2321
First published on 3rd August 2016
Abstract
Alzheimer’s disease is a devastating neurodegenerative disease triggered by the aggregation of amyloid-β peptide (Aβ) into amyloid fibrils. From the results of several studies it is believed that caffeine can prevent the development of Alzheimer’s disease. However, the molecular mechanism of the therapeutic potential of caffeine is largely unknown. In our study, we have investigated the effect of caffeine on the aggregation of amyloid-β derived switch-peptide by varying the stoichiometric ratio of caffeine to peptide. Our molecular dynamics study of peptides in pure water show the formation of a β-sheet conformation, which is prevented to a large extent in the presence of a 10![[thin space (1/6-em)]](https://www.rsc.org/images/entities/char_2009.gif) :
:![[thin space (1/6-em)]](https://www.rsc.org/images/entities/char_2009.gif) 1 or greater ratio of caffeine to peptide. The experimental results demonstrate that caffeine can inhibit the formation of β-sheets by interacting with the peptide aromatic moiety. A detailed molecular dynamics analysis of the inhibition of peptide aggregation by caffeine further revealed that caffeine molecules form hydrogen bonds with peptides thereby weakening the interstrand hydrogen bonds between the peptides. The self-aggregated caffeine clusters form a hydrophobic environment around the hydrophobic residues of the peptides, and physically block them from interacting with each other.
1 or greater ratio of caffeine to peptide. The experimental results demonstrate that caffeine can inhibit the formation of β-sheets by interacting with the peptide aromatic moiety. A detailed molecular dynamics analysis of the inhibition of peptide aggregation by caffeine further revealed that caffeine molecules form hydrogen bonds with peptides thereby weakening the interstrand hydrogen bonds between the peptides. The self-aggregated caffeine clusters form a hydrophobic environment around the hydrophobic residues of the peptides, and physically block them from interacting with each other.
1 Introduction
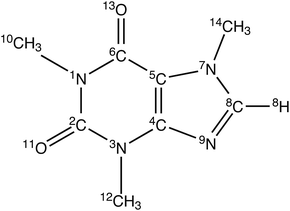
Neurodegenerative disorders typically result in a range of debilitating cognitive impairments including confusion, disorientation, loss of motor skills, and memory loss. The molecular origin of several neurodegenerative diseases including Alzheimer’s disease, Parkinson’s disease, Huntington’s disease and prion protein diseases has been associated with the aggregation of proteins into amyloid fibrils.1–5 In particular, Alzheimer’s disease (AD) is the most common form of dementia that is affecting more than 44 million people worldwide. The pathology of AD is characterized by the appearance of two types of aggregates in the brain: (1) extracellular amyloid plaques (Aβ peptides), and (2) intracellular neurofibrillary tangles (tau proteins). Compelling evidence has indicated that Aβ aggregation is critical for neurodegeneration. This suggests that inhibition of Aβ aggregation would be suitable as an effective therapeutic strategy for the treatment of AD. A number of aggregation inhibitors which have been shown to potentially cope with the disease have unfortunately been found to confer many side effects in clinical trials. A variety of peptides, biopolymers, and many non-peptidic small molecules such as metal complexes, surfactants, nanoparticles, and sulfonated dyes such as Congo red and its derivatives, have been reported to inhibit Aβ fibrilligenesis.6–13 However, inorganic nanoparticles and sulfonated dyes have often been found to be toxic and some of them are carcinogenic, which make them less feasible to develop into drugs.14 Another big problem is the transportation of the inhibitors through the blood–brain barrier (BBB). The BBB is the homeostatic defense mechanism against pathogens and toxins. It determines whether or not a given drug (unless lipid soluble, small (<600 Da), electrically neutral and weakly basic), can reach the central nervous system (CNS), limiting the brain penetration by polymers.Therefore, many recent studies have focussed mainly on the development of a drug which is safe, readily available, passes through the BBB and can protect or delay the progress of AD. Several preclinical studies on humans have suggested that daily caffeine intake, equivalent to 3 or more cups of coffee, protects against age-related memory impairment and AD. Several research studies on AD transgenic mice have shown that caffeine significantly decreases the level of Aβ amyloid and slows down or prevents the development of β amyloid plaques both in ther brain and in the blood of mice that were exhibiting symptoms of the disease.15–18 Another study revealed that caffeine intake is beneficial in mice that already developed tau deposits similar to those seen in humans.19 On the other hand, caffeine (see Fig. 1) is a widely consumed psychoactive substance and acts as a central nervous system stimulant. It is also extensively used as a drug for different pharmacological diseases. Caffeine is inherently safe, naturally produced by several plants, inexpensive and normally found in the diet. Due to caffeine’s unhindered traversal of the BBB, oral intake of caffeine rapidly acts on the central nervous system and brain tissues. All these findings suggest a possible role for caffeine in therapeutic utility against AD.
Physicochemical properties such as conformational constrains, hydrophobicity, net charge and aromatic stacking interactions of aromatic residues play a key role in aggregation of normally soluble proteins into insoluble amyloid aggregates. Different experimental studies have revealed that a notable frequent occurrence of aromatic residues in different amyloid-related peptides raises the possibility that these aromatic residues play a significant role in the amyloid formation process. Amyloid fibril formation is basically a process of intermolecular recognition. π-stacking interaction can provide specific directionality and orientation by the specific pattern of stacking leading to an ordered amyloid structure. In our earlier study in which we investigated the early stages of aggregation of Aβ-derived switch-peptides, we observed that aromatic stacking of phenylalanine (Phe) residues occurs prior to aggregate formation, and ultimately leads to the formation of amyloid fibrils.20 This hypothesis (regarding the key role of π-stacking interaction) postulates that drugs that can block π-stacking interaction may inhibit the formation of amyloid. Different theoretical and experimental studies have shown that caffeine molecules form complexes with different biomolecules, DNA, and drug molecules with π-stacking interaction.21,22 The caffeine molecule also self-aggregates in aqueous solution and its aromatic ring plays a central role in the formation of high-order caffeine clusters.23–27 Therefore, the caffeine molecule seems to be a potential candidate as an inhibitor of amyloid, and can act as a potent drug controlling amyloid disease. Thus, in this work, we attempted to explore the effect of caffeine on protein aggregation and to understand the underlying mechanism of caffeine action. Since, the Aβ peptide exhibits a high propensity for spontaneous aggregation, the initial stages of oligomer formation are difficult to characterize. Mutter’s group have introduced conformational switch-peptides by incorporation of an intramolecular O to an N-acyl migration-based molecular switch that allows the controlled initiation of a folding process even in highly amyloidogenic polypeptides.28 Therefore, to understand the effect of caffeine on amyloid aggregation and the mechanism and mode of caffeine action we have used a switch peptide (SwP) which contains two Phe rings in its side chain.20 The amino acid sequence of the SwP is as follows:
AcSLSLHQKLVFFSEDVSLGNH2 (Son or switch-on state).
AcSLSLHQKLVFF(H+)SEDVSLGNH2 (Soff or switch-off state).
In SwP the hydrophobic core of Aβ, which comprises of residues 14–24 (HQKLVFFSEDV), is flanked by two (Leu–Ser)n oligomers. From our previous investigation of the early stages of aggregation of Aβ-derived SwP, the kinetics of the conversion of peptide has been accomplished.20 In this report we have described a mechanistic investigation on aggregation of SwP in the absence and presence of variable stoichiometric ratios of caffeine and peptide by a combination of molecular dynamics simulation and experimental study. This article is organized as follows: details of the computational study, including the Models and Simulation Method, and Results and Discussions are presented in Section 2. Section 3 deals with the experimental study consisting of Experimental design, and Results and analyses. Our Conclusions are outlined in Section 4.
2 Computational study
2.1 Models and simulation method
The caffeine solute was modeled by using an AMBER generated all atom force field as used in our previous study.23 For the SwP (Son or switch-on state) the ff99SB force field parameters were used,29 and the popular extended simple point-charge (SPC/E) model was employed for water molecules.30The initial configurations of the systems were prepared using the Packmol program.31 At first, five fully stretched SwP were randomly placed and immersed in a cubic box of water with sufficient separation between them. It has already been reported in earlier studies that the inhibition action of inhibitors on protein aggregation is sensitive to the stoichiometric ratio of the peptide and inhibitors. Moreover, for small molecule inhibitors, such stoichiometries range up to thousands of inhibitor molecules to one protein.32,33 Therefore, to understand the effect of caffeine on the aggregation of SwP on a molecular basis, we have prepared systems with a regime of caffeine![[thin space (1/6-em)]](https://www.rsc.org/images/entities/char_2009.gif) :
:![[thin space (1/6-em)]](https://www.rsc.org/images/entities/char_2009.gif) peptide stoichiometric ratio. Since small molecule inhibitors inhibit protein aggregation by forming aggregates with like molecules,34,35 we have, therefore, kept the concentration of caffeine just above the solubility limit (0.1 M), where it can form self-aggregated caffeine clusters.23,24 To the initial structures of five SwP in water we varied the number of caffeine molecules, and an overview of different systems considered in this study is presented in Table 1. The molecular dynamics (MD) simulations were conducted using the AMBER 12 package36 in the isothermal isobaric (NPT) ensemble. All simulations were subjected to energy minimization for 5000 steps, with the first 2500 steps in the steepest descent method followed by an equal number of steps in the conjugate gradient method. The systems were then heated gradually by increasing the temperature from 0 to 300 K over 180 ps in a canonical ensemble (NVT). The Langevin dynamics method was used to maintain the desired temperature.37 All the simulations were then equilibrated for 5 ns in an isothermal–isobaric ensemble (NPT) at 1 atm pressure, followed by a 95 ns production run in the NPT ensemble. A Berendsen’s barostat38 with a pressure coupling constant of 2 ps was used to maintain the physical pressure. The short-ranged van der Waals (vdw) interactions were calculated using the switching function, with a cutoff radius of 10 Å. The long-ranged electrostatic interactions were calculated using the particle mesh Ewald method.39 Bonds involving hydrogens were constrained by use of the SHAKE algorithm.40
peptide stoichiometric ratio. Since small molecule inhibitors inhibit protein aggregation by forming aggregates with like molecules,34,35 we have, therefore, kept the concentration of caffeine just above the solubility limit (0.1 M), where it can form self-aggregated caffeine clusters.23,24 To the initial structures of five SwP in water we varied the number of caffeine molecules, and an overview of different systems considered in this study is presented in Table 1. The molecular dynamics (MD) simulations were conducted using the AMBER 12 package36 in the isothermal isobaric (NPT) ensemble. All simulations were subjected to energy minimization for 5000 steps, with the first 2500 steps in the steepest descent method followed by an equal number of steps in the conjugate gradient method. The systems were then heated gradually by increasing the temperature from 0 to 300 K over 180 ps in a canonical ensemble (NVT). The Langevin dynamics method was used to maintain the desired temperature.37 All the simulations were then equilibrated for 5 ns in an isothermal–isobaric ensemble (NPT) at 1 atm pressure, followed by a 95 ns production run in the NPT ensemble. A Berendsen’s barostat38 with a pressure coupling constant of 2 ps was used to maintain the physical pressure. The short-ranged van der Waals (vdw) interactions were calculated using the switching function, with a cutoff radius of 10 Å. The long-ranged electrostatic interactions were calculated using the particle mesh Ewald method.39 Bonds involving hydrogens were constrained by use of the SHAKE algorithm.40
| System | Ncaff | NSwP | Nwat | Ccaff (M) | caffeine![[thin space (1/6-em)]](https://www.rsc.org/images/entities/char_2009.gif) : :![[thin space (1/6-em)]](https://www.rsc.org/images/entities/char_2009.gif) SwP SwP |
Box length (Å) | ρ (g cm−3) |
|---|---|---|---|---|---|---|---|
| S0 | 0 | 5 | 4200 | 0 | — | 50.52 | 0.98 |
| S1 | 15 | 5 | 4200 | 0.19 | 3![[thin space (1/6-em)]](https://www.rsc.org/images/entities/char_2009.gif) : :![[thin space (1/6-em)]](https://www.rsc.org/images/entities/char_2009.gif) 1 1 |
50.91 | 0.99 |
| S2 | 50 | 5 | 15![[thin space (1/6-em)]](https://www.rsc.org/images/entities/char_2009.gif) 000 000 |
0.17 | 10![[thin space (1/6-em)]](https://www.rsc.org/images/entities/char_2009.gif) : :![[thin space (1/6-em)]](https://www.rsc.org/images/entities/char_2009.gif) 1 1 |
77.46 | 1.00 |
| S3 | 80 | 5 | 25![[thin space (1/6-em)]](https://www.rsc.org/images/entities/char_2009.gif) 000 000 |
0.17 | 16![[thin space (1/6-em)]](https://www.rsc.org/images/entities/char_2009.gif) : :![[thin space (1/6-em)]](https://www.rsc.org/images/entities/char_2009.gif) 1 1 |
92.22 | 0.99 |
| S4 | 100 | 5 | 25![[thin space (1/6-em)]](https://www.rsc.org/images/entities/char_2009.gif) 000 000 |
0.20 | 20![[thin space (1/6-em)]](https://www.rsc.org/images/entities/char_2009.gif) : :![[thin space (1/6-em)]](https://www.rsc.org/images/entities/char_2009.gif) 1 1 |
92.61 | 0.99 |
2.2 Results and discussions
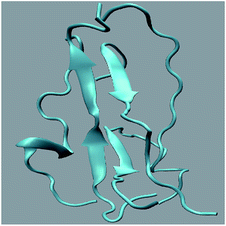
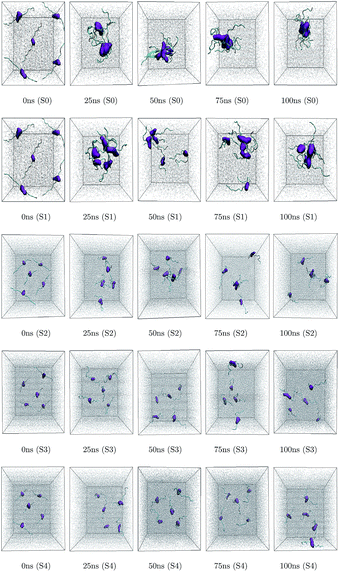
Different proteins have been reported to form amyloid fibrils. A combination of different steps ultimately leads to the formation of the fibrils. In the initial stage, protein monomers self-assemble and oligomers are formed. These oligomers finally evolve into mature amyloid fibrils by β-sheet formation. Due to the long chain length of the SwP with 18 amino acids present, and as we started by placing them randomly in the simulation box without any constrains, the formation of the ordered β-sheet structure was the least expected in MD simulations. However, we observed the formation of anti-parallel β-sheets in the final state of the oligomer formation of peptides for system S0 (see Fig. 2). This indicates the highly amyloidogenic nature of SwP in pure water. To probe the time evolution of peptide aggregation, we have shown the distribution of cluster sizes of peptide with simulation time for all of the systems (see Fig. 3). The two peptides were considered to form clusters when residues of one peptide were within 7 Å of the residues of another peptide. We observed that in a pure water system all five peptides aggregate and form stable clusters of size 5 after a 30 ns simulation run. In the presence of caffeine in system S1, we still observed cluster formation and breaking throughout the simulation. However, with an increase in the caffeine number in the system, the aggregate formation tendency of caffeine decreased, and in systems S3 and S4, the peptide existed as monomers at 100 ns. To probe the initial stages of SwP aggregation, we have shown snap-shots of all the systems at a fixed time interval (see Fig. 4). The hypothesis of aromatic stacking of Phe residues of SwP prior to aggregate formation was well established in our previous study.20 In system S0, we also noticed aromatic interactions between the Phe residues of the peptides, which ultimately led to aggregation. This observation is in accordance with our earlier study.20 However, in system S1, the interactions between the Phe residues were hindered to some extent, although the peptide molecules aggregated towards the end of the simulation.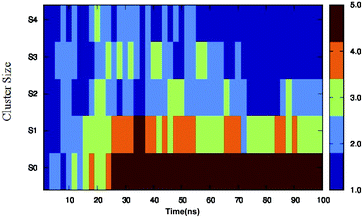 | ||
| Fig. 3 Time evolution of peptide aggregation, shown as the distribution of clusters of different sizes of peptide with simulation time for all of the systems. | ||
On increasing the caffeine![[thin space (1/6-em)]](https://www.rsc.org/images/entities/char_2009.gif) :
:![[thin space (1/6-em)]](https://www.rsc.org/images/entities/char_2009.gif) peptide ratio to 10
peptide ratio to 10![[thin space (1/6-em)]](https://www.rsc.org/images/entities/char_2009.gif) :
:![[thin space (1/6-em)]](https://www.rsc.org/images/entities/char_2009.gif) 1 in system S2, we observed a further restriction in the interaction between the Phe residues as was observed by the aggregation tendency of the peptides. However, some intermolecular peptide–peptide interactions still persisted through other side-chain hydrophobic residues (discussed below). In system S3, all the Phe residues were well separated from each other even up to 100 ns and self-association was restricted. A further increase in the caffeine number prevented the peptide aggregation from the very early stage of simulation. Therefore, we observed that with a 20
1 in system S2, we observed a further restriction in the interaction between the Phe residues as was observed by the aggregation tendency of the peptides. However, some intermolecular peptide–peptide interactions still persisted through other side-chain hydrophobic residues (discussed below). In system S3, all the Phe residues were well separated from each other even up to 100 ns and self-association was restricted. A further increase in the caffeine number prevented the peptide aggregation from the very early stage of simulation. Therefore, we observed that with a 20![[thin space (1/6-em)]](https://www.rsc.org/images/entities/char_2009.gif) :
:![[thin space (1/6-em)]](https://www.rsc.org/images/entities/char_2009.gif) 1 stoichiometric ratio of caffeine, the self-association tendency of SwP decreased significantly. In order to characterize the effect of caffeine on Phe–Phe interaction, we have calculated the radial distribution functions (rdfs) between the intermolecular Phe residues of SwP for all the systems and they are shown in Fig. 5(a). For system S0, the first peak appeared at 5 Å along with a well developed second peak at 10.5 Å. With an increase in the caffeine number in the system, the peak height decreased drastically, and the peak positions shifted to higher distances. This implies that the separation between the Phe residues increases, suggesting blocking of aromatic Phe–Phe interaction in the presence of caffeine. To analyze the conformational changes of the peptides in pure water and in different caffeine solutions, we have shown the dynamics of the secondary structure of peptide and these are shown in Fig. 6(a–e). For system S0, we observed the formation of highly ordered β-sheet conformation (yellow color) from the very early stage of the simulation, which remained intact up to 100 ns. The percentage of the β-sheet structure slightly decreased in the presence of caffeine in system S1, but the system still contained a high amount of β-sheets. With a further increase of the caffeine ratio in systems S3 and S4, the β-sheet formation was negligible. This indicates that a 3
1 stoichiometric ratio of caffeine, the self-association tendency of SwP decreased significantly. In order to characterize the effect of caffeine on Phe–Phe interaction, we have calculated the radial distribution functions (rdfs) between the intermolecular Phe residues of SwP for all the systems and they are shown in Fig. 5(a). For system S0, the first peak appeared at 5 Å along with a well developed second peak at 10.5 Å. With an increase in the caffeine number in the system, the peak height decreased drastically, and the peak positions shifted to higher distances. This implies that the separation between the Phe residues increases, suggesting blocking of aromatic Phe–Phe interaction in the presence of caffeine. To analyze the conformational changes of the peptides in pure water and in different caffeine solutions, we have shown the dynamics of the secondary structure of peptide and these are shown in Fig. 6(a–e). For system S0, we observed the formation of highly ordered β-sheet conformation (yellow color) from the very early stage of the simulation, which remained intact up to 100 ns. The percentage of the β-sheet structure slightly decreased in the presence of caffeine in system S1, but the system still contained a high amount of β-sheets. With a further increase of the caffeine ratio in systems S3 and S4, the β-sheet formation was negligible. This indicates that a 3![[thin space (1/6-em)]](https://www.rsc.org/images/entities/char_2009.gif) :
:![[thin space (1/6-em)]](https://www.rsc.org/images/entities/char_2009.gif) 1 stoichiometric ratio of caffeine to peptide is not sufficient to prevent β-sheet formation, however, a higher stoichiometric ratio of caffeine to SwP can definitely prevent ordered β-sheet formation as well as the aggregation of SwP.
1 stoichiometric ratio of caffeine to peptide is not sufficient to prevent β-sheet formation, however, a higher stoichiometric ratio of caffeine to SwP can definitely prevent ordered β-sheet formation as well as the aggregation of SwP.
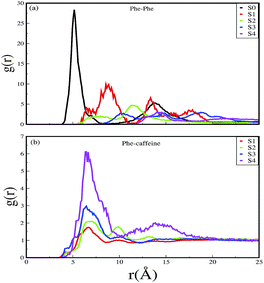 | ||
| Fig. 5 Radial distribution functions of (a) Phe around Phe, and (b) caffeine around Phe for different systems. | ||
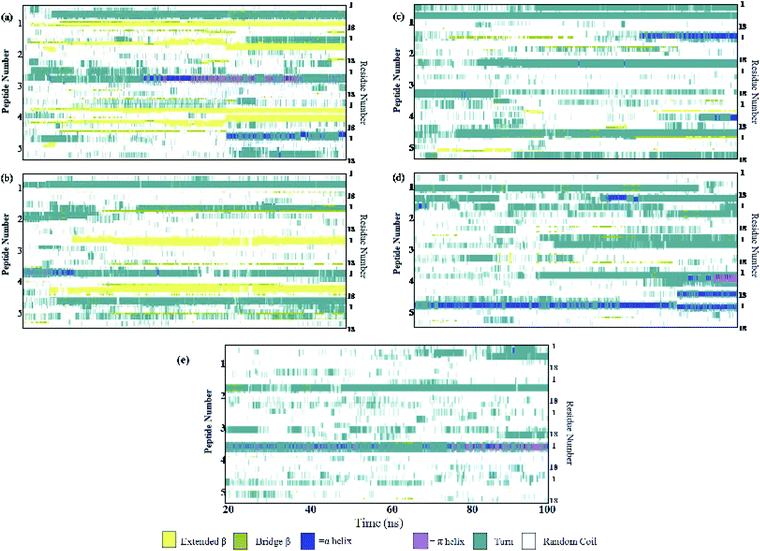 | ||
| Fig. 6 Secondary structure analyses. (a) System S0, (b) system S1, (c) system S2, (d) system S3, and (e) system S4. | ||
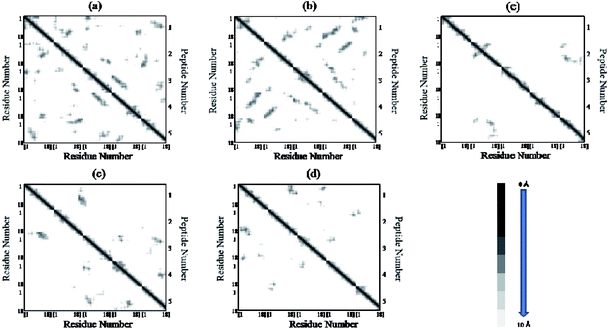
The residue–residue contact maps of peptides for each pair of residues at the final step of simulation are shown in Fig. 7(a–e). The highest inter-peptide contact was observed for system S0. With an increase in the caffeine number, the pairwise inter-peptide residue–residue contact decreased, and in system S4, the inter-peptide contact was negligible.
To examine the energetic aspects of peptide association and the effect of caffeine on it, we have broke down the total inter-peptide and peptide-caffeine interactions in to van der Waals (vdw) and electrostatic components, and these are presented in Table 2. It is apparent that the inter-peptide vdw interaction energy of system S0 is favorable (more negative) in the absence of caffeine. With an increase in the caffeine number, this vdw energy increased (less negative), which indicates a less favorable interaction between the peptides. In contrast, the average intermolecular electrostatic energy did not change much in all the systems. Furthermore, with an increase of the caffeine![[thin space (1/6-em)]](https://www.rsc.org/images/entities/char_2009.gif) :
:![[thin space (1/6-em)]](https://www.rsc.org/images/entities/char_2009.gif) peptide stoichiometric ratio, both vdw and electrostatic components of caffeine–peptide interaction energy became more and more favorable.
peptide stoichiometric ratio, both vdw and electrostatic components of caffeine–peptide interaction energy became more and more favorable.
| Systems | vdwSwP–SwP | ElectrostaticSwP–SwP | vdwSwP–caff | ElectrostaticSwP–caff |
|---|---|---|---|---|
| S0 | −158.48 | −2101.26 | — | — |
| S1 | −119.22 | −2098.58 | −96.31 | −44.26 |
| S2 | −74.76 | −2003.43 | −228.36 | −121.44 |
| S3 | −58.56 | −1988.35 | −299.31 | −171.23 |
| S4 | −41.95 | −1986.44 | −323.12 | −190.14 |
In previous studies of the self-association of proteins it has already been reported that inter-protein hydrogen bonding interactions contribute significantly to the formation and stabilization of β-rich protein structures.41–44 Therefore, to further characterize the protein–protein interaction, we have estimated the average number of intermolecular peptide–peptide H-bonds for all the systems (see Table 3). A hydrogen bond was assigned if the distance between the donor (D) and acceptor (A) atom was less than 3.5 Å, and simultaneously, a maximum 45° angle of H–D–A was considered. The results clearly depict that the average number of intermolecular H-bonds between the peptides decreases rapidly with an increase of the caffeine![[thin space (1/6-em)]](https://www.rsc.org/images/entities/char_2009.gif) :
:![[thin space (1/6-em)]](https://www.rsc.org/images/entities/char_2009.gif) peptide ratio.
peptide ratio.
| System | HBSwP–SwP | HBSwP–caff | SASA (Å2) |
|---|---|---|---|
| S0 | 22.48 | — | 1533.48 (±28.31) |
| S1 | 18.57 | 2.62 | 1765.59 (±32.05) |
| S2 | 8.77 | 6.76 | 2068.52 (±19.10) |
| S3 | 6.02 | 10.24 | 2155.03 (±19.46) |
| S4 | 4.21 | 12.64 | 2173.81 (±13.02) |
A comparison of the time evolution of the inter-peptide hydrogen bond pattern for systems S0 and S4 is shown in Fig. 8. We noticed a sharp increase in the total number of H-bonds between the peptides in system S0 as the simulation progressed, whereas the total inter-peptide H-bonds remained almost constant in system S4 over the entire simulation time. This gives a clear picture of the effect of caffeine in solution. Again, to understand the solvation of peptides in different systems, we have calculated the average solvent accessible surface area (SASA) of the peptide in all the systems and they are shown in Table 3. We observed a large increase in the SASA value for the peptides as we moved from system S0 to S4, which indicates that a greater amount of the surface area of SwP was available for solvation. The results of our earlier study on the amyloid formation of SwP demonstrated that the use of a small amyloid β-breaker penta-peptide, which blocks the major recognition region of peptide containing two Phe residues ultimately diminishes the ability to form stable amyloid structures.20 Here we note that in the presence of caffeine, the inter-peptide Phe–Phe interactions are largely affected (see Fig. 5(a) and the discussions above). Caffeine molecules are known to form complexes with different biomolecules, DNA, drugs and other biologically active molecules by forming aromatic π-stacking interaction. Therefore, in order to understand the underlying mechanism by which the caffeine molecules prevent the peptide oligomer formation, it is important to examine the interaction of caffeine with the peptide. In order to understand the interaction of caffeine with aromatic Phe residues of the peptide, we have calculated the rdfs of caffeine around the Phe residue of SwP for different systems (see Fig. 5(b)). The first peak height of the rdf appeared around 6.5 Å and this peak height increased with an increase in the stoichiometric ratio of caffeine![[thin space (1/6-em)]](https://www.rsc.org/images/entities/char_2009.gif) :
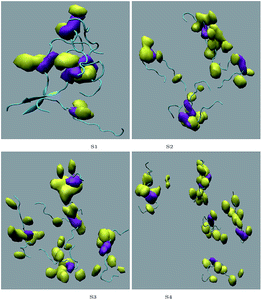
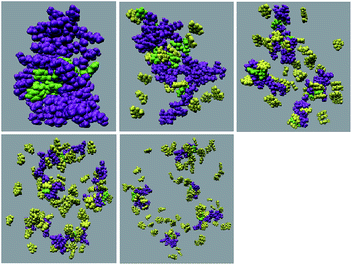
:![[thin space (1/6-em)]](https://www.rsc.org/images/entities/char_2009.gif) peptide reflecting the enhancement of the interaction of caffeine and Phe residues moving from system S1 to S4. The contour density plots of caffeine around SwP within 7.5 Å of the peptide (averaged over the last 10 ns of simulation) for different systems show that the caffeine density (yellow) increased from system S1 to S4 (see Fig. 9). It is also interesting to note that although the contour density of caffeine is higher around Phe residues, we also observed a non-negligible caffeine density around the other residues of the peptides. This indicates that along with the Phe residues, caffeine also interacts with other non-aromatic residues of peptide. It is worth mentioning here that peptides without any aromatic residues have also been reported to form amyloid fibrils, though such structures are formed by larger peptides or over a longer timescale.45 The presence of aromatic residues significantly accelerates the process of fibrillization. Thus, the blocking of these aromatic groups surely delays the amyloid formation. Therefore, along with the blocking of aromatic residues, it is also important for the inhibitors to possess the capability to block the other H-bonding and hydrophobic sites of the peptide so that the inter-peptide interactions can be prevented significantly. It has been reported in the literature that the ability to form promiscuous aggregates is a general property of many small organic molecule inhibitors.34,35,46 Our earlier studies showed that caffeine molecules self-associate in water and form clusters by vertical stacking of one caffeine molecule above another.23,24 The probability of distribution of caffeine clusters of different sizes (mn) with respect to the monomer (m1) is shown in Fig. 10. For this we have considered the geometric criterion as adopted in our previous studies.23,24 It can be noticed that with an increase in the caffeine number, the probability of formation of medium sized clusters of the order of 3 to 10 increased. The probabilities of the formation of cluster sizes greater than 15 was negligible, and therefore they were omitted. In Fig. 11 we have shown snapshots of the last step of the simulation for all of the systems. We observed caffeine clusters around the Phe residues and other hydrophobic residues of the peptide. Here we note that in system S1, although caffeine molecules interacted with Phe residues of the peptide, they were not capable of blocking the peptides from interacting with each other fully, leading to the formation of peptide aggregates. When the caffeine number increased further, medium sized caffeine clusters were formed in large numbers. These caffeine clusters interacted with the Phe residues and the other hydrophobic residues and created a hydrophobic environment around them. Due to the extensive caffeine–peptide interaction, the aromatic Phe residues and all the other hydrophobic residues were blocked from interacting with each other. This led to a significant reduction in the self-assembly formation of the peptides.
peptide reflecting the enhancement of the interaction of caffeine and Phe residues moving from system S1 to S4. The contour density plots of caffeine around SwP within 7.5 Å of the peptide (averaged over the last 10 ns of simulation) for different systems show that the caffeine density (yellow) increased from system S1 to S4 (see Fig. 9). It is also interesting to note that although the contour density of caffeine is higher around Phe residues, we also observed a non-negligible caffeine density around the other residues of the peptides. This indicates that along with the Phe residues, caffeine also interacts with other non-aromatic residues of peptide. It is worth mentioning here that peptides without any aromatic residues have also been reported to form amyloid fibrils, though such structures are formed by larger peptides or over a longer timescale.45 The presence of aromatic residues significantly accelerates the process of fibrillization. Thus, the blocking of these aromatic groups surely delays the amyloid formation. Therefore, along with the blocking of aromatic residues, it is also important for the inhibitors to possess the capability to block the other H-bonding and hydrophobic sites of the peptide so that the inter-peptide interactions can be prevented significantly. It has been reported in the literature that the ability to form promiscuous aggregates is a general property of many small organic molecule inhibitors.34,35,46 Our earlier studies showed that caffeine molecules self-associate in water and form clusters by vertical stacking of one caffeine molecule above another.23,24 The probability of distribution of caffeine clusters of different sizes (mn) with respect to the monomer (m1) is shown in Fig. 10. For this we have considered the geometric criterion as adopted in our previous studies.23,24 It can be noticed that with an increase in the caffeine number, the probability of formation of medium sized clusters of the order of 3 to 10 increased. The probabilities of the formation of cluster sizes greater than 15 was negligible, and therefore they were omitted. In Fig. 11 we have shown snapshots of the last step of the simulation for all of the systems. We observed caffeine clusters around the Phe residues and other hydrophobic residues of the peptide. Here we note that in system S1, although caffeine molecules interacted with Phe residues of the peptide, they were not capable of blocking the peptides from interacting with each other fully, leading to the formation of peptide aggregates. When the caffeine number increased further, medium sized caffeine clusters were formed in large numbers. These caffeine clusters interacted with the Phe residues and the other hydrophobic residues and created a hydrophobic environment around them. Due to the extensive caffeine–peptide interaction, the aromatic Phe residues and all the other hydrophobic residues were blocked from interacting with each other. This led to a significant reduction in the self-assembly formation of the peptides.
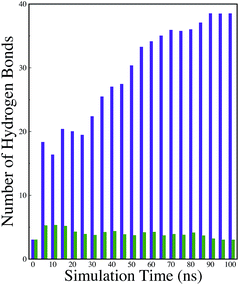 | ||
| Fig. 8 Time evolution of the inter-peptide hydrogen bonds for systems S0 and S4. Indigo represents system S0, and green represents system S4. | ||
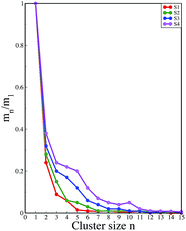 | ||
| Fig. 10 Probability distribution of caffeine clusters of different sizes with respect to the monomer. | ||
In our earlier studies, we have reported that each caffeine molecule has three hydrogen bonding sites that act as hydrogen acceptors.23,24 In order to investigate the formation of H-bonds between caffeine and peptides, we carried out H-bond analyses. The average number of H-bonds between peptides and caffeine increases with an increase in the caffeine stoichiometry (see Table 3). Therefore, the loss of inter-peptide H-bonds (as discussed above) can be attributed to the fact that caffeine binds to the peptide backbone and the side-chain residues through its hydrogen acceptors, thereby weakening the backbone–backbone and side-chain H-bonds between the peptides. This leads to a decrement in the peptide–peptide hydrogen bonding interaction for systems with a higher number of caffeine molecules.
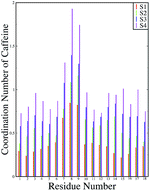
For a quantitative estimation of the number of caffeine moleules in the first solvation shell of the peptide we calculated the number of caffeine molecules around all the residues from the respective pair correlation functions by using the equation:
 | (1) |
3 Experimental study
3.1 Experimental design
1 mg of SwP was weighed and dissolved in 0.9 mL of water containing 0.1% TFA. Then into 5 different sets, 60 μL of the SwP solution was transferred into 5 different vials to prepare 20 μM of SwP. To investigate the inhibitory effect of caffeine on SwP, we performed various qualitative and quantitative analyses in the presence of varied amounts (0, 3, 10, 16, and 20-fold molar excess) of SwP and added the required amount of PBS (50 mM) pH 7.4 at room temperature.3.2 Results and analyses
We have designed SwP, widely known as the functional mimic of Aβ,20,28 in a way that it converts its conformation from a random coil (rc) to a β-sheet conformation, and further aggregates to form amyloid. The formation of amyloid was confirmed by the thioflavin T fluorescence assay and the Congo red stained birefringence study under cross polarized light.20 The SwP converted its conformation from a rc to a β-sheet upon a change in pH i.e. O to N-acyl migration using PBS 7.4 at room temperature, and finally formed a β-sheet. The conversion from the rc to the β-sheet conformation of SwP was monitored by UV and circular dichroism (CD) analyses, and is extensively described in our previous report.20 During the conformational analysis, we observed that the side chain aromatic stacking interaction was faster than the conformational transition, i.e. the aromatic stacking occurred prior to the β-sheet formation. The kinetics of the conformational changes (rc to β-sheet) of the SwP in the absence and presence of caffeine were monitored experimentally using parallel UV and CD studies.The SwP used here contained Phe, which showed an absorption maximum at 257 nm in UV. As the rc to β-sheet transition is associated with the influence of its near-UV and CD spectra due to the π → π* electronic transition of the aromatic side chains, it was also expected to influence the near-UV absorption spectra.47,48 The absorbance due to the amide chromophore was negligible in comparison to the π → π* transition of the aromatic moiety in the near UV region. Hence, a time course measurement of UV absorption at 257 nm of the peptide was compared with the evolution of the CD signal at 220 nm (n → π*) to determine the change in conformation.
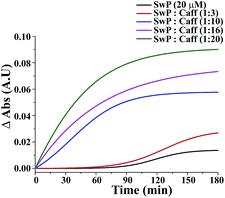
The effect of mixing caffeine in different equivalents with respect to SwP on the onset of β-sheet formation of the peptide (20 μM) is shown in Fig. 13. It shows the change in absorbance at 257 nm along with time in action to the addition of PBS buffer. For 20 μM SwP the absorbance increased with time, which is expected due to the aromatic π–π stacking of the phenyl moiety present in the peptide. But in the presence of the caffeine molecule, the absorbance increased as the concentration of caffeine was increased in comparison to the absorbance of the SwP alone. From the experimental results, it was conveniently seen that the increment of absorbance increased significantly with high doses of caffeine. The increment of absorbance was probably due to the aromatic interaction between the caffeine and the SwP since there was neither change in concentration nor any change in experimental conditions. When, a 3 molar excess of caffeine was present with SwP, the increment of absorbance was less, indicating that interaction between the aromatic ring of caffeine and SwP was also less. However, when the concentration of the caffeine was increased to a 10 molar excess or even more, the absorbance increased sharply, indicating a higher interaction between the aromatic ring of caffeine and the SwP.
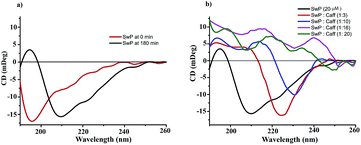
We also studied the CD spectra (190–260 nm) of both SwP and mixtures containing different compositions of SwP–caffeine. Absorption below 240 nm is principally due to the peptide bond, there is a n → π* transition around 220 nm and an π → π* transition around 190 nm, which is due to the β-sheet formation of the peptide.49 It was clear from the CD spectra that SwP (red curve, Fig. 14(a)) had a β-sheet rich conformation after 180 min, whereas at 0 min the CD spectra (black curve, Fig. 14(a)) is characteristic of a rc conformation. From the CD spectra it can be seen that in the presence of caffeine SwP was found to be unstructured from its original β-sheet structure, indicating the deformation of the β-sheet structure formed by SwP. However, in the presence of a 3 molar excess of caffeine (with respect to the SwP), the structure still contained a good amount of the β-sheet, which was not observed in the presence of the other molar excess values of caffeine (i.e. 10 molar excess or even more) studied. From these experimental results it can be concluded that a 3 molar excess of caffeine was not sufficient to disaggregate the β-sheet structure of the SwP, while a 10 molar excess or more of caffeine significantly disaggregated the β-sheet structure of the SwP. We also studied the aggregation inhibitory efficacy of caffeine in aggregating SwP using the standard thioflavin T (ThT) fluorescence assay. The increase in fluorescence intensity of a peptide upon binding with ThT is the characteristic property of fibril formation and the increment in fluorescence intensity is directly proportional to the amount of fibril present.50 The fluorescence intensity of SwP alone was found to increase with time in the absence of the caffeine molecule (black curve, Fig. 15) but was found to be suppressed in the presence of a 16 molar excess or more of the caffeine molecule indicating the inhibitory nature of caffeine molecule, although in the presence of a 3 molar excess and a 10 molar excess of the caffeine molecule a good amount of fibril was noticed in the experimental analysis. The appearance of green gold birefringence under cross polarized light when stained with Congo red dye is a characteristic property of amyloid formation by any amyloidogenic peptide.51 We examined the amyloidogenic nature of the SwP alone and in the presence of caffeine in different concentrations by means of a Congo red stained birefringence study under cross-polarized light after 3 days of sample preparation. The experiment was designed in such a way that the SwP and the SwP–caffeine mixture was incubated in PBS at pH 7.4 at 37 °C for 3 days. We observed a clear green gold birefringence for SwP alone (see Fig. 16), but as a 10 molar excess or more of caffeine was added, the green gold birefringence was absent, indicating complete breaking of the amyloid formed due to the switch conversion of the SwP. Whereas in the presence of a 3 molar excess of caffeine with respect to SwP some green birefringence was observed, which clearly indicates that a 3 molar excess is not sufficient to break the amyloid formed.
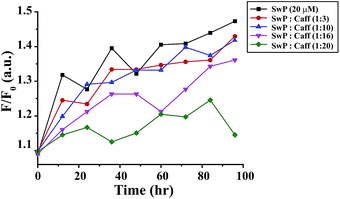 | ||
| Fig. 15 Time dependent ThT assay for SwP in the absence (black) and presence of a 3 fold (red), 10 fold (blue), 16 fold (magenta) and 20 fold (olive) molar excess of caffeine. | ||
4 Conclusions
In this article, we have investigated the effect of caffeine on the aggregation of amyloid-derived switch-peptide with a varied stoichiometric ratio of caffeine to peptide by means of a combination of molecular dynamics simulation and experimental analyses. From the secondary structure analyses of the peptide, we have observed the formation of a highly ordered β-sheet in a pure water system. In the presence of a 3![[thin space (1/6-em)]](https://www.rsc.org/images/entities/char_2009.gif) :
:![[thin space (1/6-em)]](https://www.rsc.org/images/entities/char_2009.gif) 1 caffeine to peptide ratio, the percentage of the β-sheets structure decreased to some extent, although the peptides were aggregated heavily. However, in the presence of a ratio of 10
1 caffeine to peptide ratio, the percentage of the β-sheets structure decreased to some extent, although the peptides were aggregated heavily. However, in the presence of a ratio of 10![[thin space (1/6-em)]](https://www.rsc.org/images/entities/char_2009.gif) :
:![[thin space (1/6-em)]](https://www.rsc.org/images/entities/char_2009.gif) 1 or higher, the β-sheet formation diminished. Radial distribution function, residue–residue contact map, interaction energy and solvent accessible surface area calculations have also demonstrated that with a caffeine to peptide ratio of 10
1 or higher, the β-sheet formation diminished. Radial distribution function, residue–residue contact map, interaction energy and solvent accessible surface area calculations have also demonstrated that with a caffeine to peptide ratio of 10![[thin space (1/6-em)]](https://www.rsc.org/images/entities/char_2009.gif) :
:![[thin space (1/6-em)]](https://www.rsc.org/images/entities/char_2009.gif) 1 or higher, the aggregation tendency of the peptide diminished significantly, and the self-assembly formation ceased. The above observations were further confirmed by the results obtained from the analyses of the experimental data. In brief, from our experimental results we can infer that the SwP converted to a β-sheet from a random coil conformation and that caffeine molecules can inhibit the formation of β-sheets by interacting with the peptide aromatic moiety. The experimental results also support the fact that a 3-fold molar excess of caffeine is not sufficient to inhibit the amyloid formation, whereas a 10-fold molar excess or more can easily break the peptide aggregation. The analysis of the interaction of caffeine with switch-peptide showed that caffeine molecules initially interact with the phenylalanine residues, thereby restricting the Phe–Phe interaction. A detailed analysis of MD simulations further showed that caffeine molecules form hydrogen bonds with the peptide molecules and this leads to weakening of the interstrand hydrogen bonds between the peptides. On the other hand, caffeine molecules form medium ordered clusters of similarly sized molecules ranging from 3 to 8 by vertical stacking. These clusters form a hydrophobic environment around the hydrophobic sites of peptides, and physically block them from interacting with each other. All the above results suggested that caffeine has the capacity to inhibit the aggregation of amyloid-forming peptides by reducing hydrophobic interaction between them. The blocking of aromatic Phe residues of the peptides by caffeine clusters through peptide-caffeine π-stacking interaction, and other residues by hydrophobic and hydrogen bonding interaction leads to complete disaggregation of the peptide in a caffeine solution with a 10
1 or higher, the aggregation tendency of the peptide diminished significantly, and the self-assembly formation ceased. The above observations were further confirmed by the results obtained from the analyses of the experimental data. In brief, from our experimental results we can infer that the SwP converted to a β-sheet from a random coil conformation and that caffeine molecules can inhibit the formation of β-sheets by interacting with the peptide aromatic moiety. The experimental results also support the fact that a 3-fold molar excess of caffeine is not sufficient to inhibit the amyloid formation, whereas a 10-fold molar excess or more can easily break the peptide aggregation. The analysis of the interaction of caffeine with switch-peptide showed that caffeine molecules initially interact with the phenylalanine residues, thereby restricting the Phe–Phe interaction. A detailed analysis of MD simulations further showed that caffeine molecules form hydrogen bonds with the peptide molecules and this leads to weakening of the interstrand hydrogen bonds between the peptides. On the other hand, caffeine molecules form medium ordered clusters of similarly sized molecules ranging from 3 to 8 by vertical stacking. These clusters form a hydrophobic environment around the hydrophobic sites of peptides, and physically block them from interacting with each other. All the above results suggested that caffeine has the capacity to inhibit the aggregation of amyloid-forming peptides by reducing hydrophobic interaction between them. The blocking of aromatic Phe residues of the peptides by caffeine clusters through peptide-caffeine π-stacking interaction, and other residues by hydrophobic and hydrogen bonding interaction leads to complete disaggregation of the peptide in a caffeine solution with a 10![[thin space (1/6-em)]](https://www.rsc.org/images/entities/char_2009.gif) :
:![[thin space (1/6-em)]](https://www.rsc.org/images/entities/char_2009.gif) 1 or higher caffeine to peptide stoichiometric ratio.
1 or higher caffeine to peptide stoichiometric ratio.
Acknowledgements
A part of this work was carried out using the computational facility of C-DAC, Pune, India.References
- D. J. Selkoe, Nature, 2003, 426, 900–904 CrossRef CAS PubMed.
- C. Soto, FEBS Lett., 2001, 498, 204–207 CrossRef CAS PubMed.
- C. Soto, Nat. Rev. Neurosci., 2003, 4, 49–60 CrossRef CAS PubMed.
- C. M. Dobson, Nature, 2002, 418, 729–730 CrossRef CAS PubMed.
- M. S. Forman, J. Q. Trojanowski and V. M. Lee, Nat. Med., 2004, 10, 1055–1063 CrossRef CAS PubMed.
- R. Kayed, E. Head, J. L. Thompson, T. M. Mclntire, S. C. Milton, C. W. Cotman and C. G. Glabel, Science, 2003, 300, 486–489 CrossRef CAS PubMed.
- K. P. Nilsson, FEBS Lett., 2009, 583, 2593–2599 CrossRef CAS PubMed.
- T. L. Kukar, Nature, 2008, 453, 925–929 CrossRef CAS PubMed.
- J. Chen, A. H. Armstrong, A. N. Koehler and M. H. Hecht, J. Am. Chem. Soc., 2010, 132, 17015–17022 CrossRef CAS PubMed.
- Y. Hong, L. Meng, S. Chen, C. W. T. Leung, L.-T. Da, M. Faisal, D.-A. Silva, J. Liu, J. W. Y. Lam, X. Huang and B. Z. Tang, J. Am. Chem. Soc., 2012, 134, 1680–1689 CrossRef CAS PubMed.
- T. Takahashi and H. Mihara, Acc. Chem. Res., 2008, 41, 1309–1318 CrossRef CAS PubMed.
- K. Giger, R. P. Vanam, E. Seyrek and P. L. Dubin, Biomacromolecules, 2008, 9, 2338–2344 CrossRef CAS PubMed.
- C. Cabaleiro-Lago, F. Quinlan-Pluck, I. Lynch, K. A. Dawson and S. Linse, ACS Chem. Neurosci., 2010, 1, 279–287 CrossRef CAS PubMed.
- P. Frid, S. V. Anisimov and N. Popovic, Brain Res. Rev., 2007, 53, 135–160 CrossRef CAS PubMed.
- G. W. Arendash, T. Mori, C. Cao, M. Mamcarz, M. Runfeldt, A. Dickson, K. Rezai-Zadeh, J. Tane, B. A. Citron, X. Lin, V. Echeverria and H. Potter, J. Alzheimer’s Dis., 2009, 17, 661–680 CAS.
- C. Cao, J. R. Cirrito, X. Lin, L. Wang, D. K. Verges, A. Dickson, M. Mamcarz, C. Zhang, T. Mori, G. W. Arendash, D. M. Holtzman and H. Potter, J. Alzheimer’s Dis., 2009, 17, 681–697 CAS.
- G. W. Arendash, W. Schleif, K. Rezai-Zadeh, E. K. Jackson, L. C. Zacharia, J. R. Cracchiolo, D. Shippy and J. Tan, Neuroscience, 2006, 142, 941–952 CrossRef CAS PubMed.
- H. Qosa, A. H. Abuznait, R. A. Hill and A. Kaddoumi, J. Alzheimer’s Dis., 2012, 31, 151–165 CAS.
- C. Laurent, S. Eddarkaoui, M. Derisbourg, A. Leboucher, D. Demeyer, S. Carrier, M. Schneider, M. Hamdane, C. E. Müller, L. Buée and D. Blum, Neurobiol. Aging, 2014, 35, 079–2090 CrossRef PubMed.
- A. Paul, B. Sharma, T. Mondal, K. Thalluri, S. Paul and B. Mandal, Med. Chem. Commun., 2016, 7, 311–316 RSC.
- W. Pohle and H. Fritzsche, Nucleic Acids Res., 1976, 3, 3331–3335 CrossRef CAS PubMed.
- S. Banerjee, P. K. Verma, R. K. Mitra, G. Basu and S. K. Pal, J. Fluoresc., 2012, 22, 753–769 CrossRef CAS PubMed.
- B. Sharma and S. Paul, J. Chem. Phys., 2013, 139, 194504 CrossRef PubMed.
- B. Sharma and S. Paul, J. Phys. Chem. B, 2015, 119, 6421–6432 CrossRef CAS PubMed.
- D. B. Davies, D. A. Veselkov, L. N. Djimant and A. N. Veselkov, Eur. Biophys. J., 2001, 30, 354–366 CrossRef CAS PubMed.
- H. Fritzsche, H. Lang, H. Sprinz and W. Pohle, Biophys. Chem., 1980, 11, 121–131 CrossRef CAS PubMed.
- L. S. Kan, P. N. Borer, D. M. Cheng and P. O. TsâĂŹo, Biopolymers, 1980, 19, 1641–1654 CrossRef CAS PubMed.
- M. Mutter, A. Chandravarkar, C. Bovat, J. Lopez, S. D. Santos, B. Mandal, R. Mimna, K. Murat, L. Patiny, L. Saucede and G. Tuchscherer, Angew. Chem., Int. Ed., 2004, 43, 4172–4178 CrossRef CAS PubMed.
- W. D. Cornell, P. Cieplak, C. I. Bayly, I. R. Gould, K. M. Merz, D. M. Ferguson, D. C. Spellmeyer, T. Fox, J. W. Caldwell and P. A. Kollman, J. Am. Chem. Soc., 1995, 117, 5179–5197 CrossRef CAS.
- H. J. C. Berendsen, J. R. Grigera and T. P. Straatsma, J. Phys. Chem., 1987, 91, 6269–6271 CrossRef CAS.
- L. Martinez, R. Andrade, E. G. Birgin and J. M. Martinez, J. Comput. Chem., 2009, 30, 2157–2164 CrossRef CAS PubMed.
- S. L. McGovern, B. T. Helfand, B. Y. Feng and B. K. Shoichet, J. Med. Chem., 2003, 46, 4265–4272 CrossRef CAS PubMed.
- B. K. Shoichet, Drug Discovery Today, 2006, 11, 607–615 CrossRef CAS PubMed.
- K. E. D. Coan and B. K. Shoichet, J. Am. Chem. Soc., 2008, 130, 9606–9612 CrossRef CAS PubMed.
- B. Y. Feng, B. H. Toyama, H. Wille, D. W. Colby, S. R. Collins, B. C. May, S. B. Prusiner, J. Weissman and B. K. Shoichet, Nat. Chem. Biol., 2008, 4, 197–199 CrossRef CAS PubMed.
- D. A. Case, T. A. Darden, T. E. Cheatham III, C. L. Simmerling, J. Wang, R. E. Duke, R. Luo, R. C. Walker, W. Zhang and K. M. Merz, et al., AMBER 12, University of California, San Francisco, 2012 Search PubMed.
- P. H. Hünenberger, Adv. Polym. Sci., 2005, 173, 105–149 CrossRef.
- H. J. C. Berendsen, J. P. M. Postma, W. F. van Gunsteren, A. DiNola and J. R. Haak, J. Chem. Phys., 1984, 81, 3684–3690 CrossRef CAS.
- U. Essmann, L. Perera, M. L. Berkowitz, T. Darden, H. Lee and L. G. Pedersen, J. Chem. Phys., 1995, 103, 8577–8593 CrossRef CAS.
- J.-P. Ryckaert, G. Ciccotti and H. J. C. Berendsen, J. Comput. Phys., 1977, 23, 327–341 CrossRef CAS.
- M.-S. Lin, L.-Y. Chen, H.-T. Tsai, S. S.-S. Wang, Y. Chang, A. Higuchi and W. Y. Chen, Langmuir, 2008, 24, 5802–5808 CrossRef CAS PubMed.
- W. B. Stine, K. N. Dahlgren, G. A. Krafft and M. J. LaDu, J. Biol. Chem., 2003, 278, 11612–11622 CrossRef CAS PubMed.
- A. Banerjee, S. K. Maji, M. G. B. Drew, D. Haldar, A. K. Das and A. Banerjee, Tetrahedron, 2004, 60, 5935–5944 CrossRef CAS.
- S. Trobro and J. Åqvist, Biochemistry, 2006, 45, 7049–7056 CrossRef CAS PubMed.
- E. Gazit, FEBS J., 2005, 272, 5971–5978 CrossRef CAS PubMed.
- K. E. D. Coan, D. A. Maltby, A. L. Burlingame and B. K. Shoichet, J. Med. Chem., 2009, 52, 2067–2075 CrossRef CAS PubMed.
- W. Colon, Methods Enzymol., 1999, 309, 605–632 CAS.
- K. Rosenheck and B. Sommer, J. Chem. Phys., 1967, 46, 532–536 CrossRef CAS PubMed.
- S. M. Kelly, T. J. Jess and N. C. Price, Biochim. Biophys. Acta, 2005, 1751, 119–139 CrossRef CAS PubMed.
- H. Levine, Protein Sci., 1993, 2, 404–410 CrossRef CAS PubMed.
- R. P. Cheng, S. H. Gellman and W. F. Degrado, Chem. Rev., 2001, 100, 3219–3232 CrossRef.
| This journal is © The Royal Society of Chemistry 2016 |

