Hydrodeoxygenation of guaiacol over Ni/carbon catalysts: effect of the support and Ni loading†
A. B. Dongila,
I. T. Ghampsona,
R. Garcíaa,
J. L. G. Fierrob and
N. Escalona*cd
aUniversidad de Concepción, Facultad de Ciencias Químicas, Casilla 160C, Concepción, Chile
bInstituto de Catálisis y Petroquímica, CSIC, Cantoblanco, 28049 Madrid, Spain
cDepartamento de Ingeniería Química y Bioprocesos, Escuela de Ingeniería, Pontificia Universidad Católica de Chile, Avenida Vicuña Mackenna 4860, Macul, Santiago, Chile. E-mail: neescalona@ing.puc.cl; Tel: +56-2-2354-4927
dFacultad de Químicas, Pontificia Universidad Católica de Chile, Chile
First published on 23rd December 2015
Abstract
Commercial carbon nanotubes (CNT), oxidized CNT (CNTox) and activated carbon (AC) were used as supports to prepare Ni/C catalysts with a nominal loading of 15 wt%. In addition, xNi/CNT catalysts with loadings of x: 10, 12, 15, 17, 20 wt% were prepared. The catalysts were characterized by N2 physisorption, temperature-programmed decomposition (TPD), potentiometric titration, H2-temperature programmed reduction (TPR), CO chemisorption and X-ray photoelectron spectroscopy (XPS). The catalysts were evaluated for the conversion of guaiacol at 573 K and 5 MPa H2 pressure for 4 h in a batch reactor. The activity of the xNi/CNT catalysts was related to Ni dispersion, while their selectivity was similar and favored the formation of hydrogenation products. The activity of 15Ni/CNT catalyst was higher than those of 15Ni/CNTox and 15Ni/AC catalysts. The higher activity of the 15Ni/CNT catalyst compared to 15Ni/AC catalyst was possibly due to their different morphologies, while the lower activity of the 15Ni/CNTox catalyst was attributed to the limiting effect of surface oxygen groups on the support. In addition, the higher acidity of the 15Ni/CNTox catalyst enhanced its hydrogenolysis and deoxygenation capacities.
1. Introduction
Interest in exploring and developing alternative sources of energy has spiked over the last decade due to diminishing crude oil supplies, and environmental and energy security concerns across the globe. Lignocellulosic biomass has gained considerable interest as a source of transportation fuel and aromatic chemicals, particularly through the fast pyrolysis technology to produce bio-oil. However, the bio-oil produced is limited by its high viscosity, low heating value, corrosivity, incomplete volatility and thermal instability.1 These deleterious properties arise from the presence of oxygen-containing compounds, and for this reason it is necessary to either lower (to be used as a chemical feedstock) or completely eliminate the oxygen composition (to be used as a fuel component).2 Hydrodeoxygenation (HDO) is the most widely studied upgrading method, and it is typically performed at high temperature and high hydrogen pressure with the help of a solid catalyst.3 One of the biggest challenges of advancing this technology is the development of effective catalysts.Phenolic model compounds such as guaiacol, anisole and phenol, obtained from the depolymerization of the lignin component of woody biomass, have typically been used to assess the reactivity of several catalytic systems for HDO reactions.2,4–6 The two most widely studied classes of catalysts are the conventional hydrotreating sulfide catalysts and noble metal catalysts.4 The former was found to be capable of removing the oxygen while minimizing hydrogen consumption, although it was hampered by instability associated with the active sulfide phase and the support.2,4 On the other hand, noble metal catalysts demonstrated excellent stability and activity; their main disadvantage was the high cost of the catalyst and the excessive hydrogen consumption stemming from their high hydrogenation activity. For these reasons, several researchers have been studying alternatives to these catalysts, including transition metal phosphides,7–10 carbides,11,12 nitrides,13–16 rhenium-based catalysts, etc.17–20 These studies have reported excellent activity and selectivity results and sustained efforts are ongoing to optimize these catalytic systems to decrease the cost of producing biomass-derived fuels and chemicals. Recently, there has been a particular emphasis on exploring classes of catalysts that uses less expensive and earth-abundant elements.
Nickel catalysts, in particular, have been studied by several groups for HDO reactions.21–28 Mortensen et al.21 screened several catalytic systems for the HDO of phenol at 10 MPa H2 and 548 K in a batch reactor, and reported that Ni was the only active non-noble metal catalyst. In fact, Ni/ZrO2 was the best performing HDO catalyst from a library which also included Ru/C and Pt/C noble metal catalysts. Bykova et al.23,25 developed Ni-containing catalysts and tested them in the HDO of guaiacol in an autoclave at 593 K and a H2 pressure of 17 MPa: conversion reaching 97% and deoxygenation activity exceeding 97% were obtained for some of the catalysts. Jin et al.26 studied the effect of support (using activated carbon [AC], SBA-15, SiO2 and γ-Al2O3) on the reactivity of Ni catalysts in the HDO of anisole in a batch reactor at fairly moderate conditions. The authors reported a high selectivity to deoxygenated product for the Ni/SiO2 catalyst, while the Ni/AC catalyst was more adept at saturating the aromatic ring. Yang et al.27 reported a study on the same topic but with a different type of reactor and reaction conditions. They investigated the effect of metal–support interaction (using SBA-15, Al-SBA-15, γ-Al2O3, microporous carbon, TiO2 and CeO2 as support) in a continuous flow reactor under 0.3 MPa and 563–583 K. The authors reported very high HDO activity, often reaching 100%. In contrast to the results from Jin et al.26 discussed above, the activated carbon-supported Ni catalyst exhibited the highest selectivity to benzene (64%), a valuable feedstock as a fuel additive and as a commodity chemical. In another recent study, Song et al.28 evaluated bifunctional Ni/HZSM-5 catalyst in the HDO of phenol, catechol and guaiacol in the aqueous phase. They reported that the combined effect of the Ni catalyst and the acid sites of the HZSM-5 support significantly increased the HDO activity. Zhao et al.29 detailed the kinetics and performance of Ni/HZSM-5 and Ni/Al2O3-HZSM-5 catalysts for the aqueous phase HDO of phenol, and reported a reaction sequence whose rate-determining step was phenol hydrogenation. The study also found the Ni/Al2O3-HZSM-5 catalyst was five times more active than the Ni/HZSM-5 catalyst.
The exceptional activity of these catalysts reported by these authors provides an incentive to delve into the parameters controlling the reactivity. The reactivities of the catalysts from the studies discussed above are due to interplay between support properties and the intrinsic activity of Ni. Recently, carbon nanotubes (CNT) and carbon nanofiber (CNF) have been making headway in the field of heterogeneous catalysis due to their particularly high thermal conductivity, the high accessibility of the active phase, good chemical stability in aggressive media, and the absence of any microporosity.30 Due to their inert surface they are especially suited to study the effect of particle size and reaction mechanisms. However, in HDO catalysis, CNT and CNF have received little attention. Jongerius et al.12 reported that Mo2C/CNF and W2N/CNF displayed high conversions and high selectivities towards phenolics in the HDO of guaiacol at 573–648 K and 5.5 MPa of H2 pressure. Ohta et al.31 reported no drop-off in activity in the HDO of 4-propylphenol when comparing Pt catalyst supported on multi-walled carbon nanotube to those supported on other different types of carbon materials such as activated carbon, CMK-3 mesoporous carbon and carbon black. These results provide an additional impetus to further the applicability of CNT in the HDO of lignin-derived phenolics.
In this study, a series of carbon nanotube-supported Ni catalysts with different loadings were prepared, characterized and evaluated for the HDO of guaiacol. Guaiacol was chosen because it is the most abundant phenolic monomer from lignin depolymerization.32 Additionally, the catalyst with the optimum loading for CNT was then compared to a Ni/activated carbon and a Ni/CNTox catalysts (carbon nanotube was oxidized by nitric acid prior to Ni impregnation) in order to ascertain the effect of the carbon support properties on the activity and selectivity.
2. Experimental
2.1 Catalysts
Two different commercial carbon materials were used as supports: carbon nanotubes Nanocyl 3100 (CNT, >95% purity, Nanocyl) and activated carbon (AC, Norit SX Plus) previously pre-treated at 1073 K under He flow for 4 h to remove the oxygen surface groups. A portion of the parent CNT was oxidized in 10 ml HNO3 (65%) per gram of support at 403 K for 24 h and labeled as CNTox. The catalysts were prepared by wet impregnation in acetone (10 ml of solution per gram of CNT) using the corresponding amount of Ni (NO3)2·6H2O (99.9%, Sigma-Aldrich) to obtain 10, 12, 15, 17 and 20 wt% Ni. In addition, 15% wt Ni supported on CNTox and AC supports were prepared following the same procedure. After stirring for 12 h, the solvent was removed under vacuum. Finally, the materials were treated at 623 K for 5 h under flowing He (50 ml min−1). In total, seven catalysts were prepared: (1) the CNT supported catalysts with different loadings were denoted as xNi/CNT where x is the Ni loading (i.e. 10Ni/CNT, 12Ni/CNT, 15Ni/CNT, 17Ni/CNT, 20Ni/CNT); (2) 15Ni/CNTox and 15Ni/AC denoted the CNTox and AC supported 15 wt% Ni catalysts, respectively.2.2 Catalyst characterization
The specific surface area (SBET) and pore volume (Vp) of the supports and catalysts were determined from nitrogen isotherms at 77 K using a Micromeritics ASAP 2010 equipment. Prior to the measurements, the samples were degassed at 473 K for 2 h.The surface acidity of calcined samples was measured by potentiometric titration of a suspension of the catalyst in acetonitrile with n-butylamine, using an Ag/AgCl electrode.33–35
Temperature-programmed decomposition (TPD) analyses of the supports were carried out under an inert atmosphere at a heating rate of 10 K min−1 up to 1373 K and a helium flow of 50 ml min−1.
X-ray photoelectron spectra (XPS) were recorded using a VG Escalab 200R electron spectrometer equipped with a hemispherical analyzer operating in a constant pass energy mode, and a non-monochromatic Mg-Kα (hí = 1253.6 eV, 1 eV = 1.603 × 10⁻¹⁹ J) X-ray source operated at 10 mA and 12 kV. Prior to the analysis, the catalyst samples were reduced in situ under the same conditions employed before the catalytic tests. The binding energies (BE) were referenced to the carbon support at 284.6 eV. An estimated error of ±0.1 eV can be assumed for all measurements. Intensities of the peaks were calculated from the respective peak areas after background subtraction and spectrum fitting by a combination of Gaussian/Lorentzian functions. The relative surface atomic ratios were determined from the corresponding peak intensities, corrected with tabulated sensitivity factors, with a precision of ±7%.
Metal dispersion was estimated from CO chemisorption using a Micromeritics ASAP 2020 apparatus. The catalysts (0.25 g) were reduced in situ under H2 flow using the same conditions employed before the catalytic tests, evacuated under flowing He and cooled down to 303 K. Then, CO chemisorption was measured at 303 K and 0.003–0.07 MPa. Ni dispersion was calculated by assuming an average CO![[thin space (1/6-em)]](https://www.rsc.org/images/entities/char_2009.gif) :
:![[thin space (1/6-em)]](https://www.rsc.org/images/entities/char_2009.gif) Ni stoichiometry of 1
Ni stoichiometry of 1![[thin space (1/6-em)]](https://www.rsc.org/images/entities/char_2009.gif) :
:![[thin space (1/6-em)]](https://www.rsc.org/images/entities/char_2009.gif) 1.36
1.36
H2-temperature programmed reduction (TPR) studies were carried out in a quartz cell on a conventional system equipped with a thermal conductivity detector. In each experiment, 25 mg of the sample was heated under 5% H2/Ar with a flow of 50 cm3 min−1. The sample was heated at a rate of 10 °C min−1 from 298 to 1173 K.
2.3 Catalytic test
Conversion of guaiacol was carried out in a 250 ml batch reactor equipped with a hollow-shaft 6-bladed mechanically driven turbine with four baffles on the wall of the reactor to prevent vortex formation (model Parr 4841). The liquid reactant feed, consisting of guaiacol (0.232 mol l−1) in n-dodecane (80 ml) with hexadecane (0.0341 mol l−1) as an internal standard, was introduced into the reactor. Then, approximately 200 mg of catalyst previously reduced under H2 (50 ml min−1) at 723 K for 4 h were transferred rapidly to the reactor limiting the exposition to air. The system was closed and, to avoid any air contamination, N2 was bubbled through the solution for 10 min. Still under N2 the reactor was heated to the reaction temperature of 573 K under stirring. The pressure was adjusted to 5 MPa by H2 introduction into the reactor and kept constant during the course of the experiment. Aliquots of around 0.5 ml were taken periodically during the reaction. The reaction products were identified by gas chromatography (Perkin Elmer – Clarus 680) coupled to GCMS-SQ8T and quantified by gas chromatograph (Perkin-Elmer – Clarus 400) using a Flame Ionization Detector (FID) and a CP-Sil 5 column (Agilent, 30 m × 0.53 mm × 1.0 μm film thickness). The specific rate for the total conversion of guaiacol was deduced from the initial slope of the conversion as a function of time plot according to the following equation:
 | (1) |
 | (2) |
3. Results and discussion
3.1 Support characterization
The CNT, CNTox and AC supports were characterized to assess the differences in their morphology and surface chemistry. The nitrogen adsorption/desorption isotherms at 77 K are shown in ESI, Fig. S1.† It can be observed that CNT support showed very little nitrogen uptake at low relative pressure, characteristic of a Type II isotherm corresponding to non-microporous carbon materials. However, at a relative pressure of 0.8–0.9 a noticeable increase in the amount of N2 adsorbed can be observed, along with a well-defined hysteresis loop due to the presence of mesopores. The isotherm of CNTox differed from the isotherm of the parent CNT support: the nitrogen uptake at low relative pressures increased and the hysteresis loop was extended to medium relative pressures (0.4–0.6). The oxidation treatment of the CNT support with nitric acid may have opened the carbon nanotubes to some extent, which will lead to an increase of the support's mesoporosity.37 On the other hand, the isotherm obtained for AC displayed higher adsorption volume at low partial pressures (P/P0 ≤ 0.1) which is consistent with a Type I isotherm, indicative of microporous structure. The hysteresis loop due to capillary condensations at higher partial pressures matches that observed for a Type IV isotherm and is associated with mesoporosity. The estimated BET surface areas (SBET), micropore (Vmicro) and mesopore (Vmeso) pore volumes are summarized in Table 1: the AC support displayed the highest SBET, in agreement with the presence of the largest amounts of micropores; the CNT and CNTox supports presented similar textural properties and only a slight increase of the SBET could be observed suggesting that the oxidative pre-treatment with HNO3 may have only opened a small fraction of the nanotubes. In relation to the porosity, the CNT and CNTox supports possess a higher pore volume compared to the AC support as a consequence of the spatial arrangement of the nanotubes as bundles. This arrangement leaves an interstitial space between the nanotubes, which is responsible for their porosity in contrast to the small pores of the AC structure.| Sample | Ni loading (%) | Ni surface density (atoms nm−2) | SBET (m2 g−1) | Vmicro (cm3 g−1) | Vmeso (cm3 g−1) | Vt (cm3 g−1) |
|---|---|---|---|---|---|---|
| CNT | — | — | 300 | 0.01 | 1.76 | 1.77 |
| CNTox | — | — | 319 | 0.01 | 1.78 | 1.79 |
| AC | — | — | 846 | 0.28 | 0.03 | 0.31 |
| 10Ni-CNT | 10 | 3.8 | 282 | 0.01 | 1.12 | 1.14 |
| 12Ni-CNT | 12 | 4.7 | 249 | 0.01 | 1.07 | 1.08 |
| 15Ni-CNT | 15 | 6.0 | 241 | 0.01 | 1.01 | 1.02 |
| 17Ni-CNT | 17 | 7.0 | 230 | 0.01 | 0.73 | 0.74 |
| 20Ni-CNT | 20 | 8.5 | 211 | 0.01 | 0.70 | 0.71 |
| 15Ni-CNTox | 15 | 5.7 | 262 | 0.01 | 1.04 | 1.05 |
| 15Ni-AC | 15 | 2.1 | 224 | 0.06 | 0.05 | 0.11 |
The acid strength and total acidity of the supports were evaluated and the results are summarized in Table 2. The acid strength can be determined according to the criterion proposed by Cid and Pecchi:33 E0 > 100 mV, very strong sites; 0 < E0 < 100 mV, strong sites; −100 < E0 < 0 mV, weak sites; E0 < −100 mV, very weak sites. Accordingly, these results show that the CNT and AC supports have very weak acid sites, while the CNTox support has very strong acid sites. The highest acid strength and total acidity displayed for the CNTox support can be attributed to the creation of surface oxygen groups by the wet-oxidation treatment.
| Samples | Acid strength (mV) | Total acidity (meq g−1) |
|---|---|---|
| CNT | −177 | 0.08 |
| CNTox | 335 | 0.43 |
| AC | −105 | 0.35 |
| 15Ni-CNT | −140 | 0.05 |
| 15Ni-CNTox | 200 | 0.29 |
| 15Ni-AC | −112 | 0.31 |
The surface chemistry of the supports was studied by TPD analyses shown in Fig. S2.† In summary, the TPD profiles for CNT and AC barely showed any peaks, suggesting that the amount of oxygen groups on the surface of the parent CNT was very low and that the high temperature treatment applied to the activated carbon effectively removed most of the surface groups. On the contrary, the CNTox support exhibited the typical peaks associated with oxidized carbon materials:38 it presented three maxima at 434, 750 and 1130 K depicting the decomposition of carboxylic, lactonic, phenolic, carbonyl, anhydride and quinone groups.38 The presence of these functionalities agrees well with the acidity results from potentiometric titration, shown in Table 2, and confirms that the oxidation of the parent carbon nanotubes was effective in creating oxygen groups on the surface.
XPS analyses were performed to identify and quantify the surface species present on the carbon supports and catalysts. Curve fitting of the spectra revealed five C 1s peaks for the as-received CNT support, while the CNTox and AC supports showed four and three C 1s peaks, respectively. The binding energies (BEs) of the C 1s and O 1s regions as well as the O/C atomic ratio of all the supports are summarized in Table 3. All the supports displayed a main contribution at 284.6 eV, which is assigned to carbon in Csp2.39,40 Also, these supports displayed a peak at 286.2 ± 0.2 eV attributed to carbon in C–O bonds41 in phenolic or ether groups42 and a signal at 287.7 ± 0.2 eV assigned to carbon in C![[double bond, length as m-dash]](https://www.rsc.org/images/entities/char_e001.gif) O bonds in carbonyl groups.41 The CNT and CNTox supports also exhibited a peak at 289.1 ± 0.2 eV ascribed to C–O–OR bonds in carboxyl or ester groups.41 On the other hand, only the CNT support displayed a peak with BE at 290.4 eV attributed to π → π* transition43 which is absent when the support was subjected to the wet-oxidation treatment.
O bonds in carbonyl groups.41 The CNT and CNTox supports also exhibited a peak at 289.1 ± 0.2 eV ascribed to C–O–OR bonds in carboxyl or ester groups.41 On the other hand, only the CNT support displayed a peak with BE at 290.4 eV attributed to π → π* transition43 which is absent when the support was subjected to the wet-oxidation treatment.
| Supports | C 1s | O 1s | (O/C) at |
|---|---|---|---|
| CNT | 284.6 (79), 286.0 (14), 287.7 (3), 288.9 (2), 290.4 (2) | 531.7 (30), 533.2 (65), 534.7 (5) | 0.011 |
| CNTox | 284.6 (67), 286.0 (18), 287.5 (8), 289.1 (6) | 531.6 (26), 533.1 (56), 534.5 (18) | 0.096 |
| AC | 284.6 (84), 286.2 (14), 287.8 (2) | 531.3 (26), 532.8 (74) | 0.034 |
In regards to the O 1s region, Table 3 shows that all the supports displayed BEs at 531.7 ± 0.4 eV and 533.2 ± 0.4 eV, attributed to oxygen in C![[double bond, length as m-dash]](https://www.rsc.org/images/entities/char_e001.gif) O bond of carbonyl groups39,41 and to oxygen in C–O bonds in phenolic or ether groups, respectively.41 Moreover, CNT and CNTox displayed a peak at 534.4 ± 0.2 eV ascribed to oxygen in carboxyl or ester groups. The relative intensity of this latter peak increases after the oxidation treatment at the expense of the other two contributions. Finally, Table 3 shows that the O/C atomic ratio followed the order of CNTox > AC > CNT. The highest value obtained for CNTox was attributed to the creation of surface oxygen groups by the wet-oxidation treatment of the CNT support. This trend is in good agreement with the interpretation from the TPD profiles.
O bond of carbonyl groups39,41 and to oxygen in C–O bonds in phenolic or ether groups, respectively.41 Moreover, CNT and CNTox displayed a peak at 534.4 ± 0.2 eV ascribed to oxygen in carboxyl or ester groups. The relative intensity of this latter peak increases after the oxidation treatment at the expense of the other two contributions. Finally, Table 3 shows that the O/C atomic ratio followed the order of CNTox > AC > CNT. The highest value obtained for CNTox was attributed to the creation of surface oxygen groups by the wet-oxidation treatment of the CNT support. This trend is in good agreement with the interpretation from the TPD profiles.
3.2 Catalysts characterization
The nitrogen adsorption/desorption isotherms at 77 K of the catalysts were also performed to study their textural properties and the results are shown in Table 1. For the xNi/CNT catalysts, a continuous decrease of the BET surface area can be observed with increasing Ni loading. The same trend can be observed for both the total pore and mesoporous volumes. On the other hand, the incorporation of Ni to the AC support significantly decreased the surface area and the pore volume. This effect has been previously reported and is attributed to pore blockage.44 It should also be pointed out that the textural properties of the 15Ni/CNTox catalyst were similar to the 15Ni/CNT catalyst, in agreement with the similarities in the textural properties of their respective supports.The acid strength and acid sites density of the 15 wt% Ni catalysts supported on different supports were evaluated and the results are compared to the parent supports in Table 2. It can be observed that while the acidity values of 15Ni/CNT and 15Ni/AC catalysts did not vary significantly compared to their supports, the same was not true for the 15Ni/CNTox catalyst: a decrease in the acid strength and total acidity was observed in comparison to the support. The observed decrease for the 15Ni/CNTox catalyst is due to the reduction treatment under H2 performed prior to the reaction and characterization in order to obtain metallic Ni nanoparticles. Nonetheless, the value was still within the range ascribed to strong acid sites according to the Cid and Pecchi criterion.33
CO chemisorption was performed to assess the number of the accessible surface Ni0 atoms and the results are summarized in Table 4. A continuous increase of the CO uptake with Ni loading can be observed. The calculated dispersion in Table 4, as CO/Ni atomic ratio, was fairly identical and independent of the Ni loading up to 15 wt% and then it decreased slightly at higher loadings, which may be related to the formation of Ni agglomerates. Moreover, the results obtained for the catalysts with 15 wt% Ni loading supported on CNT and CNTox were very similar, consistent with their textural properties, which indicates that nitric acid treatment did not influence the accessibility of CO molecules to the metal active sites. On the contrary, the CO/Ni ratio was higher for the catalyst 15Ni/AC, possibly due to its higher surface area.
| Samples | CO uptake (μmol g−1) | CO/Ni | TPR-H2 mmol consumed per g | |
|---|---|---|---|---|
| Peak 1 theoretic | Peak 1 real | |||
| 10Ni-CNT | 39 | 0.023 | 1.72 | 2.02 |
| 12Ni-CNT | 45 | 0.022 | 2.07 | 2.33 |
| 15Ni-CNT | 56 | 0.022 | 2.59 | 2.36 |
| 17Ni-CNT | 59 | 0.020 | 2.93 | 2.56 |
| 20Ni-CNT | 63 | 0.018 | 3.45 | 3.35 |
| 15Ni-CNTox | 59 | 0.023 | 2.59 | 3.90 |
| 15Ni-AC | 76 | 0.029 | 2.59 | 2.89 |
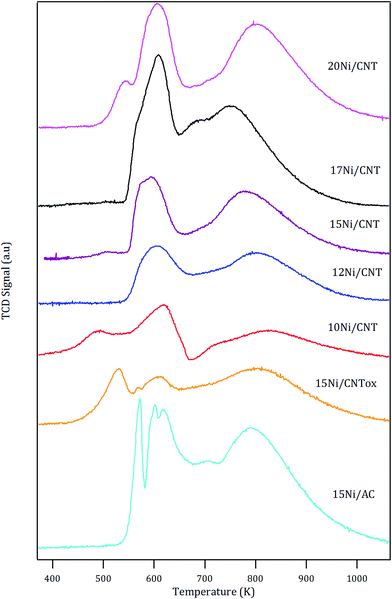
The H2-TPR profiles of the catalysts are shown in Fig. 1. In general, the profiles showed two main peaks with maximum at around 600 K and 800 K, except for the 15Ni/CNTox and 15Ni/AC catalysts which displayed an additional contribution at 530 and 570 K, respectively. The reduction of bulk NiO has been observed at 638 K.45,46 It has been reported that the nature of the support used and the synthesis conditions may affect the reducibility of Ni species: for example, for nickel supported on carbon nanotubes, different TPR profiles have been reported depending on the surface chemistry, particle size and/or location of the particles.47,48 The first reduction peak at 600 K in Fig. 1 corresponds to the reduction of NiO and the temperature at which it appears is in the range of previously reported values.49,50 An additional reduction peak at lower temperature is observed for 10Ni/CNT which could be due to the reduction of NiO nanoparticles with different strength of interaction with the support or, as has been proposed in the literature, to the reduction of Ni(III) species formed by oxygen chemisorption on highly dispersed NiO.51
The estimated H2 consumption (in Table 4) within this range of temperature corresponds quite well with the expected value corresponding to the reduction of NiO, except for the 15Ni/CNTox catalyst. The larger experimental value displayed by 15Ni/CNTox compared to the theoretical value can be ascribed to the decomposition and desorption of the oxygen groups. Moreover, the 15Ni/CNTox sample displayed an additional reduction peak at lower temperature, i.e. 523 K, which could be due to the presence of particles interacting differently with the support. It has been suggested that metal nanoparticles located inside the tubes are more easily reduced than those on the external surface, and considering that the previous oxidation step may have opened the tips of the nanotubes to a certain extent, this could explain the presence of the peak at lower reduction temperature.45,52 On the other hand, it has been previously reported that H2 consumption peaks observed at higher temperature are due to Ni nanoparticles catalyzing the methanation of the carbon support.45,53 Nonetheless, the contribution of the reduction of larger Ni nanoparticles or the reduction oxygen groups on the surface of 15Ni/CNTox which would normally take place in this temperature range cannot be disregarded; in fact, this phenomenon might explain the greater difference between the experimental and the theoretical value for the H2 consumption.54
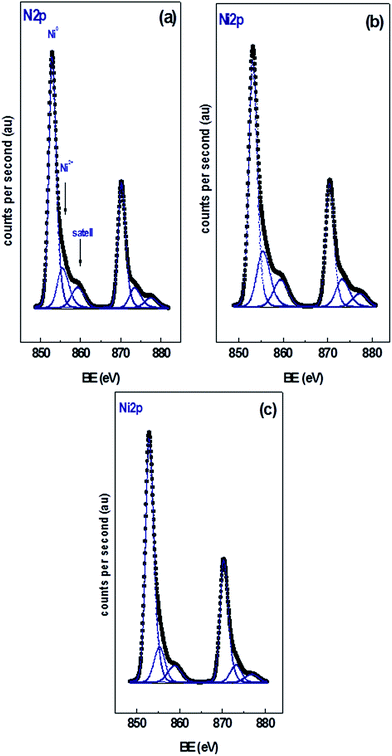
Fig. 2 shows the XPS of the Ni 2p region of the different catalysts with 15 wt% Ni loading. Curve fitting of the spectra of the Ni 2p region revealed two partially overlapped Ni 2p doublets in addition to a satellite peak. Similar spectra were obtained for the xNi/CNT catalysts as a function of Ni contents (not shown). Table 5 summarizes the BEs of the most intense Ni 2p3/2 component of each catalyst, their relative proportion in parenthesis, and the Ni/C atomic ratio. All the catalysts displayed a peak at BE of 853.0 ± 0.2 eV assigned to Ni0 and another peak at higher binding energy at 855.7 ± 0.2 eV corresponding to NiO species.55,56 These results indicate that under the reduction conditions employed a certain proportion of NiO was still present, which might be reduced at higher temperatures in agreement with the second contribution of the H2-TPR profiles. The data also show that the relative proportion of NiO species is relatively close in all the catalysts. These results suggest that the reduction of NiO was not significantly modified by either the Ni loading or the wet-oxidation pre-treatment of CNT support. The BEs in the C 1s and O 1s regions of the catalysts are also presented in Table 5. The data reveals that all the catalysts displayed values similar to their respective supports: a BE at 284.6 eV assigned to carbon in Csp2,57,58 a BE at 286.2 eV attributed to carbon in C–O bonds41 in phenolic or ether groups42 and a BE at 287.7 eV assigned to carbon in C![[double bond, length as m-dash]](https://www.rsc.org/images/entities/char_e001.gif) O bonds in carbonyl groups.41 Unlike the C 1s XPS data for the CNT and CNTox supports, contributions ascribed to carboxylic groups and to the π → π* transition were absent, suggesting that the reduction conditions employed decreased the carboxyl or ester groups in the supports. This would be in agreement with the different acidity displayed by 15Ni/CNTox catalyst compared to CNTox support. Also, Table 5 shows that all the catalysts displayed two contributions in the O 1s region at 531.3 eV and 533.2 eV attributed to C
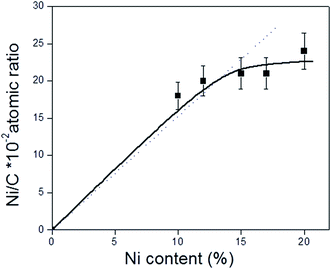
O bonds in carbonyl groups.41 Unlike the C 1s XPS data for the CNT and CNTox supports, contributions ascribed to carboxylic groups and to the π → π* transition were absent, suggesting that the reduction conditions employed decreased the carboxyl or ester groups in the supports. This would be in agreement with the different acidity displayed by 15Ni/CNTox catalyst compared to CNTox support. Also, Table 5 shows that all the catalysts displayed two contributions in the O 1s region at 531.3 eV and 533.2 eV attributed to C![[double bond, length as m-dash]](https://www.rsc.org/images/entities/char_e001.gif) O bonds of carbonyl groups39,41 and to C–O bonds in phenolic or ether groups, respectively.41 The O/C and Ni/C atomic ratios of the catalysts are also presented in Table 5. The O/C atomic ratio values for the xNi/CNT catalysts were similar and comparatively higher than the CNT support (∼0.027 vs. 0.011). This is not surprising and could be explained by the presence of non-reduced NiO nanoparticles on the surface. On the other hand, a decrease in the O/C ratio was observed for the 15Ni/CNTox catalyst in comparison to the CNTox support (0.067 vs. 0.096), possibly due to decomposition and desorption of surface oxygen groups on the support during the H2 reduction. Nonetheless, a significant amount of oxygen groups was still present after the hydrogen treatment in agreement with the potentiometric titration results. Therefore, the wet-oxidation treatment introduced oxygen groups on the surface which are resistant to reduction. The Ni/C atomic ratio represents the relative Ni dispersion on the surface of the carbon support. Fig. 3 illustrates the relationship between the Ni/C atomic ratio and the Ni loading for the CNT supported catalysts where the dotted line represents the linear behavior with Ni content. The Ni/C ratio increased linearly (within the margin of error) up to 15 wt% of Ni loading and then remained relatively constant afterwards. The deviation from linearity at higher loadings is suggestive of the formation of agglomerates of Ni particles, in agreement with CO chemisorption results. Also, Table 5 shows that the Ni/C atomic ratio for the 15Ni/AC is higher than for 15Ni/CNT and 15Ni/CNTox catalysts, suggesting a higher dispersion of Ni nanoparticles on the 15Ni/AC catalyst which can be attributed to the higher surface area of AC support.
O bonds of carbonyl groups39,41 and to C–O bonds in phenolic or ether groups, respectively.41 The O/C and Ni/C atomic ratios of the catalysts are also presented in Table 5. The O/C atomic ratio values for the xNi/CNT catalysts were similar and comparatively higher than the CNT support (∼0.027 vs. 0.011). This is not surprising and could be explained by the presence of non-reduced NiO nanoparticles on the surface. On the other hand, a decrease in the O/C ratio was observed for the 15Ni/CNTox catalyst in comparison to the CNTox support (0.067 vs. 0.096), possibly due to decomposition and desorption of surface oxygen groups on the support during the H2 reduction. Nonetheless, a significant amount of oxygen groups was still present after the hydrogen treatment in agreement with the potentiometric titration results. Therefore, the wet-oxidation treatment introduced oxygen groups on the surface which are resistant to reduction. The Ni/C atomic ratio represents the relative Ni dispersion on the surface of the carbon support. Fig. 3 illustrates the relationship between the Ni/C atomic ratio and the Ni loading for the CNT supported catalysts where the dotted line represents the linear behavior with Ni content. The Ni/C ratio increased linearly (within the margin of error) up to 15 wt% of Ni loading and then remained relatively constant afterwards. The deviation from linearity at higher loadings is suggestive of the formation of agglomerates of Ni particles, in agreement with CO chemisorption results. Also, Table 5 shows that the Ni/C atomic ratio for the 15Ni/AC is higher than for 15Ni/CNT and 15Ni/CNTox catalysts, suggesting a higher dispersion of Ni nanoparticles on the 15Ni/AC catalyst which can be attributed to the higher surface area of AC support.
| Catalysis | C 1s, eV | O 1s, eV | Ni 2p3/2, eV | O/C | Ni/C |
|---|---|---|---|---|---|
| 10Ni/CNT | 284.6 (76), 286.2 (21), 287.7 (3) | 531.5 (40), 533.4 (60) | 853.2 (68), 855.7 (32) | 0.026 | 0.018 |
| 12Ni/CNT | 284.6 (77), 286.2 (19), 287.7 (4) | 531.3 (35), 533.2 (65) | 853.1 (70), 855.7 (30) | 0.029 | 0.020 |
| 15Ni/CNT | 284.6 (77), 286.2 (21), 287.7 (2) | 531.1 (56), 533.1 (44) | 853.1 (66), 855.6 (34) | 0.025 | 0.021 |
| 17Ni/CNT | 284.6 (77), 286.2 (19), 287.7 (4) | 531.3 (36), 533.2 (64) | 853.0 (71), 855.5 (29) | 0.028 | 0.021 |
| 20Ni/CNT | 284.6 (78), 286.2 (19), 287.7 (3) | 531.1 (52), 533.1 (48) | 853.1 (73), 855.5 (27) | 0.027 | 0.024 |
| 15Ni/CNTox | 284.6 (78), 286.2 (19), 287.7 (3) | 531.3 (46), 533.2 (54) | 852.9 (73), 855.9 (27) | 0.067 | 0.019 |
| 15Ni/AC | 284.6 (75), 286.2 (21), 287.7 (4) | 531.1 (53), 533.3 (47) | 852.9 (79), 855.5 (21) | 0.044 | 0.031 |
 | ||
| Fig. 3 Relationship between Ni/C atomic ratio obtained from XPS analysis and Ni content (% wt) of the xNi/CNT catalysts. The dotted line represents the theoretical values. | ||
3.3 Reaction results
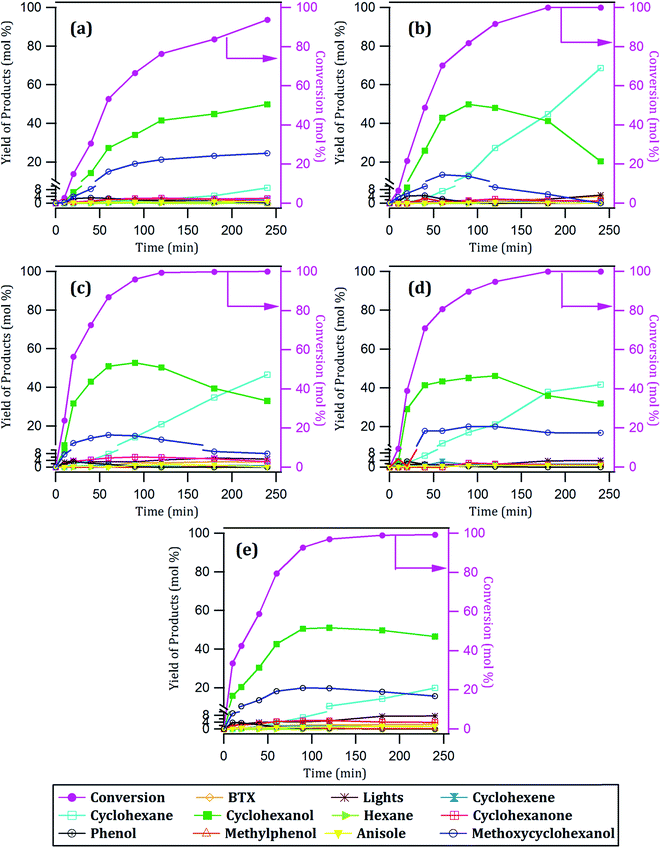 | ||
| Fig. 4 Conversion of guaiacol and yield of products with time over: (a) 10Ni/CNT, (b) 12Ni/CNT, (c) 15Ni/CNT, (d) 17Ni/CNT and (e) 20Ni/CNT catalysts. | ||
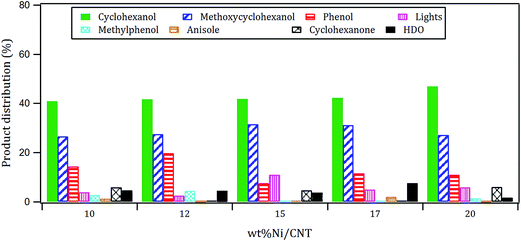
The products distribution of the xNi/CNT catalysts was calculated at 20% conversion of guaiacol and it is shown in Fig. 6. It can be observed that all the catalysts displayed similar trends in product distribution, suggesting that the changes in the Ni dispersion by varying the Ni loading did not significantly modify the active sites on these catalysts. This is confirmed by XPS relative proportion results which showed similar distribution of Ni species (Table 5). Fig. 6 also shows that cyclohexanol, methoxycyclohexanol and phenol were the predominant products at low conversion. It is important to stress that the products distribution for this catalytic system was similar to that previously obtained by Escalona et al.59 over La1−xCexNiO3 perovskite as support of Ni nanoparticles.
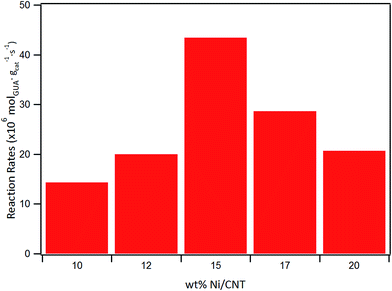
The effect of Ni loading on the initial rate is shown in Fig. 7: the initial rate increases with the Ni loading up to 15%, then decreased at higher loading. Similar trend was obtained for the intrinsic rate shown in Table 6 (normalized by the number of Ni surface atoms derived from CO-chemisorption results). As earlier discussed, Ni/C atomic ratio increased almost linearly with Ni loading up to 15 wt%, suggestive of an increase in the number of active sites due to the homogeneous distribution of Ni on the surface, and consequently leading to an increase in the rate of guaiacol conversion. Conversely, there is a decrease in the initial specific rate for catalysts with higher loadings above 15 wt% which can be attributed to the formation of Ni aggregates (inferred from their similar XPS Ni/C atomic ratios and CO chemisorption results), suggestive of a decrease in the number of active sites on the catalysts with Ni loading above 15% wt.
| Catalyst | Initial rate (×106 mol g−1cat s−1) | Intrinsic rate (×10−3 molec. atNi−1 s−1) |
|---|---|---|
| 10Ni-CNT | 14 | 83 |
| 12Ni-CNT | 20 | 98 |
| 15Ni-CNT | 43 | 170 |
| 17Ni-CNT | 29 | 99 |
| 20Ni-CNT | 21 | 61 |
| 15Ni-CNTox | 8 | 31 |
| 15Ni-AC | 10 | 38 |
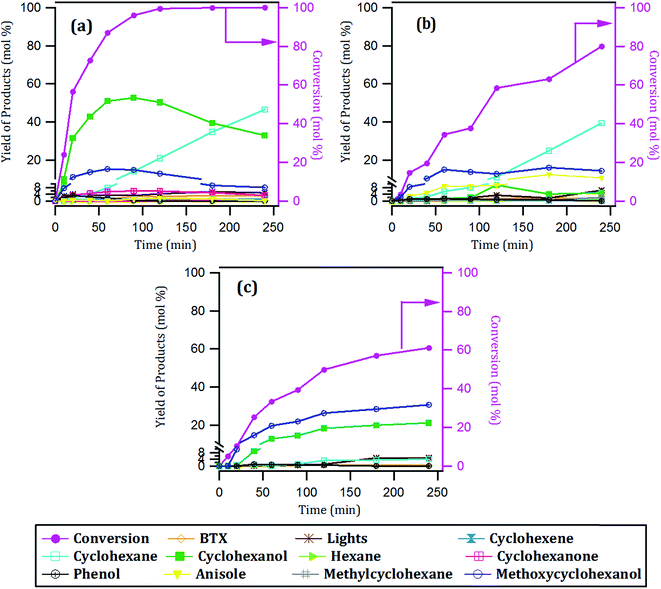 | ||
| Fig. 8 Conversion of guaiacol and yield of products with time over: (a) 15Ni/CNT, (b) 15Ni/CNTox and (c) 15Ni/AC catalysts. | ||
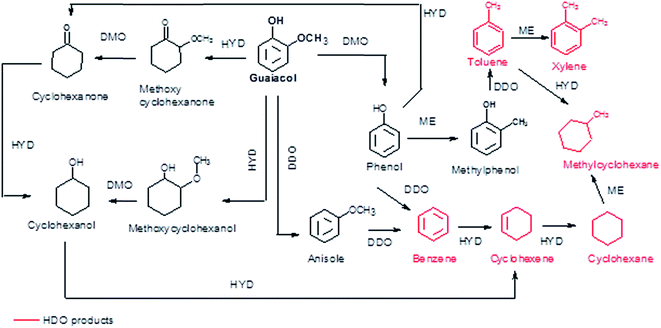
According to the reaction scheme in Fig. 5 (ref. 59–62) and the reaction results, it appears that the main reaction pathway followed by the 15Ni/CNT and 15Ni/AC was the hydrogenation of the aromatic ring of guaiacol, followed by demethoxylation either to form cyclohexanone or cyclohexanol. In addition, cyclohexanol could also be obtained by the HYD of cyclohexanone and finally transformed into cyclohexene and cyclohexane. The results corroborated previous literature reports indicating that Ni favored the hydrogenation reaction.59 The significantly high cyclohexanol production has also been reported for other catalytic systems based on noble metals.64 On the other hand, for the 15Ni/CNTox catalyst the amount of cyclohexanol and methoxycyclohexanol detected which was very low. Nonetheless, the appearance of cyclohexane seems to indicate that HYD of cyclohexanol was somehow favored over this catalyst. Instead, the formation of deoxygenation compounds was appreciable through the formation of anisole via the DDO pathway, which could then be further deoxygenated to produce benzene and then hydrogenated to eventually produce cyclohexane.
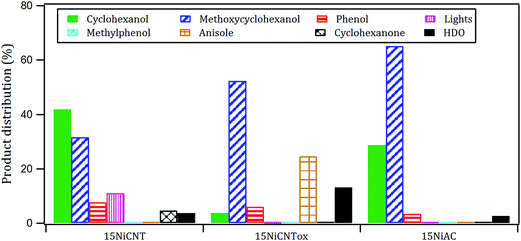
The products distribution calculated at 20% of guaiacol conversion over the 15Ni/support catalysts is shown in Fig. 9. The products distribution are different for the catalysts as evidenced by the relative proportion of methoxycyclohexanol, cyclohexanol and, more notably, the significant amount of anisole produced by the 15Ni/CNTox catalyst. This suggests that the support slightly modified the active sites on the catalysts and, as a consequence, the reaction path. Considering the similar particle size of Ni on 15Ni/CNT and 15Ni/CNTox that CO chemisorption and XPS results showed, the differences in the products distribution over these catalysts might be due to the different surface chemistry that the TPD and potentiometric titration analyses suggested. In this sense, different behaviors have been reported depending on the catalytic system. For example, Sepúlveda et al.17 and Bui et al.65 found that acid sites strongly modifies the selectivity on the conversion of guaiacol, favoring the demethylation (DME) pathway for sulfide catalysts. It is also possible that defective carbon sites from oxycarbide groups formed via the wet-oxidation treatment dissolved into Ni clusters and modified the active sites on Ni.66 Song et al.32 reported that the presence of proximal acid sites on HZSM-5 increased the hydrogenolytic character of Ni by a synergistic action in the conversion of guaiacol. These results are in contrast to those observed for sulfide catalysts,17,65 suggesting that Ni sites were instrumental in tuning the reaction mechanism involved in the conversion of guaiacol. In our system, based on the interpretation from acidity measurements, it is reasonable to propose that the acid sites on the 15Ni/CNTox catalyst hindered the hydrogenation pathway while facilitating the DMO route. Hence, it can be concluded that the cooperative effect of Ni sites and strong acid sites on carbon supports led the reaction through the DMO pathway. On the other hand, despite the similarly weak acid strength displayed by the 15Ni/CNT and 15Ni/AC catalysts they exhibited different products distribution, indicating that the acid sites on carbon supports do not have an exclusive control on product selectivity. For example, cyclohexanol was the dominant product over the 15Ni/CNT catalyst, while methoxycyclohexanol was the main product over the 15Ni/AC catalyst, suggestive of lower DMO activity of the latter catalyst. In this sense, the textural properties of the support might play an indirect role on product selectivity of Ni sites on 15Ni/AC, probably due to the different accessibility to certain active sites. Jin et al.26 found Ni/AC catalyst to be an HDO inefficient but excellent aromatic-ring hydrogenation catalyst in the conversion of anisole. It is clear in this study that 15Ni/CNT is an even better hydrogenation catalyst; in addition, the higher proportion of phenol and light products (methanol, etc.) over this catalyst suggests a higher degree of hydrogenolysis as well. However, the minimal production of HDO products by 15Ni/CNT and 15Ni/AC catalysts compared with the 15Ni/CNTox catalyst suggests that although Ni sites are critical in the first step of ring hydrogenation, the presence of acid sites is a requisite to further C–O bond cleavage.67 In summary, the products distribution of Ni/carbon support catalysts depends on the acid strength of the surface oxygen groups on the support and on the textural properties of the support, consistent with data obtained by Ghampson et al.15
The activities of the 15Ni/support catalysts were expressed by the initial and intrinsic rates (normalized by number of surface Ni atoms obtained by CO-chemisorption) are shown in Table 6. The 15Ni/CNT catalyst displayed higher initial and intrinsic rates than the 15Ni/CNTox and 15Ni/AC catalysts. It has been reported that the presence of surface oxygen groups on carbon supports may improve68,69 or hamper the catalytic performance.70,71 The data obtained in this study reveals that the presence of oxygen groups on 15Ni/CNTox may have reduced the catalytic activity of Ni sites, which might be due to a limited adsorption and/or migration of guaiacol to the active sites of the support. A similar effect of the organic surface groups on the conversion of guaiacol over ReS2/activated carbon catalysts was previously observed by Sepúlveda et al.17 However, deactivation of active sites by the formation of coke over the more acidic surface of 15Ni/CNTox catalyst cannot be disregarded. On the other hand, as it has been previously reported CNT support may offer improved activity compared to activated carbon70,72 and this special behavior has been attributed to the different dynamic of the molecules on the close nanotube surface.73
In summary, there appears to be a trade-off in functionalizing the surface of CNT support: although acidic oxygen surface groups steers Ni catalysts through the deoxygenation pathway, they significantly diminish the intrinsic activity of this catalyst.
4. Conclusion
We have prepared a series of Ni catalysts with different loadings supported on carbon nanotubes, and studied their catalytic performance in the hydrodeoxygenation of guaiacol, a lignin model compound. The effect of the support was also studied by comparing the 15Ni/CNT catalyst with catalysts prepared over oxidized CNT (15Ni/CNTox) and thermally-treated activated carbon (15Ni/AC).The characterization performed showed that the Ni loading influenced the dispersion of Ni nanoparticles, and the formation of agglomerates at Ni loadings higher than 15 wt% was suggested. The intrinsic activity of the differently loaded catalysts varied with the relative Ni dispersion deduced from XPS. On the other hand, product selectivity did not significantly change with Ni loading, indicating that the nature of the active sites was not modified by increasing the Ni content which is evident from the similar relative proportion of Ni species present on the catalysts (deduced from XPS data). The main products from guaiacol at 100% conversion over these catalysts were ring hydrogenation products such as cyclohexanol, cyclohexane and methoxycyclohexanol.
In relation to the effect of the support, the 15Ni/AC catalyst displayed the highest dispersion of all the 15Ni/support catalyst, likely due to the higher surface area of the parent support, AC. In addition, in comparing 15Ni/CNT and 15Ni/CNTox, it appears that nitric acid oxidation did not improve the Ni dispersion. The 15Ni/CNT catalyst displayed higher initial and intrinsic rates than the 15Ni/CNTox and 15Ni/AC catalysts. Based on XPS and acid strength results, these activity differences can be explained by the different surface chemistry and textural properties of the support. It appears that the presence of oxygen groups on 15Ni/CNTox catalyst may have reduced the activity of Ni sites by hindering the adsorption and/or migration of guaiacol to the active sites. The surface chemistry and, to some extent, the textural properties influenced the selectivity of the reaction. The acid sites on the 15Ni/CNTox catalyst hindered the hydrogenation pathway while facilitating the DMO route. It is also possible that defective carbon sites from oxycarbide groups formed via the wet-oxidation treatment dissolved into Ni clusters and modified the active sites on Ni. The difference in products distribution over the 15Ni/AC and 15Ni/CNT catalyst was probably due to accessibility to active sites which controlled the different hydrogenation capacities of the catalyst.
Acknowledgements
The authors acknowledge the financial support by CONICYT-FONDECYT grant 1140528, Fondecyt Postdoctoral grants 3130483 and 3150033, PFB-27 grants and Red Doctoral REDOC.CTA, MINEDUC project UCO1202 at Universidad de Concepción.References
- A. V. Bridgwater, Chem. Eng. J., 2003, 91, 87–102 CrossRef CAS.
- J. Zakzeski, P. C. A. Bruijnincx, A. L. Jongerius and B. M. Weckhuysen, Chem. Rev., 2010, 110, 3552–3599 CrossRef CAS.
- E. Furimsky, Appl. Catal., A, 2000, 199, 147–190 CrossRef CAS.
- M. Saidi, F. Samimi, D. Karimipourfard, T. Nimmanwudipong, B. C. Gates and M. R. Rahimpour, Energy Environ. Sci., 2014, 7, 103–129 CAS.
- H. Shafaghat, P. Sirous Rezaei and W. M. A. W. Daud, RSC Adv., 2015, 5, 33990–33998 RSC.
- M.-Y. Chen, Y.-B. Huang, H. Pang, X.-X. Liu and Y. Fu, Green Chem., 2015, 17, 1710–1717 RSC.
- H. Y. Zhao, D. Li, P. Bui and S. T. Oyama, Appl. Catal., A, 2011, 391, 305–310 CrossRef CAS.
- S.-K. Wu, P.-C. Lai, Y.-C. Lin, H.-P. Wan, H.-T. Lee and Y.-H. Chang, ACS Sustainable Chem. Eng., 2013, 1, 349–358 CrossRef CAS.
- K. Li, R. Wang and J. Chen, Energy Fuels, 2011, 25, 854–863 CrossRef CAS.
- Y. Li, X. Yang, L. Zhu, H. Zhang and B. Chen, RSC Adv., 2015, 5, 80388–80396 RSC.
- S. Boullosa-Eiras, R. Lødeng, H. Bergem, M. Stöcker, L. Hannevold and E. A. Blekkan, Catal. Today, 2014, 223, 44–53 CrossRef CAS.
- A. L. Jongerius, R. W. Gosselink, J. Dijkstra, J. H. Bitter, P. C. A. Bruijnincx and B. M. Weckhuysen, ChemCatChem, 2013, 5, 2964–2972 CrossRef CAS.
- I. T. Ghampson, C. Sepulveda, R. Garcia, B. G. Frederick, M. C. Wheeler, N. Escalona and W. J. DeSisto, Appl. Catal., A, 2012, 413–414, 78–84 CrossRef CAS.
- I. T. Ghampson, C. Sepulveda, R. Garcia, J. L. Garcia Fierro, N. Escalona and W. J. DeSisto, Appl. Catal., A, 2012, 435–436, 51–60 CrossRef.
- I. T. Ghampson, C. Sepulveda, R. Garcia, L. R. Radovic, J. L. G. Fierro, W. J. DeSisto and N. Escalona, Appl. Catal., A, 2012, 439–440, 111–124 CrossRef CAS.
- C. Sepúlveda, K. Leiva, R. García, L. R. Radovic, I. T. Ghampson, W. J. DeSisto, J. L. G. Fierro and N. Escalona, Catal. Today, 2011, 172, 232–239 CrossRef.
- C. Sepúlveda, R. García, P. Reyes, I. T. Ghampson, J. L. G. Fierro, D. Laurenti, M. Vrinat and N. Escalona, Appl. Catal., A, 2014, 475, 427–437 CrossRef.
- K. Leiva, C. Sepulveda, R. Garcia, J. L. G. Fierro and N. Escalona, Catal. Commun., 2014, 53, 33–37 CrossRef CAS.
- P. E. Ruiz, K. Leiva, R. Garcia, P. Reyes, J. L. G. Fierro and N. Escalona, Appl. Catal., A, 2010, 384, 78–83 CrossRef CAS.
- K. Leiva, N. Martinez, C. Sepulveda, R. García, C. A. Jiménez, D. Laurenti, M. Vrinat, C. Geantet, J. L. G. Fierro, I. T. Ghampson and N. Escalona, Appl. Catal., A, 2015, 490, 71–79 CrossRef CAS.
- P. M. Mortensen, J.-D. Grunwaldt, P. A. Jensen and A. D. Jensen, ACS Catal., 2013, 3, 1774–1785 CrossRef CAS.
- S. Echeandia, P. L. Arias, V. L. Barrio, B. Pawelec and J. L. G. Fierro, Appl. Catal., B, 2010, 101, 1–12 CrossRef CAS.
- M. V. Bykova, D. Y. Ermakov, S. A. Khromova, A. A. Smirnov, M. Y. Lebedev and V. А. Yakovlev, Catal. Today, 2014, 220–222, 21–31 CrossRef CAS.
- M. V. Bykova, D. Y. Ermakov, V. V. Kaichev, O. A. Bulavchenko, A. A. Saraev, M. Y. Lebedev and V. А. Yakovlev, Appl. Catal., B, 2012, 113–114, 296–307 CrossRef CAS.
- M. V. Bykova, O. A. Bulavchenko, D. Y. Ermakov, M. Y. Lebedev, V. A. Yakovlev and V. N. Parmon, Catal. Ind., 2011, 3, 15–22 CrossRef.
- S. Jin, Z. Xiao, C. Li, X. Chen, L. Wang, J. Xing, W. Li and C. Liang, Catal. Today, 2014, 234, 125–132 CrossRef CAS.
- Y. Yang, C. Ochoa-Hernández, V. A. de la Peña O'Shea, P. Pizarro, J. M. Coronado and D. P. Serrano, Appl. Catal., B, 2014, 145, 91–100 CrossRef CAS.
- W. Song, Y. Liu, E. Barath, C. Zhao and J. A. Lercher, Green Chem., 2015, 17, 1204–1218 RSC.
- C. Zhao, S. Kasakov, J. He and J. A. Lercher, J. Catal., 2012, 296, 12–23 CrossRef CAS.
- J.-P. Tessonnier, O. Ersen, G. Weinberg, C. Pham-Huu, D. S. Su and R. Schlögl, ACS Nano, 2009, 3, 2081–2089 CrossRef CAS PubMed.
- H. Ohta, H. Kobayashi, K. Hara and A. Fukuoka, Chem. Commun., 2011, 47, 12209–12211 RSC.
- W. Song, Y. Liu, E. Barath, C. Zhao and J. A. Lercher, Green Chem., 2015, 17, 1204–1218 RSC.
- R. Cid and G. Pecchi, Appl. Catal., 1985, 14, 15–21 CrossRef CAS.
- A. S. Khder and A. I. Ahmed, Appl. Catal., A, 2009, 354, 153–160 CrossRef CAS.
- L. R. Pizzio, P. G. Vázquez, C. V. Cáceres and M. N. Blanco, Appl. Catal., A, 2003, 256, 125–139 CrossRef CAS.
- T. V. Choudhary, C. Sivadinarayana, C. C. Chusuei, A. Klinghoffer and D. W. Goodman, J. Catal., 2001, 199, 9–18 CrossRef CAS.
- Q.-H. Yang, P.-X. Hou, S. Bai, M.-Z. Wang and H.-M. Cheng, Chem. Phys. Lett., 2001, 345, 18–24 CrossRef CAS.
- J.-P. Tessonnier, D. Rosenthal, T. W. Hansen, C. Hess, M. E. Schuster, R. Blume, F. Girgsdies, N. Pfänder, O. Timpe, D. S. Su and R. Schlögl, Carbon, 2009, 47, 1779–1798 CrossRef CAS.
- U. Zielke, K. J. Hüttinger and W. P. Hoffman, Carbon, 1996, 34, 983–998 CrossRef CAS.
- J. P. R. Vissers, S. M. A. M. Bouwens, V. H. J. de Beer and R. Prins, Carbon, 1987, 25, 485–493 CrossRef CAS.
- S. Biniak, G. Szymanski, J. Siedlewski and A. Swiatkowski, Carbon, 1997, 35, 1799–1810 CrossRef CAS.
- S. D. Gardner, C. S. K. Singamsetty, G. L. Booth, G.-R. He and C. U. Pittman, Carbon, 1995, 33, 587–595 CrossRef CAS.
- A. B. Dongil, B. Bachiller-Baeza, A. Guerrero-Ruiz and I. Rodríguez-Ramos, J. Catal., 2011, 282, 299–309 CrossRef CAS.
- L. Pastor-Pérez, R. Buitrago-Sierra and A. Sepúlveda-Escribano, Int. J. Hydrogen Energy, 2014, 39, 17589–17599 CrossRef.
- Q. Ma, D. Wang, M. Wu, T. Zhao, Y. Yoneyama and N. Tsubaki, Fuel, 2013, 108, 430–438 CrossRef CAS.
- R. Buitrago-Sierra, J. Ruiz-Martínez, J. C. Serrano-Ruiz, F. Rodríguez-Reinoso and A. Sepúlveda-Escribano, J. Colloid Interface Sci., 2012, 383, 148–154 CrossRef CAS PubMed.
- S. Lu, C. Zhang and Y. Liu, Int. J. Hydrogen Energy, 2011, 36, 1939–1948 CrossRef CAS.
- H. Yang, S. Song, R. Rao, X. Wang, Q. Yu and A. Zhang, J. Mol. Catal. A: Chem., 2010, 323, 33–39 CrossRef CAS.
- H. Liu, H. Wang, J. Shen, Y. Sun and Z. Liu, Catal. Today, 2008, 131, 444–449 CrossRef CAS.
- P. Burattin, M. Che and C. Louis, J. Phys. Chem. B, 2000, 104, 10482–10489 CrossRef CAS.
- B. Mile, D. Stirling, M. A. Zammitt, A. Lovell and M. Webb, J. Catal., 1988, 114, 217–229 CrossRef CAS.
- D. Ugarte, A. Chatelain and W. A. D. Heer, Science, 1996, 274, 1897–1899 CrossRef CAS PubMed.
- A. Nieto-Márquez, S. Gil, A. Romero, J. L. Valverde, S. Gómez-Quero and M. A. Keane, Appl. Catal., A, 2009, 363, 188–198 CrossRef.
- A. B. Dongil, C. Rivera-Cárcamo, L. Pastor-Pérez, A. Sepúlveda-Escribano and P. Reyes, Catal. Today, 2015, 249, 72–78 CrossRef CAS.
- V. M. Shinde and G. Madras, Appl. Catal., B, 2013, 132–133, 28–38 CrossRef CAS.
- I. Czekaj, F. Loviat, F. Raimondi, J. Wambach, S. Biollaz and A. Wokaun, Appl. Catal., A, 2007, 329, 68–78 CrossRef CAS.
- A. B. Dongil, B. Bachiller-Baeza, A. Guerrero-Ruiz, I. Rodríguez-Ramos, A. Martínez-Alonso and J. M. D. Tascón, J. Colloid Interface Sci., 2011, 355, 179–189 CrossRef CAS PubMed.
- J. P. Boudou, J. I. Paredes, A. Cuesta, A. Martínez-Alonso and J. M. D. Tascón, Carbon, 2003, 41, 41–56 CrossRef CAS.
- N. Escalona, W. Aranzaez, K. Leiva, N. Martínez and G. Pecchi, Appl. Catal., A, 2014, 481, 1–10 CrossRef CAS.
- V. N. Bui, D. Laurenti, P. Afanasiev and C. Geantet, Appl. Catal., B, 2011, 101, 239–245 CrossRef CAS.
- T. Nimmanwudipong, R. Runnebaum, D. Block and B. Gates, Catal. Lett., 2011, 141, 779–783 CrossRef CAS.
- T. Nimmanwudipong, R. C. Runnebaum, D. E. Block and B. C. Gates, Energy Fuels, 2011, 25, 3417–3427 CrossRef CAS.
- X. Zhu, L. L. Lobban, R. G. Mallinson and D. E. Resasco, J. Catal., 2011, 281, 21–29 CrossRef CAS.
- C. R. Lee, J. S. Yoon, Y.-W. Suh, J.-W. Choi, J.-M. Ha, D. J. Suh and Y.-K. Park, Catal. Commun., 2012, 17, 54–58 CrossRef CAS.
- V. N. Bui, D. Laurenti, P. Delichère and C. Geantet, Appl. Catal., B, 2011, 101, 246–255 CrossRef CAS.
- B. Frank, K. Friedel, F. Girgsdies, X. Huang, R. Schlögl and A. Trunschke, ChemCatChem, 2013, 5, 2296–2305 CrossRef CAS.
- A. K. Deepa and P. L. Dhepe, ChemPlusChem, 2014, 79, 1573–1583 CrossRef CAS.
- F. Coloma, A. Sepúlveda-Escribano, J. L. G. Fierro and F. Rodríguez-Reinoso, Appl. Catal., A, 1997, 150, 165–183 CrossRef CAS.
- A. E. Aksoylu, M. M. A. Freitas and J. L. Figueiredo, Appl. Catal., A, 2000, 192, 29–42 CrossRef CAS.
- E. O. Jardim, M. Gonçalves, S. Rico-Francés, A. Sepúlveda-Escribano and J. Silvestre-Albero, Appl. Catal., B, 2012, 113–114, 72–78 CrossRef CAS.
- M. L. Toebes, F. F. Prinsloo, J. H. Bitter, A. J. van Dillen and K. P. de Jong, J. Catal., 2003, 214, 78–87 CrossRef CAS.
- L. Li, G. Wu and B.-Q. Xu, Carbon, 2006, 44, 2973–2983 CrossRef CAS.
- K.-I. Tanaka, M. Shou, H. Zhang, Y. Yuan, T. Hagiwara, A. Fukuoka, J. Nakamura and D. Lu, Catal. Lett., 2008, 126, 89–95 CrossRef CAS.
Footnote |
| † Electronic supplementary information (ESI) available. See DOI: 10.1039/c5ra22540j |
| This journal is © The Royal Society of Chemistry 2016 |

