Emerging investigators series: disinfection by-products in mixed chlorine dioxide and chlorine water treatment†
Wenhui
Gan
a,
Huang
Huang
a,
Xin
Yang
*a,
Ziru
Peng
a and
Guanghao
Chen
*b
aSchool of Environmental Science & Engineering, Sun Yat-sen University, Guangzhou, China. E-mail: yangx36@mail.sysu.edu.cn; Tel: +86 2039332690
bDepartment of Civil and Environmental Engineering, The Hong Kong University of Science & Technology, Clear Water Bay, Hong Kong, China. E-mail: ceghchen@ust.hk; Tel: +852 23588752
First published on 24th May 2016
Abstract
Chlorine dioxide (ClO2) is an alternative to chlorine in water treatment due to its more limited formation of chlorinated disinfection by-products (DBPs). However, on-site generation of ClO2 often involves the production of free chlorine, unreacted reagents or side-reaction products. The disinfectant is thus a mixture of ClO2 and chlorine. The focus of this study was on the role of the mixed ClO2/chlorine oxidant in the changes of the precursors of DBPs including trihalomethanes (THMs), chloral hydrate (CH), haloketones (HKs), haloacetonitriles (HANs), halonitromethanes (HNMs), chlorite and chlorate. The influence of bromide ions in water was also included. The ratio of ClO2 to chlorine was found to significantly affect the DBPs formed, depending on the water sample's properties. In the three waters tested, THMs formation was the least at a ClO2 to chlorine mass ratio of 1![[thin space (1/6-em)]](https://www.rsc.org/images/entities/char_2009.gif) :
:![[thin space (1/6-em)]](https://www.rsc.org/images/entities/char_2009.gif) 0.5 or 1
0.5 or 1![[thin space (1/6-em)]](https://www.rsc.org/images/entities/char_2009.gif) :
:![[thin space (1/6-em)]](https://www.rsc.org/images/entities/char_2009.gif) 0.8. Both decreases and increases in the formation of CH and HKs after ClO2/chlorine pre-oxidation were observed compared with using ClO2 alone. The formation of HANs and TCNM was the least at a ClO2 to chlorine mass ratio of 1
0.8. Both decreases and increases in the formation of CH and HKs after ClO2/chlorine pre-oxidation were observed compared with using ClO2 alone. The formation of HANs and TCNM was the least at a ClO2 to chlorine mass ratio of 1![[thin space (1/6-em)]](https://www.rsc.org/images/entities/char_2009.gif) :
:![[thin space (1/6-em)]](https://www.rsc.org/images/entities/char_2009.gif) 0.5 or 1
0.5 or 1![[thin space (1/6-em)]](https://www.rsc.org/images/entities/char_2009.gif) :
:![[thin space (1/6-em)]](https://www.rsc.org/images/entities/char_2009.gif) 0.8, although in the GM water sample no trend was apparent. In the presence of bromide, more bromine incorporation was found after ClO2/chlorine pre-oxidation than when ClO2 alone was used or without pre-oxidation at all. With an increase in the chlorine fraction in the mixed oxidant, less chlorite was formed; chlorate formation was enhanced instead. Therefore, the ratio of ClO2 to chlorine needs to be monitored and adjusted to obtain the best control of DBP formation.
0.8, although in the GM water sample no trend was apparent. In the presence of bromide, more bromine incorporation was found after ClO2/chlorine pre-oxidation than when ClO2 alone was used or without pre-oxidation at all. With an increase in the chlorine fraction in the mixed oxidant, less chlorite was formed; chlorate formation was enhanced instead. Therefore, the ratio of ClO2 to chlorine needs to be monitored and adjusted to obtain the best control of DBP formation.
Water impactChlorine dioxide (ClO2) is an alternative disinfectant to chlorine as it reduces the formation of halogenated disinfection by-products (DBPs). The on-site generation of ClO2 is often mixed with free chlorine (Cl2), unreacted reagents or side-reaction products. This study focuses on the role of the mixed oxidant (ClO2/Cl2) in the changes of the precursors of regulated and emerging DBPs. The results indicate the significance in controlling the ClO2/Cl2 ratio during the use of a ClO2 generator. The work is significant in advancing the scientific understanding of the role of a mixed ClO2/Cl2 oxidant in DBP formation. |
Introduction
Chlorine is one of the most widely used disinfectants worldwide. Chlorine reacts with natural organic matter not only via oxidation but also by chlorine substitution, generating a variety of chlorinated by-products such as THMs and haloacetic acids (HAAs).1,2 Chlorine dioxide (ClO2) is an alternative to chlorine as a disinfectant. It can effectively remove color, taste and odor, and inactivate bacteria and viruses, but it does not form appreciable amounts of halogenated disinfection by-products (DBPs), such as THMs and HAAs.3,4 ClO2 is often used for pre-oxidation.5,6 The oxidation by ClO2 is through electron transfer, resulting mainly in chlorite (ClO2−) and chlorate (ClO3−), which arise through transformation of about 50 to 70% and 10 to 20% of the ClO2, respectively..7–9 Thus the purification dose of ClO2 in drinking water is generally only a few mg L−1 to meet the guideline of the World Health Organization10 and China's regulations,11 concerning chlorite and chlorate levels not exceeding 0.7 mg L−1 separately.ClO2 is usually generated on site because ClO2 gas is relatively unstable when compressed.12 The ClO2 thus produced is sometimes mixed with residual chlorine gas from the raw reactants or with the side products. In the chlorine–chlorite reaction for generating ClO2, chlorine is in excess and the gas produced is a mixture of unreacted chlorine and ClO2.13,14 Also, in the well-known Day–Kesting process using chlorate and hydrochloric acid to generate ClO2, chlorine is produced simultaneously through side reactions.15 In China, ClO2 generators producing a mixture of ClO2 and chlorine are widely used.16
Free chlorine reacts slowly with ClO2 in water as eqn (1) shows.17
| HOCl + 2ClO2 + H2O → 2ClO−3 + Cl− + 3H+ k = (1.5 ± 0.3) × 10−3 M−1 s−1 | (1) |
Chlorine also reacts with chlorite according to eqn (2) and (3).18,19
| HOCl + 2ClO−2 + H+ → 2ClO2 + Cl− + H2O k = (1.1 ± 0.03) × 106 M−2 s−1 | (2) |
| 2HOCl + ClO−2 → ClO−3 + Cl2 + H2O k = (2.1 ± 0.1) × 10−3 M−2 s−1 | (3) |
A mixture of ClO2 and chlorine oxidizes differently from a single oxidant in terms of disinfection efficiency. Sequential oxidation with chlorine dioxide followed by chlorine has been reported more effective for inactivating pathogens such as Bacillus subtilis spores and Cryptosporidium sp. than using ClO2 alone.19,20 The mixed oxidant has a synergistic effect, likely caused by the activity of the different disinfection agents reacting with specific chemical groups of the cell wall to achieve enhanced bacterial inactivation.19 Intermediates such as ClO2− may also provide additional inactivation efficiency.19
A mixed ClO2 and chlorine oxidant also affects the formation of DBPs. Oxidation with ClO2 generates significant amounts of organic by-products such as aldehydes, ketones and carboxylic acids,21 which are possible precursors of CH22 or HKs.9 The precursors of some nitrogenous DBPs (N-DBPs) decreased after ClO2 pre-oxidation.23 Limited results show a decrease in THMs formation with ClO2/chlorine pre-oxidation at a mass ratio of 2![[thin space (1/6-em)]](https://www.rsc.org/images/entities/char_2009.gif) :
:![[thin space (1/6-em)]](https://www.rsc.org/images/entities/char_2009.gif) 1 compared with using ClO2 alone. When the ratio is 1
1 compared with using ClO2 alone. When the ratio is 1![[thin space (1/6-em)]](https://www.rsc.org/images/entities/char_2009.gif) :
:![[thin space (1/6-em)]](https://www.rsc.org/images/entities/char_2009.gif) 1, 40% more THMs is formed than when using ClO2 alone.24 Chlorite is reduced by about 20% and chlorate is increased by about 15% when the ClO2/chlorine mass ratio is 1
1, 40% more THMs is formed than when using ClO2 alone.24 Chlorite is reduced by about 20% and chlorate is increased by about 15% when the ClO2/chlorine mass ratio is 1![[thin space (1/6-em)]](https://www.rsc.org/images/entities/char_2009.gif) :
:![[thin space (1/6-em)]](https://www.rsc.org/images/entities/char_2009.gif) 1 compared with using ClO2 alone.25
1 compared with using ClO2 alone.25
This study was designed to evaluate how mixed ClO2/Cl2 changes the formation potential for major DBPs. The DBPs evaluated were trihalomethanes, chloral hydrate, haloketones, HANs, trichloronitromethane (TCNM), chlorite and chlorate. In some of the water samples, bromide ions were spiked to evaluate the effect of bromide on DBP formation.
Materials and methods
Reagents
A mixed standard containing HANs, TCNM and HKs, a THMs mixture standard, CH, and internal and surrogate standards were obtained from Supelco (USA). Sodium chlorite, sodium chlorate, potassium bromide and ethylenediamine were obtained from J&K (China). Ascorbic acid and anhydrous sodium sulfate were obtained from Keyinbio (China). The stock free chlorine solution was a dilution of 5% sodium hypochlorite (NaOCl) from Sigma (USA).A stock solution of ClO2 was prepared from gaseous ClO2 by slowly adding dilute sulfuric acid (H2SO4) (2 mL of concentrated H2SO4 diluted with 18 mL of ultrapure water) to a sodium chlorite (NaClO2) solution (10 g of NaClO2 in 750 mL of ultrapure water) according to the standard method (Fig. S1 in the ESI†).26 Chlorine impurities were absorbed by passing the gas stream through a saturated NaClO2 solution. The ClO2 stock solution was collected in ice-cooled ultrapure water. The concentration of ClO2 was determined using the standard 4500-ClO2 DPD method before use.27 The purity of the ClO2 stock solution was greater than 99%.
Sample collection
A stock solution of natural organic matter (NOM) was prepared by suspending Suwannee River RO NOM isolate (SRNOM) in ultrapure water and filtering through 0.45 μm membranes. The SRNOM stock solution was diluted to a dissolved organic carbon (DOC) content of 4 mg L−1 before use.Water samples were collected from the water source of two water treatment plants in Guangdong Province, China which will be referred to as HS and GM. The samples were filtered through 0.45 μm membranes and stored at 4 °C until use. Dissolved organic carbon concentration, UV absorbance at 254 nm (UV254), and bromide, phosphate, sulfate, nitrite, nitrate and ammonia nitrogen concentrations were analyzed. The water quality parameters of the water samples are listed in Table S1 in the ESI.†
Experimental procedures
Amber glass vials (60 mL) with Teflon-faced septa caps were used in the experiments. All of the samples were buffered at pH 7.0 with 10 mM phosphate buffer. For pre-oxidation, the water samples were dosed simultaneously with chlorine and 1 mg L−1 ClO2. The chlorine dose varied from 0.1 mg L−1 to 1 mg L−1 to achieve ClO2 to Cl2 mass ratios from 1![[thin space (1/6-em)]](https://www.rsc.org/images/entities/char_2009.gif) :
:![[thin space (1/6-em)]](https://www.rsc.org/images/entities/char_2009.gif) 0.1 to 1
0.1 to 1![[thin space (1/6-em)]](https://www.rsc.org/images/entities/char_2009.gif) :
:![[thin space (1/6-em)]](https://www.rsc.org/images/entities/char_2009.gif) 1. After reacting for 45 minutes, when both oxidants had been depleted as proved by the DPD colorimetric method, the samples were dosed with excess chlorine (40 mg L−1) and reacted without headspace for 24 hours at room temperature (23 ± 1 °C) to test the DBP formation potential. 50 mg of ascorbic acid was added for quenching after 24 hours post-chlorination and no residual chlorine was left as proved by the colorimetric method. After quenching, the samples were extracted immediately with methyl tert-butyl ether (MTBE). DBPs in the extracts were quantified by gas chromatography. All of the DBP formation tests were run in duplicate. Error bars represent the difference in the concentrations of the two duplicate samples. To evaluate the impact of bromide ions, various bromide concentrations (0.1–2 mg L−1) were spiked into the HS water sample before chlorination (40 mg L−1) with/without pre-oxidation.
1. After reacting for 45 minutes, when both oxidants had been depleted as proved by the DPD colorimetric method, the samples were dosed with excess chlorine (40 mg L−1) and reacted without headspace for 24 hours at room temperature (23 ± 1 °C) to test the DBP formation potential. 50 mg of ascorbic acid was added for quenching after 24 hours post-chlorination and no residual chlorine was left as proved by the colorimetric method. After quenching, the samples were extracted immediately with methyl tert-butyl ether (MTBE). DBPs in the extracts were quantified by gas chromatography. All of the DBP formation tests were run in duplicate. Error bars represent the difference in the concentrations of the two duplicate samples. To evaluate the impact of bromide ions, various bromide concentrations (0.1–2 mg L−1) were spiked into the HS water sample before chlorination (40 mg L−1) with/without pre-oxidation.
To determine the time dependent profile of disinfectant residual, 5 mg L−1 ClO2 mixed with/without 2.5 mg L−1 Cl2 were dosed to a SRNOM (4 mg L−1 DOC) solution buffered at pH 7. At different time intervals, an aliquot was withdrawn and chlorine residual was quenched with 20 mg of glycine. The ClO2 residual was analyzed by the DPD colorimetric method.
To test the influence of the mixed oxidant on the formation of chlorite and chlorate, SRNOM samples were spiked with 10 mg L−1 ClO2 combined with different doses of chlorine. After reacting for 45 minutes, ethylenediamine was added as a preservative before analysis. The samples were analyzed within 3 days according to USEPA Method 300.1.28
Analytical methods
DOC was analyzed using a TOC analyzer (TOC-VCPH, Shimadzu). UV absorbance at 254 nm was determined using a UV/vis spectrophotometer (UV2700, Shimadzu). Bromide and other anions were quantified through ion chromatography (ICS1000, Thermo Fisher).Fluorescence EEM measurements were conducted using an Aqualog® absorbance and 3D fluorescence scanning spectrometer (HORIBA Scientific, French). The excitation wavelengths were set from 200 to 400 nm in 3 nm increments, and the emission wavelengths were detected from 290 to 500 nm in 1.63 nm.
The analyses of THMs, HANs, HNM, HKs and CH were carried out using a gas chromatograph (Agilent 7890A) with an electron capture detector using USEPA Method 551.1. The detection limit for THMs and CH was 0.1 μg L−1 and for the other DBPs was 0.2 μg L−1. The column used was an HP-5 fused silica capillary column (30 m × 0.25 mm I.D. with a 0.25 μm film thickness, J&W Scientific). The temperature program of the chromatograph consisted of an initial temperature of 35 °C for 6 minutes, ramping to 100 °C at 10 °C min−1 and holding for 5 minutes, ramping to 220 °C at 40 °C min−1 and holding for 2 minutes.
Chlorite, chlorate and bromide were analyzed using ion chromatography (DX-600, Dionex). The detection limit of bromide, chlorite and chlorate was 20 μg L−1. The column used was a Dionex AS9-HC (2 mm) and the detector was a Dionex CD20. The eluent was 9 mM Na2CO3 at a 0.4 mL min−1 flow rate. The chlorate and chlorite in the NaClO stock solution were measured by the iodometric method.29,30 The details of the iodometric method are described in Text S1 in the ESI.†
Results and discussion
The changes in disinfectant residual
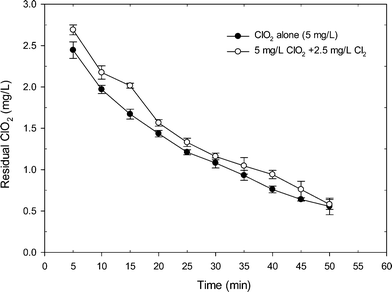
Fig. 1 shows the degradation of ClO2 when applying ClO2 alone and the mixed oxidant to a SRNOM solution at pH 7. Clearly, the mixed ClO2/Cl2 oxidant had more ClO2 residual than the application of ClO2 alone. Within 50 min reaction time, the residual of ClO2 in the mixed oxidant was higher than that from ClO2 application alone by an average of 0.15 mg L−1. After 15 min of reaction, the residual of ClO2 was 2.02 mg L−1 in the mixed oxidant, which was 20% higher than that from ClO2 application alone (1.67 mg L−1). The higher level of residual ClO2 during mixed oxidant pre-oxidation was probably related to the reaction of chlorine with chlorite which regenerates ClO2, as shown in eqn (2) and Fig. S2.† Another possible reason was that the existence of Cl2 may complete with ClO2 for the reaction with NOM and thus reduces ClO2 demand during the reaction, causing higher residual ClO2 during mixed oxidant pre-oxidation.The changes in organic matter properties
The changes in the water properties were investigated by using fluorescence EEM. EEMs for the SRNOM, HS and GM samples were analyzed before and after mixed oxidant pre-oxidation (ClO2/Cl2) and the results are shown in Fig. 2 and Fig. S3 and S4.† EEMs were delineated into five excitation–emission regions: aromatic proteins (regions I and II, λex < 250 nm, λem < 380 nm), fulvic acid-like (region III, λex < 250 nm, λem > 380 nm), soluble microbial by-product-like (region IV, 250 nm < λex < 380 nm, λem < 380 nm), and humic acid-like (region V, λex > 250 nm, λem > 380 nm).31 | ||
Fig. 2 Fluorescence EEMs of (a) the SRNOM sample (4 mg L−1 DOC), (b) SRNOM + 1 mg L−1 ClO2 and (c) SRNOM + mixed oxidant at a mass ratio of 1![[thin space (1/6-em)]](https://www.rsc.org/images/entities/char_2009.gif) : :![[thin space (1/6-em)]](https://www.rsc.org/images/entities/char_2009.gif) 0.5 (ClO2/Cl2). 0.5 (ClO2/Cl2). | ||
Regional integration of the fluorescence spectra was conducted to quantify the fluorescence spectra by using the following equation:32
For the three samples, fulvic and humic acid-like compounds were dominant (Fig. 1, Fig. S3 and S4†). But the percentage of constituents varied with water samples, for example, region II occupied only 1.87% in SRNOM, but it accounted for more than 10% in the HS and GM waters (Table S2†). The ClO2 pre-oxidation alone greatly decreased the intensity of the fulvic and humic acid-like regions of the three samples. For the HS samples, the intensity of the fulvic and humic acid-like regions decreased with increasing doses of chlorine in the mixed oxidant. The mixed oxidant slightly reduced the fluorescence intensity in the fulvic and humic acid regions of the GM water sample, but did not change the decomposition of the fulvic and humic acid-like matrix on the SRNOM samples. Fulvic acids and humic acids from different sources may differ in their nature33 and they may have different reactivities towards oxidants.34 The change in fluorescence in the aromatic protein and soluble microbial by-product-like fractions (regions II and IV) varied with water samples. Fluorescence of regions II and IV of the SRNOM sample was reduced after treatment with ClO2 alone and mixed ClO2/Cl2 solutions, while a larger percentage of these regions was observed in the GM sample after pre-oxidation. And no significant change in regions II and IV was found in the HS samples. Therefore, the different natures of NOM in the samples may account for the distinguished performance.
THMs formation potential
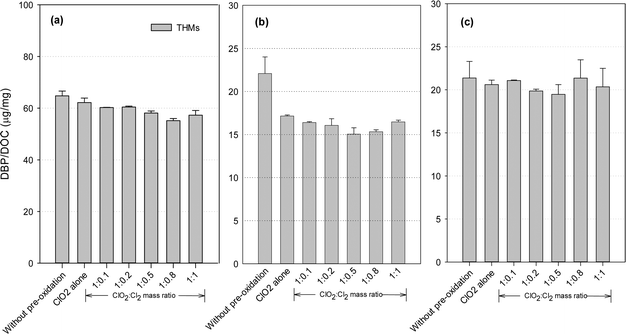
DBP formation potential was obtained in our study after 24 hours of chlorination with an excessive dose of chlorine, in order to fully convert the precursors to DBPs and maximize DBP formation. Fig. 3 shows the THMs formation after post-chlorination with/without pre-oxidation. ClO2 pre-oxidation alone could effectively reduce THMs formation. Compared with the application of ClO2 alone, the mixed oxidant decreased THMs by 2.7–11.3% for the SRNOM samples. Similar trends were observed with the HS and GM samples, where the decreases were 4.0–12.3% and 5.8–22.6%, respectively. Minimal THMs was observed at a ClO2 to Cl2 mass ratio of 1![[thin space (1/6-em)]](https://www.rsc.org/images/entities/char_2009.gif) :
:![[thin space (1/6-em)]](https://www.rsc.org/images/entities/char_2009.gif) 0.8 with the SRNOM samples and at a similar mass ratio of 1
0.8 with the SRNOM samples and at a similar mass ratio of 1![[thin space (1/6-em)]](https://www.rsc.org/images/entities/char_2009.gif) :
:![[thin space (1/6-em)]](https://www.rsc.org/images/entities/char_2009.gif) 0.5 with the HS and GM samples. One previous study has reported the lowest THMs level with pre-oxidation at a ClO2 to Cl2 mass ratio of 1
0.5 with the HS and GM samples. One previous study has reported the lowest THMs level with pre-oxidation at a ClO2 to Cl2 mass ratio of 1![[thin space (1/6-em)]](https://www.rsc.org/images/entities/char_2009.gif) :
:![[thin space (1/6-em)]](https://www.rsc.org/images/entities/char_2009.gif) 0.66 following 1 hour of chlorination.35
0.66 following 1 hour of chlorination.35
Hydrophobic aromatic organic matter is a known THMs precursor during chlorination. With a mixed ClO2/chlorine oxidant, chlorine reacts with natural organic matter to form halogenated DBPs, and increasing the chlorine dose leads to increased formation of THMs. Thus a high proportion of chlorine in the mixed oxidant would be expected to cause more THMs formation. On the other hand, chlorine reacts with chlorite to promote ClO2 formation (eqn (2)). ClO2 pre-oxidation has been reported to make some of the hydrophobic NOM more hydrophilic, thus producing less THMs during subsequent chlorination.24 Thus, one optimal mixed ratio exists to generate the minimum THMs considering chlorine's two roles.
CH formation potential
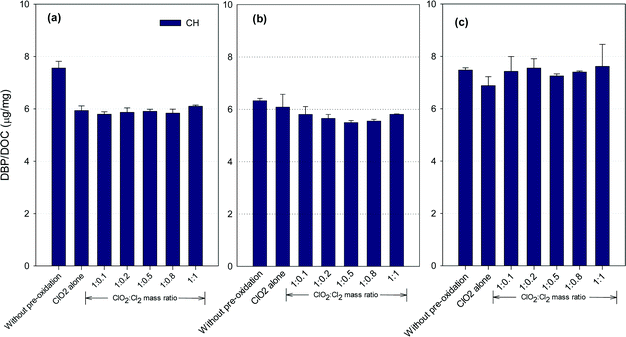
Fig. 4 shows the formation of CH after ClO2 pre-oxidation alone and mixed oxidant pre-oxidation. Varying the ClO2/chlorine mass ratio did not change the CH formation in the SRNOM samples. The lowest CH concentrations in the HS water samples occurred at a ClO2/Cl2 mass ratio of 1![[thin space (1/6-em)]](https://www.rsc.org/images/entities/char_2009.gif) :
:![[thin space (1/6-em)]](https://www.rsc.org/images/entities/char_2009.gif) 0.5, 9.5% lower than with ClO2 pre-oxidation alone. However, mixed oxidant pre-oxidation of the GM samples led to 13 to 17% greater CH yields than with ClO2 alone.
0.5, 9.5% lower than with ClO2 pre-oxidation alone. However, mixed oxidant pre-oxidation of the GM samples led to 13 to 17% greater CH yields than with ClO2 alone.
ClO2 oxidation destroys hydrophobic organic matter, which is a CH precursor.22 For example, tryptophan, a common aromatic amino acid in natural organic matter, has high molar conversion to CH during chlorination.36 ClO2 has been reported to react vigorously with tryptophan37,38 to reduce CH precursors. Meanwhile, the reaction of ClO2 with natural organic matter forms acetaldehyde, which reacts with chlorine to form CH, with chloroacetaldehyde as an intermediate,39 though it is unlikely the dominant pathway for CH formation in natural waters.40 Meanwhile, the SRNOM and GM waters exhibited higher SUVA (Table S1†), suggesting more compounds with aromatic properties are present in these two waters. Phenolic structures in natural waters may serve as the predominant precursors for haloacetaldehydes in chlorination.40 Therefore, it was possible that more phenolic moieties are present in the SRNOM and GM waters and cause their enhanced or constant CH formation after mixed oxidant pre-oxidation compared to pre-oxidation with ClO2 alone. Veratryl alcohol and vanillyl alcohol, model compounds of lignin, can be oxidized to methanol by ClO2,41 and these are other potential CH precursors. The variety of CH formation in different water samples using a mixed ClO2/chlorine oxidant is thus to be expected.
HKs formation potential
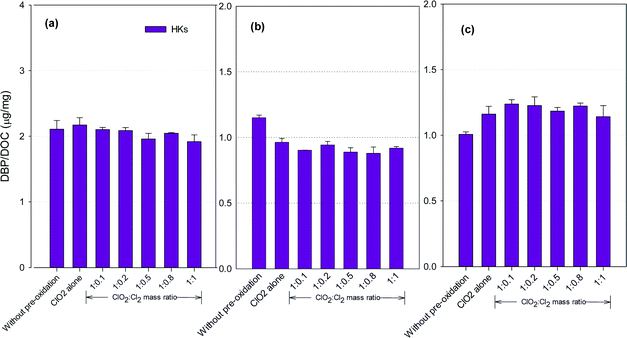
Fig. 5 shows the formation of HKs after pre-oxidation with ClO2 alone and the mixed oxidant. Mixed oxidant pre-oxidation reduced HKs formation in the SRNOM and HS samples compared to ClO2 alone, with the least formed at a ClO2 to Cl2 mass ratio of 1![[thin space (1/6-em)]](https://www.rsc.org/images/entities/char_2009.gif) :
:![[thin space (1/6-em)]](https://www.rsc.org/images/entities/char_2009.gif) 0.8. It corresponded to 11.7% and 9.3% reductions, respectively, compared with using ClO2 alone. The HKs in the GM water samples, however, increased by 2.0–8.4% at ClO2 to Cl2 mass ratios of 1
0.8. It corresponded to 11.7% and 9.3% reductions, respectively, compared with using ClO2 alone. The HKs in the GM water samples, however, increased by 2.0–8.4% at ClO2 to Cl2 mass ratios of 1![[thin space (1/6-em)]](https://www.rsc.org/images/entities/char_2009.gif) :
:![[thin space (1/6-em)]](https://www.rsc.org/images/entities/char_2009.gif) 0.1 to 1
0.1 to 1![[thin space (1/6-em)]](https://www.rsc.org/images/entities/char_2009.gif) :
:![[thin space (1/6-em)]](https://www.rsc.org/images/entities/char_2009.gif) 1.
1.
Hydrocarbons in natural organic matter having benzylic hydrogen atoms are readily oxidized by ClO2, and ketones and alcohols are the main oxidation products,21 between which ketones are potential precursors of HKs during subsequent chlorination. Meanwhile, ClO2 oxidation alone also generates 1,1-dichloropropanone (DCP), a haloketone, in a greater amount than chlorine oxidation.42 Decrease in HKs has been observed in several natural water samples after ClO2 pre-oxidation.23 The different NOMs in different water samples explain the varied DBP formation tendencies.
N-DBP formation potential
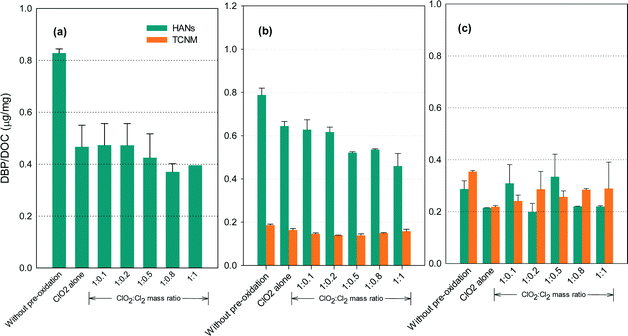
Fig. 6 shows the formation of HANs and TCNM after pre-oxidation with ClO2 alone and with the mixed oxidant. The N-DBP levels were low (below 0.8 μg mg−1 DOC). No detectable TCNM was found in the SRNOM samples after chlorination. The lowest levels of HANs or TCNM for the SRNOM and HS samples occurred at ClO2/chlorine ratios of 1![[thin space (1/6-em)]](https://www.rsc.org/images/entities/char_2009.gif) :
:![[thin space (1/6-em)]](https://www.rsc.org/images/entities/char_2009.gif) 0.5 or 1
0.5 or 1![[thin space (1/6-em)]](https://www.rsc.org/images/entities/char_2009.gif) :
:![[thin space (1/6-em)]](https://www.rsc.org/images/entities/char_2009.gif) 0.8. Increasing TCNM formation was observed in GM water with an increasing ClO2/chlorine ratio.
0.8. Increasing TCNM formation was observed in GM water with an increasing ClO2/chlorine ratio.
Amino acids and amines are reactive HANs and TCNM precursors in chlorination.43,44 Among the amino acids, histidine, tryptophan, tyrosine, asparagine and alanine generate appreciable dichloroacetonitrile during chlorination, and proline, tryptophan and alanine generated great amounts of TCNM.45 ClO2 has been reported to react with proline, histidine, tryptophan and tyrosine by attacking electron-rich aromatic moieties as well as the nitrogen atom lone electron pair, generating lower molecular weight compounds.46 Tertiary amino group-containing compounds such as cysteine, with a SH group, were the most reactive amino acids to ClO2,46 so increasing the proportion of chlorine in the mixed oxidant is likely to reduce HANs and TCNM formation by taking advantage of the reforming of ClO2 from chlorine with chlorite. But further increases in chlorine will form increasing amounts of HANs and TCNM which may exceed the decrease of their amounts due to ClO2 oxidation. Additionally, ClO2 is unreactive towards some amino acids such as alanine and glycine.47 Primary and secondary amines, which are potential TCNM precursors, are unreactive to ClO2 under water treatment conditions.46 Therefore, the reduction in the amounts of HANs and TCNM by ClO2 depends on the constituents of the NOM in the water.
Using ClO2 and Cl2 with bromide-rich waters
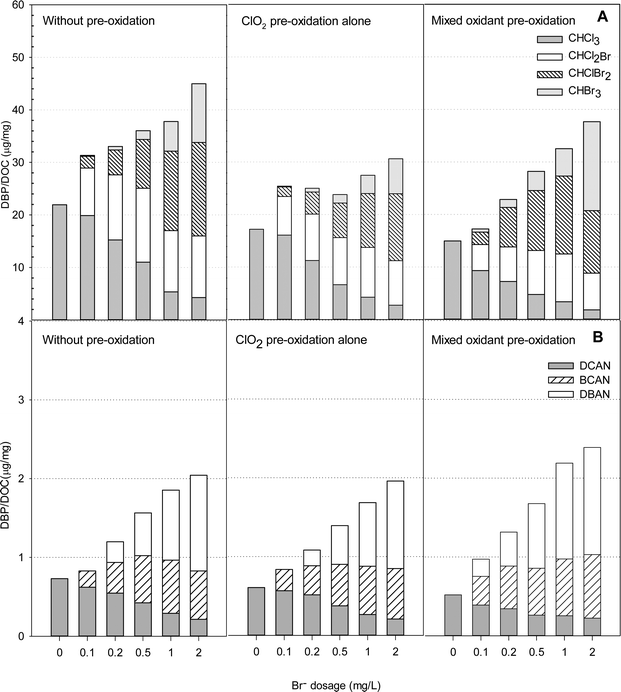
Fig. 7 presents the formation of DBPs during chlorination of HS samples in the presence of various bromide concentrations after pre-oxidation with ClO2 alone and with the mixed oxidant. In the presence of bromide, four THMs (CHCl3, CHCl2Br, CHClBr2 and CHBr3) were detected, and the total concentrations formed during chlorination ranged from 16.7 to 34.2 μg mg−1 DOC when the bromide concentrations increased from 0 to 2 mg L−1 (Table S3†).ClO2 pre-oxidation was effective in reducing THMs formation in the bromide-rich water. The total concentrations of THMs formed with ClO2 pre-oxidation (at 1 mg L−1) were 9 to 24% lower than those without pre-oxidation. A ClO2 to chlorine mass ratio of 1![[thin space (1/6-em)]](https://www.rsc.org/images/entities/char_2009.gif) :
:![[thin space (1/6-em)]](https://www.rsc.org/images/entities/char_2009.gif) 0.5 was applied to the HS water samples, as the least DBPs were formed at that ratio. Interestingly, when bromide was less than 0.5 mg L−1, pre-oxidation with the mixed oxidant formed less THMs than applying ClO2 alone. When the bromide concentration was higher than 0.5 mg L−1, however, the mixed oxidant had the opposite effect. The mixed oxidant in pretreatment caused 12%, 13% and 17% increases in the total THMs levels compared with ClO2 pre-oxidation alone in the presence of 0.5, 1.0 and 2.0 mg L−1 of bromide, respectively. It should also be noted that the mixed oxidant caused more CHBr3 formation than pretreatment with ClO2 alone or without pre-oxidation at all. The concentration of CHBr3 in the presence of 2.0 mg L−1 bromide was 13.7 μg mg−1 DOC, which was 61% higher than without pre-oxidation and 142% higher than with ClO2 pre-oxidation alone.
0.5 was applied to the HS water samples, as the least DBPs were formed at that ratio. Interestingly, when bromide was less than 0.5 mg L−1, pre-oxidation with the mixed oxidant formed less THMs than applying ClO2 alone. When the bromide concentration was higher than 0.5 mg L−1, however, the mixed oxidant had the opposite effect. The mixed oxidant in pretreatment caused 12%, 13% and 17% increases in the total THMs levels compared with ClO2 pre-oxidation alone in the presence of 0.5, 1.0 and 2.0 mg L−1 of bromide, respectively. It should also be noted that the mixed oxidant caused more CHBr3 formation than pretreatment with ClO2 alone or without pre-oxidation at all. The concentration of CHBr3 in the presence of 2.0 mg L−1 bromide was 13.7 μg mg−1 DOC, which was 61% higher than without pre-oxidation and 142% higher than with ClO2 pre-oxidation alone.
Dichloroacetonitrile (DCAN), bromochloroacetonitrile (BCAN) and dibromoacetonitrile (DBAN) were detected after treatment in some samples containing bromide, but no trichloroacetonitrile was found. An increase in the bromide concentration enhanced HANs formation with or without pre-oxidation. The HANs yields were the highest in the samples containing 2 mg L−1 bromide with the mixed pre-oxidant. The levels were 17% higher than without pre-oxidation and 22% higher than with ClO2 pre-oxidation alone. But in the absence of bromide, HANs formation was the lowest using mixed oxidant (ClO2/chlorine) pre-oxidation. Among the HANs, dibromoacetonitrile was the most abundant using mixed oxidant pre-oxidation.
Bromide not only enhanced the total concentration of DBPs, it also favored the yields of brominated species. Bromine incorporation factors (BIFs) were computed to indicate the degree of bromine substitution in the DBPs.48 The calculations are shown in eqn (4) and (5). The BIFs of the HS samples under different treatment scenarios are summarized in Table 1.
 | (4) |
 | (5) |
![[thin space (1/6-em)]](https://www.rsc.org/images/entities/char_2009.gif) :
:![[thin space (1/6-em)]](https://www.rsc.org/images/entities/char_2009.gif) 0.5 mass ratio)
0.5 mass ratio)
| Br− (mg L−1) | THMs | HANs | ||||
|---|---|---|---|---|---|---|
| Without pre-oxidation | ClO2–Cl2 | ClO2/Cl2 (1![[thin space (1/6-em)]](https://www.rsc.org/images/entities/char_2009.gif) : :![[thin space (1/6-em)]](https://www.rsc.org/images/entities/char_2009.gif) 0.5)–Cl2 0.5)–Cl2 |
Without pre-oxidation | ClO2–Cl2 | ClO2/Cl2 (1![[thin space (1/6-em)]](https://www.rsc.org/images/entities/char_2009.gif) : :![[thin space (1/6-em)]](https://www.rsc.org/images/entities/char_2009.gif) 0.5)–Cl2 0.5)–Cl2 |
|
| 0.1 | 0.34 | 0.34 | 0.50 | 0.19 | 0.25 | 0.65 |
| 0.2 | 0.56 | 0.60 | 0.91 | 0.59 | 0.55 | 0.89 |
| 0.5 | 0.85 | 0.92 | 1.27 | 0.89 | 0.90 | 1.17 |
| 1 | 1.33 | 1.32 | 1.48 | 1.16 | 1.16 | 1.29 |
| 2 | 1.56 | 1.59 | 1.97 | 1.31 | 1.32 | 1.34 |
The BIF increased with increasing bromide concentration, as Table 1 shows. The BIF with mixed oxidant pre-oxidation increased from 0.49 to 1.97 as the bromide levels increased from 0.1 to 2 mg L−1. Enhanced bromide substitutions were observed during pre-oxidation and post-chlorination as well (Table S4†). Within 45 min of pre-oxidation (0–45 min), the mixed oxidant treatment exhibited the highest BIF for THMs, followed by chlorination. No bromide substitution was observed during ClO2 pre-oxidation alone, because bromide would not be oxidized by ClO2 to form hypobromite.47
The results indicated that the mixed oxidant promotes bromide substitution reactions. There are several reasons for this. Firstly, in the presence of chlorine, bromide is quickly oxidized to bromine.49 Bromine is more reactive to hydrophilic and low MW precursors than to hydrophobic and high MW ones.50 After pre-oxidation with either ClO2 alone or with ClO2/chlorine, hydrophobic precursors are transformed to hydrophilic ones, which favor bromine incorporation. More precursors may be transformed with the mixed ClO2/chlorine oxidant due to oxidation by chlorine or by reformed ClO2. Secondly, some precursors would react with bromine, instead of chlorine, to form brominated by-products. For example, lysine reacts with chlorine to form nitrile and chloride, but it reacts with bromine through halogen-transfer reactions and forms brominated products.51 Thirdly, HANs underwent HOCl-catalyzed hydrolysis during the formation potential study as excess chlorine was applied. The hydrolysis rate was species-dependent and followed the order DBAN < BCAN < DCAN.52,53 The chlorine residual after 24 hours post-chlorination was higher in the mixed ClO2/Cl2 oxidant than ClO2 alone (Table S5†). It was possible that more chlorinated HANs was decomposed in the mixed ClO2/Cl2 oxidant, leading to higher proportion of brominated HANs.
Therefore, the mixed ClO2/chlorine oxidant leads to the higher BIFs observed with THMs and HANs. In waters containing high concentrations of bromide, applying a mixed ClO2/chlorine oxidant is not recommended due to the enhanced formation of brominated DBPs, which are known to be more toxic than their chlorinated counterparts.
Chlorite and chlorate formation
To evaluate the formation of chlorite and chlorate with the mixed oxidant, a high ClO2 dose of 10 mg L−1 was mixed with various doses of chlorine and applied to SRNOM solutions (Fig. 8). It should be noted that chlorate is present in a free chlorine solution due to auto-decomposition of free chlorine during manufacture, shipment and storage.54 We found 0.14 mg L−1 chlorate in 1 mg L−1 free chlorine. Thus the background chlorate concentrations have been deducted to show the exact formation of chlorate during pre-oxidation in Fig. 8. The high dose was applied to make the formation trend clearer. In the absence of chlorine, the formation of chlorite and chlorate was 3.83 mg L−1 and 0.22 mg L−1, respectively. As the chlorine dose increased from 0.1 to 2 mg L−1, chlorite formation decreased from 3.79 mg L−1 to 3.58 mg L−1, corresponding to 1% and 7% reductions in comparison to ClO2 alone, respectively. On the other hand, the formation of chlorate increased to 0.26 mg L−1 when the chlorine dose was 0.2 mg L−1 and further increased to 0.51 mg L−1 at the chlorine dose of 2 mg L−1. These results clearly show the decreasing formation of chlorite and increasing formation of chlorate with increasing chlorine in the mixed oxidant.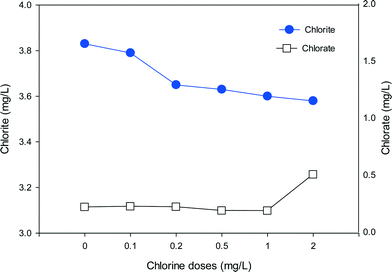 | ||
| Fig. 8 The formation of chlorite and chlorate in SRNOM waters with the use of mixed oxidant (ClO2/Cl2) at various chlorine doses (ClO2 = 10 mg L−1, Cl2 = 0–2 mg L−1, pH = 7.0). | ||
When chlorine is present together with ClO2, chlorine can react with the chlorite formed to produce ClO2, which lowers the level of chlorite (eqn (2)). Meanwhile, as the chlorine dose rises, more chlorate will be generated through eqn (1) or eqn (3). That may account for the rapid increase in chlorate when the chlorine dose was high. So the ClO2 and chlorine proportions play a key role in the formation of chlorite and chlorate. In water treatment applications the remaining chlorine should not be high because of concerns about chlorate formation.
Conclusions
The impact of mixed oxidant pre-oxidation (ClO2/chlorine) on the formation of different DBPs varies depending on the water properties. In all waters tested, the least THMs was formed at a ClO2 to chlorine mass ratio of 1![[thin space (1/6-em)]](https://www.rsc.org/images/entities/char_2009.gif) :
:![[thin space (1/6-em)]](https://www.rsc.org/images/entities/char_2009.gif) 0.5 or 1
0.5 or 1![[thin space (1/6-em)]](https://www.rsc.org/images/entities/char_2009.gif) :
:![[thin space (1/6-em)]](https://www.rsc.org/images/entities/char_2009.gif) 0.8. Both decreases and increases in the formation of CH and HKs were observed with mixed oxidant pre-oxidation (ClO2/chlorine) compared with using ClO2 alone. HANs and TCNM formation in the SRNOM solution and in the HS water samples was the lowest at a ClO2 to chlorine mass ratio of 1
0.8. Both decreases and increases in the formation of CH and HKs were observed with mixed oxidant pre-oxidation (ClO2/chlorine) compared with using ClO2 alone. HANs and TCNM formation in the SRNOM solution and in the HS water samples was the lowest at a ClO2 to chlorine mass ratio of 1![[thin space (1/6-em)]](https://www.rsc.org/images/entities/char_2009.gif) :
:![[thin space (1/6-em)]](https://www.rsc.org/images/entities/char_2009.gif) 0.5 or 1
0.5 or 1![[thin space (1/6-em)]](https://www.rsc.org/images/entities/char_2009.gif) :
:![[thin space (1/6-em)]](https://www.rsc.org/images/entities/char_2009.gif) 0.8, but in the GM water sample no useful trend was observed.
0.8, but in the GM water sample no useful trend was observed.
In the presence of bromide, more brominated DBPs were found after mixed oxidant pre-oxidation (ClO2/chlorine) than after ClO2 pre-oxidation alone or without pre-oxidation at all. With an increasing proportion of chlorine in the mixed ClO2/chlorine oxidant, the formation of chlorite decreased, but chlorate formation was enhanced. Chlorine in the mixed oxidant plays a dual role. It reacts with generated chlorite to reform ClO2, and chlorine itself reacts with organic matter to form DBPs. An appropriate mixed ClO2/chlorine ratio may therefore be beneficial for reduction of some DBP precursors.
Acknowledgements
This research was supported by Guangdong's Natural Science Funds for Distinguished Young Scholars (grant no. 2015A030306017) and the Guangdong Science and Technology Planning Project (grant no. 2014A020216010).References
- V. Kanokkantapong, T. F. Marhaba, P. Pavasant and B. Panyapinyophol, J. Environ. Manage., 2006, 80, 214–221 CrossRef CAS PubMed.
- Z.-Y. Zhao, J.-D. Gu, X.-J. Fan and H.-B. Li, J. Hazard. Mater., 2006, 134, 60–66 CrossRef CAS PubMed.
- G. Gagnon, J. Rand, K. O'leary, A. Rygel, C. Chauret and R. Andrews, Water Res., 2005, 39, 1809–1817 CrossRef CAS PubMed.
- C. Y. Chang, Y. H. Hsieh, S. S. Hsu, P. Y. Hu and K. H. Wang, J. Hazard. Mater., 2000, 79, 89–102 CrossRef CAS PubMed.
- P. C. Singer, J. Environ. Eng., 1994, 120, 727–744 CrossRef CAS.
- R. Henderson, S. A. Parsons and B. Jefferson, Water Res., 2008, 42, 1827–1845 CrossRef CAS PubMed.
- C. Korn, R. C. Andrews and M. D. Escobar, Water Res., 2002, 36, 330–342 CrossRef CAS PubMed.
- G. Gordon, J. – Am. Water Works Assoc., 2001, 93, 163–174 CAS.
- M. Z. B. Alam, R. E. Cantwell, R. Hofmann, R. C. Andrews, J. L. Rand, G. A. Gagnon, M. VanderMarck, E. Moffat and S. A. Andrews, J. Environ. Eng., 2008, 134, 478–485 CrossRef CAS.
- World Health Organization, Guidelines for drinking-water quality, 4th edn, 2011 Search PubMed.
- Ministry of Health of the People's Republic of China and Standardization Administration of China, Standards for drinking water quality, China, 2006 Search PubMed.
- G. Gordon and A. A. Rosenblatt, Ozone: Sci. Eng., 2005, 27, 203–207 CrossRef CAS.
- E. M. Aieta, P. V. Roberts and M. Hernandez, J. - Am. Water Works Assoc., 1984, 76, 64–70 CAS.
- X. B. Sun, F. Y. Cui, J. S. Zhang, F. Xu and L. J. Liu, J. Hazard. Mater., 2007, 142, 348–353 CrossRef CAS PubMed.
- R. Lee and A. O. Lee, Encyclopedia of Chemical Processing and Design: Volume 8-Chlorinated Solvents to Coal, 1979, p. 62 Search PubMed.
- State Administration for Quality Supervision and Inspection and Quarantine, Generator of complex chlorine dioxide by chemical reaction, China, GB/T20621-2006 edn., 2006 Search PubMed.
- USEPA, National Primary Drinking Water Standards, Office of Research and Development, Washington, DC, 2006 Search PubMed.
- V. Csordás, B. Bubnis, I. Fábián and G. Gordon, Inorg. Chem., 2001, 40, 1833–1836 CrossRef.
- H. Son, M. Cho, J. Kim, B. Oh, H. Chung and J. Yoon, Water Res., 2005, 39, 721–727 CrossRef CAS PubMed.
- R. Hofmann, R. C. Andrews and G. Ranger, Can. J. Civ. Eng., 2004, 3, 75–80 CAS.
- X. Yang, W. Guo and W. Lee, Chemosphere, 2013, 91, 1477–1485 CrossRef CAS PubMed.
- J. Świetlik, A. Dąbrowska, U. Raczyk-Stanisławiak and J. Nawrocki, Water Res., 2004, 38, 547–558 CrossRef PubMed.
- X. Yang, W. Guo, X. Zhang, F. Chen, T. Ye and W. Liu, Water Res., 2013, 47, 5856–5864 CrossRef CAS PubMed.
- D. Rittmann and A. Tarquin, presented in part at the World Water Environmental Resources Congress, 2003 Search PubMed.
- D. Rittmann, presented in part at the Water Quality Technology Conference and Exposition, AWWA, Washington, 2009 Search PubMed.
- R. J. Bull, Environ. Sci. Technol., 1982, 16, 554A–559A CrossRef CAS PubMed.
- American Public Health Association and American Water Works Association, Standard methods for the examination of water and wastewater, Washington, DC, 20th edn, 1998 Search PubMed.
- D. P. Hautman and D. J. Munch, US Environmental Protection Agency, Cincinnati, OH, 1997 Search PubMed.
- W. J. Masschelein and R. G. Rice, Chlorine dioxide; chemistry and environmental impact of oxychlorine compounds, Ann Arbor Science, 1979 Search PubMed.
- I. M. Kolthoff and V. A. Stenger, Volumetric analysis, CUP Archive, 1942 Search PubMed.
- Z. Wang, Z. Wu and S. Tang, Water Res., 2009, 43, 1533–1540 CrossRef CAS PubMed.
- W. Chen, P. Westerhoff, J. A. Leenheer and K. Booksh, Environ. Sci. Technol., 2003, 37, 5701–5710 CrossRef CAS PubMed.
- J. Świetlik and E. Sikorska, Water Res., 2004, 38, 3791–3799 CrossRef PubMed.
- N. Hertkorn, H. Claus, P. Schmitt-Kopplin, E. Perdue and Z. Filip, Environ. Sci. Technol., 2002, 36, 4334–4345 CrossRef CAS PubMed.
- B. M. Voelker and B. Sulzberger, Environ. Sci. Technol., 1996, 30, 1106–1114 CrossRef CAS.
- W. Gan, V. K. Sharma, X. Zhang, L. Yang and X. Yang, J. Hazard. Mater., 2015, 292, 197–204 CrossRef CAS PubMed.
- S. Navalon, M. Alvaro and H. Garcia, J. Hazard. Mater., 2009, 164, 1089–1097 CrossRef CAS PubMed.
- D. J. Stewart, M. J. Napolitano, E. V. Bakhmutova-Albert and D. W. Margerum, Inorg. Chem., 2008, 47, 1639–1647 CrossRef CAS PubMed.
- M. L. Trehy, R. A. Yost and C. J. Miles, Environ. Sci. Technol., 1986, 20, 1117–1122 CrossRef CAS.
- Y.-H. Chuang, D. L. McCurry, H.-h. Tung and W. A. Mitch, Environ. Sci. Technol., 2015, 49, 14432–14440 CrossRef CAS PubMed.
- Y. Ni, X. Shen and A. Van Heiningen, J. Wood Chem. Technol., 1994, 14, 243–262 CrossRef CAS.
- G. H. Hua and D. A. Reckhow, Water Res., 2007, 41, 1667–1678 CrossRef CAS PubMed.
- T. Bond, M. R. Templeton and N. Graham, J. Hazard. Mater., 2012, 235–236, 1–16 CrossRef CAS PubMed.
- S. H. Joo and W. A. Mitch, Environ. Sci. Technol., 2007, 41, 1288–1296 CrossRef CAS PubMed.
- X. Yang, Q. Shen, W. Guo, J. Peng and Y. Liang, Chemosphere, 2012, 88, 25–32 CrossRef CAS PubMed.
- V. K. Sharma and M. Sohn, Environ. Chem. Lett., 2012, 10, 255–264 CrossRef CAS.
- J. Hoigné and H. Bader, Water Res., 1994, 28, 45–55 CrossRef.
- G. Hua and D. A. Reckhow, Water Res., 2012, 46, 4208–4216 CrossRef CAS PubMed.
- K. Kumar and D. W. Margerum, Inorg. Chem., 1987, 26, 2706–2711 CrossRef CAS.
- J. Hu, H. Song, J. W. Addison and T. Karanfil, Water Res., 2010, 44, 105–114 CrossRef CAS PubMed.
- J. D. Sivey, S. C. Howell, D. J. Bean, D. L. McCurry, W. A. Mitch and C. J. Wilson, Biochemistry, 2013, 52, 1260–1271 CrossRef CAS PubMed.
- V. Glezer, B. Harris, N. Tal, B. Iosefzon and O. Lev, Water Res., 1999, 33, 1938–1948 CrossRef CAS.
- Y. Yu and D. A. Reckhow, Environ. Sci. Technol., 2015, 49, 11028–11036 CrossRef CAS PubMed.
- B. D. Stanford, A. N. Pisarenko, S. A. Snyder and G. Gordon, J. - Am. Water Works Assoc., 2011, 103, 71 CAS.
Footnote |
| † Electronic supplementary information (ESI) available. See DOI: 10.1039/c6ew00061d |
| This journal is © The Royal Society of Chemistry 2016 |

