Emerging investigators series: formation of disinfection byproducts during the preparation of tea and coffee†
Tom
Bond
 *a,
Seeheen C.
Tang
b,
Nigel
Graham
a and
Michael R.
Templeton
a
aDepartment of Civil and Environmental Engineering, Imperial College London, London SW7 2AZ, UK. E-mail: t.bond@imperial.ac.uk; Tel: +44 (0)2075946018
bDepartment of Earth Science and Engineering, Imperial College London, London SW7 2AZ, UK
First published on 16th November 2015
Abstract
This study examined the formation of selected disinfection byproducts (DBPs) during the chlorination of breakfast, Earl Grey and green tea, and from instant and filter coffee. Eight model compounds representing the organics in tea and coffee were also tested. Initially, experiments using water pre-spiked with chlorine demonstrated chlorine concentrations of 1–19 mg L−1 were reduced by 5–19% through boiling in a kettle. The chloroform (trichloromethane) yield of 47.6 ± 0.3% from chlorination of catechin hydrate is high compared with surrogates of drinking water natural organic matter (NOM). Chloroform yields from tea chlorinated under formation potential conditions were similar to reactive drinking water NOM isolates and higher than from coffee. Chloroform generated during the preparation of tea reached 30–43 μg L−1 at the highest chlorine dose of 14.2 mg L−1. Under the same conditions no chloroform was detected in instant coffee, whereas up to 3 μg L−1 chloroform was generated from filter coffee. Overall, this study demonstrates the potential for DBP formation when tea is prepared in water containing elevated chlorine concentrations, such as following point-of-use treatment. Conversely, chloroform concentrations in tea prepared with water containing 1 mg L−1 chlorine were ≤4 μg L−1 and therefore trichloromethane (THM) concentrations in tea made using municipal tap water are likely to be insignificant.
Water impactBoiling in a kettle only removed 5–19% of aqueous chlorine. Up to 43 μg L−1 chloroform (trichloromethane) was formed in tea prepared at elevated chlorine dose. However, trihalomethane concentrations in tea made using municipal tap water likely to be insignificant. |
Introduction
Chlorine is commonly applied for disinfecting drinking water, but also reacts strongly with many organic and inorganic constituents in water. An unwanted result of these reactions are disinfection byproducts (DBPs). The trihalomethanes (THMs) were the first DBPs to be reported in chlorinated drinking water, in the 1970s.1,2 Current regulations for the four chlorinated/brominated THMs in the USA and EU are set at 80 and 100 μg L−1, respectively. Over the last four decades the number of identified DBPs has grown and now exceeds 600,3 which reflects the diversity of both organic precursors and disinfectants, as well as the increasing sophistication of analytical methods. Previous research on the formation of THMs has established humic substances as a key precursor pool. These incorporate both humic and fulvic acids, which are mainly derived from terrestrial vegetation and have high lignin, and consequently, aromatic content.4Since their discovery the issue of whether exposure to DBPs is linked to cancer and reproductive/developmental effects has also been investigated. Epidemiological studies have shown that a lifetime exposure to chlorinated water is associated with an increased risk of developing bladder cancer.5 Nonetheless, causal agent/s for the adverse human health outcomes potentially associated with chlorination DBPs have yet to be identified, although the halobenzoquinones, recently reported as DBPs, have been proposed as putative bladder carcinogens.6
Human exposure to THMs and other DBPs can occur through multiple exposure routes, including inhalation and dermal contact, although it has been estimated that 50–70% of exposure to THMs comes from ingestion of tap water and beverages made using tap water.7 This context partly explains why a number of studies have investigated the impact of boiling tap water on concentrations of DBPs, and consequently how this affects exposure to humans.8–12 Among these studies it has been reported that the concentration of chloroform (trichloromethane) was reduced by 34% in chlorinated water after 1 min boiling9 and the cytotoxicity of simulated tap water was reduced by 77% after boiling for 5 min.8
However, one topic that has received little attention is whether THMs and other DBPs might be generated when boiled water is used to prepare tea and coffee, through reactions between residual chlorine present in tap water and organic precursors present in these beverages. It is evident that tea and coffee are both rich in organic matter of similar character to humic substances found in drinking water, while the volatility and concentration of aqueous chlorine will also affect DBP formation. Tea and coffee are the most consumed beverages in the world, and over 80% of tap water consumption is estimated to be associated with the preparation of tea, coffee and other hot beverages.13 Global consumption of both tea and coffee are projected to increase in the future.14,15
The authors are aware of only one other relevant study on this topic, which reported that instant tea generated similar amounts of THMs as aquatic humic substances when chlorinated under formation potential conditions.16 Furthermore, these authors showed that 164–196 μg L−1 as chloride of total organic halogen (TOX) was formed when instant tea was contacted with 4 mg L−1 chlorine for 24 h.16 However, specific DBPs were not quantified under the latter conditions and only instant tea was considered. In this context, the first objective of this study was to evaluate the proportion of aqueous chlorine which remains in solution after boiling in a typical household kettle. The chlorine demand and DBP formation of organic surrogates and authentic tea and coffee samples chlorinated under both formation potential conditions and a contact time and temperature representative of real-life tea and coffee preparation were also examined.
Experimental
Selection of tea and coffee surrogates
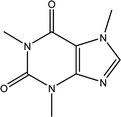
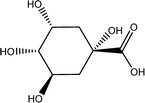
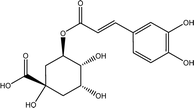
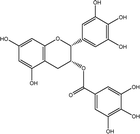
Tea is produced from the leaves of Camellia sinensis and is classified into three types, based on the extent of fermentation: unfermented green tea, partially fermented oolong, and fully fermented black teas.17 Its composition is dominated by polyphenolic compounds, mostly flavan-3-ols, which comprise up to 30% of the dry weight of tea leaves, approximately a third in the form of epigallocatechin gallate (EGCG; Table 1).18 Other components include amino acids and carbohydrates. During the fermentation of green tea, the proportion of polyphenolic compounds changes, whereas other components largely remain unchanged.19 Coffee beans are the fruit of coffee plants, with Coffea Arabica and Coffea Robusta being the most common species.20 Polysaccharides (polymeric carbohydrates) form more than 50% of green coffee beans, with a large percentage as cellulose. The brown colour of coffee is attributed to melanoidins, which are brown nitrogenous polymers of uncertain structure.21 Based on the above, eight tea and coffee surrogates were selected (Table 1). Epigallocatechin gallate and catechin hydrate (CH) were selected to represent the flavanols commonly found in tea. Chlorogenic acid (CGA), quinic acid (QA) and gallic acid (GA) are representative of organics found in coffee. Catechol (CAT) is a simple structure found as a component of polyphenols in tea and coffee. As cellulose is insoluble in water, galactose (GLA) was selected instead to represent the saccharides prevalent in coffee. Finally, caffeine (CF) is a well-known constituent of both beverages.Chlorination conditions
Four different types of chlorination tests were undertaken: kettle boiling, chlorine demand, disinfection byproduct formation potential (DBPFP, which use excess chlorine) and those using a representative contact time and temperature (see Table 2 for experimental conditions, including concentrations of chlorine and precursors). Three types of tea – Twinings English Breakfast tea, Twinings Pure Green tea, and Twinings Earl Grey tea (all of which are tea bags) – and two types of coffee – Carte Noire Instinct whole bean instant coffee (100% Arabica coffee) and Lavazza Qualita Rossa filter coffee – were used during the chlorine demand, DBPFP and representative contact time tests (Table 2). For comparison the chlorine demand and DBPFP of the eight model compounds was measured. In all types of chlorination tests a sodium hypochlorite solution (Sigma Aldrich, UK) was used as the chlorine source, with chlorine concentrations monitored using the N,N-diethyl-p-phenylenediamine – ferrous ammonium sulphate (DPD-FAS) titration method.22 All samples were prepared in duplicate in reverse osmosis (RO) treated ultrapure water at pH 7 ± 0.2 (10 mmol, phosphate buffer) containing chlorine at pre-determined doses. For the kettle boiling experiments 1 L of RO water was spiked with chlorine; 200 mL was set aside to measure the initial chlorine concentration, whilst the remaining 800 mL was boiled in a kettle (Breville, UK), and left to cool for 10 minutes, before measuring the final chlorine concentration. When boiling 800 mL of RO water it took ∼2:09 min to reach boiling, plus another ∼12 s boiling, before the kettle turned itself off. Chlorine demand of the eight model compounds and five types of beverage was determined from chlorine concentrations taken before and after the contact time of 24 h. The chlorine dose of 35 mol Cl2 per mol surrogate used to measure the chlorine demand of the model compounds (Table 2) is based on a study which investigated aquatic natural organic matter surrogates.23| Name | Conditions |
|---|---|
| Kettle boiling | 800 mL water, chlorine concentration measured before and after boiling |
| Chlorine demand of surrogates | Surrogate 40 μM; chlorine 35 mol of Cl2 per mol of surrogate (mol mol−1). 24 h, pH 7 ± 0.2, 20 ± 2 °C |
| Chlorine demand of tea and coffee | 1![[thin space (1/6-em)]](https://www.rsc.org/images/entities/char_2009.gif) : :![[thin space (1/6-em)]](https://www.rsc.org/images/entities/char_2009.gif) 100 (vol/vol) diluted tea and coffee, chlorine 200 mg L−1 (2.82 mM), 24 h, pH 7 ± 0.2, 20 ± 2 °C 100 (vol/vol) diluted tea and coffee, chlorine 200 mg L−1 (2.82 mM), 24 h, pH 7 ± 0.2, 20 ± 2 °C |
| DBPFP tests on surrogates | Surrogate 5 μM; chlorine 35 mol Cl2 per mol surrogate (mol mol−1). 24 h, pH 7 ± 0.2 |
| DBPFP tests on tea and coffee | 1![[thin space (1/6-em)]](https://www.rsc.org/images/entities/char_2009.gif) : :![[thin space (1/6-em)]](https://www.rsc.org/images/entities/char_2009.gif) 100 (vol/vol) diluted tea and coffee; chlorine 100 mg L−1 (1.41 mM), 24 h, pH 7 ± 0.2, 20 ± 2 °C 100 (vol/vol) diluted tea and coffee; chlorine 100 mg L−1 (1.41 mM), 24 h, pH 7 ± 0.2, 20 ± 2 °C |
| THM formation from tea and coffee at a representative contact time and temperature | Chlorine dose 0, 1, 4 and 14.2 mg L−1. Freshly boiled water used to prepare tea and coffee. pH 7 ± 0.2. Quenched after 20 min with ascorbic acid (3![[thin space (1/6-em)]](https://www.rsc.org/images/entities/char_2009.gif) : :![[thin space (1/6-em)]](https://www.rsc.org/images/entities/char_2009.gif) 1 mol mol−1) 1 mol mol−1) |
All tea and coffee samples were prepared in 250 mL water. When preparing tea samples one tea bag was brewed for 3 min before being removed. The contents of the breakfast, green and Earl Grey tea bags weighed 2.6, 2.4 and 2.6 g, respectively. Both coffee types were made using 4 g of coffee, with filter coffee samples prepared in a cafetière, with the filter plunged after 3 min. For the experiments to measure THMs in tea and coffee prepared at a representative contact time and temperature samples were made in disposable cups. The selected chlorine doses were 1, 4 and 14.2 mg L−1. In the UK water companies generally maintain residual chlorine at <0.5 mg L−1 (DWI, 2010); in the USA up to 4 mg L−1 is permitted in distribution,24 while point-of-use (POU) treatment may leave higher chlorine residuals and the highest dose of 14.2 mg L−1 has been previously used to simulate POU conditions.25 After 20 min contact between the tea/coffee and chlorine-spiked water the residual chlorine was quenched with ascorbic acid (3![[thin space (1/6-em)]](https://www.rsc.org/images/entities/char_2009.gif) :
:![[thin space (1/6-em)]](https://www.rsc.org/images/entities/char_2009.gif) 1 mol mol−1 of ascorbic acid
1 mol mol−1 of ascorbic acid![[thin space (1/6-em)]](https://www.rsc.org/images/entities/char_2009.gif) :
:![[thin space (1/6-em)]](https://www.rsc.org/images/entities/char_2009.gif) chlorine) and samples acidified prior to DBP analysis.
chlorine) and samples acidified prior to DBP analysis.
Analytical methods
The ultraviolet (UV) absorbance and non-purgeable organic carbon (NPOC, equivalent to dissolved organic carbon (DOC)) of 1![[thin space (1/6-em)]](https://www.rsc.org/images/entities/char_2009.gif) :
:![[thin space (1/6-em)]](https://www.rsc.org/images/entities/char_2009.gif) 100 (vol/vol) diluted tea and coffee samples were measured using a Shimadzu UV-2401PC spectrophotometer and a Shimadzu TOC-5000 analyser, respectively. UV and DOC values reported in the remainder of the paper are for undiluted samples, taking into account the dilution factor.
100 (vol/vol) diluted tea and coffee samples were measured using a Shimadzu UV-2401PC spectrophotometer and a Shimadzu TOC-5000 analyser, respectively. UV and DOC values reported in the remainder of the paper are for undiluted samples, taking into account the dilution factor.
Following (DBPFP) tests samples were extracted into 3 mL of methyl tertiary-butyl ether (MTBE) following acidification to pH ∼ 3.5 with H2SO4 and addition of 1 g copper sulphate and 10 g pre-baked sodium sulphate, following USEPA method 551.1.26 Since the degradation of chloropicrin (trichloronitromethane) and trichloroacetonitrile (TCAN) is accelerated in the presence of sulphite,27 no quenching agent was used.23 DBPs were subsequently quantified by gas chromatography with electron capture detection (GC-ECD, Perkin Elmer Clarus 500 GC) using a modified version of USEPA method 551.1 and a Restek Rxi-5 Sil MS column (of dimensions 30 m × 0.25 mm × 0.25 μM). Procedural blanks (which had the same composition as samples, except chlorine was absent) were included in each set of samples and the internal standard was 1-bromo-4-fluorobenzene (1 μg mL−1). The quantified DBPs were chloroform (trichloromethane), chloropicrin (trichloronitromethane), dichloroacetonitrile (DCAN), TCAN, 1,1-dichloropropanone (1,1-DCP) and 1,1,1-trichloropropanone (1,1,1-TCP). These DBPs are available in a standard mix (Sigma Aldrich, UK). Method detection limits for these species were 0.1, 0.5, 0.1, 0.5, 0.1 and 0.2 μg L−1, respectively. Method recoveries ranged from 89–113%. As noted previously by Wu et al.,16 severe foaming occurs when extracting undiluted tea/coffee samples into MTBE, so after the representative contact time and temperature tests THMs were instead quantified using a headspace solid-phase microextraction (SPME) GC-ECD (Varian 450) method at CELW Ltd (Bangor University, UK). Note that the additional, less volatile, DBPs monitored by USEPA method 551.1 are not captured by headspace methods and were therefore not recorded after these experiments. A carboxen/polydimethylsiloxane SPME fibre assembly (Sigma Aldrich, UK) and a Restek MX1 30 m × 0.53 mm × 0.7 μm column were used, based on the method of Sarrión et al.28 Detection limits for four THMs were 0.5, 0.1, 0.1 and 0.5 μg L−1 for chloroform, dichlorobromomethane, dibromochloromethane and bromoform, respectively, and procedural blanks for the five types of tea and coffee were also analysed. No bromide was added to samples and the small amounts (typically under 1 μg L−1) of brominated THMs observed in both blanks and samples therefore resulted from contamination and are not reported.
Results
Kettle boiling experiment
Before investigating any DBPs generated during preparation of tea and coffee a preliminary question needed to be addressed: how much aqueous chlorine actually remains available for reaction after the water has been boiled in a typical household kettle? The answer to this is that, at initial chlorine concentrations of up to 19 mg L−1 as Cl2, only 5.1–19.0% of chlorine was removed by boiling in a kettle (Fig. 1). At the lowest initial chlorine dose of 1.1 mg L−1 the reduction in chlorine concentration was greatest at 19 ± 10%, but at higher initial chlorine doses the reduction was consistently ≤10%. In other words only <20% of chlorine was removed by boiling in a kettle under representative conditions. A recent study by Zhang29 looked at the efficacy of boiling for removing residual chlorine found in tap water, with disproportionation of hypochlorite (OCl−) to chloride (Cl−) and chlorate (ClO3−) believed to be an important degradation route. At an initial chlorine concentration of 2 mg L−1 as Cl2 it required 33 min of boiling to completely remove the aqueous chlorine.29 This data is consistent with that in the current study, given that the kettle used in the latter only boils water for ∼12 s before turning itself off.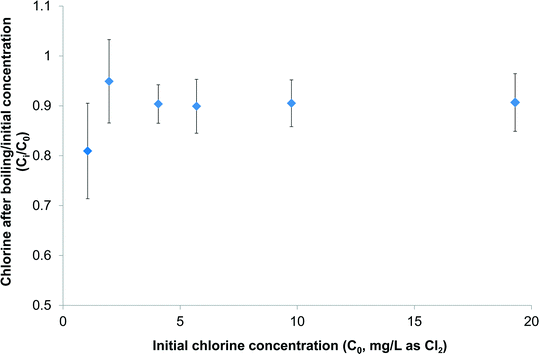 | ||
| Fig. 1 Impact of boiling in a kettle on concentration of aqueous chlorine spiked into ultrapure water (n = 2). | ||
Chlorine demand of tea and coffee
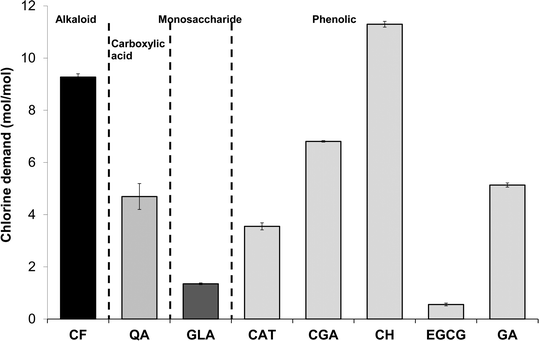
Chlorine demand of the eight tea and coffee surrogates ranged from 0.6 to 11.3 mol of Cl2 per mol of surrogate (abbreviated to mol mol−1 hereafter) (Fig. 2), comparable to many low molecular-weight compounds which have been used to represent components of aquatic NOM.30 The chlorine demand of galactose31 and catechol32 were previously reported as 0.8 mol mol−1 (pH 8, 72 h, galactose 2 mg L−1 as DOC, chlorine dose 5.1 mol mol−1) and 4.1 mol mol−1 (pH 7, 15 h, chlorine dose 20 mol mol−1), respectively. Equivalent values in the current study were 1.3 ± 0.03 and 3.6 ± 0.13 mol mol−1, respectively (at pH 7, 24 h and a chlorine dose 35 mol mol−1), which agree well with the literature data, especially given the differences in experimental conditions. From Fig. 1 it can be seen that the two surrogates with the highest chlorine demand were catechin hydrate and caffeine, which consumed 11.3 ± 0.11 and 9.3 ± 0.13 mol mol−1, respectively, while epigallocatechin gallate had the lowest chlorine demand of 0.6 ± 0.05 mol mol−1. Aromatic compounds with electron-donating substituents, such as catechin hydrate, are known to have relatively high chlorine demand, since the amount of ring activation promotes electrophilic substitution reactions.33Ortho or para substituted compounds with two electron-donating groups, for example, catechol, typically have lower chlorine demand than meta substituted isomers, since interactions between ortho/para substituents are antagonistic with respect to chlorine demand.33 Meanwhile, the relatively high chlorine demand of caffeine is most likely related to the presence of multiple amine and nitrile groups.DOC concentrations of the three types of tea tested were from 892–1017 mg L−1, while concentrations in filter coffee and instant coffee were higher still at respectively 2018 ± 9 and 5318 ± 22 mg L−1 (Fig. 3). Total organic carbon (TOC) concentrations of (untreated) surface waters are typically from 1–20 mg L−1 (ref. 34) and significantly lower in (treated) drinking water. Hence, DOC concentrations found in tea are well in excess of 45× those typically found in treated water, with concentrations in coffee over 100× higher. The chlorine demand of tea and coffee, when expressed in g Cl2 per g DOC, presented the opposite trend to DOC results, reflecting that tea contained a greater proportion of high chlorine demand material (Fig. 3). The chlorine demand of tea samples were between 6.9 ± 0.56 and 9.6 ± 0.69 g Cl2 per g DOC for green tea, Earl Grey tea and breakfast tea, respectively, which were higher than the respective values for instant and filter coffee of 2.9 ± 0.2 and 5.0 ± 0.41 g Cl2 per g DOC (Table S1†).
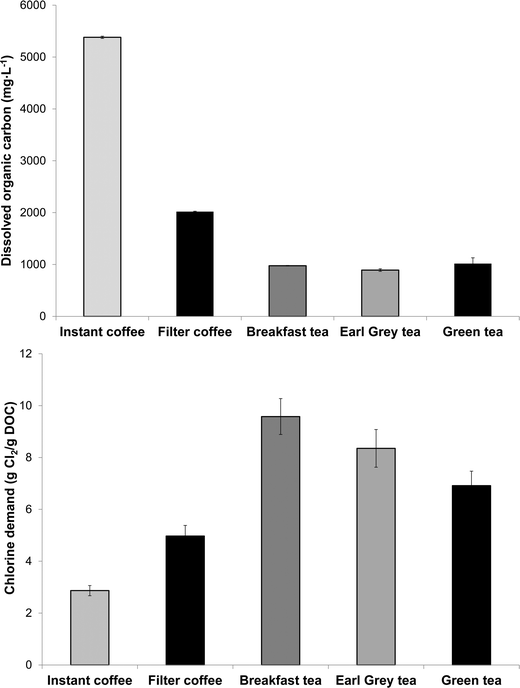 | ||
| Fig. 3 Dissolved organic carbon (DOC) concentrations (above) and chlorine demand (below) of tea and coffee (n = 2). | ||
For comparison, the chlorine demand of 10 Suwannee River NOM isolates, which have been studied extensively in drinking water research, varied between 0.8 and 2.8 g Cl2 per g DOC, with the highest value for the ultrahydrophilic humic acid (uHA) fraction (chlorination conditions: Cl2/DOC 4 mg mg−1; pH 8, 72 h, 20 °C).4 Thus, the chlorine demand of tea in particular is higher than typically found in drinking water sources. Solutions of tea and coffee are acidic, as evidenced by pH values of (undiluted and non-buffered) samples ranging from 4.7 for instant coffee to 5.3 for green tea. The specific UV absorbance at 254 nm (SUVA254, calculated by dividing the UV absorbance of a sample by its DOC concentration) of the five beverages ranged from 1.6 to 2.7 L mg−1 m, respectively (Table S1†). SUVA254 is used to indicate the aromatic content (and consequently hydrophobic/hydrophilic character) of drinking water sources, with SUVA254 values from 2–4 L mg−1 m previously categorised as having medium SUVA254.35 This applies to filter coffee, breakfast tea and Earl Grey tea, whereas instant coffee and green tea can be classified as having low-SUVA254 using drinking water terminology (Table S2†).35 Equivalent SUVA values at 272 nm (i.e. SUVA272) ranged from 2.1 to 3.7 L mg−1 m, respectively, and interestingly SUVA272 correlated more strongly with chlorine demand (in g Cl2 per g DOC) than SUVA254: the respective Pearson product-moment correlation coefficients (r) were 0.64 and 0.89, respectively (Table S2†). The underlying basis for this observation is that activated aromatic species (i.e. those with electron-donating substituents), which are known to react strongly with chlorine, tend to have absorbance maxima around 272 nm.36
DBP formation from tea and coffee surrogates
Among the DBPs analysed in this study, chloroform was the dominant DBP observed from all tea and coffee surrogates, although limited formation of 1,1-DCP and 1,1,1-TCP was also recorded: ≤0.34 and ≤0.17% mol DBP per mol precursor (% mol mol−1) (Fig. 4). It is noted than only chlorinated DBPs were observed, due to the absence of bromide in samples. The highest chloroform yield recorded was 47.6 ± 0.3% mol mol−1 from catechin hydrate, followed by 4.6% ± 0.3% mol mol−1 from epigallocatechin gallate, and all other surrogates had yields ≤1.32% mol mol−1 (Fig. 4). Chloroform yields from catechol and galactose were 1.20 ± 0.00% and 0.53 ± 0.01% mol mol−1, respectively (Fig. 4). A slightly lower chloroform yield for catechol was previously reported: 0.4% mol mol−1 after 15 h reaction (pH 7, chlorine dose 20 mol mol−1 (ref. 32)). The discrepancy can be explained by the shorter chlorine contact time used in the earlier study. THM formation from carbohydrates is pH dependent,31 with the chloroform yield from galactose rising from ∼0.04% mol mol−1 at pH 5 to ~3.17% mol mol−1 at pH 8 (72 h, chlorine dose 5 mg mg−1 precursor).31 Again these data compare well with the pH 7 chloroform formation recorded in the current study. The chloroform yield from catechin hydrate is notably high when compared to NOM surrogates studied during drinking water treatment research. The recorded value of 47.6 ± 0.3% is equivalent to 309 ± 2 μg mg DOC−1 and only 28 out of 184 (or 15%) compounds listed as THM precursors30 had higher chloroform formation yields. The potency of catechin hydrate and epigallocatechin gallate, relative to the other surrogates, can be explained by these precursors containing a resorcinol (1,3-dihydroxybenzene) functionality, which is a well-known reactive THM precursor structure. Upon chlorination resorcinol is converted to chloroform in yields over 90% mol mol−1.32,37 Moreover, the behaviour of fast-reacting THM precursors in drinking water sources is consistent with that of resorcinol, since chloroform forms from the latter within 30 min.38 This is relevant given the limited time available for DBP formation during the preparation of tea and coffee.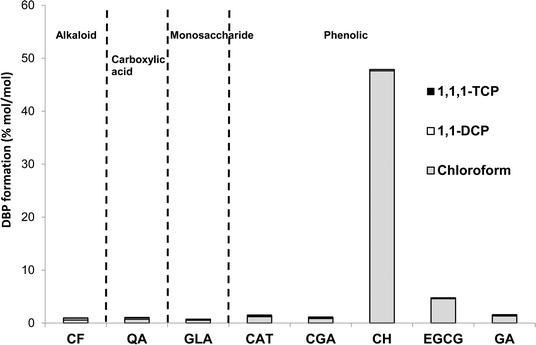 | ||
| Fig. 4 DBP concentrations from chlorination of tea and coffee surrogates under formation potential conditions. | ||
DBP formation from authentic tea and coffee samples
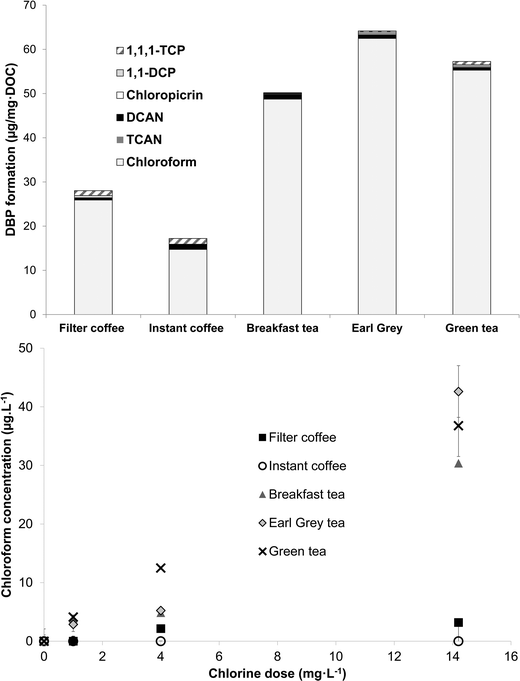
Samples of tea and coffee chlorinated under formation potential conditions all formed significant levels of DBPs, predominantly chloroform (Fig. 5). Yields of chloroform from the two types of coffee were lower than from the three types of tea. Respective amounts of chloroform produced from chlorination of filter coffee, instant coffee, breakfast tea, Earl Grey tea and green tea were 25.9 ± 5.4, 14.7 ± 1.2, 47.8 ± 1.6, 62.4 ± 4.7 and 55.3 ± 0.0 μg mg DOC−1 (Table S2†). For comparison, 10 Suwannee River NOM isolates generated from 23–63 μg mg DOC−1 of chloroform (Cl2/DOC 4 mg mg−1; pH 8, 72 h, 20 °C).4 The lowest and highest chloroform yields were from the ultrahydrophilic neutral (uHPIN) and uHA fractions, respectively.4 These data illustrate that the two types of coffee had chloroform yields towards the lower end, or lower than, what is typically recorded in drinking water NOM, whereas yields from tea are comparable to the more reactive drinking water NOM isolates. Wu and co-workers16 also reported that two types of instant tea formed similar amounts of THMs as aquatic humic substances chlorinated under the same conditions (pH 7 or pH 8.5, 24 h, Cl2/DOC 2.5). Similar to the relationships calculated with chlorine demand, SUVA272 showed a stronger correlation with chloroform formation than SUVA254, with respective correlation coefficients being 0.74 and 0.36 (Table S2†). This implicates activated aromatic compounds as an important group of chloroform precursors in tea and coffee. In addition to chloroform, smaller amounts of the other quantified DBPs were also detected from the chlorination of tea and coffee samples (Fig. 5). All five types of tea and coffee generated DCAN (≤1.04 μg mg DOC−1), chloropicrin (≤0.26 μg mg DOC−1), 1,1-DCP (≤0.49 μg mg DOC−1) and 1,1-TCP (≤1.32 μg mg DOC−1). The highest formation of DCAN, 1,1-DCP and 1,1-TCP came from Breakfast tea, filter coffee and instant coffee, respectively, while Earl Grey and green tea both formed 0.26 μg mg DOC−1 of chloropicrin.Subsequently chloroform formation was quantified from tea and coffee samples prepared with freshly-boiled ultrapure water pre-spiked with chlorine and left for 20 min before being quenched with ascorbic acid (Fig. 5). At the three chlorine doses tested chloroform formation from instant coffee, which also had the lowest chloroform formation potential (Fig. 5), was always under the detection limit, whereas the formation from filter coffee increased from under detection limits at a chlorine dose of 1 mg L−1 to 2.2 ± 0.1 and 3.2 ± 0.2 μg L−1 at applied doses of 4 and 14.2 mg L−1, respectively. The three types of tea all formed greater amounts of chloroform, especially at the highest chlorine dose of 14.2 mg L−1 (Fig. 5), chosen to represent a point-of-use disinfection method. Overdosing with chlorine, as typified by this dose, may be fairly common during POU treatment in developing countries in particular.25 The highest chloroform formation came from Earl Grey tea: 42.6 ± 4.4 μg L−1 at a chlorine dose of 14.2 mg L−1, while breakfast tea and green tea generated 30.4 ± 0.2 and 36.8 ± 5.2 μg L−1, respectively, under these conditions. At the chlorine dose of 4 mg L−1, the maximum chlorine level permissible in US distribution systems, chloroform formation was respectively 4.9 ± 0.5, 5.2 ± 0.4 and 12.5 ± 0.2 μg L−1 from breakfast, Earl Grey and green tea (Fig. 5). Equivalent values at a chlorine dose of 1 mg L−1 were 3.9 ± 0.5, 2.9 ± 1.2 and 4.1 ± 0.3 μg L−1. The higher chloroform formation (Fig. 5) of tea compared with coffee can be linked with higher concentrations of reactive THM precursors. Although their exact identity is uncertain these are most plausibly the flavanols which are widespread in tea, for example, catechin hydrate and epigallocatechin gallate (Table 1). Conversely, the higher concentration of polysaccharides, known for their relatively low THM yields (at neutral or acidic pH) and slow chlorination kinetics,30,31 in coffee likely manifests itself in lower chlorine demand (Fig. 3) and chloroform formation (Fig. 5) than tea.
Discussion: implications for exposure to DBPs
This study has demonstrated that concentrations of chloroform produced during the preparation of three types of tea at a representative contact time and temperature increased from 3–4 μg L−1 at a chlorine dose of 1 mg L−1 to 5–12 μg L−1 at a chlorine dose of 4 mg L−1, and 30–43 μg L−1 at a chlorine dose of 14.2 mg L−1. Based on the results of the experiments chlorinating tea and coffee under formation potential conditions, dihaloacetonitriles (DHANs), halonitromethanes (HNMs) and haloketones can also be expected, albeit at concentrations much lower than observed for chloroform. Given the large quantities of tea which many people consume, above 1 kg per capita per annum in many countries,39,40 this has the potential to account for a significant proportion of exposure to DBPs where drinking water supplies contain relatively high levels of chlorine, e.g. following point-of-use treatment. The kettles used to prepare tea and coffee in this study only boiled water for ∼12 s, which is insufficient to depress chlorine concentrations by more than 5–19% at initial concentrations up to 19 mg L−1 as Cl2 (Fig. 1).More research is needed to comprehensively evaluate the net effect of tea and coffee preparation on DBP concentrations, i.e. whether formation due to chlorination of organic matter is outweighed by removal of existing volatile species, such as the THMs, during boiling. This should also consider a wider range of water quality parameters (e.g. pH and bromide) than monitored in this study. It is notable though that many studies on the reduction in DBPs through boiling have considered boiling times of 1 min and upwards, for example 1, 2 and 5 min9 and 5 or 10 min,8 rather than the ∼12 s boiling time, plus ∼2:09 min to reach boiling, that the kettle used here took to boil 800 mL water. Therefore, the reductions in DBP concentrations reported in studies such as these are likely to be more than resulting from kettle usage.
THMs are terminal DBPs, the presence of which also signifies the formation of additional, intermediate, DBPs. It is established that THM formation tends to increase at alkaline pH, due the importance of base-catalysed reaction steps.41 Solutions of non-buffered tea and coffee are acidic, which is therefore not optimal for THM formation. Moreover, other conditions applying to tea and coffee preparation, where contact times are much shorter than in municipal drinking water supply systems and organic matter present in excess, relative to chlorine concentrations, will also favour the formation of intermediate DBPs over THMs. Wu et al.16 proposed that the significant levels of TOX they recorded (164–196 μg L−1 as chloride; chlorine dose 4 mg L−1, 24 h exposure) were likely to be predominantly composed of macromolecular species. However, the current study has also shown that low molecular weight DBPs, specifically the THMs, can also be generated under representative beverage-making contact times and temperatures. Given the high phenolic content of tea in particular additional products are predicted to include the halobenzoquinones, highlighted as DBPs of concern due to their status as putative bladder carcinogens and known to be produced from the chlorination of phenol.6 The halobenzoquinones are more stable at acidic pH, as found in tea and coffee samples. More specifically, at pH levels at under 6.8, 2,6-dichloro-1,4-benzoquinone was stable, whereas it was easily hydrolyzed at pH 7.6.6 In addition, there are also a variety of other halogenated phenols, including the dihalo-4-hydroxybenzaldehydes, dihalo-4-hydroxybenzoic acids, dihalo-salicylic acids, and trihalo-phenols, which have been detected in water chlorinated in the presence of bromide42 and are also thought to be of toxicological significance. Furthermore, bromophenols which can be responsible for taste-and-odour issues in drinking water, are generated during the chlorination of phenol- and bromide-containing waters43 are also potentially formed during the preparation of tea and coffee in waters with high ambient bromide concentrations.
Finally, as a counterpoint to the above, the health benefits of drinking tea should not be forgotten when discussing this issue. The same features that make phenolic compounds such as flavanols effective THM precursors also translates into antioxidant properties which have been associated with public health benefits. In particular, consumption of tea has been reported to have positive effects with respect to weight management, type 2 diabetes and cardiovascular disease.44
Conclusions
This study has examined the generation of selected DBPs following chlorination of tea and coffee samples, as well as their chlorine demand. Eight surrogates chosen to represent organics in tea and coffee were also tested in parallel. The following are the key findings of this study:• Aqueous chlorine at initial concentrations of 1–19 mg L−1 was reduced by between 5–19% upon boiling in a kettle, indicating the majority of chlorine remained available for reaction with organic matter in tea and coffee.
• The chlorine demand of eight tea and coffee surrogates ranged from 0.6 to 11.3 mol mol−1, comparable to many low molecular-weight compounds which have been used to represent components of drinking water NOM. The chloroform yield of 47.6 ± 0.3% from catechin hydrate is notably high compared with surrogates studied during drinking water treatment research.
• Specific yields of chloroform (μg mg DOC−1) from two types of coffee chlorinated under formation potential conditions were towards the lower end, or lower than, typically recorded from fractions of drinking water NOM, whereas the specific yields from tea were comparable to the more reactive drinking water NOM isolates. Chloroform concentrations generated during preparation of tea at a representative contact time and temperature reached 5–12 μg L−1 at a chlorine dose of 4 mg L−1 and 30–43 μg L−1 at a chlorine dose of 14.2 mg L−1. Under the same conditions no chloroform was detected in instant coffee samples, whereas formation from filter coffee reached 3 μg L−1 at the highest chlorine dose of 14.2 mg L−1.
• Overall, this study demonstrates the potential for significant DBP formation when tea is prepared in water containing elevated chlorine concentrations, such as following point-of-use treatment. Conversely, chloroform concentrations in tea prepared with water containing 1 mg L−1 chlorine did not exceed 4 μg L−1 and therefore THM concentrations in tea made using municipal tap water are likely to be insignificant.
Acknowledgements
The first author acknowledges the support of the Imperial College Junior Research Fellowship scheme.References
- J. J. Rook, Water Treat. Exam., 1974, 23, 234–243 Search PubMed.
- T. A. Bellar, J. J. Lichtenberg and R. C. Kroner, Journal AWWA, 1974, 66, 703–706 CAS.
- S. D. Richardson, Enc. Environ. Anal. Remediation, 1998, vol. 3, pp. 1398–1421 Search PubMed.
- J.-P. Croué, G. V. Korshin and M. Benjamin, Characterization of Natural Organic Matter in Drinking Water, Denver, CO, 2000 Search PubMed.
- C. M. Villanueva, K. P. Cantor, S. Cordier, J. J. K. Jaakkola, W. D. King, C. F. Lynch, S. Porru and M. Kogevinas, Epidemiology, 2004, 15, 357–367 CrossRef PubMed.
- Y. Zhao, J. Anichina, X. Lu, R. J. Bull, S. W. Krasner, S. E. Hrudey and X.-F. Li, Water Res., 2012, 46, 4351–4360 CrossRef CAS PubMed.
- S. Chowdhury, M. J. Rodriguez and J. Serodes, Sci. Total Environ., 2010, 408, 4733–4743 CrossRef CAS PubMed.
- Y. Pan, X. Zhang, E. D. Wagner, J. Osiol and M. J. Plewa, Environ. Sci. Technol., 2013, 48, 149–156 CrossRef PubMed.
- S. W. Krasner and J. M. Wright, Water Res., 2005, 39, 855–864 CrossRef CAS PubMed.
- S. Batterman, A.-T. Huang, S. Wang and L. Zhang, Environ. Sci. Technol., 2000, 34, 4418–4424 CrossRef CAS.
- W. W. Wu, M. M. Benjamin and G. V. Korshin, Water Res., 2001, 35, 3545–3550 CrossRef CAS PubMed.
- S. Levesque, M. J. Rodriguez, J. Serodes, C. Beaulieu and F. Proulx, Water Res., 2006, 40, 2921–2930 CrossRef CAS PubMed.
- DETR/DWI, Aspects of Exposure Estimates of Disinfection By-Products from Water: A Review of Water Intake and Contact and the Uptake of Disinfection By-Products by Different Exposure Routes. Final Report to the Department of the Environment, Transport and the Regions, Report DETR/DWI report 4861, 2000 Search PubMed.
- FAO, Food and Agriculture Organization of the UN. Current situation and medium term outlook for tea, http://www.fao.org/fileadmin/templates/est/COMM_MARKETS_MONITORING/Tea/Documents/IGG_20/12-CRS7-CurrentSit_01.pdf, (accessed Accessed 3 July 2015, 2014) Search PubMed.
- ITC, International Trade Centre 2011.The Coffee Exporter's Guide, 3rd edn, Geneva, Switzerland, 2011 Search PubMed.
- W. W. Wu, P. A. Chadik, W. M. Davis, D. H. Powell and J. J. Delfino, J. Agric. Food Chem., 1998, 46, 3272–3279 CrossRef CAS.
- D. A. Balentine, in Phenolic Compounds in Food and Their Effects on Health I, American Chemical Society, 1992, ch. 8, vol. 506, pp. 102–117 Search PubMed.
- A. Robertson, in Tea, ed. K. C. Willson and M. N. Clifford, Springer Netherlands, 1992, ch. 17, pp. 555–601, DOI:10.1007/978-94-011-2326-6_17.
- D. A. Balentine, S. A. Wiseman and L. C. Bouwens, Crit. Rev. Food Sci. Nutr., 1997, 37, 693–704 CrossRef CAS PubMed.
- Y. Wang and C.-T. Ho, J. Agric. Food Chem., 2009, 57, 8109–8114 CrossRef CAS PubMed.
- S. I. F. S. Martins and M. A. J. S. van Boekel, Food Chem., 2003, 83, 135–142 CrossRef CAS.
- APHA, AWWA and WEF, Standard Methods for the Examination of Water and Wastewater, American Public Health Association, Washington, DC, 21st edn, 2005 Search PubMed.
- T. Bond, O. Henriet, E. H. Goslan, S. A. Parsons and B. Jefferson, Environ. Sci. Technol., 2009, 43, 5982–5989 CrossRef CAS PubMed.
- USEPA, Stage 1 Disinfectant and Disinfection Byproduct Rule, Cincinnati, OH, USA, 1998 Search PubMed.
- E. M. Smith, M. J. Plewa, C. L. Lindell, S. D. Richardson and W. A. Mitch, Environ. Sci. Technol., 2010, 44, 8446–8452 CrossRef CAS PubMed.
- USEPA, Method 551.1. Determination of chlorination disinfection byproducts, chlorinated solvents and halogenated pesticides/herbicides in drinking water by liquid-liquid extraction and gas chromotography with electron capture detection. Revision 1.0, Report 45268, Cincinnati, OH, USA, 1995.
- J. P. Croue and D. A. Reckhow, Environ. Sci. Technol., 1989, 23, 1412–1419 CrossRef CAS.
- M. N. Sarrión, F. J. Santos and M. T. Galceran, Anal. Chem., 2000, 72, 4865–4873 CrossRef.
- L. A. Zhang, Int. J. Eng. Res. Ind. Appl., 2013, 3, 1647–1651 Search PubMed.
- T. Bond, E. H. Goslan, S. A. Parsons and B. Jefferson, Environ. Technol. Rev., 2012, 1, 93–113 CrossRef CAS.
- S. Navalon, M. Alvaro and H. Garcia, Water Res., 2008, 42, 3990–4000 CrossRef CAS PubMed.
- J. de Laat, N. Merlet and M. Dore, Water Res., 1982, 16, 1437–1450 CrossRef CAS.
- G. B. Luilo and S. E. Cabaniss, Environ. Sci. Technol., 2010, 44, 2503–2508 CrossRef CAS PubMed.
- J. C. Crittenden, R. R. Trussell, D. W. Hand, K. J. Howe and G. Tchobanoglous, MWH. Water Treatment: Principles and Design, John Wiley & Sons, Hoboken, New Jersey, USA, 2nd edn, 2005 Search PubMed.
- G. Hua and D. A. Reckhow, Environ. Sci. Technol., 2007, 41, 3309–3315 CrossRef CAS PubMed.
- G. Korshin, C. W. K. Chow, R. Fabris and M. Drikas, Water Res., 2009, 43, 1541–1548 CrossRef CAS PubMed.
- J. J. Rook, Environ. Sci. Technol., 1977, 11, 478–482 CrossRef CAS.
- H. Gallard and U. von Gunten, Water Res., 2002, 36, 65–74 CrossRef CAS PubMed.
- FAOSTAT, Food and Agriculture Organization of the United Nations. Crops and livestock products statistics, http://faostat.fao.org/site/535/DesktopDefault.aspx?PageID=535#ancor, (accessed Accessed 3 July 2015) Search PubMed.
- FAOSTAT, Food and Agriculture Organization of the United Nations. Statistics on Production of Crops, http://faostat.fao.org/site/567/DesktopDefault.aspx?PageID=567#ancor, (accessed Accessed 3 July 2015) Search PubMed.
- A. A. Stevens, L. A. Moore and R. J. Miltner, Journal AWWA, 1989, 81, 54–60 CAS.
- Y. Pan and X. Zhang, Environ. Sci. Technol., 2013, 47, 1265–1273 CrossRef CAS PubMed.
- J. L. Acero, P. Piriou and U. von Gunten, Water Res., 2005, 39, 2979–2993 CrossRef CAS PubMed.
- M. da Silva Pinto, Food Res. Int., 2013, 53, 558–567 CrossRef CAS.
Footnote |
| † Electronic supplementary information (ESI) available. See DOI: 10.1039/c5ew00222b |
| This journal is © The Royal Society of Chemistry 2016 |

