Microbial fuel cells with an integrated spacer and separate anode and cathode modules†
Weihua
He
a,
Xiaoyuan
Zhang
bc,
Jia
Liu
ab,
Xiuping
Zhu
b,
Yujie
Feng
*a and
Bruce E.
Logan
*ab
aState Key Laboratory of Urban Water Resource and Environment, Harbin Institute of Technology, No. 73 Huanghe Road, Nangang District, Harbin 150090, PR China. E-mail: yujief@hit.edu.cn; Fax: +86 451 86287017; Tel: +86 451 86287017
bDepartment of Civil & Environmental Engineering, Penn State University, 231Q Sackett Building, University Park, PA 16802, USA. E-mail: blogan@psu.edu; Fax: +1 814 863 7304; Tel: +1 814 863 7908
cState Key Joint Laboratory of Environment Simulation and Pollution Control, School of Environment, Tsinghua University, Beijing 100084, PR China
First published on 12th November 2015
Abstract
A new type of scalable MFC was developed based on using alternating graphite fiber brush array anode modules and dual cathode modules in order to simplify construction, operation, and maintenance of the electrodes. The modular MFC design was tested with a single (two-sided) cathode module with a specific surface area of 29 m2 m−3 based on a total liquid volume (1.4 L; 20 m2 m−3 using the total reactor volume of 2 L), and two brush anode modules. Three different types of spacers were used in the cathode module to provide structural stability, and enhance air flow relative to previous cassette (combined anode–cathode) designs: a low-profile wire spacer; a rigid polycarbonate column spacer; and a flexible plastic mesh spacer. The best performance was obtained using the wire spacer that produced a maximum power density of 1100 ± 10 mW m−2 of cathode (32 ± 0.3 W m−3 based on liquid volume) with an acetate-amended wastewater (COD = 1010 ± 30 mg L−1), compared to 1010 ± 10 mW m−2 for the column and 650 ± 20 mW m−2 for the mesh spacers. Anode potentials were unaffected by the different types of spacers. Raw domestic wastewater produced a maximum of 400 ± 8 mW m−2 under fed batch conditions (wire-spacers), which is one of the highest power densities for this fuel. Over time the maximum power was reduced to 300 ± 10 mW m−2 and 275 ± 7 mW m−2 for the two anode compartments, with only slightly less power of 250 ± 20 mW m−2 obtained under continuous flow conditions. In fixed-resistance tests, the average COD removal was 57 ± 5% at a hydraulic retention time of 8 h. These results show that this modular MFC design can both simplify reactor construction and enable relatively high power generation from even relatively dilute wastewater.
Water impactA microbial fuel cell (MFC) simultaneously treats and generates energy from wastewater. However, the requirements of low construction and maintenance costs, high cathode specific area, and good power production with domestic wastewater have presented challenges for larger scale and practical applications. An MFC architecture was devised that used separate plug-in modules for anodes and cathodes, with wire spacers, which simplified construction and operation of the MFC while providing close electrode spacing. This new design enabled high performance with domestic wastewater compared to other reactor designs. |
Introduction
In the United States, the economic cost of wastewater treatment is approximately $7.5 billion per year.1 The most common wastewater treatment method for large-scale installations, activated sludge, can consume an average of 0.6 kWh per cubic meter of domestic wastewater or ~1 kWh per kg of COD removed, with half of this energy used for aeration.2–4 Novel treatment techniques, such as microbial fuel cells (MFCs), are being investigated to reduce energy consumption of wastewater treatment plants. MFCs exploit the ability of microorganisms to convert chemical energy contained in wastewater organic matter directly to electricity,3 thus coupling treatment process of wastewater with sustainable electricity generation.5,6 Complete treatment cannot be accomplished solely with MFCs, however, as current production is rapidly reduced to low levels when the chemical oxygen demand of the organic matter is reduced to ~100–200 mg L−1.7,8 MFCs can be coupled to other processes, such as anaerobic fluidized bed membrane bioreactors (AFMBRs), to achieve low effluent COD (<20 mg L−1) and total solids concentrations (<1 mg L−1) in the treated effluent, with low or near-neutral energy consumption.9Scaling up MFCs is challenging based on the need to use inexpensive and non-precious metal materials and to achieve good performance. The use of carbon fibre brushes provides a route to make low-cost anodes,10–12 and several different cathodes have been constructed without precious metals using activated carbon (AC) as a catalyst.13,14 The primary remaining challenges are to design compact reactors that can be operated and maintained under continuous flow conditions. Many MFCs have been examined that contain less than a liter of anolyte,15–17 some on the scale of one to several liters,18–20 but very few reactors have been tested on the scale of tens21,22 to hundreds23 of liters. MFC performance is typically evaluated based on power densities, but for effective treatment the reactors must have short hydraulic retention times (HRTs), continuous flow operating conditions, and they cannot clog or suffer irreversible decreases in performance over short periods of time. Platinum catalyst cathodes rapidly degrade in performance over time, and therefore they are not suitable for use in wastewater applications, but AC cathodes show relatively smaller decreases in performance over time.24,25
MFCs have not been previously designed with consideration of the need for a simple modular electrode construction method, a design that can provide easy placement of electrodes into the reactor, or the ability to remove the electrodes for possible maintenance. So far, two modular approaches have been used for MFCs: cassette, and tubular. In the cassette approach, the anodes and cathodes are bolted or glued together in a plate and frame approach, typically with the anode on the outside (water side) and the air cathodes on the inside.1,18,20,26 A few other studies used fixed electrodes inside the reactor15 or the electrodes built together.22 These design approaches could allow for a cassette to be removed, but the anodes are directly connected to the cathodes, and thus they cannot be separately made, added, or removed from the reactor. Access to the cathode may be particularly important, as the cathode typically limits MFC performance,27 and power can decrease over time. Restoring cathode performance requires the removal of biofilm and soaking the cathode in dilute acid, which would kill bacteria on the anode if both electrodes were connected together.12,24 Thus, the cathode may require intermittent cleaning separate from the anode.
The cathode area per volume is a key reactor design factor, and may previous designs have had low power production using domestic wastewater due to low cathode specific surface areas (cathode area per volume of reactor).28 Some cassette designs have had relatively large distances between the cassette cathodes, resulting in cathode specific surface areas of only 11 m2 m−3 and 9 m2 m−3 per empty bed (total) reactor volume, and thus low volumetric power densities.1,15 For example, a 90 L cassette MFC with 6 m2 m−3, produced only 1 W m−3 (170 mW m−2 of cathode).22 Higher cathode specific areas (37 and 39 m2 m−3) have been used by others, but these reactors used Pt catalysts which rapidly degrade in performance, and PTFE-based diffusion layers which cannot withstand high water pressures.18,20 In all these previous cassette designs, the anode and cathodes were both part of the same cassette and thus could not be individually accessed.
MFCs constructed based on tubular reactor designs usually have a cathode wrapped around the anode in a cylinder,29 but power densities using these reactors have been low or long HRTs have been required. For example, a 40-tube reactor with a total capacity of 10 L and a high cathode specific surface area of 62 m2 m−3 (not including spaces between cathodes on the outsides of the tubes) produced only 66 mW m−2 (4.1 W m−3) using a brewery wastewater (2100 mg COD L−1) at an HRT of 48 h.30 In tests using a different tubular design with 4-L modules (cathode specific surface area of 80 m−2 m−3) at a municipal wastewater treatment facility, at a HRT of 11 h,19 we estimate only 0.12 ± 0.09 mW m−2 (9.2 ± 7.3 mW m−3) was produced. One disadvantage of a tubular design is that the tubes must be kept narrow in order to have a high specific cathode surface area, as explained in a recent review.28 In addition, the anodes and cathodes remain attached to each other in tubular designs developed to date, which would make it difficult to separately clean or maintain the electrodes.
In this study, we developed an MFC containing separate anode and cathode modules, and tested the design using two modules of brush anode arrays and a cathode module (2 cathodes, one on each side), separated by three different types of spacers (Fig. 1). The use of a spacer is critical for building larger-scale systems as higher water pressure will be produced on the cathode, which can result in cathode deformation or collapse.31 This design could easily be built at larger scales by placing a series of alternating anode and cathode modules that are easily inserted into a tank. Unlike previous cassette designs, this new modular design allows for individual anode or cathode modules to be separately made, and then inserted easily into a tank for reactor construction. In addition, the individual electrodes could also be easily removed for servicing or maintenance. A key feature of the modular design is the spacer, which allows for air flow and reinforcement of the electrodes. However, spacer designs have not been systematically examined in MFCs despite their importance to performance. A plastic mesh spacer was used previously in a very small MFC (28 mL).32 Plastic mesh can reduce performance by limiting air flow through the cathode module, and by covering up the cathode surface and reducing oxygen transfer to the catalyst. We therefore developed a new spacer design based on using a wire mesh that would have both a high porosity as well as a minimal coverage of the cathode. We tested a third spacer design similar to that previously used in a cassette,18 but with added columns to enhance structural stability. The performance of this new modular design was tested using domestic wastewater under two conditions: with acetate added to the wastewater to provide a more uniform solution for tests with the different spacers over time; and with raw wastewater (variable wastewater conditions). The MFC was operated in both fed-batch and continuous flow modes.
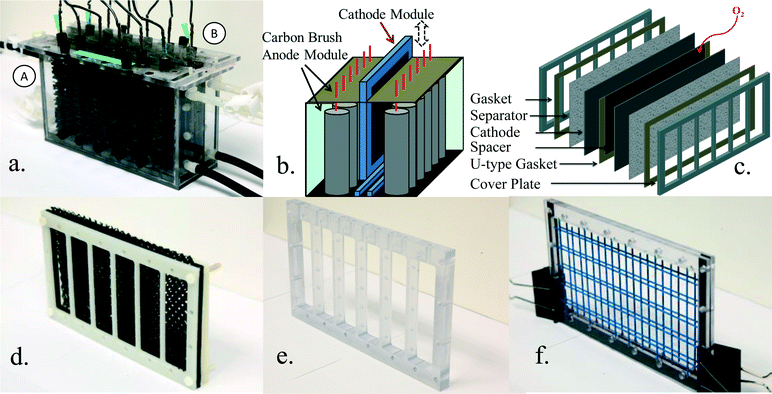 | ||
| Fig. 1 (a) Photograph and (b) schematic of the anode and cathode modules, and (c) isometric view of the two-cathode module. Photographs of the (d) mesh, (e), column, and (f) wire spacers. | ||
Methods
MFC module design
The MFC tank was made of polycarbonate with a total empty bed volume (no electrodes or spacers) of 2 L (22 cm long, 7 cm wide, 13 cm high), with 1 cm of the width used for the spacer. Each cathode module had two cathodes joined by a single spacer, and it was placed between two anode modules (Fig. 1; see Fig. S1 in ESI† for additional details). The two anode modules were individually connected to one of the cathodes, with designations A or B used to identify the two sides of the module (Fig. S1†). The anode module had an empty bed volume of 0.86 L and a working liquid volume of 0.7 L due to the space occupied by the anode brushes and cover plate. The working area of a single cathode was 200 cm2 (10 cm × 20 cm), producing a total cathode specific surface area of 29 m2 m−3 based on the total liquid volume (1.4 L), or 20 m2 m−3 based on total reactor volume (2 L). Neither of these cathode surface areas included the thickness of the container walls.Three different spacers were examined: a flexible plastic mesh spacer (MS) (Fig. 1d); a rigid polycarbonate column spacer (CS) (Fig. 1e); and a painted (corrosion-resistant) steel wire spacer (WS) (Fig. 1f). A single plastic mesh spacer was previously reported to be suitable for maintaining power generation between two MFCs, but the cathode size was only 3 cm in diameter.32 Six flexible plastic mesh layers were used here, each with a thickness of 1.5 mm (S1.5, 30PTFE50-625P, Dexmet Corp.), to provide a wide, porous spacer that filled the spacer compartment. Mesh spacers were equipped with six U-type gaskets, each with the same thickness, on three sides of the cathode to prevent leakage into the cathode compartment (Fig. S2a†). The column spacer, which did not have a gasket, was constructed from 5 rigid polycarbonate columns to physically separate the cathodes. Ten holes (3 mm diameter) were drilled through the top of the polycarbonate bar that connected the columns to allow air flow into the spacer. Each column had another five lateral diffusion holes to allow air passage across the cathode compartment (Fig. S2b†). The wire spacer was made from a test tube rack (VWR, SCIENCEWARE, Poxygrid, 96-Place). The rigid wires supported the space between the cathodes using only one single open layer to support each cathode. The wire spacer was embedded into a rectangle frame with a thickness of ~4 mm. One layer of U-type gaskets (1.5 mm thick, in the middle of two rectangle frame) (Fig. 1f) were used to seal the cathode compartment and allow open air circulation through the top. Two cover plates were fixed from the outside of the cathodes using nylon screws to hold together the assembled cathode module (Fig. 1c, Fig. S2d†). Cathode modules were verified not to leak prior to their use.
For each of these designs, a part of the cathode was covered by the spacer. The percentage of the cathode that was covered, called the “shadow effect” of the spacer, was estimated by the impression of the spacer on the cathode when it was assembled.
The anodes were graphite fiber brushes (2.5 cm diameter, 12 cm long; Mill-Rose, USA) made from carbon fibers (PANEX 35 50 K, Zoltek) held between two twisted titanium wires.33 Anodes were heat treated at 450 °C for 30 min prior to use.11 The air cathodes were made from an activated carbon catalyst on a stainless steel mesh (60 mesh type 304) manufactured using a rolling machine as previously described.13
Inoculation and operation
Domestic wastewater, collected from the primary clarifier of the Pennsylvania State University Wastewater Treatment Plant, was used as the inoculum and fuel in all tests (with additional acetate in some tests). The wastewater was stored at 4 °C prior to use. The wastewaters collected had a total chemical oxygen demand (COD) in the range of 400–550 mg L−1, and a soluble COD (SCOD) in the range of 200–300 mg L−1. In initial comparisons of the three spacers, the wastewater was amended (90![[thin space (1/6-em)]](https://www.rsc.org/images/entities/char_2009.gif) :
:![[thin space (1/6-em)]](https://www.rsc.org/images/entities/char_2009.gif) 10 mixture of domestic wastewater: medium) with additional sodium acetate (final concentration of 1.0 g L−1) to produce a more consistent feed, a higher COD, and a biofilm that would be acclimated to wastewater in subsequent tests. Over the long period of time needed for these experiments, the COD levels in wastewater can be quite variable and low due to changes in population over weekends and holidays in a college town. Amending the wastewater with acetate provided more consistent conditions for comparing spacers, and it avoided low COD concentration that can reduce power8 and make it difficult to evaluate the impact of just the spacers on performance. The medium was a 500 mM phosphate buffer containing: Na2HPO4, 45.8 g L−1; NaH2PHO4·H2O, 24.5 g L−1; NH4Cl, 3.1 g L−1; and KCl, 1.3 g L−1. The final pH was ~7, the conductivity of the amended wastewater varied from 8.7 to 9.2 mS cm−1, and the final total COD range was 1010 ± 30 mg L−1. Two reference electrodes (Ag/AgCl, BASi, RE-5B, 210 mV versus a standard hydrogen electrode, SHE) were inserted through the top of the reactor into the anode compartments (Fig. S1b†) in order to measure anode potentials directly (cathode potential by difference from the whole cell potential), with all potentials reported here versus Ag/AgCl. Reference electrodes were refurbished and recalibrated as needed to be accurate within ±10 mV. All MFC experiments were operated at room temperature (20 ± 2 °C).
10 mixture of domestic wastewater: medium) with additional sodium acetate (final concentration of 1.0 g L−1) to produce a more consistent feed, a higher COD, and a biofilm that would be acclimated to wastewater in subsequent tests. Over the long period of time needed for these experiments, the COD levels in wastewater can be quite variable and low due to changes in population over weekends and holidays in a college town. Amending the wastewater with acetate provided more consistent conditions for comparing spacers, and it avoided low COD concentration that can reduce power8 and make it difficult to evaluate the impact of just the spacers on performance. The medium was a 500 mM phosphate buffer containing: Na2HPO4, 45.8 g L−1; NaH2PHO4·H2O, 24.5 g L−1; NH4Cl, 3.1 g L−1; and KCl, 1.3 g L−1. The final pH was ~7, the conductivity of the amended wastewater varied from 8.7 to 9.2 mS cm−1, and the final total COD range was 1010 ± 30 mg L−1. Two reference electrodes (Ag/AgCl, BASi, RE-5B, 210 mV versus a standard hydrogen electrode, SHE) were inserted through the top of the reactor into the anode compartments (Fig. S1b†) in order to measure anode potentials directly (cathode potential by difference from the whole cell potential), with all potentials reported here versus Ag/AgCl. Reference electrodes were refurbished and recalibrated as needed to be accurate within ±10 mV. All MFC experiments were operated at room temperature (20 ± 2 °C).
Wastewater fed to the MFC was stored in a 9 L high density polyethylene carboy (Vestil, CARB-25) set in a cooler filled with ice. The wastewater was pumped into the bottom of the anode compartments using a peristaltic pump (Cole-Parmer, model 7523–90, Masterflex, Vernon Hills, IL), and it flowed out through an outlet pipe on the opposite side at the top (Fig. 1a).
The MFC was started up in batch mode using the acetate-amended wastewater and a mesh spacer, with the external resistance in the circuit gradually decreased for each cycle by using a different resistor (1000, 500, 200,100, 50, 20, 10, 8, 7, 6 and 5 Ω), in order to acclimate the reactor to higher current densities and to identify the point of maximum power (Fig. S3†). After this startup period, the three different types of spacers were successively tested. Following spacer comparison tests, new cathodes were used in the cathode module and only raw domestic wastewater was fed into the MFC. After an additional 30 d of adaption, the MFCs were switched to continuous flow operation at a hydraulic retention time (HRT) of 8 h.
Measurements and calculations
The voltage (U) was recorded using a data acquisition system (model 2700, Keithley Instruments) at 20 minute intervals. The current (I = U/R) was calculated from the set external resistance (R), and power (P = IU) was normalized by the exposed projected area of the cathode (200 cm2) or the liquid volume of the anode compartment (0.7 L). Polarization and power density curves were obtained by varying the external resistance over a single cycle in fed batch mode at 45 minute intervals, or for 2 HRTs (16 hours) in continuous flow mode.COD was measured using a standard method (HACH Co., Loveland, CO) in the high range (20–1500 mg L−1).9 Columbic efficiency (CE) was calculated as the ratio of the total coulombs transferred in the circuit divided by the theoretical amount of coulombs for the measured change in COD as previously described.34
The resistances of the anode and whole cell were obtained using electrochemical impedance spectroscopy (EIS) under working conditions of the maximum power output point. The impedance measurements were taken using a potentiostat (BioLogic, VMP3) by applying a sinusoidal voltage to the electrodes with signal amplitude of 10 mV35 around a potential of −450 mV for anode tests with acetate-amended wastewater, and −420 mV for raw (non-amended) domestic wastewater condition. The whole cell EIS tests were performed around a cell voltage of 300 mV for spacer comparison tests. The frequency was varied from 100 kHz to 10 mHz.36 The ohmic resistance was determined by the intercept on the real axis at the high-frequency; non-ohmic resistance, including the charge transfer and diffusion resistances, were determined by fitting the EIS spectra to a circuit (Fig. S4†). The cathode resistance was calculated as the difference between the whole cell and anode resistances.
Results and discussion
Comparison of spacers
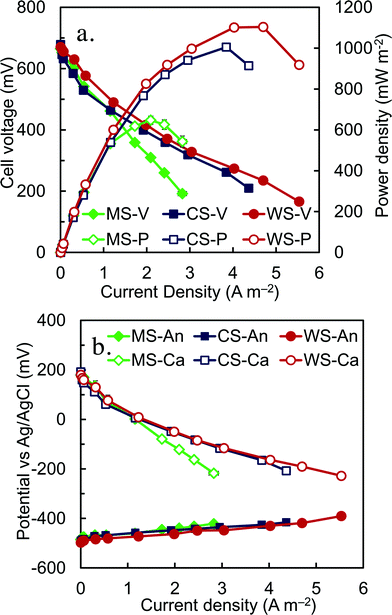
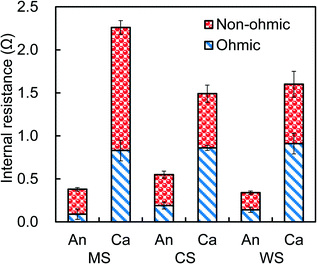
Following acclimation, reactor performance with the different spacers was compared on the basis of polarization and power density curves using acetate-amended wastewater to provide a high and consistent COD (1010 ± 30 mg L−1). The best performance was observed with the wire spacer, which produced a maximum power density of 1100 ± 10 mW m−2 and 22 W m−3 of total reactor volume (32 ± 0.3 W m−3 based on liquid volume at an external resistance of 2.5 Ω, average based on sides A and B) (Fig. 2a). This power density was slightly higher than that obtained with the column spacer (1010 ± 10 mW m−2, 20 ± 0.2 W m−3), and much larger than that produced with the mesh spacer (650 ± 20 mW m−2, 13 ± 0.6 W m−3). These differences were due to the impact of the spacer on cathode performance, as the polarization results showed that the anode potentials were all quite similar over the range of current densities (Fig. 2b). The greater negative slopes of the cathode polarization data, compared to only slightly positive slopes for the anode data, indicate that the performance was primarily controlled by cathode. These volumetric power densities were higher than those previously reported using cassette designs with artificial wastewaters, such as 17 W m−3 (total volume of 0.64 L, 2 cassettes),15 16 W m−3 (0.5 L, 1 cassettes),26 and 5.8 W m−3 (3.7 L, 10 cassette electrodes).20 It is lower than the 35 W m−3 (3.7 L, 12 cassettes) by Shimoyama et al.,18 but their tests were done with an artificial wastewater (peptone, starch and fish extract) of a very high COD of 289 g L−1.EIS was used to further examine the resistances of the anodes and the cathodes with the different spacers, and determine the origin of the internal resistances (Table S1–S3, Fig. S4†). The cathode resistances were much larger than those of the anodes, confirming that power generation was primarily due to the cathode impedance (Fig. 3). The non-ohmic resistance of the cathodes with the mesh spacers (1.40 ± 0.15 Ω), which was the sum of charge transfer and diffusion resistance, was more than twice that obtained with a column (0.63 ± 0.10 Ω) or wire (0.69 ± 0.08 Ω) spacer. However, these large differences in cathode resistances are only a part of the total overall resistances, and thus resistances measured using EIS did not predict well the final power production. The ohmic resistances, which are usually due to solution and separator resistances, were unchanged by using the different spacers. Total anode resistances were similar with wire (0.40 ± 0.05 Ω) or mesh (0.35 ± 0.08 Ω) spacers. The slightly higher anode resistance for the column spacers (0.55 ± 0.08 Ω) was likely due to the lower current densities produce with the column spacers, compared to the other two spacers.
The main impacts of the spacers on performance were: a reduced area for oxygen transfer due to the spacer resting on the electrode and blocking mass transfer (known as the “shadow effect”);37 and the porosity of the spacer which would impact air flow. It was estimated that the wire spacers covered 5.5% (11 cm2) of the cathode, compared to 10% (20 cm2) for the column spacers, based on impressions made on the cathodes. The surface area blocked by a spacer has been shown to reduce water flux by reverse osmosis membranes,38 and in a recent ion exchange membrane test it was estimated to reduce ion flux by 15%.37 The mesh spacer reduced the cathode area by 20% (40 cm2), which based on the change in area alone could have reduced power by 15% compared to the wire spacer. The wire spacer had a porosity of 98% and the column spacer 90% (based on volume of materials), while the mesh spacer had a much lower porosity of 65% (estimated from the weight of the spacer and its density). These porosities are more aligned with the reduction in power densities in MFC tests, suggesting air flow was a greater factor in spacer performance than coverage of the cathode alone.
Performance using domestic wastewater in fed-batch mode
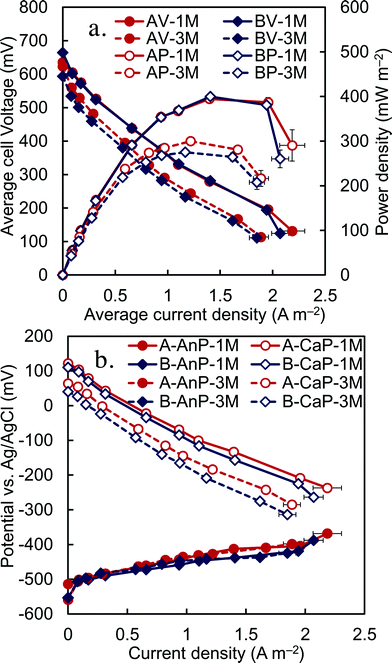
Following spacer tests using the acetate-amended wastewater, additional tests were conducted using raw (non-amended) domestic wastewater (Fig. S5†). Polarization tests showed that there were similar maximum power densities of the two anode compartments of 400 ± 8 mW m−2 (A side) and 400 ± 3 mW m−2 (B side), with an average maximum empty bed volume power density of 7.9 ± 0.1 W m−3 (11.2 ± 0.1 W m−3 based on liquid volume) (Fig. 4). The cycle length decreased from ~20 h at 5 Ω, to ~8 h at 1.5 Ω with raw (non-amended) domestic wastewater (Fig. S6†). These maximum power densities are among the highest obtained using the same domestic wastewater source in air-cathode MFCs in our laboratory, for example 332 mW m−2 (liquid volume power density of 8.3 W m−3, 25 m2 m−3 of cathode per volume, 7 cm2 of cathode area),39 282 mW m−2 (7.6 W m−3, 27 m2 m−3, 35 cm2),40 and 230 mW m−2 (12 mW m−3, 54 m2 m−3, 35 cm2).41 These are also higher than those reported for cassette MFCs at lower (149 mW m−2, 110 mg L−1 COD),1 similar (100 mW m−2, 500 mg L−1 COD),20 and higher CODs (170 mW m−2, COD > 3000 mg L−1).22After operation of the MFCs for 3 months, polarization data were again obtained to evaluate electrode performance. The maximum power densities had decreased to 300 ± 10 mW m−2 (compartment A) and 275 ± 7 mW m−2 (compartment B) (Fig. 4). The anode potentials were the same in the original (1 month) and final (3 month) polarization tests, indicating that changes were due to cathode performance rather than changes in wastewater quality or composition. A decline in cathode performance was expected given previous long-term studies of MFCs with acetate that have shown reduced cathode performance over time.24,25 It has been shown that the performance of activated carbon cathodes can be restored to nearly their original performance levels using an acid treatment.24
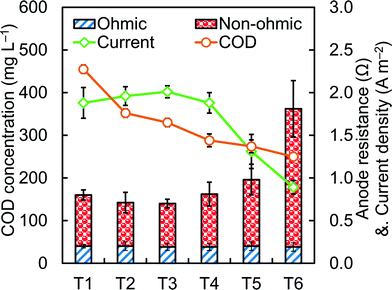
The current and power produced in an MFC can depend on the strength of the wastewater.42 To examine how the change in COD affected MFC performance here, current and COD concentrations were measured over the course of ~8 h during a fed-batch cycle, with measurements taken 6 times during this period, with approximately 30 minutes between each EIS test. These six time intervals (T1–T6) were obtained by dividing one complete fed-batch cycle (8 hour) into six equal parts (80 min each). Current production was relatively stable at 2.0 ± 0.1 A m−2 while the COD concentration decreased from 450 ± 10 mg L−1 to 288 ± 15 mg L−1 (T1–T4) (Fig. 5). However, current production sharply decreased to 1.3 ± 0.2 A m−2 at 275 ± 15 mgCOD L−1 (T5) and 0.9 ± 0.1 A m−2 at 250 ± 5 mg L−1 (T6). This decrease in performance is consistent with a previous study that showed that current production sharply decreased at COD concentrations lower than ~250 mg L−1, using wastewater from the same treatment plant.8
The changes in anode resistances during multiple fed batch cycles were monitored by briefly setting the anode potential at a set potential of −420 mV for 50 min, followed by an EIS test with the same anode potential for another ~30 min (Fig. 5). The non-ohmic resistance of the anodes paralleled observations of rapid decreases in current density as the COD was reduced. In the two last time intervals, with the COD of 275 mg L−1 or less, the non-ohmic anode resistance rose from 0.56 ± 0.09 Ω, to 0.77 ± 0.18 Ω (T5) and 1.62 ± 0.33 Ω (T6). The low current production by the MFC at these COD concentrations is a further example of the need for a secondary treatment process, such as an AFMBR, to reduce COD to levels suitable for wastewater discharge.9
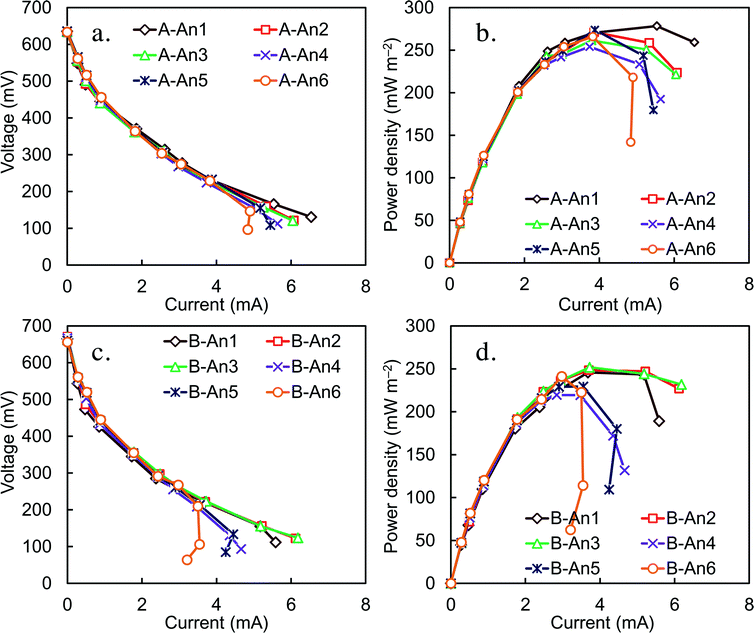
Performance using domestic wastewater with continuous flow
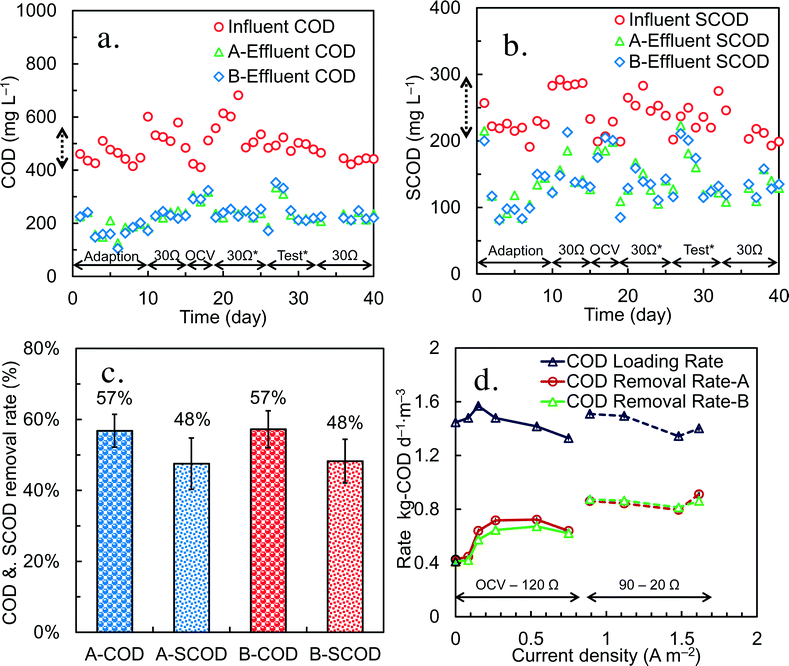
After 1 month of operation in fed-batch mode, and continuous mode with various HRTs and external resistances, the MFC was switched to continuous flow mode and acclimated at a single HRT of 8 h. Each brush in the anode array was connected to the cathode with a separate wire and resistor (30 Ω) to allow measurement of the voltage produced by each anode. Over time the anodes developed relatively stable power, with the B anodes producing slightly less and more erratic voltage than the A anodes (Fig. S7†). A maximum power density of 250 ± 20 mW m−2 was obtained using 60 Ω external resistors for each anode (Fig. 6). Polarization data for the individual anodes showed a trend of increased power overshoot for the anodes near the reactor effluent (anodes 4, 5 and 6), where the COD concentration would be low and approaching the effluent concentration, compared to the anodes near the influent (anodes 1, 2 and 3), which would have been exposed to higher COD concentrations. Power overshoot can be seen in the polarization curves by first, a rapid decrease in voltage with increasing current, followed by a doubling back of the power curve at the highest currents as the external resistance was further reduced. Voltage overshoot was more apparent for the B compartment, which had a lower power density, than the A compartment.There were no obvious trends in the influent total or soluble COD concentrations over time, despite the use of two separate wastewater samples for these tests (one wastewater sample for days 1–4, and another sample for day 5–7) and sample storage over this period of time (Fig. 7a and b). The average influent CODs were 480 ± 25 mg L−1 for total COD and 225 ± 12 mg L−1 for SCOD, with the same overall removals in the two anode compartments of 57 ± 5% for total COD and 48 ± 7% for SCOD (Fig. 7c).
A reduction in the circuit resistance increased current density and also increased the rate of COD removal under continuous flow conditions (Fig. 7d). The COD removal rate under open circuit conditions, supported primarily by oxygen leakage through the cathode,8 was 0.42 ± 0.01 kgCOD d−1 m−3. With separate external resistances ranging from 2000 Ω (0.08 ± 0.002 A m−2) to 120 Ω (0.75 ± 0.03 A m−2), the COD removal rate increased by 67% to 0.70 ± 0.04 kgCOD d−1 m−3. At lower resistances of 20 Ω (0.89 ± 0.02 A m−2) to 120 Ω (1.6 ± 0.2 A m−2), the COD removal rates increased by 110% compared to open circuit conditions, ranging from 0.81 ± 0.01 to 0.89 ± 0.04 kgCOD d−1. The CEs also varied with COD removal rates, with the lowest CE of 4.4 ± 0.2% at 2000 Ω, the highest CE of 42 ± 4.0% at 30 Ω (Fig. S8†). These results demonstrate the substantial impact of current generation on COD removal rate in these systems.
The COD removal rate related with current generation provided a good perspective for evaluating MFC operation conditions. For MFC applications at wastewater treatment plants, careful consideration will need to be given to whether they are operated to maximize power or to produce high current densities. Increasing current density, by using reduced electrical loads (lower external resistors), will increase the rate of COD removal and thus could lead to shorter HRTs. High current densities will lower the voltage, reducing recoverable power, but potentially increase treatment rates. The tradeoffs in HRT and COD removal rate with power production will need to be more carefully considered in the future when optimizing the system for treatment efficiency and minimizing costs.
Conclusions
An application oriented stackable MFC reactor with separate anode and cathode modules was designed and built. Three spacer structures were evaluated to maintain good air flow while reinforcing the electrodes (to prevent their deformation). The wire spacers produced the best performance as they minimized blockage of the cathode surface and allowed good air flow to the cathode, resulting in a reactor design that produced the highest power densities yet obtained in larger reactors using domestic wastewater. Power densities of 32 ± 0.2 W m−3 was produced with an acetate-amended wastewater, and 11 ± 0.1 W m−3 was achieved using raw domestic wastewater with the modular, wire spacer design. Under fixed-resistance tests, the average COD removal was 57 ± 5% at a hydraulic retention time of 8 h (30 Ω resistances per anode). COD removal rate was shown to be enhanced by 110%, along with current density, using lower resistances. This new design provides an easy method to construct and install electrodes, and at the same time it produced relatively high power densities with domestic wastewater.Acknowledgements
The authors thank David Jones for help with the manufacture of the reactor and analytical measurements. This research was supported by the Strategic Environmental Research and Development Program (SERDP), Award KUS-I1-003-13 from the King Abdullah University of Science and Technology (KAUST), the State Key Laboratory of Urban Water Resource and Environment, Harbin Institute of Technology (Grant No. 2013DX08), the National Natural Science Fund for Distinguished Young Scholars (Grant No. 51125033), Funds for Creative Research Group of China (Grant No. 51121062), an international collaborative project between China and Canada (2011DFG93360), National Natural Science Foundation of China (Grant No. 51408336, to X. Z.), and a scholarship (No. 201206120191) to W. H. from the China Scholarship Council (CSC).References
- J. Yu, J. Seon, Y. Park, S. Cho and T. Lee, Bioresour. Technol., 2012, 117, 172–179 CrossRef CAS PubMed.
- Y. Ahn and B. E. Logan, Bioresour. Technol., 2010, 101, 469–475 CrossRef CAS PubMed.
- P. L. McCarty, J. Bae and J. Kim, Environ. Sci. Technol., 2011, 45, 7100–7106 CrossRef CAS PubMed.
- K. Rabaey and W. Verstraete, Trends Biotechnol., 2005, 23, 291–298 CrossRef CAS PubMed.
- R. Amutha, J. J. M. Josiah, J. A. Jebin, P. Jagannathan and S. Berchmans, J. Appl. Electrochem., 2010, 40, 1985–1990 CrossRef CAS.
- W. W. Li, H. Q. Yu and Z. He, Energy Environ. Sci., 2014, 7, 911–924 CAS.
- L. J. Ren, X. Y. Zhang, W. H. He and B. E. Logan, Biotechnol. Bioeng., 2014, 111, 2163–2169 CrossRef CAS PubMed.
- X. Y. Zhang, W. H. He, L. J. Ren, J. Stager, P. J. Evans and B. E. Logan, Bioresour. Technol., 2015, 176, 23–31 CrossRef CAS PubMed.
- L. J. Ren, Y. Ahn and B. E. Logan, Environ. Sci. Technol., 2014, 48, 4199–4206 CrossRef CAS PubMed.
- J. C. Wei, P. Liang and X. Huang, Bioresour. Technol., 2011, 102, 9335–9344 CrossRef CAS PubMed.
- Y. Feng, Q. Yang, X. Wang and B. E. Logan, J. Power Sources, 2010, 195, 1841–1844 CrossRef CAS.
- M. Zhou, M. Chi, J. Luo, H. He and J. Tao, J. Power Sources, 2011, 196, 4427–4435 CrossRef CAS.
- H. Dong, H. Yu, X. Wang, Q. Zhou and J. Feng, Water Res., 2012, 46, 5777–5787 CrossRef CAS PubMed.
- H. Dong, H. Yu and X. Wang, Environ. Sci. Technol., 2012, 46, 13009–13015 CrossRef CAS PubMed.
- B. Wang and J. I. Han, Biotechnol. Lett., 2009, 31, 387–393 CrossRef CAS PubMed.
- Z. Ge, J. Li, L. Xiao, Y. Tong and Z. He, Environ. Sci. Technol. Lett., 2013, 1 CAS.
- V. B. Oliveira, M. Simões, L. F. Melo and A. M. F. R. Pinto, Biochem. Eng. J., 2013, 73, 53–64 CrossRef CAS.
- T. Shimoyama, S. Komukai, A. Yamazawa, Y. Ueno, B. E. Logan and K. Watanabe, Appl. Microbiol. Biotechnol., 2008, 80, 325–330 CrossRef CAS PubMed.
- F. Zhang, Z. Ge, J. Grimaud, J. Hurst and Z. He, Environ. Sci. Technol., 2013, 47, 4941–4948 CrossRef CAS PubMed.
- M. Miyahara, K. Hashimoto and K. Watanabe, J. Biosci. Bioeng., 2013, 115, 176–181 CrossRef CAS PubMed.
- D. Q. Jiang, M. Curtis, E. Troop, K. Scheible, J. McGrath, B. X. Hu, S. Suib, D. Raymond and B. K. Li, Int. J. Hydrogen Energy, 2011, 36, 876–884 CrossRef CAS.
- Y. Dong, Y. P. Qu, W. H. He, Y. Du, J. Liu, X. Y. Han and Y. J. Feng, Bioresour. Technol., 2015, 195, 66–72 CrossRef CAS PubMed.
- Y. J. Feng, W. H. He, J. Liu, X. Wang, Y. P. Qu and N. Q. Ren, Bioresour. Technol., 2014, 156, 132–138 CrossRef CAS PubMed.
- X. Zhang, D. Pant, F. Zhang, J. Liu, W. He and B. E. Logan, ChemElectroChem, 2014, 1, 1859–1866 CrossRef CAS.
- F. Zhang, D. Pant and B. E. Logan, Biosens. Bioelectron., 2011, 30, 49–55 CAS.
- K. Inoue, T. Ito, Y. Kawano, A. Iguchi, M. Miyahara, Y. Suzuki and K. Watanabe, J. Biosci. Bioeng., 2013, 116, 610–615 CrossRef CAS PubMed.
- S. Oh, B. Min and B. E. Logan, Environ. Sci. Technol., 2004, 38, 4900–4904 CrossRef CAS PubMed.
- B. E. Logan, M. J. Wallack, K. Y. Kim, W. H. He, Y. J. Feng and P. E. Saikaly, Environ. Sci. Technol. Lett., 2015, 2, 206–214 CrossRef CAS.
- L. Zhuang, Y. Zheng, S. G. Zhou, Y. Yuan, H. R. Yuan and Y. Chen, Bioresour. Technol., 2012, 106, 82–88 CrossRef CAS PubMed.
- L. Zhuang, Y. Yuan, Y. Wang and S. Zhou, Bioresour. Technol., 2012, 123, 406–412 CrossRef CAS PubMed.
- W. H. He, J. Liu, D. Li, H. M. Wang, Y. P. Qu, X. Wang and Y. J. Feng, J. Power Sources, 2014, 267, 219–226 CrossRef CAS.
- Q. Yang, Y. J. Feng and B. E. Logan, Bioresour. Technol., 2012, 110, 273–277 CrossRef CAS PubMed.
- V. Lanas, Y. Ahn and B. E. Logan, J. Power Sources, 2014, 247, 228–234 CrossRef CAS.
- Y. T. Ahn and B. E. Logan, Appl. Microbiol. Biotechnol., 2012, 93, 2241–2248 CrossRef CAS PubMed.
- Y. Ahn and B. E. Logan, Appl. Microbiol. Biotechnol., 2013, 97, 409–416 CrossRef CAS PubMed.
- X. P. Zhu, J. C. Tokash, Y. Y. Hong and B. E. Logan, Bioelectrochemistry, 2013, 90, 30–35 CrossRef CAS PubMed.
- G. M. Geise, A. J. Curtis, M. C. Hatzell, M. A. Hickner and B. E. Logan, Environ. Sci. Technol. Lett., 2014, 1, 36–39 CrossRef CAS.
- Y. C. Kim and M. Elimelech, Environ. Sci. Technol., 2012, 46, 4673–4681 CrossRef CAS PubMed.
- S. A. Cheng and B. E. Logan, Bioresour. Technol., 2011, 102, 4468–4473 CrossRef CAS PubMed.
- Y. Ahn, M. C. Hatzell, F. Zhang and B. E. Logan, J. Power Sources, 2014, 249, 440–445 CrossRef CAS.
- W. Yang, W. He, F. Zhang, M. A. Hickner and B. E. Logan, Environ. Sci. Technol. Lett., 2014, 1, 2398–2402 Search PubMed.
- Y. Feng, X. Wang, B. E. Logan and H. Lee, Appl. Microbiol. Biotechnol., 2008, 78, 873–880 CrossRef CAS PubMed.
Footnote |
| † Electronic supplementary information (ESI) available: Nine figure and three tables are provided. See DOI: 10.1039/c5ew00223k |
| This journal is © The Royal Society of Chemistry 2016 |

