 Open Access Article
Creative Commons Attribution 3.0 Unported Licence
Effect of chromophore encapsulation on linear and nonlinear optical properties: the case of “miniSOG”, a protein-encased flavin†
Nanna H.
List
a,
Frederico M.
Pimenta
b,
Lotte
Holmegaard
b,
Rasmus L.
Jensen
b,
Michael
Etzerodt
c,
Tobias
Schwabe
d,
Jacob
Kongsted
*a,
Peter R.
Ogilby
*b and
Ove
Christiansen
*b
aDepartment of Physics, Chemistry and Pharmacy, University of Southern Denmark, Campusvej 55, Odense M, 5230, Denmark. E-mail: kongsted@sdu.dk
bCenter for Oxygen Microscopy and Imaging, Department of Chemistry, Aarhus University, Langelandsgade 140, Aarhus, 8000, Denmark. E-mail: ove@chem.au.dk; progilby@chem.au.dk
cDepartment of Molecular Biology, Aarhus University, Gustav Wieds vej 10, Aarhus, 8000, Denmark
dCenter for Bioinformatics and Institute of Physical Chemistry, University of Hamburg, Bundesstraße 43, 20146 Hamburg, Germany
First published on 7th January 2014
Abstract
Linear and nonlinear spectroscopic parameters of flavin mononucleotide, FMN, have been examined both experimentally and computationally under conditions in which FMN is (1) solvated in a buffered aqueous solution, and (2) encased in a protein that is likewise solvated in a buffered aqueous solution. The latter was achieved using “miniSOG” which is an FMN-containing protein engineered from Arabidopsis thaliana phototropin 2. Although it is reasonable to expect that the encasing protein could have an appreciable effect, certainly on the nonlinear two-photon absorption cross section, we find that replacing the dynamic aqueous environment with the more static protein environment does little to influence the spectroscopic properties of FMN. The experimental and computational studies are consistent in this regard, and this agreement indicates that comparatively high-level computational methods can indeed be used with success on large chromophores with a complicated local environment. The results of the present study facilitate the much-needed development of well-characterized and readily-controlled chromophores suitable for use as intracellular sensitizers and fluorophores.
1 Introduction
The use of light-absorbing compounds in cells is a mainstay of modern biology.1 Pertinent examples include fluorescent molecules used in assays and photosensitizers used to perturb cells.2–4 Over the years, the applications of such molecules have become increasingly complicated and the required specifications have become quite demanding. In this regard, an ill-defined intracellular environment in the immediate vicinity of the chromophore is often counterproductive; photochemical, photophysical and spectroscopic properties can depend quite strongly on the molecular microenvironment.5,6One promising approach to impart some control and continuity to the local environment of an intracellular chromophore is to encapsulate it in a protein. The latter could then be specifically placed in a given intracellular domain using the techniques of modern genetic engineering.3,7 With this approach, it then becomes incumbent to characterize the effect of a given encapsulating protein on a given chromophore. Such a procedure is not only critical for the standardization of an analytical tool but it also contributes to valuable general knowledge in the quest to better understand fundamental aspects of chromophore–environment interactions.
The effects of the local environment on linear one-photon optical transitions have long been examined both experimentally and computationally,5,8,9 but the effects of the surrounding solvent on nonlinear two-photon transitions have only recently started to receive some attention.10–20 Intermolecular perturbation-induced changes in the two-photon absorption cross section are a particularly attractive problem given that this nonlinear property presumably is quite sensitive to solvent, and responds differently from the one-photon case.10 Exploring this issue is challenging and involves nontrivial techniques at the forefront of both experimental and computational chemistry. Nevertheless, the progress made thus far on both fronts has been promising and paves the way for the study of increasingly larger systems that accurately represent functional chromophores.
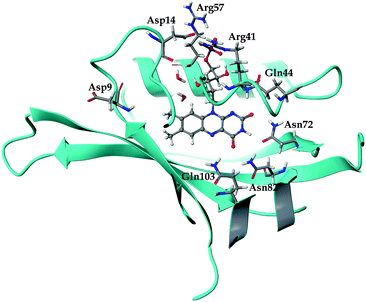
In the present study, we explored a recently developed system called miniSOG (for mini Singlet Oxygen Generator).21,22 The chromophoric heart of miniSOG is flavin mononucleotide, FMN (Fig. 1). FMN is readily bound in many proteins, including the LOV2 (light, oxygen, voltage) domain of Arabidopsis thaliana phototropin 2.23 MiniSOG is a mutated version of Arabidopsis thaliana phototropin 2 in which, among other things, a cysteine residue positioned near the bound FMN has been replaced by a glycine residue.21
Although it has recently been established that the moniker miniSOG more appropriately denotes a SuperOxide Generator24 (i.e., miniSOG is not a good singlet oxygen sensitizer24,25), this aspect of miniSOG's photophysics will not influence the present study. Rather, the very fact that enclosing FMN in a protein appreciably alters the photophysics of this chromophore, changing a reasonably good singlet oxygen sensitizer into a poor sensitizer, indicates that FMN responds to the local environment and, as such, we have indeed selected an appropriate system for the present study.
2 Methods
2.1 Experimental procedure
2.2 Computational procedure
A realistic computational approach to study the one- and two-photon optical responses of the FMN chromophore should include both the effects of the geometrical flexibility of the composite system by means of conformational averaging as well as the electrostatic effects of the surrounding environment. To achieve this, we adopted a sequential procedure consisting of classical molecular dynamics (MD) simulations followed by quantum mechanical (QM) electronic response calculations. To model the effects of the environment, we employed the polarizable embedding (PE) scheme.30,31 The PE approach used herein comprises a detailed electrostatic and polarizable force-field representation of the protein and solvent, where each atomic site of the environment is assigned a QM-derived charge to account for the permanent charge distribution of the environment as well as an isotropic electronic dipole–dipole polarizability to describe the many-body induction effects that allow for polarization of the environment. This method not only includes the mutual polarization between the protein and FMN in its electronic ground state but also incorporates the instantaneous first-order response of the environment to the changing electron density of FMN upon excitation. Due to the lack of an X-ray crystallographic structure of the miniSOG protein, the initial conformation was obtained by homology modeling based on the LOV2 domain from Oat (Avena sativa)32 as a template in SWISS-MODEL.33 In contrast to previous hybrid quantum mechanical/molecular mechanical (QM/MM) studies on LOV proteins,34–36 the QM-treated core region encompassed the entire FMN as well as a nearby sodium counterion to stabilize the dianionic chromophore. The effects of incorporating nearby residues into the QM region has been discussed in other QM/MM related studies.37,38 However, test calculations indicated that extension of the QM region is not necessary in the present PE calculations for discussing the perturbing effects of the environment (cf. Table S2 of the ESI†), as also confirmed by the comparison to experiment (vide infra). As generally recommended when using force-fields not specifically designed for the given chromophore under consideration,39–42 the PE calculations of the optical properties of FMN in the two environments (i.e. water and protein) were based on 50 structures generated by electrostatic embedding QM/MM geometry optimization of the configurations extracted from each of the MD simulations (with intervals of 20 ps), keeping the MM region fixed.All one- and two-photon properties were computed with time-dependent density functional theory (TD-DFT) using the range-separated CAM-B3LYP43 functional and the cc-pVDZ+44–46 basis set, considering only vertical electronic transitions. Besides improving issues related to charged systems,47 CAM-B3LYP has been demonstrated to provide, by far, the best performance among related conventional functionals for the description of two-photon absorption cross sections48,49 as well as for describing the coupling to an environment.50 Following previous studies,34,51 its performance applied to the one-photon properties of encapsulated FMN was validated by comparison to the approximate coupled cluster singles and doubles (CC2) approach using the recently developed extension to polarizable embedding including the resolution of the identity approximation (PERI-CC2).52,53
The PE-TDDFT and PERI-CC2 calculations were conducted using development versions of DALTON201154 and TURBOMOLE V6.4,55 respectively. A detailed description of the computational protocol is supplied in the ESI.†
3 Results and discussion
3.1 Experimental data
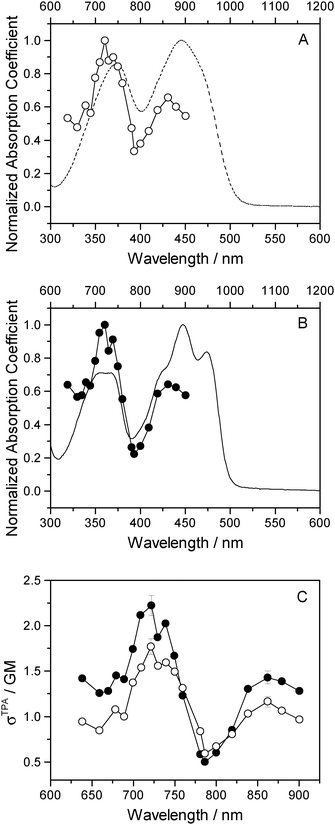
One-photon absorption spectra of both FMN and miniSOG were recorded in phosphate buffered aqueous solutions at pH 7 (Fig. 2). The protein-dependent appearance of structure on the absorption bands of FMN is consistent with what has previously been observed,21,23 and is attributed to vibronic transitions.56,57 In an independent exercise,24 we quantified the extinction coefficient of FMN when incorporated in the protein cage. Our data indicate that the surrounding protein in miniSOG slightly enhances the one-photon absorption coefficient of FMN at the band maxima [εmax(miniSOG) = 15![[thin space (1/6-em)]](https://www.rsc.org/images/entities/char_2009.gif) 883 ± 428 M−1 cm−1 at 448 nm; εmax(FMN) = 12
883 ± 428 M−1 cm−1 at 448 nm; εmax(FMN) = 12![[thin space (1/6-em)]](https://www.rsc.org/images/entities/char_2009.gif) 063 ± 408 M−1 cm−1 at 450 nm]. Moreover, the encasing protein serves to slightly increase the difference in intensities between the band centered at ∼450 nm and that centered at ∼360–375 nm.
063 ± 408 M−1 cm−1 at 450 nm]. Moreover, the encasing protein serves to slightly increase the difference in intensities between the band centered at ∼450 nm and that centered at ∼360–375 nm.
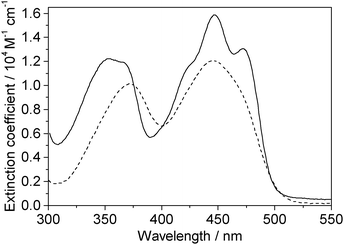 | ||
| Fig. 2 Experimental data. One-photon absorption spectra of FMN (dashed line) and miniSOG (solid line) in phosphate buffered aqueous solutions. | ||
Two-photon fluorescence excitation spectra were recorded of both FMN and miniSOG, and the wavelength-dependent two-photon absorption cross sections were determined by concurrently recording corresponding data from molecules established as standards. The results, presented as absorption spectra, are shown in Fig. 3 along with the corresponding one-photon spectrum. To our knowledge, there is only one published report of the FMN two-photon spectrum58 and, relative to these data, our results in Fig. 3 show more structure on the spectrum and yield a slightly larger absorption cross section at the band maximum.
The data in Fig. 3 indicate that the change in environment from bulk water to the encapsulating protein has only minor effects on the FMN spectrum. Perhaps most importantly, the two-photon spectra of both FMN and miniSOG resemble the respective one-photon absorption spectra recorded at half the wavelength. On the basis of parity-dependent selection rules, this observation is indeed expected for a chromophore that does not have an inversion center.27,59,60 In short, it appears that the electronic states populated in the two-photon process are the same as those populated upon one-photon absorption at half the wavelength. Admittedly, for FMN in water (Fig. 3A), both of the two-photon absorption bands appear to be systematically and slightly blue-shifted relative to the corresponding one-photon bands. This could reflect non-Condon effects as has been previously observed in one- and two-photon spectra for other molecules.61,62 Moreover, within the spectral resolution of our experiments, there appear to be no pronounced changes in the absorption band widths upon incorporating FMN in the protein.
As with the one-photon absorption coefficient, we find that encapsulating FMN in the protein also slightly increases the two-photon absorption cross sections at the band maxima [at 722 nm, σTPA(miniSOG) = 2.2 ± 0.1 GM and σTPA(FMN) = 1.8 ± 0.1 GM, where 1 GM = 10−50 cm4 s photon−1]. However, in comparing the one-photon spectra to the two-photon spectra, note that the intensity ratios of the observed bands are different. In the one-photon spectra, the lowest-energy longest-wavelength band centered at 450 nm is more intense than the shorter wavelength band centered at ∼360–375 nm. In the two-photon spectra, the opposite is observed: the shorter wavelength band is more intense than the lower-energy longer wavelength band.
3.2 Computational results
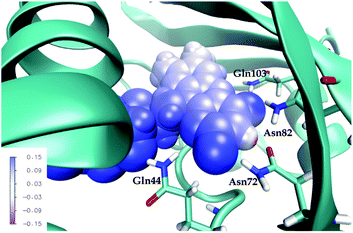
The general structure of the FMN binding pocket in miniSOG is shown in Fig. 1, which depicts the FMN chromophore and residues lining the pocket. As in other flavin-based proteins,63–65 the pteridine part of FMN participates in hydrogen bonding to the side chains of four conserved amino acids (Gln44, Asn72, Asn82 and Gln103), while the hydrophobic part is surrounded by nonpolar residues (see further discussion in the ESI†). Consistent with previous findings,66,67 the formation of hydrogen bonds in both the aqueous and the protein environment causes elongations of the C![[double bond, length as m-dash]](https://www.rsc.org/images/entities/char_e001.gif) O and N–H bonds of the FMN chromophore, and this elongation is more pronounced in the aqueous solution than in miniSOG. Moreover, comparing the variations in the geometrical parameters of FMN in aqueous solution and in the protein indicates that encapsulation of the chromophore inside the protein diminishes its structural fluctuations compared to the solvent phase (see discussion in the ESI†). This is particularly manifested in an improved planarity of the chromophore in the protein, as assessed by a root-mean-square deviation (RMSD) of the distances between the ring atoms of the flavin moiety and a plane, defined by the least-square plane fit to the same atoms (RMSD of 0.116 Å in miniSOG compared to 0.155 Å in aqueous solution). Taken together with the dynamical nature of the solvent, this leads, as discussed later, to a broadening of the one and two-photon spectra of FMN in aqueous solution compared to miniSOG.
O and N–H bonds of the FMN chromophore, and this elongation is more pronounced in the aqueous solution than in miniSOG. Moreover, comparing the variations in the geometrical parameters of FMN in aqueous solution and in the protein indicates that encapsulation of the chromophore inside the protein diminishes its structural fluctuations compared to the solvent phase (see discussion in the ESI†). This is particularly manifested in an improved planarity of the chromophore in the protein, as assessed by a root-mean-square deviation (RMSD) of the distances between the ring atoms of the flavin moiety and a plane, defined by the least-square plane fit to the same atoms (RMSD of 0.116 Å in miniSOG compared to 0.155 Å in aqueous solution). Taken together with the dynamical nature of the solvent, this leads, as discussed later, to a broadening of the one and two-photon spectra of FMN in aqueous solution compared to miniSOG.
We have randomly chosen three configurations of FMN in both the aqueous solution and in miniSOG, and based on these configurations, we computed the one-photon properties of the two lowest π–π* and n–π* transitions. Since the CAM-B3LYP results found for aqueous solution are similar to those obtained for miniSOG, we report in Table 1 only the averaged results for FMN in miniSOG; the complete set of results are compiled in Table S5 of the ESI.†
As previously observed,70,71 CAM-B3LYP overshoots the excitation energies with respect to CC2; the four transitions considered are overestimated by 0.1–0.3 eV. Even though we only used values averaged over three configurations, we note that the deviation between the PERI-CC2 and experimental results for the lowest transition (2.77 eV (448 nm), cf. Section 3.1), i.e. the one that carries the largest oscillator strength, is only 0.1 eV, while the PE-CAM-B3LYP result is blue-shifted by 0.4 eV. Hence, the excitation energies obtained using the CAM-B3LYP functional are within the expected accuracy of the TDDFT method.72 In this context, we should also note the inherent errors in comparing calculated idealized pure electronic vertical excitations with experimental band maxima. For isolated LF and riboflavin (lacking the monophosphate), inclusion of vibrational contributions has been found to displace the absorption maximum of the lowest π–π* transition by about 0.2 eV (ref. 56 and 57) and thus complete agreement between the theoretical vertical excitation energy and experimental values for band maxima positions should not be expected.
With respect to the one-photon oscillator strengths, the differences between RI-CC2 and CAM-B3LYP are small; both methods accurately distinguish between the weak and strong transitions.
In conclusion, keeping the expected blue-shift for the calculated spectra in mind, a CAM-B3LYP-based approach should be fine for modeling the effect of the local environment on spectroscopic transitions in FMN.
| Transitionb | In water | In protein | ||||||
|---|---|---|---|---|---|---|---|---|
| E ex | λ | f | δ TPA | E ex | λ | f | δ TPA | |
| a Related to the macroscopic σTPA through eqn (S4) of the ESI. b H = HOMO, L = LUMO, N = nitrogen, O = oxygen. | ||||||||
| πH–πL* | 3.18 ± 0.06 | 390 | 0.32 ± 0.02 | 177 ± 36 | 3.17 ± 0.02 | 391 | 0.35 ± 0.01 | 236 ± 25 |
| nN–πL* | 3.76 ± 0.07 | 330 | 0.04 ± 0.05 | 80 ± 90 | 3.77 ± 0.03 | 329 | 0.04 ± 0.05 | 80 ± 90 |
| πH−1–πL* | 3.78 ± 0.10 | 328 | 0.23 ± 0.04 | 415 ± 160 | 3.83 ± 0.05 | 324 | 0.23 ± 0.04 | 391 ± 100 |
| nO–πL* | 4.47 ± 0.12 | 277 | 0.00 ± 0.01 | 3.2 ± 8.4 | 4.39 ± 0.08 | 282 | — | 6.2 ± 5.3 |
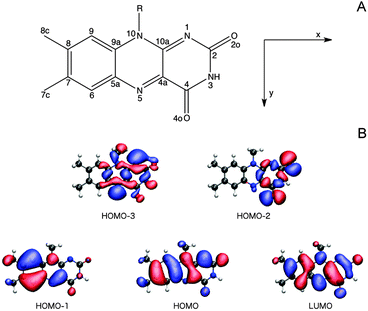
3.2.3.1 The Lumiflavin (LF) model. It is firmly settled that the low-energy region of the LF one-photon spectrum, within the spectral range considered in this study, is dictated by the two lowest-lying π–π* transitions (HOMO (H) → LUMO (L) and HOMO − 1 → LUMO).57,66,67,73,74 As can be seen from the orbital pictures in Fig. 4B, the electron density is shifted from the nonpolar to the polar side of the flavin unit in the πH−1–πL* transition. As reported previously,66 this charge rearrangement is accompanied by a substantial increase in the dipole moment upon excitation, primarily along the x-axis (see Table 3 and Fig. 4), whereas a much smaller change is found for the πH–πL* transition. In addition to these two intense transitions, we find two weak transitions of n–π* character, energetically positioned in between the two intense transitions. The lowest of these two transitions mainly originates from an nN–πL* excitation (79% HOMO − 3 → LUMO), while the main contribution to the other stems from an nO–πL* transition (63% HOMO − 2 → LUMO). These transitions are indeed expected to be weak given the fact that the important x- and y-components of the transition moments for the n–π* transitions are restricted by the Cs symmetry of isolated LF. Note that the n–π* transitions of LF in the gaseous phase are subject to some controversy since their ordering and character (lonepair orbitals on nitrogen or oxygen) change among methods (see ESI†). However, since a consistent picture across methods is found when going to the condensed phase,57,66 we shall not be concerned further with this discrepancy restricted to the isolated case.
We next proceed to the two-photon properties of isolated LF, also reported in Table 3. As expected from the absence of an inversion center (vide supra), the two-photon spectrum is dominated by the same two π–π* transitions as found in the one-photon spectrum. However, the relative intensity of the two transitions is reversed; the two-photon transition probability of the πH−1–πL* transition is larger than the πH–πL* counterpart by a factor of ca. 1.75. The amplification of the πH−1–πL transition can be rationalized by a larger contribution from the dipolar term to the Sxx two-photon transition matrix element (cf. eqn (S2) of the ESI†).
3.2.3.2 Environment-perturbed spectra. Having summarized selected one- and two-photon properties inherent to the chromophore pertinent to FMN, LF, we now consider the environmental effects on the transitions obtained from the PE-TDDFT calculations on FMN itself and on miniSOG (Table 2).
For FMN, we find that the two π–π* transitions are red-shifted, while the n–π* transitions are blue-shifted in aqueous solution compared to bare LF. This finding is consistent with previous results.66,67 As also seen, the same holds true for FMN embedded in the miniSOG protein. The most pronounced shifts are found for the πH−1–πL* and nO–πL* transitions as expected given the corresponding significant changes in dipole moments (Table 3). The sizable shifts of the πH−1–πL* and nO–π* transitions lead to an interchange of these two states in both environments. Not unexpectedly, the surrounding environment results in larger variations in transition energies for these two states (Table 2).
When comparing the FMN and miniSOG data to the model LF data, the largest spectral shifts are found in aqueous solution, which may reflect the formation of stronger hydrogen bonds to the chromophore (see further discussion and supporting data in the ESI†). The presence of either the water or protein environment also causes the πH−1–πL* and nN–π* transitions to become energetically close; in 40% of the configurations in aqueous solution, the relative energies of the two states actually interchange. In some cases, this energetic proximity contributes to a substantial mixing of the two states, as judged from the orbital characteristics, which, in turn, enhances both the one- and two-photon intensities of the otherwise weak nN–πL* transition. Consequently, the character of the two transitions becomes less well-defined in these cases.
Carrying this latter point further, we also find that both the water and protein environment are responsible for a significant amplification of the oscillator strength of the πH−1–πL* transition. Our computations also indicate that, when compared to the case of isolated LF, both the water and the protein environments cause an appreciable increase in the two-photon absorption probability of the π–π* transitions (Tables 2 and 3).
The close resemblance of the environmental influence on the transition energies of the FMN chromophore exerted by the aqueous solution and the miniSOG protein is similar to that reported for FMN in the interior of the LOV domain of the blue-light photoreceptor YtvA from Bacillus subtilis.34,75
3.2.3.3 Correlating computations with experimental data. To facilitate a comparison of the computational and experimental results, we applied a Gaussian line shape function to the computed spectral transitions. The set of snapshots describes the spread of transition energies obtained from our configuration-dependent data (i.e., the effects of inhomogeneous broadening), but they do not account for other sources of broadening such as that due to the intramolecular vibrations and dynamics. Thus, for simplicity, each state for each snapshot is represented as a Gaussian using the same width for all states and all configurations. Adding the individual set of Gaussians for a set of configurations generates a total spectrum. Since the individual Gaussians account for broadening due to effects not described by our calculations, we have no a priori knowledge of their precise appearance. The choice of the broadening function applied to each configuration-dependent transition is therefore ultimately driven by the desire to match the computed spectra with the experimental spectra. Despite this constraint, the full-width-at-half-maximum (FWHM) of the function chosen (0.35 eV) is quite reasonable for a typical electronic transition in a molecule of this size.5,8,76 Details concerning the generation of the broadened spectra are given in the ESI.† The resultant simulated one- and two-photon spectra are presented in Fig. 5 and 6.
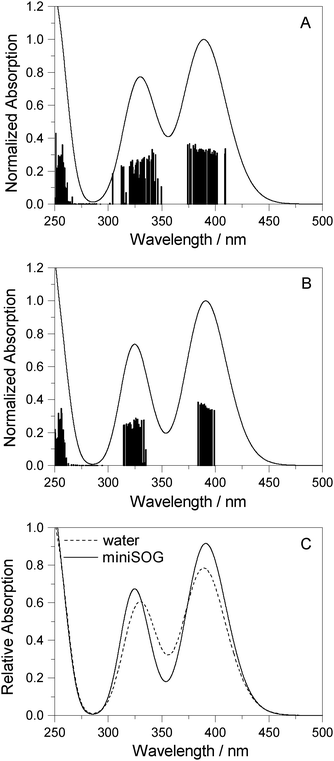 | ||
| Fig. 5 Computational results. One-photon spectra of FMN in (A) aqueous solution and (B) encapsulated in miniSOG. In each case, represented by the vertical stick, computations were performed using 50 snapshots and 10 electronic states to obtain converged spectra. Data for the electronic transitions underlying the two bands are summarized in Table 2. Each transition was then convoluted with a Gaussian line shape function with a FWHM set to 0.35 eV to yield a broadened spectral profile. The resulting spectra for FMN in water and in miniSOG are superimposed in panel C. | ||
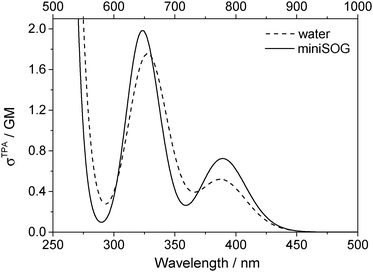 | ||
| Fig. 6 Computational results. Two-photon spectra of FMN in aqueous solution (dashed line) and encapsulated in miniSOG (solid line). Computations were performed using 50 snapshots and 10 electronic states. Data for the electronic transitions underlying the two bands are provided in Table 2. Each transition was then convoluted with a Gaussian line shape function with a FWHM set to 0.35 eV to yield the spectral profile shown. The one-photon wavelength is shown on the bottom abscissa, whereas the two-photon wavelength is shown on the top abscissa. | ||
Apart from the expected discrepancy in the calculated excitation energies (vide supra) and the discrete vibronic structure observed on the experimental miniSOG spectra, the general features of the experimental spectra are well-reproduced in the computed spectra. Specifically, the computed spectra not only model the relative intensities of bands in a given spectrum, but they accurately model the effect of the surrounding environment on the band intensities. Most importantly, the experimentally observed intensification of the two-photon cross sections of the two bands in the protein with respect to aqueous solution is reproduced by the PE calculations.
We also note that the smaller two-photon maximum cross section of the πH−1–πL* transition in solution relative to inside miniSOG is a result of two competing contributions: (1) enhancement due to the increased polarization effects of the solvent with respect to the protein and (2) the larger spread in transition energies found in aqueous solution.
3.2.3.4 Electrostatic potentials. To shed further light on the effect of the local environment on spectroscopic transitions in FMN, we computed the electrostatic potential across the chromophore produced by the ground state polarized environments. Such analyses have previously been useful in the interpretation of the one- and two-photon properties of fluorescent proteins.19,77,78Fig. 7A displays the total electrostatic potential associated with the solvated protein as well as by the aqueous solution along the atomic positions of the flavin moiety, averaged over the sampled configurations.
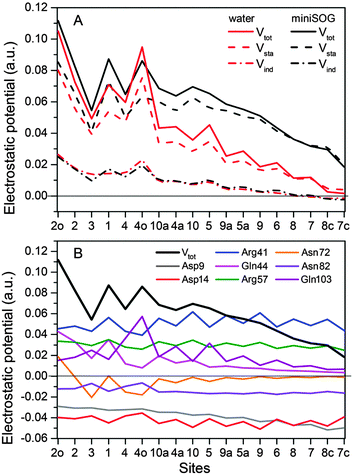 | ||
| Fig. 7 (A) Total electrostatic potential (Vtot) (in a.u.) of the ground state environment of the miniSOG protein as well as aqueous solution together with the underlying static (Vsta) and induced (Vind) contributions at the atoms of the flavin moiety of the FMN chromophore. The numbers on the abscissa refer to the atoms shown in Fig. 4A. (B) Contributions to the electrostatic potential (in a.u.) of the ground state environment of the miniSOG protein, originating from key residues compared with the total electrostatic potential (black line). The quantities have been averaged over the sampled configurations. | ||
First, note that the electrostatic potentials generated by the two distinct environments exhibit a similar general shape across the atomic sites. The potential is highest at the pteridine end and gradually decreases toward the nonpolar end of FMN, corresponding to an electric field along the long axis of the molecule (minus x-direction). For a different view, we illustrate in Fig. 8 a representative example of the projection of the electrostatic potential generated by the miniSOG protein onto the van der Waals surface of FMN. With this electric field in mind, the environment-dependent red-shift of the πH−1–πL* transition (i.e., LF to FMN in water/protein, Tables 2 and 3) can therefore be rationalized by a parallel alignment of the change in the dipole moment (cf.Table 3) upon excitation and the electric fields produced by the two environments. Likewise, the observed blue-shifts of the nN–πL* and nO–πL* transitions can be attributed to a rough “anti-alignment” of the dipole difference and the electric fields.
To gain further insight into the electrostatic nature of the two environments, we partitioned the total electrostatic potential (Vtot) of the miniSOG protein and the aqueous solution into static (Vsta) and induced (Vind) constituents. The latter arises from the relaxation of the electronic degrees of freedom of the environment to the ground state density of FMN. As is evident from Fig. 7A, the profile of the potentials exerted by both the protein and water environments is dominated by the static part. Thus, the similarity of the total electrostatic footprints of the respective environments arises as a consequence of the similar static contributions. The induced parts of the electrostatic potentials of the two different environments are also alike but only act to enhance the features of the static contributions.
To dissect the perturbing footprint of the protein, we decomposed the total electrostatic potential of the ground state environment contributions of the miniSOG protein arising from the individual amino acids. The results of this analysis are shown in Fig. 7B for selected residues (see Fig. 1). As anticipated from the noncharged immediate environment of the flavin moiety inside miniSOG, the overall trend in the electrostatic potential across FMN is not dominated by a few amino acids but is rather a result of the combined effects of the immediate environment and more distant-lying charged amino-acids. Specifically, we see that the negatively charged Asp9, located near the nonpolar end of the encased FMN, contributes together with Gln103 to the field component in the minus x-direction. The negative contribution from Asp14 to the y-component of the field is offset by the contributions originating from the positively charged Arg41 and 57 residues. Moreover, Fig. 7B confirms that the locally higher potential at the carbonyl O2 and O4 atoms as well as the N1 atom can be traced back to the Gln44, Asn72 and Gln103 residues directly engaged in hydrogen bonding to these atomic sites. Similarly, the peaks in the electrostatic potential of the aqueous solution can be attributed to hydrogen bonding water molecules.
Based on this analysis, we find that the similar appearance of the one- and two-photon spectra of FMN in aqueous solution and in the miniSOG protein is not attributed to an insensitive chromophore but rather to similar electrostatic footprints of the two environments.
4 Conclusions
Detailed experimental and computational studies have examined the effect of the local environment on both linear and nonlinear optical properties of flavin mononucleotide (FMN). Although it is reasonable to expect, a priori, that encasing FMN in a protein might have an appreciable effect on the nonlinear optical properties, we find that both the two-photon absorption spectra and cross sections for FMN in water are quite similar to those for FMN in the so-called miniSOG protein. Our results indicate that this similar behavior can be attributed not to an insensitive chromophore but rather to similar electrostatic footprints of the two distinct environments.In the least, the agreement between our experimental and computational data on this point better facilitates a systematic study of specific protein-dependent perturbations (i.e., mutations) that can ultimately influence two-photon transitions in FMN. In turn, this will give us a better general understanding of the extent to which nonlinear optical transitions respond to environmental perturbations. Controlling and quantifying nonlinear optical transitions in protein encased molecules such as FMN will contribute significantly to the development of tools used to study mechanisms of biological processes in living cells.
Acknowledgements
N.H.L. and J.K. thank the Lundbeck Foundation for financial support. J.K. thanks the Danish Natural Science Research Council/The Danish Councils for Independent Research (the Sapere Aude programme) and the Villum Foundation for financial support. The authors thank the Danish Center for Scientific Computing for computational resources. This work was supported by the Danish National Research Foundation and an EU Marie Curie Training Grant (TopBio PITN-GA-2010-264362).References
- B. Alberts, A. Johnson, J. Lewis, M. Raff, K. Roberts and P. Walter, Molecular Biology of the Cell, Garland Science, New York, 2002 Search PubMed.
- J. R. Lakowicz, Principles of Fluorescence Spectroscopy, Springer, New York, 2006 Search PubMed.
- B. N. G. Giepmans, S. R. Adams, M. H. Ellisman and R. Y. Tsien, Science, 2006, 312, 217–224 CrossRef CAS PubMed.
- P. R. Ogilby, Chem. Soc. Rev., 2010, 39, 3181–3209 RSC.
- P. Suppan and N. Ghoneim, Solvatochromism, Royal Society of Chemistry Cambridge, Cambridge, 1997 Search PubMed.
- P. Klán and J. Wirz, Photochemistry of Organic Compounds: From Concepts to Practice, Wiley, Chichester, 2009 Search PubMed.
- Probes and Tags to Study Biomolecular Function: For Proteins, RNA, and Membranes, ed. L. W. Miller, Wiley-VCH, Weinheim, 2008 Search PubMed.
- C. Reichardt, Solvents and Solvent effects in Organic Chemistry, VCH, Weinheim, 1988 Search PubMed.
- Modeling Solvent Environments, ed. M. Feig, Wiley-VCH, Weinheim, 2009 Search PubMed.
- M. Johnsen and P. R. Ogilby, J. Phys. Chem. A, 2008, 112, 7831–7839 CrossRef CAS PubMed.
- H. Y. Woo, B. Liu, B. Kohler, D. Korystov, A. Mikhailovsky and G. C. Bazan, J. Am. Chem. Soc., 2005, 127, 14721–14729 CrossRef CAS PubMed.
- Y. Luo, P. Norman, P. Macak and H. Ågren, J. Phys. Chem. A, 2000, 104, 4718–4722 CrossRef CAS.
- M. J. Paterson, J. Kongsted, O. Christiansen, K. V. Mikkelsen and C. B. Nielsen, J. Chem. Phys., 2006, 125, 184501 CrossRef PubMed.
- K. Zhao, L. Ferrighi, L. Frediani, C.-K. Wang and Y. Luo, J. Chem. Phys., 2007, 126, 204509 CrossRef PubMed.
- F. Terenziani, A. Painelli, C. Katan, M. Charlot and M. Blanchard-Desce, J. Am. Chem. Soc., 2006, 128, 15742–15755 CrossRef CAS PubMed.
- T. Kogej, D. Beljonne, F. Meyers, J. W. Perry, S. R. Marder and J. L. Brédas, Chem. Phys. Lett., 1998, 298, 1–6 CrossRef CAS.
- M. M. Gonzalez, J. Arnbjerg, M. P. Denofrio, R. Erra-Balsells, P. R. Ogilby and F. M. Cabrerizo, J. Phys. Chem. A, 2009, 113, 6648–6656 CrossRef CAS PubMed.
- M. Drobizhev, N. S. Makarov, S. E. Tillo, T. E. Hughes and A. Rebane, Nat. Methods, 2011, 8, 393–399 CrossRef CAS PubMed.
- M. Drobizhev, S. E. Tillo, N. S. Makarov, T. E. Hughes and A. Rebane, J. Phys. Chem. B, 2009, 113, 855–859 CrossRef CAS PubMed.
- M. Drobizhev, S. Tillo, N. S. Makarov, T. E. Hughes and A. Rebane, J. Phys. Chem. B, 2009, 113, 12860–12864 CrossRef CAS PubMed.
- X. Shu, V. Lev-Ram, T. J. Deerinck, Y. Qi, E. B. Ramko, M. W. Davidson, Y. Jin, M. H. Ellisman and R. Y. Tsien, PLoS Biol., 2011, 9, e1001041 CAS.
- Y. B. Qi, E. J. Garren, X. Shu, R. Y. Tsien and Y. Jin, Proc. Natl. Acad. Sci. U. S. A., 2012, 109, 7499–7504 CrossRef CAS PubMed.
- M. Salomon, J. M. Christie, E. Knieb, U. Lempert and W. R. Briggs, Biochemistry, 2000, 39, 9401–9410 CrossRef CAS PubMed.
- F. M. Pimenta, R. L. Jensen, T. Breitenbach, M. Etzerodt and P. R. Ogilby, Photochem. Photobiol., 2013, 89, 1116–1126 CrossRef CAS PubMed.
- R. Ruiz-González, A. L. Cortajarena, S. H. Mejias, M. Agut, S. Nonell and C. Flors, J. Am. Chem. Soc., 2013, 135, 9564–9567 CrossRef PubMed.
- J. Arnbjerg, M. Johnsen, P. K. Frederiksen, S. E. Braslavsky and P. R. Ogilby, J. Phys. Chem. A, 2006, 110, 7375–7385 CrossRef CAS PubMed.
- J. Arnbjerg, M. J. Paterson, C. B. Nielsen, M. Jørgensen, O. Christiansen and P. R. Ogilby, J. Phys. Chem. A, 2007, 111, 5756–5767 CrossRef CAS PubMed.
- C. Xu and W. Webb, Multiphoton Excitation of Molecular Fluorophores and Nonlinear Laser Microscopy, Plenum Press, New York, 1997, vol. 5, pp. 471–540 Search PubMed.
- C. Xu and W. W. Webb, J. Opt. Soc. Am. B, 1996, 13, 481–491 CrossRef CAS.
- J. M. Olsen, K. Aidas and J. Kongsted, J. Chem. Theory Comput., 2010, 6, 3721–3734 CrossRef CAS.
- J. M. H. Olsen and J. Kongsted, Adv. Quantum Chem., 2011, 61, 107–143 CrossRef CAS.
- A. S. Halavaty and K. Moffat, Biochemistry, 2007, 46, 14001–14009 CrossRef CAS PubMed.
- K. Arnold, L. Bordoli, J. Kopp and T. Schwede, Bioinformatics, 2006, 22, 195–201 CrossRef CAS PubMed.
- S. Salzmann, M. R. Silva-Junior, W. Thiel and C. M. Marian, J. Phys. Chem. B, 2009, 113, 15610–15618 CrossRef CAS PubMed.
- M. Dittrich, P. L. Freddolino and K. Schulten, J. Phys. Chem. B, 2005, 109, 13006–13013 CrossRef CAS PubMed.
- T. Domratcheva, R. Fedorov and I. Schlichting, J. Chem. Theory Comput., 2006, 2, 1565–1574 CrossRef CAS.
- L. H. Hu, P. Soderhjelm and U. Ryde, J. Chem. Theory Comput., 2011, 7, 761–777 CrossRef CAS.
- K. Meier, W. Thiel and W. F. van Gunsteren, J. Comput. Chem., 2012, 33, 363–378 CrossRef CAS PubMed.
- Y.-W. Hsiao, E. Sanchez-Garcia, M. Doerr and W. Thiel, J. Phys. Chem. B, 2010, 114, 15413–15423 CrossRef CAS PubMed.
- Y.-W. Hsiao, J. P. Götze and W. Thiel, J. Phys. Chem. B, 2012, 116, 8064–8073 CrossRef CAS PubMed.
- M. Beerepoot, A. H. Steindal, J. Kongsted, B. O. Brandsdal, L. Frediani, K. Ruud and J. M. H. Olsen, Phys. Chem. Chem. Phys., 2013, 15, 4735–4743 RSC.
- J. J. Eriksen, J. M. H. Olsen, K. Aidas, H. Ågren, K. V. Mikkelsen and J. Kongsted, J. Comput. Chem., 2011, 32, 2853–2864 CrossRef CAS PubMed.
- T. Yanai, D. P. Tew and N. C. Handy, Chem. Phys. Lett., 2004, 393, 51–57 CrossRef CAS PubMed.
- cc-pVDZ augmented with diffuse functions from the aug-cc-pVDZ basis set on heavy atoms.
- T. H. Dunning, J. Chem. Phys., 1989, 90, 1007–1023 CrossRef CAS PubMed.
- R. A. Kendall, T. H. Dunning Jr and R. J. Harrison, J. Chem. Phys., 1992, 96, 6796–6806 CrossRef CAS PubMed.
- S. Jakobsen, K. Kristensen and F. Jensen, J. Chem. Theory Comput., 2013, 9, 3978–3985 CrossRef CAS.
- M. J. Paterson, O. Christiansen, F. Pawłowski, P. Jørgensen, C. Hättig, T. Helgaker and P. Sałek, J. Chem. Phys., 2006, 124, 054322 CrossRef PubMed.
- D. H. Friese, C. Hättig and K. Ruud, Phys. Chem. Chem. Phys., 2012, 14, 1175–1184 RSC.
- C. A. Guido, S. Knecht, J. Kongsted and B. Mennucci, J. Chem. Theory Comput., 2013, 9, 2209–2220 CrossRef CAS.
- K. Sadeghian, M. Bocola and M. Schütz, J. Am. Chem. Soc., 2008, 130, 12501–12513 CrossRef CAS PubMed.
- K. Sneskov, T. Schwabe, J. Kongsted and O. Christiansen, J. Chem. Phys., 2011, 134, 104108 CrossRef PubMed.
- T. Schwabe, K. Sneskov, J. M. Olsen, J. Kongsted, O. Christiansen and C. Hättig, J. Chem. Theory Comput., 2012, 8, 3274–3283 CrossRef CAS.
- DALTON, a molecular electronic structure program, Release Dalton2011 (2011), see http://daltonprogram.org/.
- TURBOMOLE V6.4 2012, a development of University of Karlsruhe and Forschungszentrum Karlsruhe GmbH, 1989–2007, TURBOMOLE GmbH, since 2007; available from http://www.turbomole.com.
- B. Klaumünzer, D. Kröner and P. Saalfrank, J. Phys. Chem. B, 2010, 114, 10826–10834 CrossRef PubMed.
- S. Salzmann, V. Martinez-Junza, B. Zorn, S. E. Braslavsky, M. Mansurova, C. M. Marian and W. Gärtner, J. Phys. Chem. A, 2009, 113, 9365–9375 CrossRef CAS PubMed.
- C. Xu, W. Zipfel, J. B. Shear, R. M. Williams and W. W. Webb, Proc. Natl. Acad. Sci. U. S. A., 1996, 93, 10763–10768 CrossRef CAS.
- W. M. McClain, Acc. Chem. Res., 1974, 7, 129–135 CrossRef CAS.
- C. B. Nielsen, J. Arnbjerg, M. Johnsen, M. Jørgensen and P. R. Ogilby, J. Org. Chem., 2009, 74, 9094–9104 CrossRef CAS PubMed.
- E. Kamarchik and A. I. Krylov, J. Phys. Chem. Lett., 2011, 2, 488–492 CrossRef CAS.
- M. Drobizhev, N. S. Makarov, S. E. Tillo, T. E. Hughes and A. Rebane, J. Phys. Chem. B, 2012, 116, 1736–1744 CrossRef CAS PubMed.
- A. Losi, Photochem. Photobiol., 2007, 83, 1283–1300 CrossRef CAS PubMed.
- A. Möglich and K. Moffat, J. Mol. Biol., 2007, 373, 112–126 CrossRef PubMed.
- M. Nakasako, K. Zikihara, D. Matsuoka, H. Katsura and S. Tokutomi, J. Mol. Biol., 2008, 381, 718–733 CrossRef CAS PubMed.
- J. Hasegawa, S. Bureekaew and H. Nakatsuji, J. Photochem. Photobiol., A, 2007, 189, 205–210 CrossRef CAS PubMed.
- S. Salzmann, J. Tatchen and C. M. Marian, J. Photochem. Photobiol., A, 2008, 198, 221–231 CrossRef CAS PubMed.
- M. R. Silva-Junior, M. Schreiber, S. P. A. Sauer and W. Thiel, J. Chem. Phys., 2008, 129, 104103 CrossRef PubMed.
- M. Caricato, G. W. Trucks, M. J. Frisch and K. B. Wiberg, J. Chem. Theory Comput., 2010, 7, 456–466 CrossRef.
- N. H. List, J. M. Olsen, T. Rocha-Rinza, O. Christiansen and J. Kongsted, Int. J. Quantum Chem., 2012, 112, 789–800 CrossRef CAS.
- M. J. G. Peach, C. R. Le Sueur, K. Ruud, M. Guillaume and D. J. Tozer, Phys. Chem. Chem. Phys., 2009, 11, 4465–4470 RSC.
- S. S. Leang, F. Zahariev and M. S. Gordon, J. Chem. Phys., 2012, 136, 104101 CrossRef PubMed.
- T. Climent, R. González-Luque, M. Merchán and L. Serrano-Andrés, J. Phys. Chem. A, 2006, 110, 13584–13590 CrossRef CAS PubMed.
- E. Sikorska, I. V. Khmelinskii, W. Prukala, S. L. Williams, M. Patel, D. R. Worrall, J. L. Bourdelande, J. Koput and M. Sikorski, J. Phys. Chem. A, 2004, 108, 1501–1508 CrossRef CAS.
- A. Losi, E. Polverini, B. Quest and W. Gärtner, Biophys. J., 2002, 82, 2627–2634 CrossRef CAS.
- H. Suzuki, Electronic Absorption Spectra and Geometry of Organic Molecules: An Application of Molecular Orbital Theory, Elsevier, 1967 Search PubMed.
- A. D. Laurent, V. A. Mironov, P. P. Chapagain, A. V. Nemukhin and A. I. Krylov, J. Phys. Chem. B, 2012, 116, 12426–12440 CrossRef CAS PubMed.
- N. H. List, J. M. H. Olsen, H. J. A. Jensen, A. H. Steindal and J. Kongsted, J. Phys. Chem. Lett., 2012, 3, 3513–3521 CrossRef CAS.
Footnote |
| † Electronic supplementary information (ESI) available: Description of the protein preparation, force-field derivation and details about the PE calculations. Comparison of geometrical parameters of FMN in aqueous solution and inside miniSOG. See DOI: 10.1039/c3cp54470b |
| This journal is © the Owner Societies 2014 |

