Ultrasmall near-infrared gold nanoclusters for tumor fluorescence imaging in vivo
Xu
Wu
,
Xiaoxiao
He
*,
Kemin
Wang
*,
Can
Xie
,
Bing
Zhou
and
Zhihe
Qing
State Key Laboratory of Chemo/Biosensing and Chemometrics, College of Chemistry & Chemical Engineering, College of Biology, Hunan University. Key Laboratory for Bio-Nanotechnology and Molecule Engineering of Hunan Province, Changsha, 410082, China. E-mail: kmwang@hnu.cn; xiaoxiaohe@hnu.cn; Fax: + 86 731 88821566; Tel: + 86 731 88821566
First published on 8th September 2010
Abstract
In this paper, we explore the possibility of using ultrasmall near-infrared (NIR) gold nanoclusters (AuNCs) as novel contrast imaging agents for tumor fluorescence imaging in vivo. The fluorescence imaging signal of the tail vein administrated AuNCs in living organisms can spectrally be well distinguished from the background with maximum emission wavelength at about 710 nm, and the high photostability of AuNCs promises continuous imaging in vivo. The uptake of AuNCs by the reticuloendothelial system is relatively low in comparison with other nanoparticle-based contrast imaging agents due to their ultrasmall hydrodynamic size (∼2.7 nm). Through the body weight change analysis, the results show that the body weight of the mice administrated with AuNCs has not been changed obviously in comparison with that of the control mice injected with PBS. Furthermore, using MDA-MB-45 and Hela tumor xenograft models, in vivo and ex vivo imaging studies show that the ultrasmall NIR AuNCs are able to be highly accumulated in the tumor areas, thanks to the enhanced permeability and retention (EPR) effects. And the tumor-to-background ratio is about 15 for 6 h postinjection. The results indicate that the ultrasmall NIR AuNCs appear as very promising contrast imaging agents for in vivo fluorescence tumor imaging.
1. Introduction
Fluorescence imaging techniques, particularly near-infrared (NIR) fluorescence imaging, offering unique advantages over other imaging modalities in sensitivity, multiplex detection abilities and equipment cost, has received particular attention as an essential tool in the field of tumor research.1–4 Tumor in vivo fluorescence imaging relies greatly on stable, biocompatible, highly specific and sensitive imaging agents.5–8 However, current imaging methodologies utilizing NIR fluorescent organic dyes remain problematic. Conventional fluorophores suffer from rapid photobleaching, which are not fit for long-term molecular imaging,9,10 and are restricted in sensitive detection because of the limited number of fluorophores conjugated per ligand.9 Furthermore, the in vivo toxicities of the majority of fluorophores are unknown.Recently, advances in nanotechnology have produced significant contributions by means of NIR fluorescent nanomaterial-based contrast agents.5,11–13The NIR fluorescent nanomaterials, such as NIR dye-containing nanoparticles,5 NIR quantum dots (NIR QDs),14 NIR fluorescent single-walled carbon nanotubes15 and upconversion fluorescent nanoparticles,12 demonstrate superior brightness to organic dyes and show excellent photostability. Among the studied NIR fluorescent nanomaterial-based contrast agents, NIR QDs are the fastest growing imaging agents and have been successfully used for cancer molecular imaging in small animal models of human cancer.7,8 However, much more work needs to be done to combat NIR QDs's inherent toxicity, as they contain cadmium or other heavy metals, before translation into clinical use.16 In addition, the hydrodynamic diameter of the NIR QDs should be investigated because the NIR QDs must avoid the reticuloendothelial system (RES) before targeting to the tumor through the “enhanced permeability and retention” effect (EPR effect).17,18 NIR QD-based contrast agents with large size (> 20 nm in diameter) suffer from extremely high RES uptake, which reduce their efficiency and sensitivity.19 Therefore, there is still a great demand for biocompatible, ultrasmall NIR fluorescent nanomaterial-based contrast agents.
Noble metal nanoclusters (NCs) (e.g., Au, Ag) typically possess sizes below 2 nm and are highly attractive for biomedical applications due to their low toxicity, bright vis–NIR fluorescence as well as their ultrasmall size in comparison with QDs.20–22 Recently, the increasing use of metal-containing compounds in detection and cell imaging has made the advance of metal NCs as an alternative building block of fluorescence contrast agents probes possible by using their fluorescence properties.20,21 Among the several reported metal NCs, the Au25 NCs (∼0.8 nm, QE ≈ 6%) prepared through a “green” synthetic route using bovine serum albumin (BSA) as a template at the physiological temperature would be much more promising for biomedical applications.23,24 Retnakumari et al. have successfully used the AuNCs for the oral carcinoma cells imaging through folate receptor targeting. The folate acid conjugated AuNCs demonstrated no toxicity to the cells and specifically targeted to the oral squamous cell carcinoma (KB).24 However, to the best of our knowledge, there are no studies about tumor fluorescence imaging in vivo using the metal NCs.
In this article, we show the possibility of using ultrasmall NIR AuNCs for tumor fluorescence imaging in vivo. The fluorescence characteristics of the AuNCs in living mice have been first investigated. Then, the body weight of the mice injected with the AuNCs has been tested by comparing with that of the control mice injected with PBS. Furthermore, by selecting MDA-MB-45 and Hela tumor xenograft models, passive tumor targeting of ultrasmall NIR AuNCs has been demonstrated in tumor-bearing mice. The results indicate that the ultrasmall NIR AuNCs are not only feasible as a biocompatible fluorescent contrast agent in vivo, but also well-targeted to the MDA-MB-45 and Hela tumors in mice due to the EPR effect.
2. Experimental section
2.1 Materials
BSA was obtained from Sigma–Aldrich. Cy3 was bought from Amersham. The HAuCl4 and other chemicals were purchased from the Reagent & Glass Apparatus Corporation of Changsha and used as-received. Ultrapure Millipore water (18.2 MΩ) was used.2.2 Preparation of the AuNCs
The synthesis of the AuNCs is similar to a previous publication.23 In a typical experiment, aqueous HAuCl4 solution (5 mL, 10 mM, 37 °C) was added to BSA solution (5 mL, 50 mg mL−1, 37 °C) under vigorous stirring. NaOH solution (0.5 mL, 1 M) was introduced 2 min later, and the reaction was allowed to proceed under vigorous stirring at 37 °C for 12 h. Then, the AuNCs were desiccated in the freeze drier and stored for the following experiments.2.3 Hydrodynamic size of the AuNCs
The hydrodynamic size and size distribution of the AuNCs were measured using dynamic light scattering (DLS) with the Zetasizer to determine the presence of aggregates.2.4 Fluorescence and photostability test of AuNCs
The fluorescence of the AuNCs was tested by a Maestro in vivo imaging system (CRI, Inc., excitation: 465–495 nm, emission: 580–780 nm). The photostability was tested as follows: the AuNCs were irradiated with a Mercury Lamp for 10 min, and the fluorescent images were acquired every minute. Then, Imaging J was used to quantify the intensity of the fluorescence. The other materials such as QDs, Cy3 and Rhodamine were treated in the same condition. Finally, all the data was recorded as the photostability versus the irradiation time.2.5 Animal model
The adult athymic BALB/c (BALB/c-nu) mice were obtained from Shanghai SLAC Laboratory Animal Co., Ltd. (BALB/c). All animal operations were in accord with institutional animal use and care regulations, according to protocol No. SYXK (Xiang) 2008-0001, approved by Laboratory Animal Center of Hunan. The tumor model was established by subcutaneous injection of MDA-MB-45 and Hela tumor cells (∼5 × 10⁶ in 50 μL of PBS) into the front flank of female athymic nude mice.2.6 Weight changes analysis
For the in vivo toxicity studies, three mice were chosen to test the changes of the weight for 4 weeks after injection with AuNCs. And the weight was recorded every week. The control mice were injected with same amount of PBS, the record was acquired as well as the mice injected with AuNCs.2.7 In vivo and ex vivo fluorescence imaging
We performed in vivo and ex vivo fluorescence imaging experiments using a Maestro in vivo imaging system. For subcutaneously and intramuscularly AuNCs injected mice, the in vivo imaging was performed immediately after injection. Whole body images of AuNCs intravenously injected normal mice or those bearing subcutaneous MDA-MB-45 and Hela tumor mice were acquired and analyzed at many time points postinjection (pi). For ex vivo imaging, after the major organs or tumors were harvested, the tissues were subjected to fluorescence imaging using Maestro in vivo imaging system immediately. The ROI (regions of interest) analysis was measured under the assistance of Maestro Image software.3. Results and discussion
The ultrasmall NIR AuNCs were firstly prepared using BSA scaffold method as reported by Ying et al.23 The hydrodynamic size of the prepared AuNCs was about 2.7 nm (Fig. 1A), which was small enough that the AuNCs would be effectively excreted from the body. When imaging using Maestro in vivo optical imaging system, the deep brown solution of AuNCs emitted an intense red fluorescence (right inset, No. 4, Fig. 1B). In contrast, there was no red fluorescence signal for the control BSA, HAuCl4 and mixture of BSA and HAuCl4 (right inset, No. 1, 2 and 3, Fig. 1B). In addition, the AuNCs exhibited high photostability as quantum dots (Fig. 1C).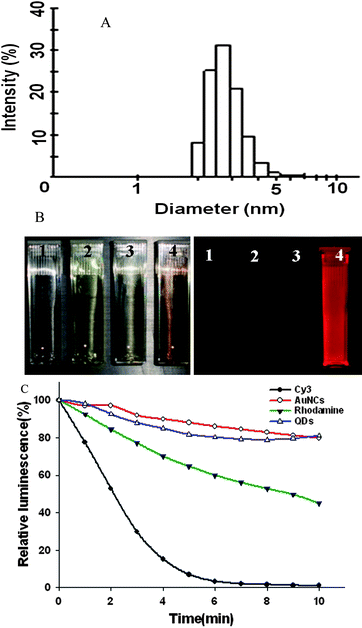 | ||
| Fig. 1 (A) Hydrodynamic size and size distribution of the AuNCs. (B) Photographs of BSA solution (1), HAuCl4 solution (2), mixture of BSA and HAuCl4 solution (3) and AuNCs solution (4) under visible (top) and 465–495 nm excitation (bottom) obtained with in vivo optical imaging system (excitation, 465–495 nm; emission, 580–780 nm). (C) Photostability of the AuNCs by compared with Cy3, Rhodamine and QDs, respectively. | ||
To demonstrate the effectiveness of the AuNCs for in vivo imaging in animals, we first demonstrated that the light level produced by the AuNCs was sufficient to yield a localizable signal under a few millimetres of tissues with a subcutaneous injection. Anaesthetized athymic BALB/c nude mice were first injected subcutaneously with suspensions (100 μl) of AuNCs at different concentrations (2.35 mg ml−1, 0.235 mg ml−1) in two localizations on the back. Before the fluorescence imaging of AuNCs in mice using the Maestro in vivo optical imaging system, the pure autofluorescence spectra and AuNCs spectra were manually selected from the spectral image of the mice subcutaneously injected with the AuNCs. The results demonstrated that the fluorescent AuNCs showed emission peaks at 710 nm and could be easily separated from autofluorescence (Fig. 2). Spectral unmixing using the pure autofluorescence and AuNCs spectra yielded a superimposed image, unmixed autofluorescence image and unmixed AuNCs fluorescence image. Then, we analyzed fluorescence intensity of the unmixed AuNCs image using the software. As shown in Fig. 3A, the fluorescence images of the subcutaneously injected mice exhibited bright emissions from the location with the higher dose AuNCs (2.35 mg ml−1) injection and also produced a detectable signal with the lower dose AuNCs (0.235 mg ml−1) administration. We then injected the AuNCs into the muscle to demonstrate whether the AuNCs with NIR fluorescence could offer improved tissue penetration depth. Upon intramuscular injection into the left quarter up to a few millimetres (2.35 mg ml−1, 100 μl), the bright fluorescence of AuNCs was obviously visualized (Fig. 3B).
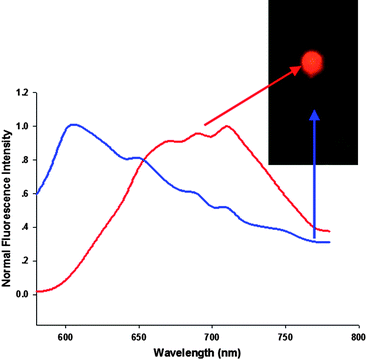 | ||
| Fig. 2 NIR fluorescence imaging of BALB/c mouse treated with the AuNCs. The background autofluorescence (from the mouse) is colored blue and NIR AuNCs signal is pseudocolored red. | ||
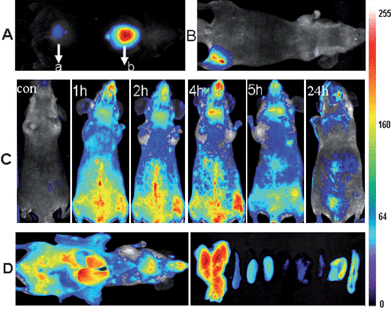 | ||
| Fig. 3 In vivo fluorescence image of 100 μl AuNCs injected subcutaneously (a – 0.235 mg ml−1, b – 2.35 mg ml−1) (A) and intramuscularly (2.35 mg ml−1) into the mice (B). (C) Real-time in vivo abdomen imaging of intravenously injected with 200 μl of AuNCs (2.35 mg ml−1) at different time points, post injection. (D) Ex vivo optical imaging of anatomized mice with injection of 200 μl of AuNCs (2.35 mg ml−1) and some dissected organs during necropsy at 5 h pi. The organs are liver, spleen, left kidney, right kidney, heart, lung, muscle, skin and intestine from left to right. | ||
Furthermore, AuNCs solution (2.35 mg ml−1, 200 μL) was intravenously injected into athymic BALB/c nude mice for whole body real-time in vivo imaging. The body abdomen images of the AuNCs intravenously injected mice were acquired and analyzed at many time points postinjection (up to 24 h), and the resulting images are shown in Fig. 3C. The BALB/c nude mice without injection of AuNCs were selected as the control. Immediately after tail vein injection, fluorescence emitted from the AuNCs injected mice was easily visualized in the superficial vasculature of the whole body. As blood circulated, the fluorescence emitted from the superficial vasculature of the whole body decreased gradually. It was very exciting to find that the AuNCs could persist in the vessels for a longer circulation times than other PEGylated nanomaterials.25,26 As indicated by the fluorescence signal, images showed that AuNCs remained visible in the circulation, even at 5 h postinjection. The longer circulation time was desired in the case of the targeted studies, to allow efficient binding of the nanomaterials based contrast agents to the specific receptors.27 By 24 h postinjection, the fluorescence emitted from AuNCs over the whole body decreased noticeably except for in the liver and bladder. The results suggested that the intravenously injected AuNCs could be gradually cleared from the body through urinary clearance system, an excretion pathway that had been widely reported in the literature17 for very small particles like the ones used here. Ex vivo organ optical imaging analyses had been performed by harvesting organs at 5 h post intravenous injection (Fig. 3D). The dissected liver, spleen, left kidney, right kidney, heart, lung, muscle, skin and intestine all exhibited fluorescence from the AuNCs. The results demonstrated that major sites of fluorescence seen by ex vivo optical imaging were almost consistent with those seen by in vivo imaging. The kidney exhibited strong fluorescence from the AuNCs, consistent with the urine excretion pathway.
We also performed regions of interest (ROI) analysis on the ex vivo fluorescence images to semiquantitatively study the uptake ratio of AuNCs in each organ using the Maestro software. The average fluorescence signal per square centimetre of the liver, spleen, kidney, heart, lung, muscle, skin and intestine were firstly analyzed and summed together. Then the percentage of the average fluorescence signal per square centimetre of each organ was obtained as the ratio of the average fluorescence intensity of each organ to the summed fluorescence intensity. As shown in Fig. 4, after about 5 h postinjection of the AuNCs, the percentage of the average fluorescence signal per square centimetre of the liver, spleen, kidney, heart, lung, muscle, skin and intestine were 29% ± 3.7, 13% ± 4.4, 18% ± 4.0, 6% ± 3.7, 5% ± 3.5, 4% ± 0.7, 13% ± 4.5 and 11% ± 6.7, respectively. By comparison with the other nanomaterials, the uptake of the AuNCs by the RES system was reduced significantly, as shown in Table 1. The hydrodynamic size of the nanomaterials was an important factor to determine the uptake of the nanomaterials by the RES system such as liver and spleen. The ratio of the nanomaterials in the liver and spleen decreased with the reduction of hydrodynamic size of the nanomaterials.28,29 The ultrasmall hydrodynamic size of the NIR AuNCs effectively avoided suffering from the extremely high RES uptake.
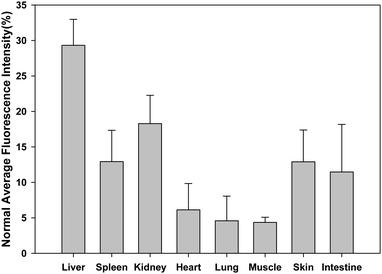 | ||
| Fig. 4 Average fluorescent intensity analysis of major organs in ex vivo fluorescence imaging after 5 h postinjection of AuNCs. | ||
Simultaneously, the toxicity of the NIR fluorescent nanoprobes were investigated in parallel with their imaging potential. We investigated the body weight change in AuNCs injected mice by comparing with that of control mice injected with PBS. Over a period of 4 weeks, the body weight of the mice injected with AuNCs changed slightly in a pattern similar to the control mice (Fig. 5). The mice lived normally without exhibition of any sign of acute toxicological responses and long toxic effects. The results primarily indicated the non-toxic nature of the AuNCs to the mice.
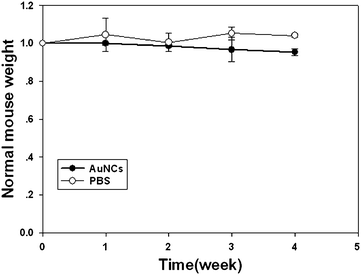 | ||
| Fig. 5 Change in body mass of mice injected with AuNCs (200 μl, 2.35 mg ml−1) compared with that of mice injected with 200 μl PBS control. (n = 3). | ||
Because of the above demonstrated in vivo fluorescence imaging abilities and longer circulation time of the ultrasmall NIR AuNCs, we believed that the ultrasmall NIR AuNCs could be used as promising fluorescent agents for tumor fluorescence imaging in vivo by EPR effect. We chose two tumor models, MDA-MB-45 and Hela, as examples to test whether the ultrasmall NIR AuNCs could be passively accumulated in the tumors. After the intravenous injection of the ultrasmall NIR AuNCs (200 μl, 2.35 mg ml−1) into the nude mice bearing subcutaneous MDA-MB-45 (tumor size: ∼6 mm in diameter) and Hela tumor (tumor size: ∼10 mm in diameter), fluorescence images were acquired at multiple time points postinjection using the in vivo imaging system. As shown in Fig. 6A and Fig. 7A, the fluorescence signal derived from the ultrasmall NIR AuNCs both appeared in the MDA-MB-45 tumor and Hela tumor (arrows) 1 h after injection, while the signal of other parts was low. The tumors were very distinguishable from other tissues with good fluorescence contrast, indicating high tumor uptake of ultrasmall NIR AuNCs. The tumor fluorescence intensity in the tumor areas increased over the time, and the fluorescence intensity of the other parts decreased. As shown in Fig. 6B and Fig. 7B, we imaged the tumor and around muscle, the results indicated that the high contrast between them and the tumor-to-background ratio was about 15 for 6 h. The high tumor-to-background ratio was due to two reasons. The first reason was that the fluorescence of the AuNCs was in the near-infrared so that the autofluorescence of the mice was low. The second reason was the ultrasmall hydrodynamic size of the AuNCs contributed to the avoidance the uptake by the RES and then targeting to the tumor through EPR effect efficiently. The ex vivo imaging verified the accumulation of the ultrasmall NIR AuNCs in tumors, which consisted with the results of in vivo imaging.
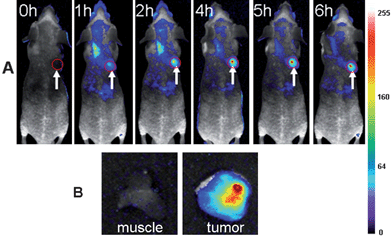 | ||
| Fig. 6 (A) Fluorescence images of mice bearing an MDA-MB-45 tumor. Strong signal from AuNCs was observed in the tumor (marked by the red circle), demonstrating significant passive accumulation in the tumor by the EPR effect. The arrowheads indicated the tumor. (B) Ex vivo fluorescence image of the tumor tissue and the muscle tissue around the tumor from the mice used in A. | ||
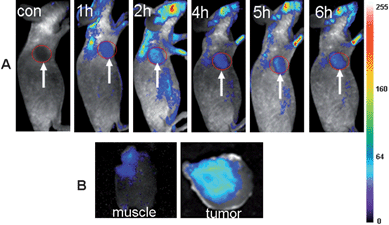 | ||
| Fig. 7 (A) Fluorescence images of a mice bearing a Hela tumor. Strong signal from AuNCs was observed in the tumor (marked by the red circle). The arrowheads indicate the tumor. (B) Ex vivo fluorescence images of the tumor tissue and the muscle tissue around the tumor from the mice used in A. | ||
The two different tumor models tests indicated that the ultrasmall NIR AuNCs could be accumulated into the tumor sites because of the EPR effect but not for the specific binding between the tumor cell receptors and the AuNCs. Therefore, the ultrasmall NIR AuNCs could be widely used as fluorescent agents for most of tumor fluorescence imaging in vivo.
4. Conclusion
In conclusion, this study represents the first example of the tumor NIR fluorescence imaging in vivo with the ultrasmall AuNCs which exhibits brightly NIR fluorescence, high photostability and contains no toxic elements. The ultrasmall NIR AuNCs demonstrated high contrast images and could be easily distinguished from the background. The uptake by the RES system in vivo was much less than other nanomaterial due to the ultrasmall hydrodynamic size. The body weights of mice injected with AuNCs had only changed slightly after four weeks, which indicated that the ultrasmall NIR AuNCs had no potential toxicity to the body. Furthermore, the in vivo tumor targeting studies showed high tumor uptake of the ultrasmall NIR AuNCs (e.g., MDA-MB-45 and Hela) with excellent contrast from the surrounding tissues because of EPR effect of the ultrasmall sized nanoclusters. We believe that the biocompatible, ultrasmall, NIR AuNCs are promising fluorescent candidates for optical imaging in vivo and related biomedical application.Acknowledgements
This work was partially supported by Program for Innovative Research Team of Hunan National Science Foundation (10JJ7002), International Science & Technology Cooperation Program of China (2010DFB30300), Program for New Century Excellent Talents in University (NCET-06-0697) and National Science Foundation of P.R.China (90606003, 20775021).References
- J. H. Rao, A. D. Andrasi and H. Q. Rao, Curr. Opin. Biotechnol., 2007, 18, 17–25 CrossRef CAS.
- S. A. Hilderbrand and R. Weissleder, Curr. Opin. Chem. Biol., 2010, 14, 71–79 CrossRef CAS.
- H. S. Zeng, A. Weiss, R. Cline and C. E. MacAulayy, Bioimaging, 1998, 6, 151–165 CrossRef.
- Z. Cheng, Y. Wu, Z. M. Xiong, S. S. Gambhir and X. Y. Chen, Bioconjugate Chem., 2005, 16, 1433–1441 CrossRef CAS.
- E. I. Altınoğlu, T. J. Russin, J. M. Kaiser, B. M. Barth and P. C. Eklund, ACS Nano, 2008, 2, 2075–2084 CrossRef CAS.
- J. Chen, I. R. Corbin, H. Li, W. G. Cao and J. D. Glickson, J. Am. Chem. Soc., 2007, 129, 5798–5799 CrossRef CAS.
- W. B. Cai and X. Y. Chen, Nat. Protoc., 2008, 3, 89–96 Search PubMed.
- X. Michalet, F. F. Pinaud, L. A. Bentolila, J. M. Tsay and S. Doose, Science, 2005, 307, 539–544.
- J. V. Frangioni, Curr. Opin. Chem. Biol., 2003, 7, 626–634 CrossRef.
- Y. Xing and J. H. Rao, Cancer Biomarkers, 2008, 4, 307–319 Search PubMed.
- W. B. Cai, D. W. Shin, K. Chen, O. Gheysens, Q. Z. Cao, S. X. Wang, S. S. Gambhir and X. Y. Chen, Nano Lett., 2006, 6, 669–676 CrossRef CAS.
- L. Q. Xiong, Z. G. Chen, Q. W. Tian, T. Y. Cao, C. J. Xu and F. Y. Li, Anal. Chem., 2009, 81, 8687–8694 CrossRef CAS.
- R. Weissleder, C. H. Tung, U. Mahmood and A. B. Jr, Nat. Biotechnol., 1999, 17, 375–378 CrossRef CAS.
- J. H. Gao, K. Chen, R. G. Xie, J. Xie, S. Lee, Z. Cheng, X. G. Peng and X. Y. Chen, Small, 2010, 6, 256–261 CrossRef CAS.
- K. Welsher, Z. Liu, D. Daranciang and H. J. Dai, Nano Lett., 2008, 8, 586–590 CrossRef CAS.
- Y. Zheng, S. Gao and J. Y. Ying, Adv. Mater., 2007, 19, 376–380 CrossRef CAS.
- H. S. Choi, W. H. Liu, P. Misra, E. Tanaka, J. P. Zimmer, B. I. Ipe, M. G. Bawendi and J. V. Frangioni, Nat. Biotechnol., 2007, 25, 1165–1170 CrossRef CAS.
- R. Duncan, Nat. Rev. Drug Discovery, 2003, 2, 347–360 CrossRef CAS.
- M. L. Schipper, G. Iyer, A. L. Koh, Z. Cheng, Y. Ebenstein, A. Aharoni, S. Keren, L. A. Bentolila, J. Q. Li, J. H. Rao, X. Y. Chen, U. Banin, A. M. Wu, R. Sinclair, S. Weiss and S. S. Gambhir, Small, 2009, 5, 126–134 CrossRef CAS.
- C. A. J. Lin, T. Y. Yang, C. H. Lee, S. H. Huang, R. A. Sperling, M. Zanella, J. K. Li, J. L. Shen, H. H. Wang, H. I. Yeh, W. J. Parak and W. H. Chang, ACS Nano, 2009, 3, 395–401 CrossRef CAS.
- J. Yu, S. Choi, C. I. Richards, Y. Antoku and R. M. Dickson, Photochem. Photobiol., 2008, 84, 1435–1439 CrossRef CAS.
- C. C. Huang, Z. Yang, K. H. Lee and H. T. Chang, Angew. Chem., Int. Ed., 2007, 46, 6824–6828 CrossRef CAS.
- J. P. Xie, Y. G. Zheng and J. Y. Ying, J. Am. Chem. Soc., 2009, 131, 888–889 CrossRef CAS.
- A. Retnakumari, S. Setua, D. Menon, P. Ravindran, H. Muhammed, T. Pradeep, S. Nair and M. Koyakutty, Nanotechnology, 2010, 21, 055103 CrossRef.
- G. Prencipe, S. M. Tabakman, K. Welsher, Z. Liu, A. P. Goodwin, L. Zhang, J. Henry and H. J. Dai, J. Am. Chem. Soc., 2009, 131, 4783–4787 CrossRef CAS.
- X. X. He, H. L. Nie, K. M. Wang, W. H. Tan, X. Wu and P. F. Zhang, Anal. Chem., 2008, 80, 9597–9603 CrossRef CAS.
- Z. Liu, W. B. Cai, L. He, N. Nakayama, K. Chen, X. M. Shun, X. Y. Chen and H. J. Dai, Nat. Nanotechnol., 2007, 2, 47–52 CrossRef CAS.
- L. Yang, H. Mao, Y. A. Wang, Z. H. Cao, X. H. Peng, X. X. Wang, H. W. Duan, C. C. Ni, Q. G. Yuan, G. Adams, M. Q. Smith, W. C. Wood, X. H. Gao and S. M. Nie, Small, 2009, 5, 235–243 CrossRef.
- J. H. Park, L. Gu, G. von Maltzahn, E. Ruoslahti, S. N. Bhatia and M. J. Sailor, Nat. Mater., 2009, 8, 331–336 CrossRef CAS.
| This journal is © The Royal Society of Chemistry 2010 |
