Flow-directed assembly of nanostructured thin films from suspensions of anisotropic titania particles
Manish
Mittal
,
Ryan K.
Niles†
and
Eric M.
Furst
*
Department of Chemical Engineering and Center for Molecular and Engineering Thermodynamics, University of Delaware, 150 Academy Street, Newark, Delaware 19716, U.S.A. E-mail: furst@udel.edu; Fax: +1 302 831 1048; Tel: +1 302 831 0102
First published on 12th August 2010
Abstract
Nanostructured thin films are fabricated by directing the assembly of anisotropic titanium dioxide particles from a colloidal suspension by fixed blade flow coating. The titania particles (equatorial radius a = 24 ± 4 nm, polar radius b = 130 ± 31 nm, aspect ratio b/a = 5.4 ± 0.9) undergo an isotropic–nematic (I–N) transition at a volume fraction ϕ* ≈ 0.40. For ϕ > ϕ* the deposited film has three structures depending on the substrate velocity, v. At a blade angle α = 25° and a gap d = 200 μm, nanoparticles orient either isotropically in the direction of the coating flow (v ≥ 350 μm s−1), exhibit partially oriented “wavy” structures (100 < v < 300 μm s−1), or are isotropically oriented (v < 100 μm s−1). Below the I–N transition (ϕ < ϕ*), nanoparticles assemble into domains of uniform orientation with dimensions that increase with increasing v. Increasing the blade angle shifts these structural transitions to lower substrate velocities, consistent with an increasing extensional component of the flow. Established scaling relationships describe the film height dependence on ϕ and v. Overall, these results enable nanostructured films to be deposited with desired thickness and structure.
1 Introduction
Thin films deposited on substrates are crucial to many applications, including anti-reflective coatings,1 photonic crystals,2,3 catalysts,4 microelectronics,5,6 and photovoltaics.7,8 Depending on the material and desired dimensions, films are deposited using a variety of methods, such as sol–gel coating, chemical vapor deposition, thermal evaporation, or deposition from solution (spin coating, dip coating, and layer-by-layer assembly). Factors that influence the properties and the performance of such films are the material, structure, film thickness, and roughness. Recently, convective deposition has emerged as a rapid and a controllable way to deposit films of colloidal particles over a large area,9–11 by taking advantage of the “coffee ring effect”.12 Particle deposition occurs due to the evaporation of solvent from a pinned contact line which leads to advection of particles towards it. Deposition of nanoparticles from solution is a rapid simple and scalable method for creating nano- and micro-porous materials with high surface-to-volume ratio with or without translational order.13,14While many studies of bottom-up assembly from colloidal suspensions have focused on spherical colloids, making use of monodisperse and chemical homogeneous particles that can pack into highly ordered crystals, anisotropic particles are now recognized as versatile building blocks for creating more complex structures.15,16 Many experimental studies have demonstrated that anisotropic particles have the potential to form structures that cannot be assembled from spheres.17–21 However, the additional requirement of controlling the particle orientation makes the assembly of anisotropic particles more challenging.22
Here, we report the directed assembly of ellipsoidal titanium dioxide nanoparticles into thin films by flow coating23 over an area with dimensions of centimeters. Due to its electronic, optical and photocatalytic properties, titanium dioxide is an important component in many nanostructured materials and devices.24 The colloidal suspension is confined in a small gap between a substrate and a blade making an angle with the substrate. A thin layer of particles is deposited when the colloidal suspension confined by capillarity escapes from the gap due to frictional drag. By varying the volume fraction, blade angle and the substrate velocity, we demonstrate control of the nanoparticle film morphology. At high volume fractions, particles orient in the flow direction and at low volume fractions particles orient isotropically, leading to ordered or disordered films. Furthermore, varying the substrate velocity enables us to control the thickness of the film, from a monolayer of particles to a film micrometers thick. Finally, the effect of substrate velocity and volume fraction on film thickness is explained using scaling relationships. This represents a unique approach to forming nanostructured materials, including the ability to control the film structure, particle orientation and thickness during the coating process.
2 Experimental
2.1 Particle synthesis and characterization
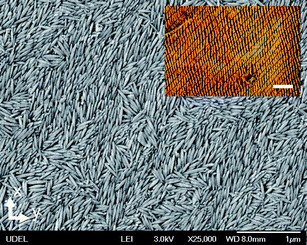
Titania particles are synthesized using a gel-sol method described by Sugimoto et al.25,26 The major axis diameter is 2b = 260 ± 62nm and the minor axis diameter is 2a = 48 ± 8nm, as determined from TEM images. The particle aspect ratio is 5.35 ± 0.88. Fig. 1a shows a scanning electron microscopy (SEM) image of the particles. From powder X-ray diffraction, the particles are confirmed to be composed of a crystalline phase of anatase.27 The colloidal suspension used in the experiments reported here consists of particles suspended in ultra-pure water (resistivity ≥ 18.2MΩ·cm). The density of particles is calculated by measuring the density of the colloidal suspension, with particle mass fraction between 0.1% and 4%, using a density meter (Anton Paar DMA60). The particle density is 2.74 ± 0.10 g cm−3, which is less than the density of anatase titanium dioxide (3.89 g cm−3). This density difference is attributed to either a porous particle structure or an encapsulation of low density domains in the particles during synthesis. Prior to an experiment, the mass fraction of the colloidal suspension, diluted to approximately 2 wt%, is calculated by measuring the density of the suspension. The density of the particles is then used to calculate the volume fraction of particles in the suspension.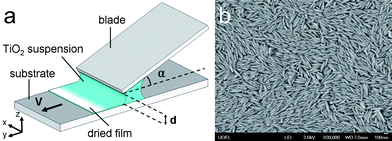 | ||
| Fig. 1 (a) Schematic of the experimental procedure used for assembling titania particles by flow coating. The suspension is confined between glass slides used as a blade and a substrate. The blade makes an angle α with the substrate and is separated by a gap of d. When the substrate is translated at a velocity v, liquid is pulled from the gap and dries to form a film of titanium dioxide particles. (b) A scanning electron microscopy (SEM) image of the titanium dioxide particles. The major axis is 2b = 260 ± 62nm and the minor axis 2a = 48 ± 8nm with an aspect ratio of 5.35 ± 0.88. | ||
2.2 Flow coating
A schematic of the flow coating process is shown in Fig. 1a. A 10 μL volume of the colloidal suspension is confined between clean glass slides used as a deposition blade and a substrate. Prior to each experiment, the glass slide was cleaned with a Nochromix solution (Cat. no. 19-010, Godax Laboratories), washed thoroughly with deionized water and then plasma cleaned (Model PDC-32G, Harrick Plasma). After cleaning, the water-glass contact angle was visually determined to be small enough that a drop of water spreads on the surface. A clean substrate ensures that as the substrate moves the contact line recedes at a uniform velocity without pinning and dewetting. The substrate is placed on a computer controlled motorized stage (ASI MS-2000 XY stage), which is moved at a fixed velocity v along the y-axis. The angle α and the gap spacing d between the blade and the substrate was adjusted using micrometers.2.3 Film characterization
Films are imaged under an optical microscope between crossed polarizers (Zeiss Axiovert 200). The film nanostructure is characterized using scanning electron microscopy (SEM, JSM-7400F field emission scanning electron microscope, JEOL). Finally, the film thickness is measured by scratching the surface of the film and measuring the scratch depth profile using atomic force microscopy in tapping mode (NanoScope V, Veeco).3 Results and discussion
3.1 Deposited film structure
First we investigate the effect of substrate velocity and particle volume fraction on the structure of the deposited film. The films of titania particles are deposited at substrate velocities, v using particle suspensions of varying volume fraction, ϕ. The particle volume fraction is varied 0.18 ≤ ϕ ≤ 0.52. This range of concentration spans the expected isotropic-nematic (I–N) transition for ellipsoids, which for an aspect ratio b/a ≈ 5, occurs approximately at a volume fraction of ϕ* ≈ 0.40.28 We verify this transition with polarized light microscopy (data not shown). The films are deposited at a blade angle α = 25° and a gap thickness between the blade and the substrate d = 200 μm. SEM and crossed polarizer images of the deposited films are shown in Fig. 2 and 3, respectively. In all of the images the substrate translates along the y-axis.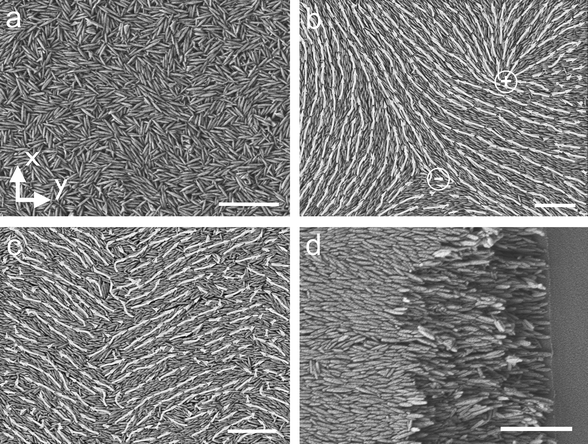 | ||
| Fig. 2 The substrate moves along the y-axis and the scalebar is 1 μm for all the images. (a) SEM image of a film deposited at velocity v = 100 μm s−1 and volume fraction ϕ = 0.25 shows that the particles are all randomly oriented. (b) SEM image of a film deposited at velocity v = 1500 μm s−1 and volume fraction ϕ = 0.25 shows that the particles form domains spanning a few micrometers. Arrows indicate the direction of local particle orientation. The symbols + and – mark the locations of + 1/2 and − 1/2 disinclination defects. (c) SEM image of a film deposited at velocity v = 100 μm s−1 and volume fraction ϕ = 0.52 shows that the particles form a wavy structure in the coating direction. (d) SEM image of a film deposited at velocity v = 1500 μm s−1 and volume fraction ϕ = 0.52 shows that the particles are aligned with flow direction. The substrate is snapped to show that the alignment is preserved over the entire cross section of the film. | ||
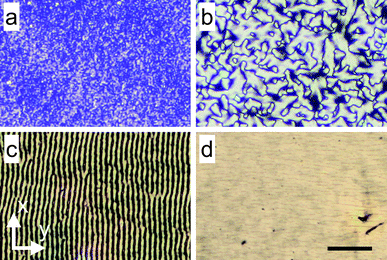 | ||
| Fig. 3 The substrate moves along the y-axis and the scalebar is 40 μm for all the images. All images are taken with the film under crossed polarizers. (a) Film deposited at velocity v = 250 μm s−1 and volume fraction ϕ = 0.18 shows that there are small domains present (SEM - Fig. 2a). (b) Image of film deposited at velocity v = 1000 μm s−1 and volume fraction ϕ = 0.25 shows that large domains spanning a few μm are formed (SEM - Fig. 2b). (c) Film deposited at velocity v = 100 μm s−1 and volume fraction ϕ = 0.52 shows a striped pattern corresponding to a wavy structure (SEM - Fig. 2c). (d) Film deposited at velocity v = 1500 μm s−1 and volume fraction ϕ = 0.52 (SEM - Fig. 2d). | ||
The difference between the isotropic and domain-like structure is also apparent in polarized light bright field microscopy (Fig. 3). Fig. 3a is the corresponding image of film deposited at the low substrate velocity, v = 100 μm s−1, and Fig. 3b is an image of film deposited at a higher substrate velocity, v = 1500 μm s−1. The dark lines in Fig. 3b appear when the particles are oriented either parallel or perpendicular to the fast axis of the polarizer. This is verified by changing the angle of the polarizers with the y-axis, while keeping them crossed at 90°. The “domains” enclosed by dark lines varied on rotating the polarizers and the images are identical when the polarizers make an angle of 0° and 90° with y-axis. Comparing the images of films deposited at different velocities, there is significant difference between a domain's dimensions for films deposited at different velocities. A further analysis of the variation of domain size with substrate velocity follows. However, it is interesting to note that separate domains of particle orientation are associated with wedge disinclination defects commonly observed in nematic liquid crystals. The SEM image of Fig. 2b shows two disinclination defects, a + 1/2 disinclination shown in the upper half of the image and a − 1/2 disinclination shown in the lower half.
The optical patterns of films deposited from low volume fraction suspensions (Fig. 3b) is similar to the Schlieren texture observed for nematic liquid crystals.29 The texture in liquid crystals is formed when there is a sharp change in molecular orientation about a point or a line, similar to changes in the particle orientation discussed above. The dark lines (lines of extinction) appear when the particles are aligned with one of the two polarizers in the microscope. The domain size is correlated with the length scale over which the particle orientation persists. In order to estimate the domain size for ϕ < ϕ*, crossed polarizer images like those shown in Fig. 3b are converted to binary images by thresholding. The average area of each domain is then calculated. For each velocity, five images (690μm × 450μm) are averaged to calculate the average domain size.
Fig. 4 shows the average domain size as a function of coating velocity at different particle volume fractions. In each image the number of domains in the observation area ranges from N ≈ 5 × 10³ – 5 × 10⁴ depending on the volume fraction and substrate velocity. At a volume fraction ϕ = 0.18 and substrate velocity v = 125 μm s−1, the number of domains is more than N = 4 × 10⁴ with an average domain dimension of l = 1 μm. As the velocity increases to v = 1500 μm s−1 the number of domains decreases to N = 8 × 10³ and the domains size increases to 4.7 μm. The standard deviation of the domain size also decreases from 8 μm to 3 μm with increasing v. As expected, these results demonstrate that as the velocity increases, the domains become larger and more uniform. The variation of size with velocity is determined to be statistically significant based on a t-test for data with unequal variance and size. A similar trend for these statistics is also observed for volume fractions ϕ = 0.25 and ϕ = 0.32. Later, we show that the thickness of films containing domains is less than 500 nm, which is smaller than the domain size; thus, the domain microstructure is not necessarily three-dimensional, but a quasi-2D structure.
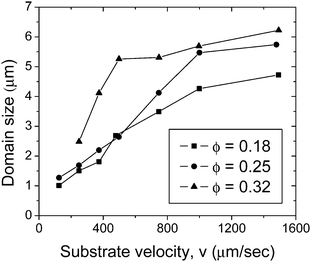 | ||
| Fig. 4 Average domain size as a function of substrate velocity for several particle volume fractions. The films are deposited using a blade angle α = 25° and gap d = 200 μm. | ||
 | ||
| Fig. 5 SEM image of a film deposited at the substrate velocity v = 25 μm s−1 using a suspension with volume fraction ϕ = 0.52. The scalebar is 1 μm. The inset shows the microscopy image of the film between crossed polarizers. The scalebar is 50 μm. | ||
The structural transition for ϕ > ϕ* can also be observed with light microscopy under crossed polarizers. The wavy structure corresponds to a striped pattern (Fig. 3c), which disappears when the particles are uniformly aligned (Fig. 3d). As described previously, varying the angle of the crossed polarizers relative to the coating direction changes the location of dark lines in the image. This verifies that the dark lines are formed when the particles are oriented either parallel or perpendicular to the polarizers. For the flow aligned case (Fig. 3d) when the polarizer is oriented with the flow direction the image turns dark, since most of the particles are now oriented along the polarizer and the crossed polarizer prevents light from being transmitted.
Fig. 6 summarizes the deposited film structure as a function of volume fraction and substrate velocity. For ϕ < ϕ*, the average size of domains (filled circles) are indicated by the symbol color, with blue representing the isotropic structure. On decreasing substrate velocity the structure changed from particles oriented isotropically to particles oriented in small domains, shown in Fig. 3a and 3b, respectively. SEM images show that the reduction in domain size is smooth and it decreases monotonically. It is interesting to note that as the volume fraction is increased this transition gradually occurs at lower velocities. For example, at a volume fraction ϕ = 0.18 the transition occurs at a velocity v ≈ 350 μm s−1. At a volume fraction ϕ = 0.32 this transition occurs at velocity v ≈ 100 μm s−1. Thus, for the same substrate velocity a higher volume fraction suspension results in the deposition of a film with larger domains. For ϕ > ϕ*, Fig. 6 shows the velocities at which the titania film transitions from fully aligned (filled squares) to aligned but wavy patterns (open triangles).
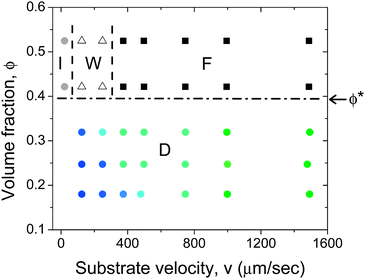 | ||
| Fig. 6 Effect of volume fraction and substrate velocity on the structure of the deposited film. Below the I–N transition (ϕ < ϕ* ≈ 0.40) particles form domains of similar particle orientation (D), with the domain size increasing with increasing substrate velocity. The green filled circles indicate large domains and blue circles indicate isotropic orientation. Above the I–N transition particles align in the coating direction. The filled squares indicate fully aligned particles (F), open triangles indicate a wavy structure (W) and filled gray circles indicate an isotropic structure (I). The films were deposited using a blade at an angle α = 25° and a gap d = 200 μm. | ||
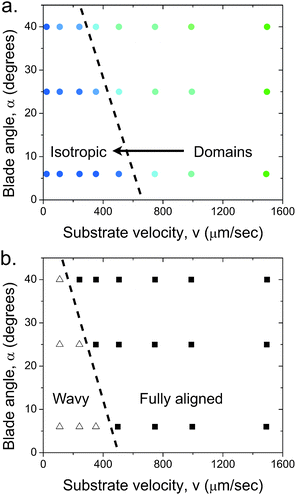 | ||
| Fig. 7 Effect of blade angle on the structure of the film deposited using a suspension with (a) volume fraction ϕ = 0.10, below the I–N transition and (b) volume fraction ϕ = 0.52, above the I–N transition. The filled squares indicate fully aligned particles (F), open triangles indicate a wavy structure (W) and filled colored circles indicate domains (D). The dotted lines are guides to the eye that show the general trend for the effect of increasing blade angle. The films were deposited at a gap d = 100 μm. | ||
The effect of blade angle can be understood by considering that the confinement of a fluid between an angled blade and a moving substrate creates both shear and extensional components to the flow. Extensional flow has the tendency to strongly align particles in the flow direction.31 At a blade angle α ≈ 0° the suspension is subjected to a nearly pure shear flow. Increasing the blade angle increases the extensional component. Consequently, this additional extensional flow further aligns the particles at a lower velocity. Shear flow both aligns the particles and also causes other types of motions like, tumbling, kayaking, wagging and log-rolling.32,33 It has been shown that with increasing shear rate these particle motions finally favor flow-alignment. In our system the shear rate decreases with decreasing substrate velocity, therefore, as the substrate velocity is reduced the propensity of particles to orient in the flow direction also decreases. Furthermore, in the nematic regime the rotation of the particles is hindered, leading to a much greater orientation. There can also be a collective orientational motion which leads to the formation of the wavy pattern.32
3.2 Film thickness
The thickness of the deposited films at a fixed blade angle α = 25° and a gap d = 200 μm is measured as a function of substrate velocity and volume fraction. As shown in Fig. 8a, the thickness h of the films deposited in this study range from 46 ± 6 nm (ϕ = 0.18, v = 124μm s−1) to 830 ± 16 nm (ϕ = 0.52, v = 1500 μm s−1). Several trends are apparent: h increases as the particle volume fraction in the suspension increases, while increasing the substrate velocity above v > 250 μm s−1 also leads to thicker deposited films. The thinnest film deposited is composed of a monolayer of particles. We also observed that cracks appear in the thickest film, h = 830nm, consistent with reports of colloidal films cracking above a critical thickness.34,35 Since such cracks are undesirable for most applications, flow coating enables us to deposit films that are sufficiently thin to avoid cracking.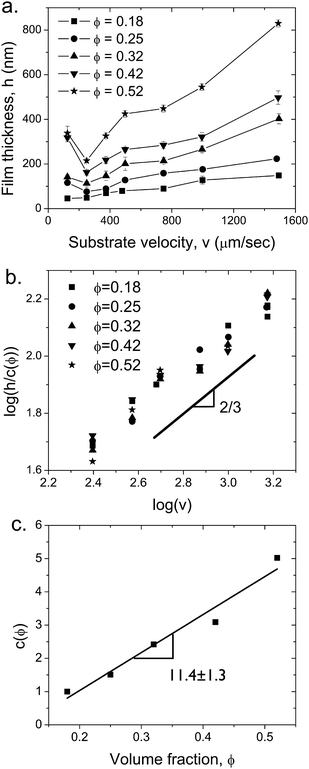 | ||
| Fig. 8 (a) Film thickness as a function of substrate velocity at different particle volume fractions, ϕ. At the lowest velocity the deposition is driven by convection deposition mechanism and thereafter by Landau-Levich process. The films were deposited using a blade at an angle α = 25° and a gap d = 200 μm. (b) Scaling the film thickness with c(ϕ) results in a master curve, where h ∼ v0.62± 0.05, in agreement with eqn (4). (c) Scaling constant c as a function of volume fraction. The best fit line has a slope of 11.4 ± 1.3. | ||
The effect of substrate velocity and the particle volume fraction on the thickness of the deposited titania films can be predicted by established scaling relationships. During the flow coating process, the frictional drag exerted on the solution due to the moving substrate pulls against capillary forces. As the velocity increases, a thicker layer of liquid is pulled from under the blade. Therefore, the film thickness increases with increased velocity. This is known as the Landau-Levich regime.30,36 However, if the substrate velocity decreases below a critical velocity, the particles also begin to advect towards the air–water contact line, which is referred to the convection-deposition regime.30 In this latter regime, reducing the substrate velocity leads to a thicker film since the particles have a longer time to advect towards the interface and deposit on the substrate. We noted earlier that this also leads to domain formation and particles flipping out of plane.
First, the film thickness data can be collapsed onto a single master curve by plotting h/c versus velocity (Fig. 8b), where c is a volume fraction dependent constant. As shown by the fitted line on this log-log plot, the master curve has a power-law dependence on the substrate velocity,
| h/c ∼ v0.62± 0.05 | (1) |
As we show below, established scaling relationships correctly describe the observed film height dependence on v.
It was first shown by Landau and Levich36 that the thickness of the liquid film hL for a substrate withdrawn vertically from a fluid is given by,
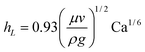 | (2) |
![[triple bond, length as m-dash]](https://www.rsc.org/images/entities/char_e002.gif) μv/γ is the capillary number for a fluid with viscosity μ and interfacial tension γ. Eqn (2) is valid when Ca≪1. For the titania suspensions investigated here this limit is satisfied as long as v≪7.2 m s−1. Berre et al.30 derived a similar expression for the case in which the fluid film is deposited horizontally,
μv/γ is the capillary number for a fluid with viscosity μ and interfacial tension γ. Eqn (2) is valid when Ca≪1. For the titania suspensions investigated here this limit is satisfied as long as v≪7.2 m s−1. Berre et al.30 derived a similar expression for the case in which the fluid film is deposited horizontally,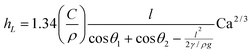 | (3) |
| hL ∼ v2/3 | (4) |
Once the liquid film is formed, the thickness of the dried film depends on the volume fraction of particles in the suspension, h ∼ hLϕ. Consistent with this, the volume fraction dependent scaling constant c(ϕ) exhibits a linear dependence on ϕ, as shown in Fig. 8c. The best fit line has a slope of 11.4 ± 1.3. Interestingly, this scaling suggests that the viscosity of the suspension does not play a significant role in determining the deposited film thickness. However, the thinning of the suspension under both shear and extensional flow likely complicates the viscosity dependence.
4 Conclusions
We reported the deposition of thin films of anisotropic titanium dioxide nanoparticles with controlled structure on a substrate. The film structure is primarily controlled by changing the volume fraction of particles in the colloidal suspension. At high volume fractions the particles orient in the flow direction and at low volume fractions the particles are oriented isotropically. The structure can be further tailored by varying the velocity of the substrate and the angle between the blade and the substrate. At higher coating velocities and higher blade angles an increase in shear and extensional flows leads to better alignment of particles in the coating direction. This can be seen most clearly at high volume fraction wherein increasing substrate velocity results in a transition from isotropic to wavy and finally a fully aligned structure. The velocity also enables one to control the thickness of the deposited film. Such films are interesting for their potential applications in photonics, photovoltaics and photocatalytic processes. Furthermore, flow coating can be combined with electric fields to generate a wide range of novel and patterned nanostructures.22Acknowledgements
We thank N. Wagner and R. Egres for providing the titania particles, J. Albert for assistance with flow coating and N. Abukhdeir for helpful discussions. Funding from NSF-NIRT (CBET-0506701) and the U.S. Department of Energy, Basic Energy Sciences (Grant DE-FG02-09ER46626) is gratefully acknowledged.References
- A. L. Penard, T. Gacoin and J. P. Boilot, Acc. Chem. Res., 2007, 40, 895–902 CrossRef CAS.
- Y. A. Vlasov, X. Z. Bo, J. C. Sturm and D. J. Norris, Nature, 2001, 414, 289–293 CrossRef CAS.
- F. Meseguer, Colloids Surf., A, 2005, 270–271, 1–7 CrossRef CAS.
- Z. Lai, I. Bonilla, G. Diaz, J. G. Nery, K. Sujaoti, M. A. Amat, E. Kokkoli, R. W. Terasaki, O. Thompson, M. Tsapatsis and D. G. Vlachos, Science, 2008, 300, 456–460.
- C. D. Dimitrakopoulos and P. R. L. Malenfant, Adv. Mater., 2002, 14, 99–117 CrossRef CAS.
- R. L. Hoffman, B. J. Norris and J. F. Wager, Appl. Phys. Lett., 2003, 82, 733–736 CrossRef CAS.
- B. R. Saunders and M. T. Turner, Adv. Colloid Interface Sci., 2008, 138, 1–23 CrossRef CAS.
- A. Shah, P. Torres, R. Tscharner, N. Wyrsch and H. Keppner, Science, 1999, 285, 692–698 CrossRef CAS.
- J. Wang, Q. Li, W. Knoll and U. Jonas, J. Am. Chem. Soc., 2006, 128, 15606–15607 CrossRef CAS.
- P. Kumnorkaew and J. F. Gilchrist, Langmuir, 2009, 25, 6070–6075 CrossRef CAS.
- J. A. Lee, L. Meng, D. J. Norris, L. E. Scriven and M. Tsapatsis, Langmuir, 2006, 22, 5217 CrossRef CAS.
- R. D. Deegan, O. Bakajin, T. F. Dupont, G. Huber, S. R. Nagel and T. A. Witten, Nature, 1997, 389, 827–829 CrossRef CAS.
- M. E. Davis, Nature, 2002, 417, 813–821 CrossRef CAS.
- M. Grzelczak, J. Vermant, E. M. Furst and L. M. Liz-Marzán, ACS Nano, 2010 DOI:10.1021/nn100869j.
- S. C. Glotzer and M. J. Solomon, Nat. Mater., 2007, 6, 557–562 CrossRef.
- Z. L. Zhang and S. C. Glotzer, Nano Lett., 2004, 4, 1407–1413 CrossRef CAS.
- K. P. Herlihy, J. Nunes and J. M. DeSimone, Langmuir, 2008, 24, 8421–8426 CrossRef CAS.
- K. M. Ryan, A. Mastroianni, K. A. Stancil, H. T. Liu and A. P. Alivisatos, Nano Lett., 2006, 6, 1479–1482 CrossRef CAS.
- J. C. Loudet, A. M. Alsayed, J. Zhang and A. G. Yodh, Phys. Rev. Lett., 2005, 94, 018301 CrossRef CAS.
- M. G. Basavaraj, G. G. Fuller, J. Fransaer and J. Vermant, Langmuir, 2006, 22, 6605–6612 CrossRef CAS.
- J. P. Singh, P. P. Lele, F. Nettesheim, N. J. Wagner and E. M. Furst, Phys. Rev. E, 2009, 79, 050401(R).
- M. Mittal and E. M. Furst, Adv. Funct. Mater., 2009, 19, 3271–3278 CrossRef CAS.
- C. M. Stafford, K. E. Roskov, T. H. Epps III and M. J. Fasolka, Rev. Sci. Instrum., 2006, 77, 023908 CrossRef.
- X. Chen and S. S. Mao, Chem. Rev., 2007, 107, 2891–2959 CrossRef CAS.
- T. Sugimoto, K. Okada and H. Itoh, J. Colloid Interface Sci., 1997, 193, 140–143 CrossRef CAS.
- R. J. Egres, Ph.D. thesis, University of Delaware, 2005.
- T. Viseu, B. Almeida, M. Stchakovsky, B. Drevillon, M. Ferreira and J. Sousa, Thin Solid Films, 2001, 401, 216–224 CrossRef CAS.
- P. J. Camp, C. P. Mason, M. P. Allen, A. A. Khare and D. A. Kofke, J. Chem. Phys., 1996, 105, 2837–2849 CrossRef CAS.
- S. Elston and R. Sambles, The Optics of Thermotropic Liquid Crystals, Taylor & Francis, 1998 Search PubMed.
- M. L. Berre, Y. Chen and D. Baigl, Langmuir, 2009, 25, 2554–2557 CrossRef CAS.
- B. D. Bedford and W. R. Burghardt, J. Rheol., 1996, 40, 235–257 CrossRef CAS.
- M. Ripoll, R. G. Winkler, K. Mussawisade and G. Gompper, J. Phys.: Condens. Matter, 2008, 20, 404209 CrossRef.
- Y.-G. Tao, W. K.d. Otter and W. J. Briels, Phys. Rev. Lett., 2005, 95, 237802 CrossRef.
- M. S. Tirumkudulu and W. B. Russel, Langmuir, 2005, 21, 4938–4948 CrossRef CAS.
- E. R. Dufresne, E. I. Corwin, N. A. Greenblatt, J. Ashmore, D. Y. Wang, A. D. Dinsmore, J. X. Cheng, X. S. Xie, J. W. Hutchinson and D. A. Weitz, Phys. Rev. Lett., 2003, 91, 224501 CrossRef CAS.
- L. Landau and B. Levich, Acta Phys. Chim. U.R.S.S., 1942, 17, 42–54 Search PubMed.
Footnote |
| † Current address: Department of Chemical Engineering, University of Florida, Gainesville, FL 32611 |
| This journal is © The Royal Society of Chemistry 2010 |