 Open Access Article
Nisin/polyanion layer-by-layer films exhibiting different mechanisms in antimicrobial efficacy
Hanan Fael * and
A. Levent Demirel
Department of Chemistry, Koç University, Istanbul, Turkey. E-mail: hfael@ku.edu.tr
First published on 11th March 2020
Abstract
Nisin/polyanion Layer-by-Layer (LbL) films are reported to exhibit different mechanisms in antimicrobial efficacy depending on the type of polyanion. LbL films consisting of nisin as the polycationic component were prepared using two different polyanionic constituents: poly acrylic acid (PAA) and dextran sulfate (DX). Due to the weaker interaction strength of carboxylate groups with nisin compared to sulfate/nisin, a larger molecular weight of PAA was needed to achieve LbL assembly. PAA-100K/nisin and DX-15K/nisin multilayer films exhibited significantly different properties. PAA–nisin films grew faster compared to DX–nisin films and showed, for 60 bilayer films, an average bilayer thickness of 21.6 nm compared to that of 6.1 nm in DX–nisin films. The total amount of nisin was found to be 17.1 ± 2.2 μg cm−2 in (PAA–nisin)60 and 6.8 ± 0.4 μg cm−2 in (DX–nisin)60 films. The stability of the films was investigated at three different pH values of 6.0, 7.4 and 9.5. (PAA–nisin)60 films exhibited the release of nisin into the solution which resulted in the disintegration of the film over several hours. A burst release was observed in the first hour followed by a slower release and disintegration over 24 hours with a complete release at pH 9.5. The bacterial growth inhibition test against Staphylococcus epidermidis confirmed the antimicrobial activity of nisin released from PAA–nisin films. PAA was found to stabilize nisin and the film-released nisin retained its antimicrobial activity in the neutral and alkaline pH values. Unlike PAA–nisin films, (DX–nisin)60 films were stable at the physiological conditions up to 14 days with no release of nisin. DX–nisin films were found to inhibit the attachment of Staphylococcus epidermidis and prevent biofilm formation. These results clearly demonstrate the effect of different polyanions on nisin LbL films to achieve different mechanisms in antimicrobial efficacy and show the potential of PAA–nisin multilayer films as promising local delivery systems for treatment of burns and wounds, while DX–nisin multilayer films can be employed as stable coatings against bacterial attachment and biofilm formation.
1. Introduction
Since the first demonstration of Layer-by-Layer (LbL) assemblies of polyelectrolytes,1 they have been employed in a variety of applications including drug delivery,2,3 biosensors,4 and electrochemical devices.5 In addition to electrostatic interactions, multilayer formation was also achieved by hydrogen bonding,6,7 hydrophobic interactions8 and covalent bonding.9 The multilayer film thickness, structure and stability are highly affected by polymer type, salt concentration, salt type, medium pH and deposition time.10Controllable drug release from LbL films was previously reported for several different systems. Drug loading was achieved either by incorporating drug molecules in the biodegradable film during the construction11,12 or as a post-treatment by means of diffusion.13
Although local antimicrobial delivery can save the human flora and prevent systemic toxicity, a major challenge is to achieve therapeutic effect while avoiding the development of bacterial resistance. Antimicrobial peptides (AMP) were found to be promising antimicrobial agent alternatives as they exhibited high activity against a very broad spectrum of microorganisms with low rate of bacterial resistance.14,15 Nisin is an antimicrobial polypeptide consisting of 34 amino acids and produced by Lactococcus lactis.16 Nisin contains few unusual amino acids because of enzymatic post-translational modifications, such as dehydroalanine and dehydrobutyrine in addition to thioether amino acids that form five lanthionine rings and belong to a group of polycyclic peptide antimicrobial agents called lantibiotics.17,18
Nisin is safe and extensively used in the food industry for processed cheese, dairy products and canned foods.19 It has been approved by the World Health Organization (WHO) and the US Food and Drug Administration (FDA).20 The antimicrobial activity of nisin is attributed to the interaction with anionic lipids on the cytoplasmic membrane of bacterial cells leading to the disturbance of the membrane and cell death.21 It is highly active against many Gram positive bacteria such as Listeria monocytogenes, Staphylococcus aureus, Streptococcus pneumoniae, and Clostridium difficil, in addition to the antibiotic resistant strains such as MRSA and VRE.22–24 It is also known to be effective in the prevention of biofilm formation.25 Nisin has low tendency to cause bacterial resistance and has low cellular cytotoxicity at antimicrobial concentrations.26–28 The application of nisin-containing wound dressing was reported to prevent bacterial colonization and accelerate the healing process.29 Nisin was also incorporated in LbL antibacterial coating of stainless steel via covalent bonding with a homopolymer of methacrylamide bearing (oxidized) 3,4-dihydroxyphenylalanine and the coating showed sustained contact-killing properties.30
The solubility and molecular stability of nisin is pH dependent. Nisin is highly soluble at acidic pH and its solubility decreases sharply from 57 mg mL−1 at pH 2.0 to ∼1.5 mg mL−1 at pH 6.0 and reaches ∼0.25 mg mL−1 at pH 8.5.31 The antimicrobial activity of nisin depends on its stability which also decreases with increasing pH. Whereas nisin shows good antimicrobial activity in acidic environment, it loses its activity in the alkaline pH due to degradation.31 However, it is reported that the antimicrobial activity of nisin is retained up to pH 8.0 in the presence of some carboxylic acids and this was attributed to the complex formation between nisin and carboxylic acids.32
In this work, we report antimicrobial LbL films consisting of nisin as the polycationic component which exhibit different mechanism of antibacterial efficacy depending on the polyanionic component used. While weakly interacting poly acrylic acid (PAA)/nisin films showed pH dependent release, dextran sulfate (DX)/nisin films were stable and prevented biofilm formation on the surfaces.
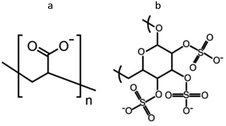
Fig. 1 shows the chemical structures of the two polyanions used to achieve different modes of action in antimicrobial efficacy. PAA is a polymer with weak carboxylic acid groups which is expected to loosely bind to nisin resulting in the disintegration of the LbL films at alkaline pH while stabilizing nisin against degradation and maintaining its antimicrobial efficacy. On the other hand, DX has strong sulfate groups showing high affinity towards proteins even at pH values as high as 9.0.33 Therefore, a compact stable antimicrobial multilayer film is expected with nisin.
To the best of our knowledge, the effect of polyanion on nisin LbL films to achieve different mechanisms of antimicrobial efficacy was investigated for the first time. The results clearly demonstrate that depending on the polyanionic component the LbL films can either be used for controlled delivery of therapeutic agents or as stable protective coatings against biofilm formation and have the potential to be used in a variety of biomedical applications.
2. Experimental
2.1. Materials
Nisin from Lactococcus lactis 2.5% (balance sodium chloride), poly acrylic acid (PAA) (Mw ∼ 15 kDa and 100 kDa), dextran sulfate sodium salt (DX) (Mw ∼ 15 kDa) were purchased from Sigma Aldrich (Germany). Branched polyethylenimine (BPEI) (Mw ∼ 70 kDa) was purchased from Alfa Aesar (Germany). Silicon wafers were obtained from Ultrasil Corporation (USA) and used without removing the native oxide layer. Acetic acid, sodium acetate, sodium hydroxide, sodium chloride, potassium chloride and sodium dihydrogen phosphate monohydrate were obtained from Merck (Germany) and used without further purification. Deionized water (Milli-Q ultrapure water system, Millipore) was used for the preparation of all buffer solutions.Antimicrobial test specie, Staphylococcus epidermidis (S. epidermidis) (ATCC 35984), was provided from global biological materials resource and standards organization American Type Culture Collection, ATCC. Luria-Bertani broth (LB) and LB agar were purchased from Caisson Labs (USA). Plastic Petri dishes, falcon tubes, 6-well plates, and loops were purchased from Nest.
2.2. Preparation of nisin and polyelectrolyte solutions
Nisin solution was prepared at a concentration of 1 mg mL−1 in 0.05 M acetic acid. An amount of nisin 2.5% that is equivalent to 10 mg of nisin was precisely transferred into beaker which contained 8 mL of 0.05 M acetic acid. The solution was stirred for 1 hour and any undissolved solid particles (insoluble denatured milk solids) were then removed by centrifugation at 8000 rpm for 10 min. PAA and DX solutions were prepared at a concentration of 2 mg mL−1 in 0.1 M acetate buffer at pH 4.0 for PAA and at pH 5.0 for DX. BPEI solution was prepared at a concentration of 5 mg mL−1 in distilled water.2.3. Preparation of layer-by-layer (LbL) films
Multilayer LbL films were assembled on clean silicon substrates pre-treated with UV-ozone (model 42-200, Jelight Company) for 15 min to activate the silanol groups on its native oxide surface. Silicon substrate was then dipped into BPEI solution for 20 min followed by rinsing with DI water for 5 min. The positively charged BPEI adsorbed silicon substrate was then immersed alternately in the polyanion and nisin solutions for 10 min each and rinsed with acetate buffer for 2 min between the adsorption cycles. After deposition of each bilayer (consisting of a polyanion and a nisin layer), the film was dried under nitrogen flow and then a new cycle of deposition was started. All LbL films had the polyanion layer as the first layer on the substrate and the nisin layer as the terminal layer. The multilayer films were denoted as (polyanion–nisin)n where n represents numbers of bilayers. (PAA–nisin)60 and (DX–nisin)60 were prepared and thoroughly tested. The abbreviation “PAA” mentioned in this paper refers to Mw 100 kDa unless otherwise specified.2.4. The interaction between nisin and studied polyanions
The formation of polyanion–nisin complex in the pH range of 2.0 to 7.0 was monitored by observing the absorbance at 400 nm using UV-visible spectroscopy. Turbidity τ was then calculated (τ = 100 T%). Infrared spectra of the film individual components and polyanion–nisin complex were obtained using FTIR spectrometer (Nicolet iS10, Thermo Scientific) over the wavenumber range of 4000–400 cm−1 with a resolution of 4 cm−1 and an accumulation of 64 scans.2.5. Characterization of film growth and morphology
The thickness of multilayer films was monitored after deposition of each bilayer using an ellipsometer (Microphotonics ELX-01R) with 632.8 nm laser light at 70° angle. Atomic force microscope (Bruker Dimension) in tapping mode was used to examine the film morphology. Root mean squared roughness values were calculated for an area of 20 μm × 20 μm. Optical microscopy (Leica DM LM) and scanning electron microscopy (SEM) (Zeiss EVO LS-15) were also used to investigate the morphology of the deposited multilayer films.2.6. Quantifying the release of nisin from LbL films
Pieces of silicon substrate (∼1 cm × 0.7 cm) coated with (PAA–nisin)60 and (DX–nisin)60 multilayer films were laid in Eppendorf tubes that contained 1 mL of buffer solution and were incubated at 37 °C. Nisin release was investigated as a function of time up to 24 hours for (PAA–nisin)60 and 14 days for (DX–nisin)60. Release was performed at three different pH values: phosphate buffered saline (PBS) at pH 6.0 and pH 7.4; and carbonate buffer at pH 9.5. Nisin concentration was determined by UV spectrophotometry at 275 nm which is assigned to imidazole ring of histidine34 depending on a calibration curve constructed using solutions of known concentration with a linearity range 2–100 μg mL−1 (R2 = 0.9997). All measurements were made in triplicate.2.7. Quantifying the amount of nisin loaded into the LbL films
The loaded nisin into (PAA–nisin)60 and (DX–nisin)60 multilayer films have been quantified by dissolving the entire films in 50% dimethylsulfoxide (DMSO) with the help of ultrasonic bath for 30 minutes. Nisin concentration was then determined by UV spectrophotometry at 275 nm using a calibration curve constructed at the same wavelength.2.8. Antimicrobial activity of the LbL films
(PAA–nisin)60 and (DX–nisin)60 films in addition to uncoated silicon wafers were all sterilized under UV lamp for 30 min before applying this test.![[thin space (1/6-em)]](https://www.rsc.org/images/entities/char_2009.gif) 35,36 for surface antibacterial efficacy. Fresh overnight grown 109 CFU mL−1 bacterial suspension in LB medium was diluted with PBS to obtain 105 CFU mL−1. Samples of (DX–nisin)60 films were inoculated with 50 μL of bacterial suspension and covered with sterilized glass slide then kept individually in wells of 6-well plate. Sterilized uncoated silicon wafer were treated the same way to serve as negative control. All samples were then incubated at 37 °C for 5 hours. After incubation, 0.95 mL of 0.1% Tween 20 solution in PBS was added to each well followed by shaking for 1 minute. Subsequently, 0.1 mL of each sample was plated over agar and incubated at 37 °C for 24 hours. Viable colonies were then counted and the percentage of bacterial growth inhibition was calculated with reference to the control count prepared in presence of uncoated silicon wafer.
35,36 for surface antibacterial efficacy. Fresh overnight grown 109 CFU mL−1 bacterial suspension in LB medium was diluted with PBS to obtain 105 CFU mL−1. Samples of (DX–nisin)60 films were inoculated with 50 μL of bacterial suspension and covered with sterilized glass slide then kept individually in wells of 6-well plate. Sterilized uncoated silicon wafer were treated the same way to serve as negative control. All samples were then incubated at 37 °C for 5 hours. After incubation, 0.95 mL of 0.1% Tween 20 solution in PBS was added to each well followed by shaking for 1 minute. Subsequently, 0.1 mL of each sample was plated over agar and incubated at 37 °C for 24 hours. Viable colonies were then counted and the percentage of bacterial growth inhibition was calculated with reference to the control count prepared in presence of uncoated silicon wafer.2.9. Bacterial attachment assay on DX–nisin film
The ability of non-releasing (DX–nisin)60 multilayer film to prevent bacterial attachment was investigated. Sterilized samples of (DX–nisin)60 multilayer films and uncoated silicon substrate (negative control) were placed face up in wells of 6-well plate and covered with 100 μL of 105 CFU mL−1 S. epidermidis (prepared as described in protocol37 and diluted with PBS) and incubated at 37 °C for 2 hours.12 Each sample was then rinsed gently with three portions of PBS to remove the non-attached bacteria. Afterward, each substrate was placed face down over LB agar plate and incubated at 37 °C for 48 hours. For SEM imaging, (DX–nisin)60 films and uncoated silicon wafer were carefully removed from the agar plate and treated with para formaldehyde (PFA) 4% to fix the grown bacteria.3. Results and discussion
3.1. Film composition and morphology
The electrostatic attraction is the driving force for the LbL assembly of nisin and polyanion (PAA or dextran sulfate), where the medium pH affects the degree of ionization and therefore the complex formation between nisin and polyanion. The polypeptide nisin exhibits a net positive charge at pH below its isoelectric point (pI = 8.8),38 whereas poly acrylic acid and dextran sulfate both hold a negative charge. Dextran sulfate has a strong sulfate group which dissociates above pH 2.0. Unlike dextran sulfate, poly acrylic acid has weak carboxylic groups and its ionization degree is pH dependent.39,40 PAA–nisin interaction was investigated using two different molecular weights of PAA (15 kDa and 100 kDa). An imperceptible turbidity was obtained when PAA-15 kDa was mixed with nisin indicating rather weak interaction between the two. Any growth of LbL films was also not observed with PAA-15 kDa. Increasing the molecular weight to 100 kDa enhanced the interaction between PAA and nisin molecules and resulted in noticeable turbidity when PAA-100 kDa and nisin were mixed. Therefore, PAA-100 kDa was used to grow PAA–nisin LbL films. Fig. 2 shows the interaction of nisin and polyanions in aqueous solution as a function of pH. A maximum tendency of PAA-100 kDa to form the complex with nisin was found at pH 4.0 and 5.0 where nisin holds a net positive charge. On the other hand, the highest turbidity value was obtained at pH 3.0 with dextran sulfate.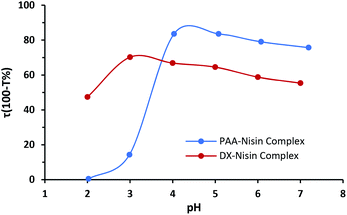 | ||
| Fig. 2 Turbidity as a function of pH for PAA–nisin and DX–nisin solutions (polyanion concentration = nisin concentration = 0.25 mg mL−1). | ||
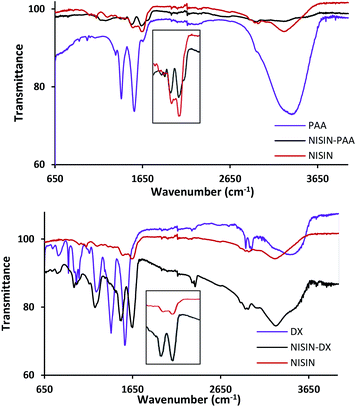
The formed complex was investigated by Fourier-transform infrared spectroscopy. Fig. 3 shows the FTIR spectra of dried PAA–nisin complex in addition to the native nisin and PAA. Nisin spectrum shows two characteristic peaks at 1639 cm−1 (amide I) and 1540 cm−1 (amide II) which were observed in the complex but with amide II peak shifted to 1529 cm−1 by 11 cm−1. The same trend was observed in DX–nisin complex where the amide II peak of nisin has been shifted to 1521 cm−1 by as much as 19 cm−1 which confirms the interaction between the polyanion and the polypeptide.
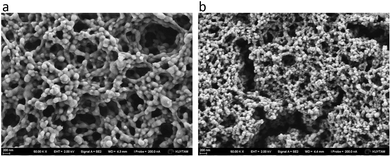
The morphology of the formed complexes was characterized by SEM. Fig. 4 shows a porous three-dimensional structure of the complex. The aggregates consisted of interconnected and elongated sphere-like features whose size was found to be smaller in the case of dextran than PAA. This might reflect the larger molecular weight of PAA compared to dextran sulfate.
To select the optimum pH value for the fastest growth of LbL films, films were assembled using polyanion solution prepared in acetate buffer at pH 3.0, 4.0 and 5.0 and nisin solution prepared in acetate buffer at pH 3.0 and 4.0. The growth profile of LbL assembled films was determined by measuring the thickness after each bilayer by ellipsometry. Any film growth was not observed when PAA-15 kDa was used. For both PAA and DX, the growth rate was faster when nisin solution at pH 3.0 was used, as nisin exhibits a maximum positive charge at this pH. The optimal pH of polyanion solution which corresponds to the highest growth rate was found to be pH 4.0 for PAA solution and pH 5.0 for DX solution.
(PAA–nisin)60 and (DX–nisin)60 films were prepared at these optimized pH values by dip-coating. At 25 bilayers, DX–nisin film had an average thickness of ∼138 nm and reached ∼370 nm at 60 bilayers (Table 1). PAA–nisin film thickness was ∼403 nm at 25 layers. The thickness of PAA–nisin at 60 bilayers was found to be ∼1295 nm as determined by AFM. (DX–nisin)60 film had an average bilayer thickness of ∼6 nm compared to ∼21 nm in the case of (PAA–nisin)60 film. This is mainly attributed to the much smaller molecular weight of dextran sulfate (15 kDa) compared to PAA (100 kDa) with minor contribution originating from the stronger attraction between DX/nisin compared to PAA/nisin.
| Film | Root mean squared roughness (nm) | Film thickness (nm) | Nisin loaded amount (μg cm−2) | Nisin loading/nm film thickness ((μg cm−2) nm−1) |
|---|---|---|---|---|
| (PAA–nisin)25 | 137.3 ± 18.3 | 402.5 ± 4.9 | — | — |
| (PAA–nisin)60 | 448.6 ± 27.1 | 1294.9 ± 218.7 | 17.1 ± 2.2 | 0.014 ± 0.0021 |
| (DX–nisin)25 | 29.1 ± 6.7 | 138.0 ± 2.8 | — | — |
| (DX–nisin)60 | 68.0 ± 3.6 | 369.0 ± 5.6 | 6.8 ± 0.4 | 0.018 ± 0.0003 |
The growth profiles of PAA–nisin and DX–nisin films showed significant differences. PAA–nisin film exhibited an initial exponential growth up to 8 bilayers which was followed by a linear growth beyond the 8th bilayer (Fig. 5a). The transition from exponential growth to linear growth of LbL films has previously been observed and attributed to the restructuring in the film at the very deep layers and the diffusion of small polyelectrolyte in and out the film during the construction.41,42 At a certain thickness, the restructured zone becomes thick and the polyelectrolyte is no longer able to diffuse through it and a forbidden zone is formed. The forbidden zone grows as more layers are deposited so that the top zone, that is undergoing interdiffusion, retains a constant thickness and film grows linearly with the number of bilayers.41,43,44 This phenomena is likely to govern the growth of PAA film and it is dependent on several factors such as the molecular weight of the polyelectrolyte in addition to its chemical structure and charge density.45–48 DX–nisin film, on the other hand, exhibited a linear growth profile (Fig. 5b) which can be attributed to the strong charge density of dextran originating from the sulfate group.47
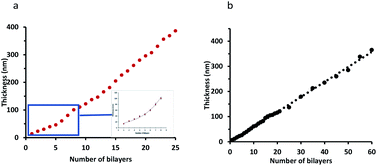 | ||
| Fig. 5 The growth profile of: (a) (PAA–nisin)25 film where the inset shows the exponential growth of the first 8 bilayers and (b) the growth profile of (DX–nisin)60 film. | ||
The surface morphology of 25 bilayer and 60 bilayer thick PAA–nisin and DX–nisin films was investigated by AFM and the root mean squared roughness values were calculated in an area of 20 μm × 20 μm. As seen in Fig. 6 and Table 1, the roughness of multilayer films increased with the number of bilayers regardless of the polyanion used in the film construction. DX–nisin films exhibited a smoother surface compared to PAA–nisin as proved by smaller rms roughness values which indicates a rather loose attachment of PAA to nisin compared to stronger and more compact links between nisin and dextran.
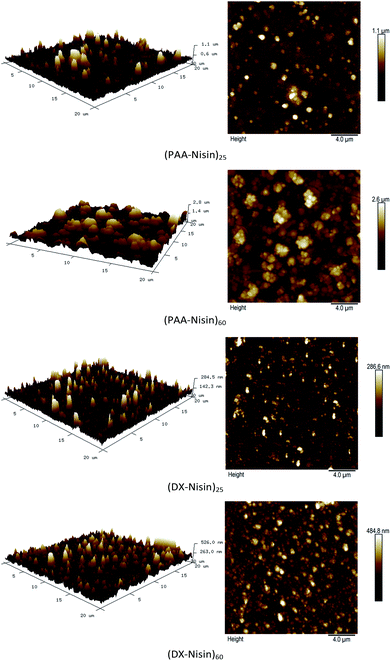 | ||
| Fig. 6 Atomic force microscope (AFM) height images (20 μm by 20 μm) of the 25 and 60 bilayers films of PAA–nisin and DX–nisin. | ||
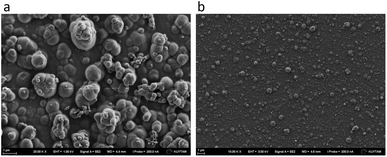
The rougher surface morphology of PAA–nisin films was also confirmed by SEM characterization. Fig. 7 shows the SEM images of 60 bilayer films of both PAA–nisin and DX–nisin. The smoother surface of DX–nisin film comes from a strong interaction with nisin whereas PAA–nisin film shows many larger protrusions on the surface which is in good agreement with the AFM images.
3.2. Nisin loading and release
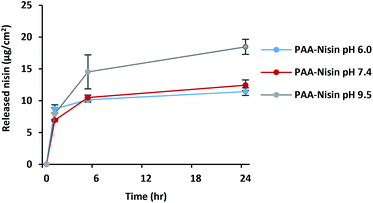
The amount of nisin loaded into (PAA–nisin)60 and (DX–nisin)60 multilayer films was determined to be 17.1 ± 2.2 μg cm−2 for PAA film and 6.8 ± 0.4 μg cm−2 for DX film. The thicker PAA film had an overall drug content which was 2.5 times higher than that of DX film, although DX film consisted of a slightly higher amount of nisin per nm thickness due to the much thinner (DX–nisin)60 film compared to (PAA–nisin)60 film (Table 1).The release of nisin from (PAA–nisin)60 and (DX–nisin)60 multilayer films was investigated at different pH buffer solutions. Films were incubated at 37 °C in three pH values: PBS pH 6.0 which is close to the normal skin pH, PBS pH 7.4 which is the biological pH value, in addition to carbonate buffer pH 9.5 which corresponds to the elevated pH of infected wounds and burns.49,50 As expected from weaker interactions and loosely bound molecules, nisin released from the PAA–nisin films. Fig. 8 shows the release profile of (PAA–nisin)60 films in time. A release of about 85% of the total loaded nisin from (PAA–nisin)60 films was achieved within 5 hours of incubation at pH 9.5; whereas only ∼60% released in the same period in PBS at pH 6.0 and 7.4. Nisin was completely released from (PAA–nisin)60 film after 24 hours at pH 9.5. Unlike the alkaline pH, nisin release did not exceed 66% and 72% after 24 hours at pH 6.0 and 7.4, respectively. At pH 6.0 and 7.4, the release of PAA–nisin complex is expected to happen from the top surface of the multilayer film. Close to the isoelectric point of nisin (pI ∼8.8), the electrostatic interactions with PAA will diminish and nisin is also expected to diffuse out from the inner-volume of the film which will at the same time destabilize the multilayers and result in disintegration of the entire film.51 The pH dependent release of nisin from PAA films can be attributed to the less net positive charge on nisin molecule with increasing pH and thus to the weaker electrostatic interactions between nisin and the negatively charged carboxylate groups in PAA. The initial burst release of nisin from PAA films was observed at all of the three different pH values. This initial burst release is extremely important for treating infections. The preliminary high dose can kill any existing bacteria and the sustained release in time can maintain the effectiveness of the treatment.
It can also be anticipated that the decrease of the net positive charge on nisin at pH values above its isoelectric point (pI ∼8.8) will decrease the electrostatic attraction between nisin and DX and enhance the dissociation of DX–nisin complexes. However, DX–nisin multilayer films were highly stable at all pH and no release of nisin was detected up to two weeks even at pH 9.5.
(DX–nisin)60 films maintained their stability for two weeks at both pH 6.0 and pH 7.4, and the film thickness was found to be the same by ellipsometer and AFM measurements. At pH 9.5, some patches were observed to be removed from DX films after 24 hours, but any nisin was not detected in the solution indicating that DX–nisin aggregates did not dissociate into individual components. Lysin, one of amino acids in nisin, has pKa value of about 10.5 and maintains its positive charge at pH 9.5. The stronger interaction of these positively charged groups with sulfate groups in DX compared to carboxylate groups in PAA can stabilize the DX–nisin aggregates and prevent the release of nisin into the solution. In addition, the compactness of the DX–nisin films having a thickness of ∼369 nm at 60 bilayers due to relatively stronger electrostatic interactions and lower molecular weight compared to rather expanded PAA–nisin films having a thickness of ∼1295 nm at 60 bilayers is expected to contribute to the stability of DX–nisin. For these reasons, unlike PAA–nisin multilayer films, changing the pH of the medium did not induce any release of nisin from DX film, despite the fact that some film patches detached into the solution. These results indicating the rather strong electrostatic interaction between DX and nisin are consistent with the linear growth profile of the film without any interdiffusion. The stability of (DX–nisin)60 multilayer film in the physiological pH value shows the potential of these films as longer term durable antimicrobial coatings rather than for release applications.
3.3. Antimicrobial activity of the LbL films
The antimicrobial efficacy of (PAA–nisin)60 multilayer films against Staphylococcus epidermidis, Gram-positive bacteria, was investigated at three pH values of 6.0, 7.4 and 9.5. Well diffusion assay was applied, and inhibition zones were observed around wells that contain PAA film-released nisin at pH 6.0, 7.4 and 9.5 (Fig. 9) confirming the antimicrobial efficacy of film-released nisin.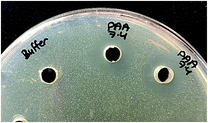 | ||
| Fig. 9 Antimicrobial activity of PAA film-released nisin at pH 7.4 against S. epidermidis by well diffusion assay compared to PBS pH 7.4 (left well). | ||
The activity of film-released nisin was compared to that of native nisin at each pH value. Fig. 10 shows the differences in inhibition zone diameters obtained from native nisin and film-released nisin as a function of pH. The equivalent concentration of native nisin that would show the same inhibition zone diameter (x) was determined from the linear regression of the inhibition zone diameter, x, plotted against the natural logarithm of nisin concentration, ln![[thin space (1/6-em)]](https://www.rsc.org/images/entities/char_2009.gif) c,52 at each pH value. The actual nisin concentration in the film-released samples was measured to be ∼20 μg mL−1. In reference to this value, the calculated equivalent concentration was found to be greater by ∼45 times at pH 6.0 and pH 7.4, and ∼55 times at pH 9.5. This enhancement in nisin antimicrobial activity can be attributed to the presence of PAA in the released sample whose interaction with the agar medium allows a faster diffusion of nisin compared to slower diffusion of nisin as proven before,52 and secondly to the PAA interaction with nisin which protects nisin against the chemical degradation in the physiological and alkaline medium and thus enhances its activity against bacteria. It is well known in the literature that nisin has the highest stability in the acidic medium whereas it is less stable at high pH values.31 Nisin loses its antimicrobial activity as a result of addition of nucleophiles to the double bound of the unsaturated amino acids in nisin.31 The tendency of nisin to retain its antimicrobial activity at basic pH values has previously observed when nisin co-existed with carboxylic acids such as citric and lactic acids.32 In this case, we attribute the significant enhancement in the activity of film-released nisin at pH 9.5, in addition to physiological pH values, to the stabilization by PAA. These results clearly demonstrate the potential of PAA–nisin multilayer films as an effective model release system against bacteria in the case of infected burns and wounds where alkaline pH is common.
c,52 at each pH value. The actual nisin concentration in the film-released samples was measured to be ∼20 μg mL−1. In reference to this value, the calculated equivalent concentration was found to be greater by ∼45 times at pH 6.0 and pH 7.4, and ∼55 times at pH 9.5. This enhancement in nisin antimicrobial activity can be attributed to the presence of PAA in the released sample whose interaction with the agar medium allows a faster diffusion of nisin compared to slower diffusion of nisin as proven before,52 and secondly to the PAA interaction with nisin which protects nisin against the chemical degradation in the physiological and alkaline medium and thus enhances its activity against bacteria. It is well known in the literature that nisin has the highest stability in the acidic medium whereas it is less stable at high pH values.31 Nisin loses its antimicrobial activity as a result of addition of nucleophiles to the double bound of the unsaturated amino acids in nisin.31 The tendency of nisin to retain its antimicrobial activity at basic pH values has previously observed when nisin co-existed with carboxylic acids such as citric and lactic acids.32 In this case, we attribute the significant enhancement in the activity of film-released nisin at pH 9.5, in addition to physiological pH values, to the stabilization by PAA. These results clearly demonstrate the potential of PAA–nisin multilayer films as an effective model release system against bacteria in the case of infected burns and wounds where alkaline pH is common.
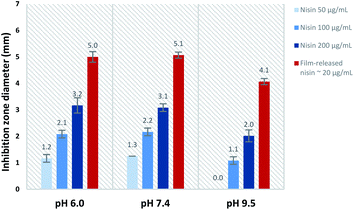 | ||
| Fig. 10 Inhibition zone obtained from native nisin solutions and PAA film-released nisin at each pH value. | ||
The antimicrobial activity of (DX–nisin)60 coating was also confirmed by applying modified Japanese Industrial Standard test against Staphylococcus epidermidis. (DX–nisin)60 coating was able to kill about 99.8% of the inoculum after 5 hours of incubation which confirms the antimicrobial surface activity of this coating (Fig. 11).
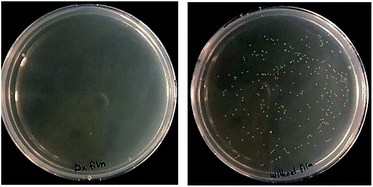 | ||
| Fig. 11 Antimicrobial activity of (DX–nisin)60 coating against S. epidermidis compared to uncoated silicon wafer as negative control. | ||
3.4. Bacterial attachment test of Dx–nisin film
Because DX–nisin films were stable and did not show any release of nisin, bacterial attachment test was done to evaluate the efficiency of (DX–nisin)60 multilayer films in inhibiting biofilm formation where bacterial attachment is the first step. The degree of bacterial attachment on DX–nisin film was assessed in reference to the non-coated silicon substrate. Both surfaces were exposed to bacterial suspension for a predetermined time, followed by rinsing several times by sterile PBS and placed face down over agar plates for incubation. After 48 hours of incubation, the bare silicon wafer which presents the negative control was covered with bacterial biofilm as shown in the SEM images in Fig. 12, while the DX–nisin coated substrate was clean with no single bacterial colony demonstrating the inhibition of bacterial attachment. These results clearly show that surfaces coated with DX–nisin films significantly inhibit bacterial attachment and biofilm formation.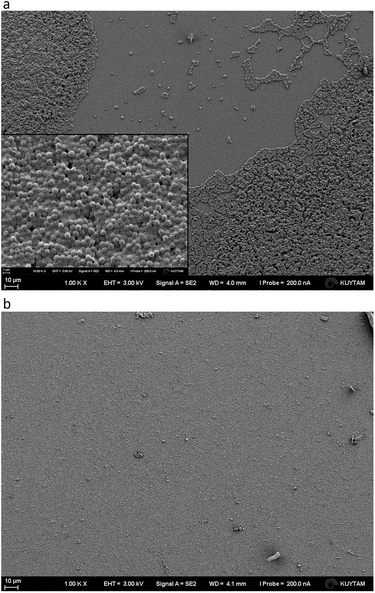 | ||
| Fig. 12 SEM images of (a) bare silicon substrate as negative control, while the inset shows higher magnification of the bacteria, and (b) (DX–nisin)60 multilayer film after incubation for 48 h. | ||
4. Conclusion
Two anionic polymers having different anionic groups – poly acrylic acid (PAA) and dextran sulfate (DX) – were employed to construct multilayer films with nisin, an antimicrobial polypeptide, by layer-by-layer (LbL) assembly. Due to weaker interaction strength of carboxylate groups with nisin compared to sulfate/nisin, larger molecular weight of PAA was needed to achieve LbL assembly. PAA-100K/nisin and DX-15K/nisin multilayer films exhibited significantly different properties. PAA–nisin films showed an exponential growth followed by linear growth profile, whereas DX–nisin films grew linearly. PAA–nisin films grew faster compared to DX–nisin films and showed, for 60 bilayer films, an average bilayer thickness of ∼21.6 nm compared to that of ∼6.1 nm in DX–nisin films. The total amount of nisin was found to be 17.1 ± 2.2 μg cm−2 in (PAA–nisin)60 and 6.8 ± 0.4 μg cm−2 in (DX–nisin)60 films. The stability of the films was investigated at three different pH values of 6.0, 7.4 and 9.5. (PAA–nisin)60 films exhibited the release of nisin into the solution which resulted in the disintegration of the film over several hours. A burst release was observed in the first hour followed by a slower release and disintegration over 24 hours with a complete release at pH 9.5. The bacterial growth inhibition test against Staphylococcus epidermidis confirmed the antimicrobial activity of nisin released from PAA–nisin films. PAA was found to stabilize nisin and the film-released nisin retained its antimicrobial activity in the neutral and alkaline pH values. The antimicrobial activity of nisin was found to be enhanced significantly due to stabilization by PAA, by as much as a factor of 55 at pH 9.5. Unlike PAA–nisin films, (DX–nisin)60 films were stable at the physiological conditions up to 14 days with no release of nisin. DX–nisin films were found to inhibit the attachment of Staphylococcus epidermidis and prevent biofilm formation. These results clearly demonstrate the effect of different polyanions on nisin LbL films to achieve different mechanisms in antimicrobial efficacy and show the potential of PAA–nisin multilayer films as promising local delivery systems for treatment of burns and wounds, while DX–nisin multilayer films can be employed as stable coatings against bacterial attachment and biofilm formation.Conflicts of interest
There are no conflicts to declare.Acknowledgements
Hanan Fael acknowledges the postdoctoral research support from Institute of International Education and Koç University. The authors thank KUYTAM (Koç University Surface Technologies Research Center) for SEM and AFM characterizations, and Prof. Halil Kavaklı and Dr Ibrahim Barış for antimicrobial characterization.References
- G. Decher, J. Hong and J. Schmitt, Thin Solid Films, 1992, 210, 831–835 CrossRef
.
- B. M. Wohl and J. F. Engbersen, J. Contr. Release, 2012, 158, 2–14 CrossRef CAS PubMed
.
- K. Sato, K. Yoshida, S. Takahashi and J.-i. Anzai, Adv. Drug Deliv. Rev., 2011, 63, 809–821 CrossRef CAS PubMed
.
- F. Caruso, K. Niikura, D. N. Furlong and Y. Okahata, Langmuir, 1997, 13, 3427–3433 CrossRef CAS
.
- P. T. Hammond, Adv. Mater., 2004, 16, 1271–1293 CrossRef CAS
.
- W. Stockton and M. Rubner, Macromolecules, 1997, 30, 2717–2725 CrossRef CAS
.
- G. K. Such, A. P. Johnston and F. Caruso, Chem. Soc. Rev., 2010, 40, 19–29 RSC
.
- T. Serizawa, S. Kamimura, N. Kawanishi and M. Akashi, Langmuir, 2002, 18, 8381–8385 CrossRef CAS
.
- G. K. Such, J. F. Quinn, A. Quinn, E. Tjipto and F. Caruso, J. Am. Chem. Soc., 2006, 128, 9318–9319 CrossRef CAS PubMed
.
- E. Poptoshev, B. Schoeler and F. Caruso, Langmuir, 2004, 20, 829–834 CrossRef CAS PubMed
.
- D. Chen, M. Wu, J. Chen, C. Zhang, T. Pan, B. Zhang, H. Tian, X. Chen and J. Sun, Langmuir, 2014, 30, 13898–13906 CrossRef CAS PubMed
.
- A. Shukla, K. E. Fleming, H. F. Chuang, T. M. Chau, C. R. Loose, G. N. Stephanopoulos and P. T. Hammond, Biomaterials, 2010, 31, 2348–2357 CrossRef CAS PubMed
.
- B. Jiang and B. Li, Int. J. Nanomed., 2009, 4, 37 CAS
.
- C. Angebault and A. Andremont, Eur. J. Clin. Microbiol. Infect. Dis., 2013, 32, 581–595 CrossRef CAS PubMed
.
- W. Aoki, K. Kuroda and M. Ueda, J. Biosci. Bioeng., 2012, 114, 365–370 CrossRef CAS PubMed
.
- E. Gross and J. L. Morell, J. Am. Chem. Soc., 1971, 93, 4634–4635 CrossRef CAS PubMed
.
- H. G. Sahl, R. W. Jack and G. Bierbaum, Eur. J. Biochem., 1995, 230, 827–853 CrossRef CAS PubMed
.
- A. Karakas Sen, A. Narbad, N. Horn, H. M. Dodd, A. J. Parr, I. Colquhoun and M. J. Gasson, Eur. J. Biochem., 1999, 261, 524–532 CrossRef CAS PubMed
.
- A. Gálvez, H. Abriouel, R. L. López and N. B. Omar, Int. J. Food Microbiol., 2007, 120, 51–70 CrossRef PubMed
.
- A. Carmona-Ribeiro and L. de Melo Carrasco, Int. J. Mol. Sci., 2014, 15, 18040–18083 CrossRef CAS PubMed
.
- H. E. Hasper, B. de Kruijff and E. Breukink, Biochemistry, 2004, 43, 11567–11575 CrossRef CAS PubMed
.
- A. Bartoloni, A. Mantella, B. Goldstein, R. Dei, M. Benedetti, S. Sbaragli and F. Paradisi, J. Chemother., 2004, 16, 119–121 CrossRef CAS PubMed
.
- H. Hampikyan, J. Food Protect., 2009, 72, 1739–1743 CrossRef CAS PubMed
.
- E. Severina, A. Severin and A. Tomasz, J. Antimicrob. Chemother., 1998, 41, 341–347 CrossRef CAS PubMed
.
- K. Okuda, T. Zendo, S. Sugimoto, T. Iwase, A. Tajima, S. Yamada, K. Sonomoto and Y. Mizunoe, Antimicrob. Agents Chemother., 2013, 57, 5572–5579 CrossRef CAS PubMed
.
- P. D. Cotter, C. Hill and R. P. Ross, Nat. Rev. Microbiol., 2005, 3, 777 CrossRef CAS PubMed
.
- A. J. van Heel, M. Montalban-Lopez and O. P. Kuipers, Expet Opin. Drug Metabol. Toxicol., 2011, 7, 675–680 CrossRef CAS PubMed
.
- J. M. Shin, I. Ateia, J. R. Paulus, H. Liu, J. C. Fenno, A. H. Rickard and Y. L. Kapila, Front. Microbiol., 2015, 6, 617 Search PubMed
.
- T. D. Heunis, C. Smith and L. M. Dicks, Antimicrob. Agents Chemother., 2013, 57, 3928–3935 CrossRef CAS PubMed
.
- E. Faure, P. Lecomte, S. Lenoir, C. Vreuls, C. Van De Weerdt, C. Archambeau, J. Martial, C. Jérôme, A.-S. Duwez and C. Detrembleur, J. Mater. Chem., 2011, 21, 7901–7904 RSC
.
- W. Liu and J. N. Hansen, Appl. Environ. Microbiol., 1990, 56, 2551–2558 CrossRef CAS PubMed
.
- M. D. Adhikari, G. Das and A. Ramesh, Chem. Commun., 2012, 48, 8928–8930 RSC
.
- P. He and N. Hu, J. Phys. Chem. B, 2004, 108, 13144–13152 CrossRef
.
- S. Mohtashamian, S. Boddohi and S. Hosseinkhani, Int. J. Biol. Macromol., 2018, 107, 2730–2739 CrossRef CAS PubMed
.
- J. S. Association and Z. JIS, Japanese Industrial Standard JIS Z 2801: 2000, Japanese Standards Association, Tokyo, Japan, 2000 Search PubMed.
- R. T. Cleophas, J. Sjollema, H. J. Busscher, J. A. Kruijtzer and R. M. Liskamp, Biomacromolecules, 2014, 15, 3390–3395 CrossRef CAS PubMed
.
- G. Cheng, Z. Zhang, S. Chen, J. D. Bryers and S. Jiang, Biomaterials, 2007, 28, 4192–4199 CrossRef CAS PubMed
.
- D. Xiao, C. Gömmel, P. M. Davidson and Q. Zhong, J. Agric. Food Chem., 2011, 59, 9572–9580 CrossRef CAS PubMed
.
- R. Arnold, J. Colloid Sci., 1957, 12, 549–556 CrossRef CAS
.
- T. Swift, L. Swanson, M. Geoghegan and S. Rimmer, Soft Matter, 2016, 12, 2542–2549 RSC
.
- C. Porcel, P. Lavalle, V. Ball, G. Decher, B. Senger, J.-C. Voegel and P. Schaaf, Langmuir, 2006, 22, 4376–4383 CrossRef CAS PubMed
.
- C. Picart, J. Mutterer, L. Richert, Y. Luo, G. Prestwich, P. Schaaf, J.-C. Voegel and P. Lavalle, Proc. Natl. Acad. Sci. U. S. A., 2002, 99, 12531–12535 CrossRef CAS PubMed
.
- E. Hübsch, V. Ball, B. Senger, G. Decher, J.-C. Voegel and P. Schaaf, Langmuir, 2004, 20, 1980–1985 CrossRef
.
- M. Salomäki, I. A. Vinokurov and J. Kankare, Langmuir, 2005, 21, 11232–11240 CrossRef PubMed
.
- C. Porcel, P. Lavalle, G. Decher, B. Senger, J.-C. Voegel and P. Schaaf, Langmuir, 2007, 23, 1898–1904 CrossRef CAS PubMed
.
- P. Lavalle, C. Gergely, F. Cuisinier, G. Decher, P. Schaaf, J. Voegel and C. Picart, Macromolecules, 2002, 35, 4458–4465 CrossRef CAS
.
- N. S. Zacharia, M. Modestino and P. T. Hammond, Macromolecules, 2007, 40, 9523–9528 CrossRef CAS
.
- N. S. Zacharia, D. M. DeLongchamp, M. Modestino and P. T. Hammond, Macromolecules, 2007, 40, 1598–1603 CrossRef CAS
.
- L. Bennison, C. Miller, R. Summers, A. Minnis, G. Sussman and W. McGuiness, Wound Practice & Research: Journal of the Australian Wound Management Association, 2017, 25, 63 Search PubMed
.
- S. Ono, R. Imai, Y. Ida, D. Shibata, T. Komiya and H. Matsumura, Burns, 2015, 41, 820–824 CrossRef PubMed
.
- J. Hong, B.-S. Kim, K. Char and P. T. Hammond, Biomacromolecules, 2011, 12, 2975–2981 CrossRef CAS PubMed
.
- B. Bonev, J. Hooper and J. Parisot, J. Antimicrob. Chemother., 2008, 61, 1295–1301 CrossRef CAS PubMed
.
| This journal is © The Royal Society of Chemistry 2020 |

