Substituent effects on the aggregation-induced emission and two-photon absorption properties of triphenylamine–dibenzo[a,c]phenazine adducts†
Ji
Yang
a,
Yuting
Gao
a,
Tao
Jiang
a,
Wen
Liu
b,
Chenchen
Liu
a,
Niannian
Lu
a,
Bo
Li
c,
Ju
Mei
*a,
Qian
Peng
d and
Jianli
Hua
 *a
*a
aKey Laboratory for Advanced Materials, Institute of Fine Chemicals, College of Chemistry and Molecular Engineering, East China University of Science and Technology, 130 Meilong Road, Shanghai, 200237, China. E-mail: daisymeiju@ecust.edu.cn; jlhua@ecust.edu.cn; Fax: +86-21-64250940; Tel: +86-21-64250940
bState Key Laboratory of Modern Optical Instrumentations and Center for Optical and Electromagnetic Research, Zhejiang University, Hangzhou 310058, China
cKey Laboratory of Polar Materials and Devices, Ministry of Education, East China Normal University, Shanghai 200241, China
dKey Laboratory of Organic Solids, Beijing National Laboratory for Molecular Science, Institute of Chemistry, Chinese Academy of Sciences, Beijing 100190, China
First published on 28th February 2017
Abstract
Exploration of high-performance fluorescent materials, especially those with two-photon absorption and aggregation-induced emission (AIE) properties, is of great significance to both fundamental research and practical applications. In the present work, a series of triphenylamine–dibenzo[a,c]phenazine adducts (Q1–Q5) with triphenylamine (TPA) moieties decorated by substituents ranging from nil to alkyl (methyl/octyl) and finally to alkoxy (methoxyl/octyloxy) groups were elaborately designed and facilely synthesized. Their photophysical properties including one- and two-photon absorption properties have been systematically investigated to clarify the relationships between their structures and properties and to see how a small change in the structure makes big differences in their performances. The proterotype triphenylamine–dibenzo[a,c]phenazine (TPA–DBP) adduct Q1 and the alkyl-substituted TPA–DBP adducts (Q2 and Q3) show intramolecular charge transfer (ICT) plus aggregation-enhanced emission (AEE) features while the alkoxy-decorated TPA–DBP adducts, i.e., Q4 and Q5, exhibit typical AIE behaviors. The differences in their photophysical properties can be mainly ascribed to the substituent effects, which are closely associated with the RIM (restriction of intramolecular motion) mechanism. Moreover, the AIE-active red luminogen Q5 with the largest two-photon absorption cross-section (σ = 801 GM) and high brightness has been further fabricated into nanoparticles via a simple and well-established method to satisfy the requirements of in vivo two-photon fluorescence imaging of blood vessels. The water-dispersible and biocompatible PEG-modified nanoparticles of Q5 performed well as an effective contrast agent for the visualization of blood vasculature with high signal-to-noise ratios, low photodamage and deep-tissue penetration capability (100 μm).
Introduction
Exploring high-performance fluorescent materials has been and continues to be an active research topic due to its great significance for both fundamental research and practical applications. Among the various and numerous fluorogens, those possessing two-photon absorption (2PA) and two-photon fluorescence (2PF), and/or red fluorescence are the most popular. Materials with 2PA and 2PF properties have been receiving considerable attention because of their potential applications in three-dimensional optical data storage, frequency-upconverted lasing, optical power limiting, fluorescent probes, and bioimaging.1–4 Recently, more and more organic materials with large 2PA cross-sections have been investigated.5,6 The major construction strategy is to symmetrically or unsymmetrically introduce electron donors (D) and acceptors (A) to the end groups of the π-conjugated bridges, affording the so-called D–π–A systems.7 However, many such dyes exhibit obvious disadvantages, such as the aggregation-caused quenching (ACQ) effect, which have limited their further development.8 Red emitters are essential to full-color displays and white-light lighting as well as bioimaging, and hence are drawing extensive research interest.9–12 Owing to their large π-conjugation and planar configuration, the classical red fluorogens usually and inevitably encounter the same ACQ problem as 2PA luminogens and consequently suffer low luminescence efficiency in the aggregated state.13–15In 2001, Tang discovered an uncommon phenomenon called aggregation-induced emission (AIE).16 AIE compounds are almost non-luminescent in good solvents but become highly emissive in the aggregated state.17–19 Mechanistic studies suggested that the restriction of intramolecular motion (RIM), including rotation and vibration, in the aggregated or other condensed states was the main reason for the AIE effect.20 Owing to the uniqueness of the AIE effect, AIEgens have been intensively studied in various fields especially in the area of bio-sensing.18,21,22 However, most AIE compounds emit blue or green light. AIE materials with longer wavelength emissions are highly desirable, because blue and green luminescence could strongly interfere with the auto-fluorescence from biological tissues. Red emission can greatly facilitate the in vivo imaging of biological processes since fluorescence in the red region enables low interference with the biological autofluorescence and deep-tissue penetration.23–25 ACQ-to-AIE transformation has been reported to provide solutions to the development of efficient luminescent materials including 2PA fluorogens and red emitters.26–32 Recently, a few red fluorescent dyes with AIE properties, such as benzothiadiazole,32 quinoline-malononitrile,33 perylene bisimide26–28 and diketopyrrolopyrrole derivatives,34 have been synthesized by adopting the ACQ-to-AIE transformation strategy and successfully applied for the in vitro and in vivo imaging of biological structures such as organelles, cells and tissues.17,23,27,29,32,34–37 Despite this, the family of red-emissive and/or 2PA AIE systems still needs to be enlarged.
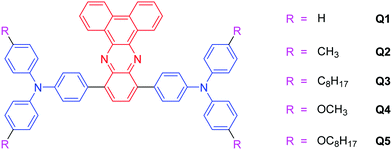
In order to explore more red-emissive systems, we carefully screened the potential building blocks and the dibenz[a,c]phenazine (DBP) unit caught our eye. DBP derivatives have proved to be promising acceptors in optical waveguide materials, fluorometric sensors and organic solar cells38–43 due to the presence of two symmetric unsaturated nitrogen atoms in the quinoxaline ring. Hence, the introduction of DBP is conducive to a lower bandgap, which helps to shift the emission spectra to or close to the red/near-infrared (NIR) region. Triarylamine is a traditional luminogen which has been widely used in opto- and electroactive materials for its good electron donating and transporting capability as well as its special propeller starburst molecular structure.44 Previously, we have successfully developed a near-infrared sensor for lysophosphatidic acid based on an unsymmetrical AIE-active TPA–DBP derivative.43 Finding the right balance between optical properties and molecular structures for optimized AIE and 2PA luminogens is difficult but quite necessary.34 Hence, in order to further enrich the variety of red-emissive AIEgens and systematically study the effect of substituents on the AIE and 2PA properties of TPA–DBP adducts, five symmetrical molecules (Q1–Q5) with D–A–D-type electronic structures were designed and synthesized in this work (Scheme 1). Interestingly, due to the small difference in their substituents, these five red fluorogens exhibit two distinct aggregation properties, namely ICT plus AEE and AIE. The two-photon absorption cross-sections (σ) of Q1–Q5 were 620, 178, 230, 225 and 801 GM, respectively. Such a minor change in structure exerting a dramatic effect on the properties of the dyes has been rarely reported. Given its remarkable AIE feature, high fluorescence quantum yield (Φ = 31.50%), good 2PA and 2PF properties, and long-wavelength absorption (λabs = 506 nm) and emission (λem = 640 nm), luminogen Q5 was encapsulated in PEGylated phospholipid nanomicelles and utilized to image the blood vessels of a mouse ear in vivo. The results demonstrate the capability of DSPE-PEG-encapsulated Q5 nanomicelles to serve as an efficient 2PF probe for bioimaging.
Results and discussion
Photophysical properties
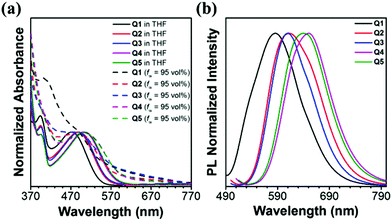
These five TPA–DBP adducts were prepared through straightforward synthetic routes as shown in the ESI.† All of them were synthesized via the Suzuki coupling reaction between 10,13-dibromodibenzo[a,c]-phenazine and the corresponding boracic acids. All the target compounds have been fully characterized by 1H and 13C NMR spectra as well as high resolution mass spectra. The corresponding spectra are shown in the ESI† in Fig. S1–S14.The absorption and emission spectra of these five luminogens in tetrahydrofuran (THF) and THF/H2O solutions with a water fraction (fw) of 95 vol% were recorded. As can be seen from the absorption spectra shown in Fig. 1a, each of these five dyes shows two distinct absorption bands in THF solution. Band I (393–394 nm) is assigned to the π–π* transition of the conjugated backbone, and band II spanning from 470 to 505 nm is attributed to the intramolecular charge transfer (ICT) between the triarylamine donors and the DBP acceptor. In other words, these five dyes are all typical D–A systems. More interestingly, Q2 displayed an absorption maximum at 487 nm which was enhanced in absorbance intensity and red shifted in wavelength (Δλabs = 15 nm) as compared with Q1. This might be because the electron-donating ability of the alkyl-substituted TPA is stronger than that of the triphenylamine moiety. The case is almost the same when Q3 is compared to Q1 (Table 1). Alkoxy-substituted TPA possesses stronger electron-donating ability than TPA and alkyl-decorated TPA, and therefore the maximum absorption wavelength of Q4 is red-shifted by 32 nm and 17 nm as compared to that of Q1 and Q2, respectively. Such a rule also works on Q5. The absorption tails of Q1–Q5 in the THF/water mixture with a water fraction of 95 vol% extending well into the long wavelength region indicated that the dyes aggregated into nanoparticles in the presence of water, and such level-off tails in the visible region are attributed to the Mie scattering caused by the nanosized particles.45 As depicted in Fig. 1b and Table 1, the emission maxima of Q1–Q5 in THF/H2O solutions with a water fraction of 95 vol% are located at 585, 612, 610, 650 and 640 nm, respectively. The blue-shifted maximum emission peak of Q1 in comparison with that of Q2 and Q3 is possibly due to a weaker ICT process. The relatively weaker ICT effect could also account for the bluer emissions of Q2 and Q3 when compared with those of Q4 and Q5.
| λ max-abs (sol.)/nm | λ max-em (sol.)/nm | λ max-abs (aggr.)/nm | λ max-em (aggr.) /nm | E HOMO /eV | E LUMO /eV | E g /eV | QYs, Φs/% | |
|---|---|---|---|---|---|---|---|---|
| a THF solutions. b In THF/water (5/95, v/v). c E HOMO = −e(Eox + 4.7) (eV). d E LUMO = −e(Ered + 4.7) (eV). e E g = ELUMO − EHOMO. | ||||||||
| Q1 | 472 | 610 | 481 | 585 | −5.81 | −3.35 | 2.46 | 30.53 |
| Q2 | 487 | 625 | 488 | 612 | −5.70 | −3.28 | 2.42 | 42.03 |
| Q3 | 487 | 625 | 489 | 610 | −5.72 | −3.29 | 2.43 | 59.04 |
| Q4 | 504 | 658 | 506 | 650 | −5.52 | −3.26 | 2.26 | 29.02 |
| Q5 | 504 | 658 | 506 | 640 | −5.55 | −3.27 | 2.28 | 31.50 |
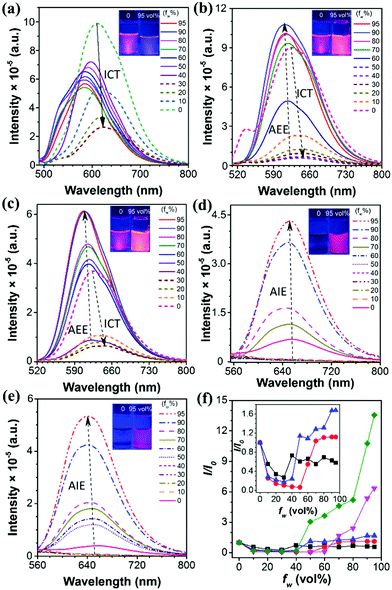
To further study the optical behaviors of these five compounds in the aggregated state, fluorescence tests were performed in THF/water solutions with different fws (Fig. 2a–e). These five compounds can be divided into two categories: Q1, Q2 and Q3 showed ICT plus AEE features while Q4 and Q5 are typical AIE luminogens. For example, Q2 dissolved in pure THF solution showed intense orange fluorescence with an emission maximum at 625 nm, however, the fluorescence intensity was dramatically decreased when a small amount of water was added, as evidenced by the weak emission in the THF/water mixtures with fw ≤ 50 vol%. Meanwhile, the emission maximum was red-shifted to about 650 nm. This is a typical ICT effect which features a red-shifted emission color and a decreased emission intensity with increasing solvent polarity.6 After more water (fw > 50 vol%) was added, the photoluminescence (PL) intensity began to increase, and the PL peak was blue-shifted, which is because the molecules started to aggregate, resulting in a less polar microenvironment for the luminogens. The polarity of the microenvironment kept decreasing with severer aggregation caused by the increased water fraction, accordingly giving rise to blue-shifted and enhanced emission.46 The same phenomenon can be observed for both Q1 and Q3. On the contrary, Q4 and Q5 showed an almost constant emission efficiency when the fw ≤ 60 vol% and 40 vol%, respectively, but exhibited a sharp increase in the fluorescence intensity when fw = 95 vol%, with the PL peaked at 650 nm and 640 nm, respectively. An approximate 6-fold and 14-fold increase in the PL intensity were observed for Q4 and Q5, manifesting their remarkable AIE effect as compared to Q1, Q2 and Q3 (Fig. 2f).
In order to investigate the luminescence properties of Q1–Q5 in the solid state, the measurement of their absolute fluorescence quantum yields (QYs, Φs) was performed. The Φs of Q1–Q5 are 30.53%, 42.03%, 59.04%, 29.03% and 31.50%, respectively as shown in Table 1. The solid-state QYs are increased by extending the lengths of alkyl/alkoxy chains, owing to the fact that the intermolecular π–π stacking interactions are more significantly weakened by the bulkier alkyl/alkoxy unit.47 In other words, the QY value of Q3 is higher than that of Q2 and meanwhile the QY value of Q5 is larger than that of Q4. In comparison with Q3, Q5 shows a lower fluorescence quantum yield, which is probably attributed to the stronger electron-donating ability and bulkier size of the alkoxy groups as compared to the alkyl groups. The stronger electron push–pull effect in Q5 might lead to a greater tendency of forming a CT (charge-transfer) complex in the excited state which could cause emission quenching to some extent. Moreover, the larger size of alkoxy groups would give rise to a looser molecular packing of Q5 in the aggregated state. In this case, the intramolecular motions of Q5 molecules cannot be restricted as efficiently as those of Q3, rendering a larger portion of the excitation energy to be consumed via a nonradiative pathway and hence resulting in lower fluorescence efficiency. Furthermore, our detector used in the absolute quantum yield measurements is less sensitive to the emission with longer wavelengths, i.e. especially the near infrared emission, which might also contribute to the smaller ΦF value of Q5, since the λem of Q5 is 640 nm while that of Q3 is 610 nm. Since Q3 and Q2 share similar optical properties and Q5 is analogous to Q4 with alkoxy-substituted triphenylamine units, Q5 is supposed to show a faster nonradiative decay as compared to Q3. This was proven by the reorganization energy versus the vibration normal modes in the ground state of Q1, Q2 and Q4 (Fig. 5). Moreover, to confirm the formation of nanoparticles (NPs), the particle size and size distributions of Q1–Q5 NPs were investigated by dynamic light scattering (DLS). The results displayed in Fig. 3 indicate that the mean diameters of these NPs are approximately 292, 126, 228, 190 and 200 nm, respectively. Scanning electron microscopy (SEM) was also performed to study the morphology of the NPs. The SEM results suggest that these NPs have a spherical shape with an average size of around 250, 120, 200, 180 and 190 nm, respectively, which are slightly smaller than those obtained by DLS due to the shrinking of the samples in the vacuum drying process. The size of the Q1 NPs is the largest due to the poorest solubility of Q1 in the mixture of THF and water with fw = 95 vol%. The sizes of the Q3 and Q5 NPs are larger than those of Q2 and Q4 because of their longer alkyl or alkoxyl chains. All these pieces of evidence indicated that the increased PL intensity was caused by aggregation, which further verified their ICT + AEE and AIE nature.
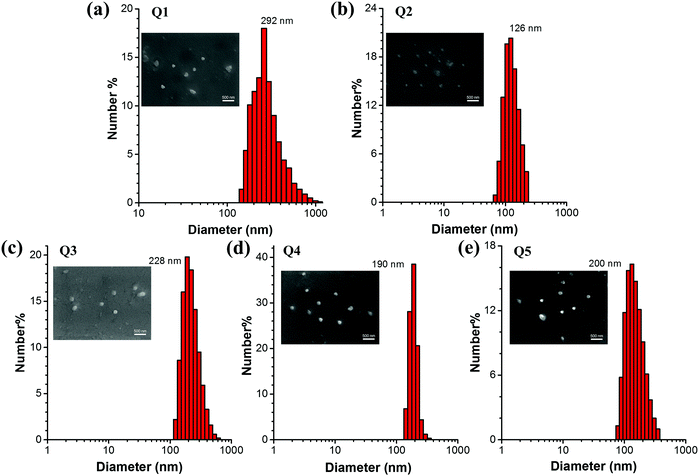 | ||
| Fig. 3 (a–e) DLS analysis of Q1–Q5 nanoaggregates in THF/water (5/95, v/v) mixtures at a concentration of 1 × 10⁻⁵ M. Inset: SEM images of Q1–Q5 nanoaggregates. The scale bar is 500 nm. | ||
Density functional theory (DFT) and time-dependent DFT (TDDFT) calculations were carried out in order to gain a deeper insight into the structure–property relationship of these TPA–DBP adducts. Q1, Q2 and Q4 were chosen as representatives for this computational study. Their molecular orbitals depicted in Fig. 4 suggested that the highest occupied molecular orbitals (HOMOs) of Q1 and Q2 are mainly extended over two TPA and benzene moieties, while the HOMO of Q4 is mostly localized on one TPA. The lowest unoccupied molecular orbitals (LUMOs) are distributed on the DBP moieties for these three compounds. These demonstrate the unambiguous inward intramolecular charge transfer process from the TPA peripheries to the DBP core and Q4 exhibits a much stronger ICT character relative to Q1 and Q2. In other words, in polar environments, Q4 undergoes faster intramolecular electron transfer from the donor to the acceptor.48 The formation of the charge-separated excited state may contribute to the fluorescence quenching behavior of Q4 in polar solvents.49 Hence, Q4 exhibits an obvious AIE effect in THF/water mixtures. Since both Q5 and Q4 possess alkoxy groups, the explanation for the AIE feature of Q4 should also be applicable to Q5. In THF solution, the fairly weak emission of Q5 thus could be put down to the synergistic effect of strong ICT and active intramolecular motions. It is possible that the alkoxy-substituted triphenylamine units in Q5 could easily undergo intramolecular rotations in solution, which serves as a more efficient relaxation channel for the excited state to decay.20,52 The more intense fluorescence of Q3 in THF might originate from the weaker ICT effect and the less vigorous intramolecular motions which could not efficiently consume the excitation energy via nonradiative channels. The faint solution-state emission and strong aggregated-state fluorescence make Q5 exhibit an AIE effect, while the intense solution-state emission prevents Q3 from being AIE-active. Therefore, Q3 showed ICT plus AEE features while Q5 behaved as a typical AIE luminogen. Moreover, the LUMO energy levels of these three compounds are almost identical due to the same charge density distributions, while the HOMO levels were lifted significantly from Q1 to Q4 due to the enhanced ICT character induced by the electron-donating alkyl and alkoxy groups. In other words, the stronger the electron-donating ability, the higher the HOMO energy level will be. Therefore, the band gaps of the triads decline in the order Q1 > Q2 > Q4, which is consistent with the absorption and emission spectral changes. The calculated peak maxima of the emission spectra are 576 nm for Q1, 588 nm for Q2, and 632 nm for Q4, respectively, being in good agreement with the experimental values measured above. The corresponding oscillator strengths are 0.3273 for Q1, 0.3227 for Q2, and 0.1297 for Q4, respectively. As a result, according to the rate formula kr = f × ΔE2/1.499, the radiative decay rate constant is reduced in the order of Q1 > Q2 > Q4 due to the decrease of the excitation energy (ΔE) and oscillator strength (f).
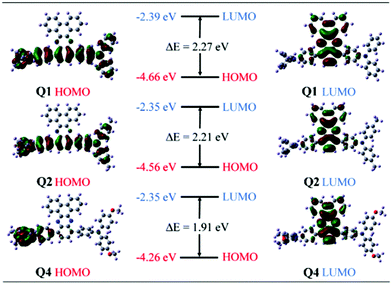 | ||
| Fig. 4 Molecular orbital amplitude plots of HOMO and LUMO energy levels of Q1, Q2 and Q4 at the B3LYP/6-31G* level. | ||
The reorganization energy is a parameter to characterize effective nonradiative decay channels50 and can be calculated by using  (ωi is the frequency and ΔD is the displacement of the ith normal mode) in the MOMAP program.51 The obtained reorganization energies are depicted in Fig. 5. The total energy of Q4 is much larger than those of Q1 and Q2, implying a faster nonradiative decay rate happening to Q4. Combining with the radiative decay rates analyzed above, Q4 should exhibit the lowest fluorescence quantum efficiency among these three compounds, being consistent with the experimental observation (Table 1). Also it can be seen from Fig. 5 that, different from Q1 and Q2, the low-frequency normal modes of Q4 make more significant contributions to the total reorganization energy and serve as more efficient relaxation channels for the excited state to decay.52 Since the vibrational motions of the low-frequency normal modes are very sensitive to the environment and can be hugely restricted by the surrounding intermolecular interaction in the aggregated state,50 the nonradiative decay rate of Q4 would be largely decreased when going from in solution to in the aggregated state. These lead to a more outstanding aggregation-induced emission effect in Q4 relative to Q1 and Q2, as observed in experiments. It is similar to Q5 with alkoxy-substituted triphenylamine units. Whereas, the intramolecular rotations of all these molecules are restricted due to the physical constraints in the aggregated state, consequently blocking the non-radiative path and activating the radiative decay.
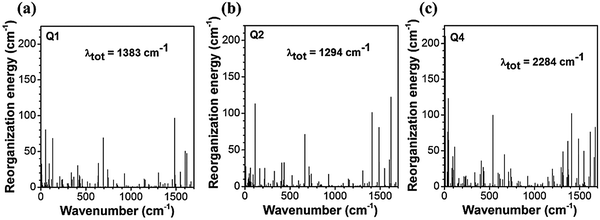 | ||
| Fig. 5 The reorganization energy versus the vibration normal modes in the ground state of Q1, Q2 and Q4. | ||
Two-photon absorption properties
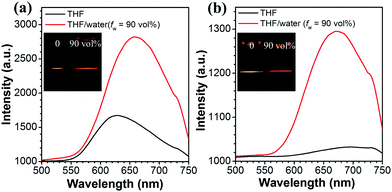
2PA cross-sections of Q1–Q5 were acquired by the femtosecond open aperture Z-scan technique. Fig. 6a–e show the open-aperture Z-scan data and 2PA coefficients obtained by data fitting. The σ can be estimated by using the equation σ = hνβN0, where N0 = NAC is the number density of the absorption centers, NA is the Avogadro constant, C represents the solute molar concentration and β is the 2PA coefficient.53,54 The values of σ for Q1–Q5 are 620, 178, 230, 255 and 801 GM at a wavelength of 800 nm, respectively. It can be seen that the σ values of Q3 and Q5 are larger than those of Q2 and Q4, respectively. It might be the solubility of Q3 and Q5 improved by the longer alkyl/alkoxy chains that plays an important part in increasing the σ value. Moreover, it can be seen that the σ of Q5 is much larger than that of Q3. Such a difference is probably ascribed to the stronger electron-donating ability of alkoxy groups in Q5 as compared to that of alkyl groups in Q3. The stronger electron-donating capability increases the extent of intramolecular charge transfer from the peripheral groups (electron-donors) to the core (electron-acceptor), resulting in a large increment in the 2PA cross-section.55 The two-photon excited fluorescence is slightly red shifted compared with one-photon excitation due to the reabsorption of partial fluorescence. The good overlap between one- and two-photon excited fluorescence suggested that the emissions resulted from the same excited state, regardless of the different excitation modes. As can be seen from Fig. 7 and its insets, the 2PF under the excitation of an 800 nm laser was significantly intensified by aggregation in the THF/water mixtures.Two-photon in vivo imaging
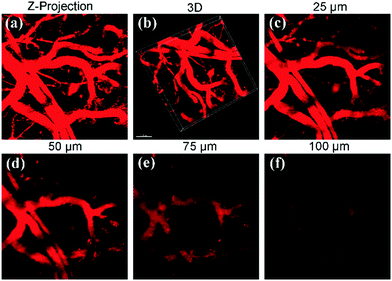
As mentioned in the Introduction section, two-photon fluorescence imaging is an appealing technique for biological research. Given its efficient two-photon excited red fluorescence (λem = 640 nm, Φ = 31.50%, σ = 801 GM), Q5 was chosen as a two-photon vasculature-labeling agent in the present study. Q5–PEG nanoparticles56 were fabricated for the in vivo 2PF imaging of blood vessels in the ears of live mice, with the excitation of an 800 nm femtosecond laser. Q5–PEG nanoparticles were prepared and afforded as stable micelles by a well-established approach. PEG was incorporated, for one thing, to improve the biocompatibility of the labeling system in blood vessels, and for another to enhance the uptake efficiency of the imaging agent. Fig. 8a shows the Z-projection image of blood vessels in the ear skin and Fig. 8b displays a 3D reconstructed image of the blood vasculature network within a region of the ear dermis using Q5–PEG nanoparticles. It can be seen that, after being intravenously injected into the mouse ear, the Q5–PEG nanoparticles were well-distributed in the blood vessels due to the blood circulation. Upon two-photon excitation at 800 nm, bright red fluorescence can be clearly observed. With the help of such efficient two-photon excited red emission, blood vessels at a depth up to 100 μm in the mouse ear can be readily visualized. These data demonstrate that the Q5–PEG nanoparticles could be applied as an effective contrast agent for the specific visualization of blood vasculature in vivo with deep-tissue penetration.Conclusion
In this work, five TPA–DBP derivatives (Q1–Q5) were designed and synthesized with different substituents on the triphenylamine moieties. The substituents vary from hydrogen, methyl, octyl methoxyl to octyloxy groups. Both the absorption and emission properties of these TPA–DBP adducts are significantly influenced by the variation in substituents, owing to the difference in conjugation, D–A effects and molecular conformation. Non-substituted TPA–DBP derivative Q1 and the alkyl-substituted TPA–DBP derivatives Q2 and Q3 showed the combined features of ICT plus AEE. When the substitution was changed to the alkoxy groups, Q4 and Q5 exhibit obvious AIE effects with emission in the red region. DFT and TDDFT calculations illustrated the different twisted/distortion extents in the molecular structure. Moreover, the longer length of the carbon chain may give rise to higher fluorescence quantum yields and larger two-photon absorption cross-sections. In addition, the Q5–PEG nanomicelles have been successfully used for the 2PF in vivo imaging of vasculature in the mouse ear, and the 3D architecture of blood vessels was vividly reconstructed. Furthermore, the red fluorescence, AIE feature and 2PA properties collectively endowed these TPA–DBP adducts with great potential for real-time, in vivo and deep-tissue bioimaging.Experimental section
Materials
Tetrahydrofuran (THF) was pre-dried over 4 Å molecular sieves and distilled under an argon atmosphere from sodium benzophenone ketyl immediately prior to use. Chloroform and dichloromethane (DCM) were refluxed with calcium hydride and distilled before use. The 10,13-dibromodibenzo[a,c]phenazine42 and corresponding boracic acid54,57–59 were prepared according to the previously reported protocols. All the other reagents, proteins and fetal bovine serum were purchased from Sigma-Aldrich and used as received. The solutions for analytical studies were prepared with deionized water treated by a Milli-Q System (Billerica, MA, USA).Instruments
1H and 13C NMR spectra were recorded on a Bruker AM-400 spectrometer using chloroform-d (CDCl3) as solvent and tetramethylsilane (δ = 0) as internal reference. The UV/Vis spectra were measured on a Varian-Cary 500 spectrophotometer with 2 nm resolution at room temperature. The fluorescence spectra were acquired on a Varian-Cary fluorescence spectrophotometer. Time-resolved fluorescence measurements in this study were performed using the Edinburgh OB 900-L time-correlated single photon counting system (TCSPC). Emission was collected at a right angle with respect to the pump. With a temporal deconvolution from the system response function, a temporal resolution of ∼30 ps can be reliably obtained. The 2PA cross-sections of Q1–Q5 were measured using the femtosecond open-aperture Z-scan technique according to a previously described method.60 Two-photon excited fluorescence (2PF) was excited by femtosecond pulses with different intensities at a wavelength of 800 nm. The repetition rate of the laser pulses was 250 kHz, and the pulse duration was 80 fs. The measurement was performed at a fixed scattering angle of 90°. The size of the nanoparticles was determined by an ALV-5000 dynamic laser light scattering spectrometer (DLS). The SEM micrographs were obtained on a JEOL JSM-6360 scanning electron microscope.Synthesis of 4,4′-(dibenzo[a,c]phenazine-10,13-diyl)bis(N,N-di-p-tolylaniline) (Q2)
A mixture of 10,13-dibromodibenzo[a,c]phenazine (112 mg, 0.36 mmol), (4-(di-p-tolylamino)phenyl)boronic acid (310 mg, 0.71 mmol), and Pd(PPh3)4 (21 mg, 0.02 mmol) was dissolved in 15 mL of THF under an argon atmosphere. An aqueous solution of potassium carbonate (2 M, 5 mL) was added to the reaction solution and stirred at 80 °C for 12 h. After being cooled to room temperature, the reaction mixture was extracted by dichloromethane and water (3 × 15 mL). The combined organic layers were washed with water and dried over anhydrous Na2SO4. After the removal of solvent, the crude product was purified by column chromatography on silica gel using petroleum ether/DCM (1/1, v/v) as eluent to afford Q2 (295 mg, 51% yield) as an orange-yellow solid. 1H NMR (400 MHz, chloroform-d) δ 9.18 (dd, J = 7.9, 1.5 Hz, 2H), 8.55 (d, J = 8.1 Hz, 2H), 7.97 (s, 2H), 7.88 (d, J = 8.5 Hz, 4H), 7.81–7.74 (m, 2H), 7.69 (t, J = 7.5 Hz, 2H), 7.29–7.26 (m, 4H), 7.16 (q, J = 8.7 Hz, 16H), 2.36 (s, 12H). 13C NMR (100 MHz, chloroform-d) δ 147.75, 145.36, 141.09, 140.24, 138.82, 132.70, 132.16, 131.84, 131.70, 130.74, 129.95, 129.22, 127.99, 126.61, 124.95, 122.86, 121.66, 20.88. HRMS (ESI) (m/z): [M+] calcd for C60H46N4: 822.3722, found: 822.3729.Synthesis of Q5–PEG nanoparticles
500 μL chloroform solution of Q5 (2 mg mL−1) was added dropwise into 400 μL DSPE-mPEG5000 solution in chloroform (10 mg mL−1) via a syringe. After being sonicated for several minutes, the mixture solution was concentrated under vacuum using a rotary evaporator at 35 °C to remove the chloroform. 500 μL of deionized water was then added into the above flask and the solution was sonicated for several minutes. Finally, a transparent suspension containing Q5–PEG nanoparticles was prepared.Animal experimentation
Female white mice (ICR line) were obtained from the Laboratory Animal Center of Zhejiang University (Hangzhou, China). Mice were housed in cages in groups (5 mice per cage) and fed with standard mouse chow and water. The cages were maintained in a room with controlled temperature (25 ± 3 °C) and a 12 h light–dark cycle. The protocol of animal experiments was approved by the Institutional Ethical Committee of Animal Experimentation of Zhejiang University in China, and the experiments were performed strictly according to the governmental and international guidelines on animal experimentation. According to requirements for Biosafety and Animal Ethics, all efforts were made to minimize the number of animals used and their suffering.Computational details
The geometrical optimizations and vibrational frequencies of Q1, Q2 and Q4 were performed for the ground state (S0) at the mPW1B95/6-31G(d,p) level and for the excited state (S1) at the TD/mPW1B95/6-31G(d,p) level. The oscillator strengths were calculated based on the optimized equilibrium point at the S1 state. All the calculations were carried out by the D.01 version of the Gaussian 09 package.61 On the basis of the obtained optimized geometry coordinates and vibration normal mode vectors, the reorganization energies were obtained by using the MOMAP program developed in our group.Acknowledgements
For financial support of this research, we thank NSFC/China (21372082, 21421004 and 21572062), the National Basic Research 973 Program (2013CB733700) and the Programme of Introducing Talents of Discipline to Universities (B16017).Notes and references
- Y. Jiang, Y. Wang, J. Hua, J. Tang, B. Li, S. Qian and H. Tian, Chem. Commun., 2010, 46, 4689–4691 RSC.
- M. Pawlicki, H. A. Collins, R. G. Denning and H. L. Anderson, Angew. Chem., Int. Ed., 2009, 48, 3244–3266 CrossRef CAS PubMed.
- G. S. He, L. S. Tan, Q. Zheng and P. N. Prasad, Chem. Rev., 2008, 108, 1245–1330 CrossRef CAS PubMed.
- F. Meng, J. Mi, S. Qian, K. Chen and H. Tian, Polymer, 2003, 44, 6851–6855 CrossRef CAS.
- Y. Shen, A. J. Shuhendler, D. Ye, J. J. Xu and H. Y. Chen, Chem. Soc. Rev., 2016, 45, 6725–6741 RSC.
- W. Qin, D. Ding, J. Liu, W. Z. Yuan, Y. Hu, B. Liu and B. Z. Tang, Adv. Funct. Mater., 2012, 22, 771–779 CrossRef CAS.
- A. Abbotto, L. Beverina, R. Bozio, A. Facchetti, C. Ferrante, G. A. Pagani, D. Pedron and R. Signorini, Org. Lett., 2002, 4, 1495–1498 CrossRef CAS PubMed.
- R. Ullah and J. Dutta, J. Hazard. Mater., 2008, 156, 194–200 CrossRef CAS PubMed.
- K. R. J. Thomas, J. T. Lin, Y. T. Tao and C. H. Chuen, Adv. Mater., 2002, 14, 822–826 CrossRef CAS.
- C. T. Chen, Chem. Mater., 2004, 16, 4389–4400 CrossRef CAS.
- C. L. Chiang, M. T. Wu, D. C. Dai, Y. S. Wen, J. K. Wang and C. T. Chen, Adv. Funct. Mater., 2005, 15, 231–238 CrossRef CAS.
- W. C. Wu, H. C. Yeh, L. H. Chan and C. T. Chen, Adv. Mater., 2002, 14, 1072–1075 CrossRef CAS.
- B. J. Chen, X. Q. Lin, L. F. Cheng, C. S. Lee, W. A. Gambling and S. T. Lee, J. Phys. D: Appl. Phys., 2001, 34, 30–35 CrossRef CAS.
- V. Bulovića, A. Shoustikovb, M. A. Baldoa, E. Bosea, V. G. Kozlova, M. E. Thompsonb and S. R. Forrest, Chem. Phys. Lett., 1998, 287, 455–460 CrossRef.
- C. H. Chen, J. Shi and C. W. Tang, Macromol. Symp., 1998, 125, 1–48 CrossRef CAS.
- J. Luo, Z. Xie, J. W. Y. Lam, L. Cheng, B. Z. Tang, H. Chen, C. Qiu, H. S. Kwok, X. Zhan, Y. Liu and D. Zhu, Chem. Commun., 2001, 1740–1741 RSC.
- J. Mei, Y. Hong, J. W. Lam, A. Qin, Y. Tang and B. Z. Tang, Adv. Mater., 2014, 26, 5429–5479 CrossRef CAS PubMed.
- R. T. Kwok, C. W. Leung, J. W. Lam and B. Z. Tang, Chem. Soc. Rev., 2015, 44, 4228–4238 RSC.
- J. Liang, B. Z. Tang and B. Liu, Chem. Soc. Rev., 2015, 44, 2798–2811 RSC.
- J. Mei, N. L. Leung, R. T. Kwok, J. W. Lam and B. Z. Tang, Chem. Rev., 2015, 115, 11718–11940 CrossRef CAS PubMed.
- D. Ding, K. Li, B. Liu and B. Z. Tang, Acc. Chem. Res., 2013, 46, 2441–2453 CrossRef CAS PubMed.
- M. Wang, G. Zhang, D. Zhang, D. Zhu and B. Z. Tang, J. Mater. Chem., 2010, 20, 1858–1867 RSC.
- D. Ding, K. Li, W. Qin, R. Zhan, Y. Hu, J. Liu, B. Z. Tang and B. Liu, Adv. Healthcare Mater., 2013, 2, 500–507 CrossRef CAS PubMed.
- B. Law and C. H. Tung, Bioconjugate Chem., 2009, 20, 1683–1695 CrossRef CAS PubMed.
- D. Ding, K. Li, Z. Zhu, K.-Y. Pu, Y. Hu, X. Jiang and B. Liu, Nanoscale, 2011, 3, 1997–2003 RSC.
- Q. L. Zhao, S. Zhang, Y. Liu, J. Mei, S. J. Chen, P. Lu, A. J. Qin, Y. G. Ma, J. Z. Sun and B. Z. Tang, J. Mater. Chem., 2012, 22, 7387–7394 RSC.
- Q. L. Zhao, K. Li, S. J. Chen, A. J. Qin, D. Ding, S. Zhang, Y. Liu, B. Liu, J. Z. Sun and B. Tang, J. Mater. Chem., 2012, 22, 15128–15135 RSC.
- Q. L. Zhao, X. A. Zhang, Q. Wei, J. Wang, X. Y. Shen, A. J. Qin, J. Z. Sun and B. Z. Tang, Chem. Commun., 2012, 48, 11671–11673 RSC.
- W. Qin, D. Ding, J. Z. Liu, W. Z. Yuan, Y. Hu, B. Liu and B. Z. Tang, Adv. Funct. Mater., 2012, 22, 771–779 CrossRef CAS.
- W. Qin, K. Li, G. X. Feng, M. Li, Z. Y. Yang, B. Liu and B. Z. Tang, Adv. Funct. Mater., 2014, 24, 635–643 CrossRef CAS.
- Q. Zhao and J. Z. Sun, J. Mater. Chem. C, 2016, 4, 10588–10609 RSC.
- W. Qin, K. Li, G. Feng, M. Li, Z. Yang, B. Liu and B. Z. Tang, Adv. Funct. Mater., 2014, 24, 635–643 CrossRef CAS.
- Z. Guo, A. Shao and W.-H. Zhu, J. Mater. Chem. C, 2016, 4, 2640–2646 RSC.
- Y. Gao, G. Feng, T. Jiang, C. Goh, L. Ng, B. Liu, B. Li, L. Yang, J. Hua and H. Tian, Adv. Funct. Mater., 2015, 25, 2857–2866 CrossRef CAS.
- D. Ding, C. C. Goh, G. Feng, Z. Zhao, J. Liu, R. Liu, N. Tomczak, J. Geng, B. Z. Tang, L. G. Ng and B. Liu, Adv. Mater., 2013, 25, 6083–6088 CrossRef CAS PubMed.
- A. Shao, Y. Xie, S. Zhu, Z. Guo, S. Zhu, J. Guo, P. Shi, T. D. James, H. Tian and W. H. Zhu, Angew. Chem., Int. Ed., 2015, 54, 7275–7280 CrossRef CAS PubMed.
- A. D. Shao, Z. Q. Guo, S. J. Zhu, S. Q. Zhu, P. Shi, H. Tian and W. H. Zhu, Chem. Sci., 2014, 5, 1383–1389 RSC.
- R. Scaria, S. K. Dhawan and S. Chand, Synth. Met., 2014, 191, 168–176 CrossRef CAS.
- S. Narayanan, S. P. Raghunathan, S. Mathew, M. V. M. Kumar, A. Abbas, K. Sreekumar, C. S. Kartha and R. Joseph, Eur. Polym. J., 2015, 64, 157–169 CrossRef CAS.
- J. H. Kim, C. E. Song, H. U. Kim, I. N. Kang, W. S. Shin, M. J. Park and D. H. Hwang, J. Polym. Sci., Part A: Polym. Chem., 2013, 51, 4136–4149 CrossRef CAS.
- Y. F. Hou, G. Q. Xu, J. S. Zhao, Y. Kong and C. Yang, Acta Chim. Sin., 2014, 72, 1238–1244 CrossRef CAS.
- Y. Zhang, J. Zou, H.-L. Yip, K.-S. Chen, D. F. Zeigler, Y. Sun and A. K. Y. Jen, Chem. Mater., 2011, 23, 2289–2291 CrossRef CAS.
- T. Jiang, N. Lu, J. Yang, Y. Hang, J. Wang, P. Zhao and J. Hua, RSC Adv., 2015, 5, 102863 RSC.
- Z. J. Ning and H. Tian, Chem. Commun., 2009, 5483–5495 RSC.
- B. Z. Tang, Y. Geng, J. W. Y. Lam, B. Li, X. Jing, X. Wang, F. Wang, A. B. Pakhomov and X. X. Zhang, Chem. Mater., 1999, 11, 1581–1589 CrossRef CAS.
- M. D. Yang, Y. Zhang, W. J. Zhu, H. Z. Wang, J. Huang, L. H. Cheng, H. P. Zhou, J. Y. Wu and Y. P. Tian, J. Mater. Chem. C, 2015, 3, 1994–2002 RSC.
- X. Shen, G. Huang, K. Li, G. Zhang and D. Zhang, Sci. China: Chem., 2013, 56, 1197–1203 CrossRef CAS.
- S. Sasaki, G. P. C. Drummen and G.-i. Konishi, J. Mater. Chem. C, 2016, 4, 2731–2743 RSC.
- R. Qian, H. J. Tong, C. Huang, J. H. Li, Y. Tang, R. Wang, K. Y. Lou and W. Wang, Org. Biomol. Chem., 2016, 14, 5007–5011 CAS.
- Q. Peng, Y. Yi, Z. Shuai and J. Shao, J. Am. Chem. Soc., 2007, 129, 9333–9339 CrossRef CAS PubMed.
- Z. G. Shuai, Q. Peng, Y. L. Niu and H. Geng, MOMAP, Revision, 0.3.001, avaliable online: http://www.shuaigroup.net, Beijing, China, 2016.
- Y. Hong, J. W. Lam and B. Z. Tang, Chem. Commun., 2009, 4332–4353 RSC.
- Y. Gao, H. Zhang, T. Jiang, J. Yang, B. Li, Z. Li and J. Hua, Sci. China: Chem., 2013, 56, 1204–1212 CrossRef CAS.
- J. Yang, H. Tan, D. Li, T. Jiang, Y. Gao, B. Li, X. Qu and J. Hua, RSC Adv., 2016, 6, 58434–58442 RSC.
- Y. Jiang, Y. Wang, B. Wang, J. Yang, N. He, S. Qian and J. Hua, Chem. – Asian J., 2011, 6, 157–165 CrossRef CAS PubMed.
- D. Wang, J. Qian, S. He, J. S. Park, K. S. Lee, S. Han and Y. Mu, Biomaterials, 2011, 32, 5880–5888 CrossRef CAS PubMed.
- C.-L. Chang, C.-W. Liang, J.-J. Syu, L. Wang and M.-k. Leung, Sol. Energy Mater. Sol. Cells, 2011, 95, 2371–2379 CrossRef CAS.
- S. Maniam, A. B. Holmes, G. A. Leeke, A. Bilic and G. E. Collis, Org. Lett., 2015, 17, 4022–4025 CrossRef CAS PubMed.
- G. Lin, H. Peng, L. Chen, H. Nie, W. Luo, Y. Li, S. Chen, R. Hu, A. Qin, Z. Zhao and B. Z. Tang, ACS Appl. Mater. Interfaces, 2016, 8, 16799–16808 CAS.
- Z. Ning, Z. Chen, Q. Zhang, Y. Yan, S. Qian, Y. Cao and H. Tian, Adv. Funct. Mater., 2007, 17, 3799–3807 CrossRef CAS.
- G. W. T. M. J. Frisch, H. B. Schlegel, G. E. Scuseria, M. A. Robb, J. R. Cheeseman, G. Scalmani, V. Barone, B. Mennucci, G. A. Petersson, H. Nakatsuji, M. Caricato, X. Li, H. P. Hratchian, A. F. Izmaylov, J. Bloino, G. Zheng, J. L. Sonnenberg, M. Hada, M. Ehara, K. Toyota, R. Fukuda, J. Hasegawa, M. Ishida, T. Nakajima, Y. Honda, O. Kitao, H. Nakai, T. Vreven, J. J. A. Montgomery, J. E. Peralta, F. Ogliaro, M. Bearpark, J. J. Heyd, E. Brothers, K. N. Kudin, V. N. Staroverov, R. Kobayashi, J. Normand, K. Raghavachari, A. Rendell, J. C. Burant, S. S. Iyengar, J. Tomasi, M. Cossi, N. Rega, J. M. Millam, M. Klene, J. E. Knox, J. B. Cross, V. Bakken, C. Adamo, J. Jaramillo, R. Gomperts, R. E. Stratmann, O. Yazyev, A. J. Austin, R. Cammi, C. Pomelli, J. W. Ochterski, R. L. Martin, K. Morokuma, V. G. Zakrzewski, G. A. Voth, P. Salvador, J. J. Dannenberg, S. Dapprich, A. D. Daniels, Ö. Farkas, J. B. Foresman, J. V. Ortiz, J. Cioslowsk and D. J. Fox, Gaussian09, Gaussian Inc., Wallingford, CT, 2010 Search PubMed.
Footnote |
| † Electronic supplementary information (ESI) available. See DOI: 10.1039/c7qm00024c |
| This journal is © the Partner Organisations 2017 |

