Promoting solution-phase superlattices of CsPbBr3 nanocrystals
Noel
Mireles Villegas
 a,
Josue C.
Hernandez
 a,
Joshua C.
John
 b and
Matthew
Sheldon
 *ab
*ab
aDepartment of Chemistry, Texas A&M University, College Station, Texas 77842, USA. E-mail: sheldonm@tamu.edu
bDepartment of Material Science and Engineering, Texas A&M University, College Station, Texas 77840, USA
First published on 9th May 2023
Abstract
We present a size-selective method for purifying and isolating perovskite CsPbBr3 nanocrystals (NCs) that preserves their as-synthesized surface chemistry and extremely high photoluminescence quantum yields (PLQYs). The isolation procedure is based on the stepwise evaporation of nonpolar co-solvents with high vapor pressure to promote precipitation of a size-selected product. As the sample fractions become more uniform in size, we observe that the NCs self-assemble into colloidally stable, solution-phase superlattices (SLs). Small angle X-ray scattering (SAXS) and dynamic light scattering (DLS) studies show that the solution-phase SLs contain 1000s of NCs per supercrystal in a simple cubic, face-to-face packing arrangement. The SLs also display systematically faster radiative decay dynamics and improved PLQYs, as well as unique spectral absorption features likely resulting from inter-particle electronic coupling effects. This study is the first demonstration of solution-phase CsPbBr3 SLs and highlights their potential for achieving collective optoelectronic phenomena previously observed from solid-state assemblies.
Introduction
Recent progress in the synthesis of high-quality perovskite semiconductor nanocrystals (NCs) with the chemical stoichiometry CsPbX3 (X = Cl, Br, or I), has led to significant interest for their use as the optoelectronic components in technologies such as photovoltaics,4–6 LEDs7–10 and thermal-to-optical energy converters.11–15 For these applications the colloidal NCs must be isolated from the solvent phase and deposited as films in solid state device platforms, while preserving the near-unity photoluminescence quantum yield (PLQY) and minimal electronic trap states that characterizes an optimized synthetic preparation. During processing and film deposition it has been observed that CsPbX3 NCs can be assembled into superlattices (SLs) in which the cuboid nanoparticles form well-ordered, μm-sized aggregates with cubic, face-to-face stacking that extends in all three spatial dimensions.3,16 The SL geometry promotes enhanced inter-particle electronic coupling, giving rise to unique optoelectronic properties as a result of the more delocalized electronic structure.17–19 The observation of superfluorescence (SF),1,20,21 long exciton diffusion lengths,18 and extended exciton coherence times22,23 has led researchers to investigate how to optimally promote the self-assembly of SLs for applications in electrical-to-optical modulators,24 spectrally ultra-pure laser sources,25 and quantum computing.26–28 Notably, to date, these electronic coupling effects have only been observed in solid-state assemblies at cryogenic temperatures below 10 K.1,20,21 However, better control of the SL structure may allow for preservation of these unique collective electronic phenomena even at room temperature.25,29The overriding challenge for preparing SLs from NCs is the requirement of precise control over the ordering of matter at the atomic, nano- and mesoscale via self-assembly. Many different classes of colloidal NC materials have been shown to organize into SLs via a general strategy of controllably modulating interactions between NCs as they are transferred from the solvent phase to the solid-state.30–33 Several interrelated factors such as the NC composition, size, and surface chemistry, as well as characteristics of the environment such as solvent polarity, temperature, or externally applied fields entail that the ideal conditions are a complex optimization that is unique for each materials system.33–35 Slow solvent evaporation in combination with destabilization of the colloid suspension, often by perturbing the surfactant ligand chemistry or solvent polarity, is commonly employed to promote a time-controlled inter-particle contraction process.36,37 This must be carried out with extremely uniform distributions of the underlying NC dimensions to result in SLs with macroscopic dimensions.
Nevertheless, these strategies have met with limited success for CsPbX3 NCs primarily due to challenges maintaining structural and chemical stability during their processing and deposition. The generally poorer stability of CsPbX3 in comparison with other classes of colloidal NCs is a well-known issue. The ionic lattice and relatively soft mechanical properties result in low crystal energy, such that CsPbX3 NCs decompose in polar solvents or in ambient conditions with trace humidity.38 Weak and dynamic surface ligand binding further undermines colloidal stability and can lead to uncontrolled agglomeration and recrystallization of the NCs as the surface ligand shell is easily disrupted during conventional processing protocols.39,40 Typically, the crude product of a NC synthesis is isolated and purified by centrifugation after the addition of polar solvents to destabilize the colloid suspension. The undesirable consequence for CsPbX3 NCs is ligand stripping that introduces surface electronic defects and decreased PLQY, as well as NC recrystallization that disrupts the size uniformity necessary for successful self-assembly.41–43
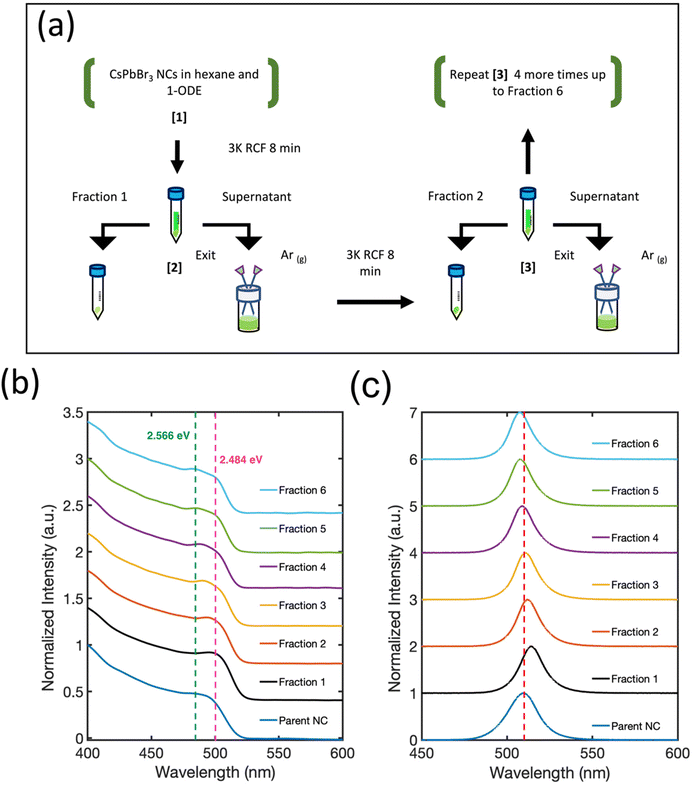
To address challenges related to post-synthetic processing, we have developed a method for isolating and concentrating size-selected fractions of CsPbBr3 NCs that provides exceptional preservation of their electronic and structural integrity. The key distinguishing feature is the intentional lack of polar solvents during cleaning and precipitation. Instead, two miscible non-polar solvents with high and low vapor pressure, hexane and 1-octadecene (1-ODE) respectively, are used to suspend the colloid. Multiple product fractions of CsPbBr3 NCs are obtained by performing a stepwise selective evaporation of hexane, concentrating the NC product in the remaining 1-ODE, followed by centrifugation (Fig. 1(a)). Analysis of the size distribution functions of the purified NC products by dynamic light scattering (DLS) indicates a continuous decrease in the average NC size and focusing of the NC size distribution within each subsequent isolated fraction. Remarkably, in combination with structural analysis of the resuspended NC product using small angle X-ray scattering (SAXS), we find that the purification steps promote solution-phase, simple cubic SLs with ∼1000–8000 NCs per supercrystal. The appearance of solution-phase SLs is correlated with clear evidence for inter-particle electronic coupling effects in the absorption spectrum. Additionally, we observe a systematic increase in the PLQY and corresponding decrease in photoluminescence lifetime with each additional purification step. Our findings suggest that when CsPbBr3 NCs are well-ordered into colloidally stable SLs their optoelectronic response is further improved by inter-particle electronic coupling effects.
Experimental
Chemicals
Cs2CO3 (99.9%), PbO (99%), oleic acid (OA, 90%), oleylamine (OAm, 70%), 1-octadecene (ODE, 90%) and hexane (95%) were received from Sigma-Aldrich. PbBr2 (98+%) was purchased from Alfa Aesar.Synthesis of CsPbBr3 NCs
A 25 mL 2-neck round bottomed flask was filled with Cs2CO3 (0.200 g), 1-ODE (10 mL), and OA (1 mL). The mixture was heated at 110 °C for 1 hour to obtain Cs-oleate. The resulting solution was then subjected to three cycles of vacuum flushing to remove trace gas byproducts. A 3-neck round bottom flask was filled with PbBr2 (0.060 g) and 1-ODE (5 mL) to form the lead halide precursor solution. This solution was heated at 120 °C under high vacuum for 1 hour. OAm and OA ligands were prepared by heating at 110 °C in glass vials equipped with septa caps, followed by three cycles of vacuum-to-argon flushing to remove trace water and gas byproducts. The Cs-oleate flask and the PbBr2 precursor solution were then placed under argon. The temperature of the Cs-oleate flask was increased to 150 °C, and the temperature of the PbBr2 solution was increased to 180 °C, OAm (0.5 mL) was injected into the PbBr2 precursor solution using a syringe, followed by the addition of OA (0.5 mL). The solubilization of PbBr2 was confirmed by the appearance of a clear and faint-yellow solution. The Cs-oleate precursor (0.4 mL) was swiftly injected into the solubilized PbBr2 precursor solution at 180 °C. The reaction mixture was immediately quenched using an ice-bath.Fractioning methods
The crude reaction product was centrifuged at 3000g-forces for 10 min. The supernatant was discarded, and the precipitate was resuspended in 4 mL of hexane and centrifuged again for 5 min at 3000g-forces. The resulting supernatant was transferred to a clear vail, and a small portion was set aside for analysis as the starting “Parent NC.” 3 mL of 1-ODE was added to the rest of the supernatant, resulting in the formation of a cloudy and yellow precipitate that was isolated by centrifugation for 8 minutes at 3000g-forces. This precipitate was designated as “Fraction 1,” and the remaining supernatant was transferred to a clear vial with a septa cap. Argon gas was supplied to one of the needles punctured through the septa to evaporate hexane from the solution, while the other needle allowed the escape of all gas. The evaporation cycle was repeated until all hexane was evaporated, with each cycle starting with a clear, bright green suspension and ending with the formation of a yellow, cloudy precipitate that was separated by centrifugation at 3000g-forces for 8 minutes and designated as an isolated fraction. On average, six product fractions were obtained and the left-over supernatant from final precipitation was composed of NCs in pure 1-ODE and was kept and labeled as “1-ODE NC.”Characterization
Transmission electron microscopy (TEM) images were taken using an FEI Tecnai G2 F20 ST FE-TEM operated at an accelerating voltage of 200 kV equipped with a Gatan CCD camera. Scanning electron microscope (SEM) images were taken using an FEI Helios NanoLab 460F1 DualBeam Focused Ion Beam (FIB)-SEM with secondary electrons (SE) at a current of 3.1 pA and using a low voltage electron beam (HV = 2 kV) to minimize charging. Absorption and photoluminescence spectra were collected on an Ocean Optics Flame-S UV-vis spectrometer with an Ocean Optics DH-2000-BAL deuterium and halogen lamp as the light source. The relative scattering measurements were performed using a pulsed white laser (NKT Photonics, SUPERK FIANIUM, FIR-15) coupled with a laser line tunable filter (LLTF) from Photon Etc. (LLTF CONTRAST VS-2) with the excitation source centered at 420 nm. An Ocean Optics Flame-S UV-vis spectrometer was placed perpendicular to the path of incidence to collect both the emission and the scattered excitation. Powder XRD measurements were performed using a Bruker-AXS D8 Advanced Bragg–Brentano Diffractometer with a Cu Kα radiation source (λ = 1.5418 Å). Photoluminescence lifetime was recorded under 80 ps pulsed excitation at 405 nm (PicoQuant, P-C 405) with a time-correlated single photon counting instrument (PicoHarp 300) and an avalanche photodiode (MPD PDM series) for detection. Absolute PLQY measurements were collected using an integrating sphere (Gigahertz-Optik, UPB-150-ARTA) equipped with a monochromator (Sciencetech, 9055-monochromator, grating 631-0037, 1200 l mm−1@500 nm) and a single channel detector (Sciencetech, S-025-TE2-H) using a pulsed white laser (NKT Photonics, SUPERK FIANIUM, FIR-15) coupled with a laser line tunable filter (LLTF) from Photon Etc. (LLTF CONTRAST VS-2) for excitation source. The Malvern Zeta sizer (Nano Series, Nano ZS) instrument was used to determine the hydrodiameter in the dynamic light scattering (DLS) experiments. SAXS data was measured on a Rigaku-S-MAX 3000 three-pinhole collimator system with rotating anode generator X-ray source (MicroMax-007 HF) and 2D configurable detector. The samples were measured inside 1.5 mm quartz flow cell capillary.Results and discussion
Methodology
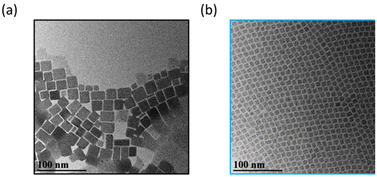
CsPbBr3 NCs were synthesized by following the protocol of Roman et al.13 The crude reaction product of “Parent NCs” was precipitated and then resuspended in hexanes with 1-ODE added as a cosolvent for the size-selective fractioning process, summarized by the schematic shown in Fig. 1(a). Upon 1-ODE addition, a yellow and cloudy precipitate formed and was separated from solution. This initial precipitate was termed as “Fraction 1.” Each subsequent fraction was isolated step-wise by repeating a cycle that started by evaporating hexane with Ar gas, and then centrifuging. Before hexane evaporation, the sample is a clear and bright green suspension. Evaporation is continued until the formation of a cloudy and yellow precipitate, followed by centrifugation and resuspension of the precipitate in hexane. The remaining supernatant undergoes further processing by repeating the same procedure until all of the hexane is evaporated, and multiple fractions are collected. The total number of sample fractions obtained is dependent on the concentration of the Parent NC suspension. For a given synthesis, an average of six product fractions were isolated and resuspended in hexanes to a final ∼0.80 μM concentration each, as determined by UV-Vis absorption. Fraction 5 and Fraction 6 were the lowest yield product fractions. More details of the synthesis and fractioning process are available in the Experimental section. Note that Fraction 1 was obtained prior to any hexane evaporation and comprises the most colloidally unstable NCs that are present in the starting colloid. Transmission electron microscopy (TEM) images, as shown in Fig. 2, reveal a marked improvement in NC shape and size achieved by the isolation and purification process leading to Fraction 6. We have achieved similar results for isolating CsPbCl3 and CsPbI3 NCs synthesized through similar methods. We suspect our method can be extended to other perovskite systems with similar NC surface chemistry since 1-ODE and hexane are commonly used solvent systems for these materials.Fig. 1(b) shows the absorption curves of the fractions and Parent NC suspensions shifted on the y-axis for ease of comparison. Compared with the Parent NCs, there is a minor improvement in the definition of the lowest energy exciton absorption feature around 2.484 eV (pink dotted line) for Fraction 2. For each subsequent fraction (Fig. 1(b)), splitting of the exciton absorption feature into two electronic states becomes prominent, with the energy separation between these states increased with each fraction. By Fraction 6, the two states give clear absorption features (Fig. 1(b)) at 2.566 eV (green dotted line) and 2.484 eV (pink dotted line). The samples show well-defined, symmetric photoluminescence emission spectra (Fig. 1(c)). The emission energy of Fraction 1 is red-shifted from the Parent NC since this fraction is made of the largest particles as seen by TEM in Fig. 2(a). The photoluminescence emission energy is continuously blue-shifted for Fractions 2–6, suggesting NCs of smaller dimensions with stronger quantum confinement effects for each subsequent fraction.
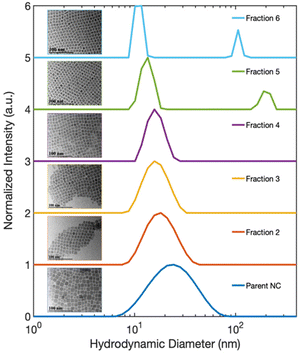
We used TEM to study the morphology of the NC fractions by diluting 1 drop of the stock solutions in 20 drops of hexanes. The diluted concentration ensured that individual NCs could be imaged. TEM images of Fraction 1 (Fig. 2(a)) revealed significant damage to the NC morphology manifest as corner-sharing NCs due to large-scale recrystallization. This oriented recrystallization and regrowth process is commonly observed in perovskite materials.43–46 In Fig. 3, TEM images of Fractions 2–6 and the Parent NCs are displayed as insets. Product Fractions 2–6 show cuboidal morphology, but the structural quality and uniformity improved significantly in the later fractions. The early fractions were characterized by large NCs with larger size variations, whereas the later fractions showed smaller, more uniformly sized NCs. Fractions 2 and 3 showed minor morphological damage due to oriented attachment and recrystallization at NC corners, similar but less pronounced than that observed in Fraction 1 (Fig. 2(a)). No such damage was found in Fractions 4, 5, and 6, indicating that smaller NCs in the later fractions have better colloidal stability.
Determining size-distribution functions of isolated fractions by DLS
To better understand the electronic structure indicated by the optical spectra, we analyzed the statistics of the NC sizes, i.e., the sample polydispersity. Our results rule out the possibility that a bimodal size distribution of NCs in the isolated fractions gave rise to the two different excitonic absorption features reported in Fig. 1(b). The size distribution functions of Parent NCs and the isolated fractions were obtained by performing DLS experiments. The DLS measurement determines the average hydrodynamic diameter of particles in solution. The DLS results (Fig. 3) show a decrease in the average diameter with increasing fraction number. This decrease is consistent with the continuously blue-shifted emission energy observed for each subsequent fraction in Fig. 1(c). In addition, a significant size focusing effect was observed. The monodispersity of Fraction 6 (Fig. 3, light blue trace) was improved by a factor of 10 compared to the Parent NC (Fig. 3, dark blue trace) as indicated by the full-width at half-maximum (FWHM) of the primary feature, termed “peak 1”, in the size distribution function. The diameter associated with peak 1 corresponds to free, isolated NCs in solution, and matches the diameters of individual NCs observed under TEM. Additionally, the size distribution functions for Fractions 5 and 6 show a second signal with a much larger diameter, labeled “peak 2”. This second feature corresponds to the SLs formed in solution, as further confirmed by SAXS (Fig. 4) studies detailed below. The SLs have an average diameter of 200 nm and 100 nm for Fraction 5 and 6, respectively. A quantitative summary of the parameters obtained from the size distribution functions is shown in Table 1. Importantly, the DLS data show that the splitting of the excitonic absorption features (Fig. 1(b)) is more pronounced when the uniformity of the NCs is improved, and the absorption feature is clearly correlated with the formation of SLs in solution.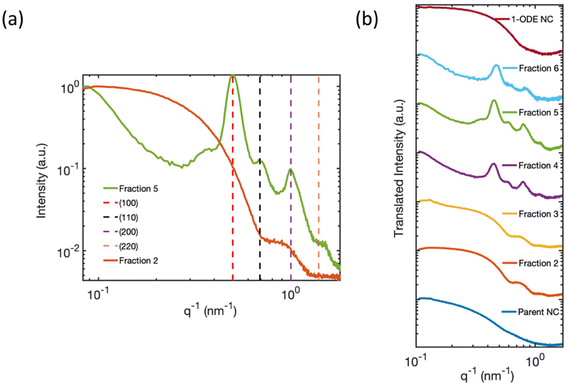 | ||
| Fig. 4 (a) Solution-phase SAXS pattern of Fraction 2 and Fraction 5 measured inside a capillary tube. The SAXS pattern of Fraction 5 (green trace), is index matched with a simple cubic superlattice corresponding to a SL constant of 12.6 nm. The decreasing slope at small q−1 in Fraction 5 originated from mesoscale SLs with an average size greater than 90 nm, beyond the length scale limit of detection. The SAXS pattern of Fraction 2 (orange trace) is consistent with isolated 8–10 nm cuboidal CsPbBr3 NCs.1,2 (b) Summary of the solution-phase SAXS pattern of Parent NCs, Fractions 2–6, and 1-ODE NC sample (maroon trace). The SAXS patterns are offset on the y-axis for ease of comparison. | ||
| Sample | Peak 1 max. (nm) | Peak 1 FWHM (nm) | Peak 2 max. (nm) | Peak 2 FWHM (nm) |
|---|---|---|---|---|
| Parent NC | 24 | 44 | — | — |
| Fraction 2 | 18 | 16 | — | — |
| Fraction 3 | 16 | 12 | — | — |
| Fraction 4 | 16 | 8 | — | — |
| Fraction 5 | 15 | 5 | 203 | 63 |
| Fraction 6 | 13 | 3 | 106 | 16 |
Structural analysis by SAXS and XRD
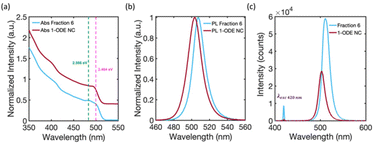
To uncover the 3D-structural information of the large-scale structures in the DLS signal, we measured the SAXS patterns of solution-phase suspensions of the isolated fractions inside capillary tubes. Fig. 4(a) compares the solution phase SAXS pattern of Fraction 2 and Fraction 5. The SAXS pattern of Fraction 2 is consistent with previous reports of highly monodisperse CsPbBr3 NCs, with an average cube-edge length of 8–12 nm.1,2 A broad, decreasing slope at small q−1 values indicates non-interacting and freely dispersed NC in solution.47 Additionally, the steep decline in the slope at low q−1 values for Fraction 5 suggests that the NCs were no longer freely dispersed and had formed larger structures greater than 90 nm in size.2,48,49 More precise estimate of the size of the structure is not possible based on the detection limit of our SAXS instrument. The large structure was highly crystalline, with Bragg reflection peaks identified at 0.50 nm−1, 0.69 nm−1, and 1.39 nm−1q−1 values. These peaks match well with the (100), (110), and (200) lattice planes of a simple cubic ordered SL. The strongest Bragg reflection at 0.50 nm−1 corresponds to a SL lattice constant, i.e., the periodic spacing of individual NCs in the SL, of 12.6 nm, which was consistent with the distance measured in the TEM image of Fraction 5 (Fig. 3 inset image). Fractions 4 and 6 showed similar Bragg peaks, but with slightly shifted q−1 values due to differences in the average NC particle size. The first fraction for which SL formation was observed varied from batch to batch depending on the quality of the Parent NC solution. However, SLs are typically observed staring at Fraction 4 and are always observed in Fractions 5 and 6. We can therefore confirm that the large-diameter signals in the DLS (Fig. 3) studies for Fractions 5 and 6 are due to the presence of significant numbers of SLs in solution. Fig. 4(b) summarizes all collected SAXS patterns for the fractions and the starting Parent NC suspension, allowing for visual comparison. The Parent NC (Fig. 4(b), dark blue trace) was composed of polydispersed and non-interacting NCs, as indicated by the broad slope at small q−1 values and absence of Bragg scattering from crystallographic planes.The SAXS pattern of the NCs that did not precipitate during the hexane evaporation process, and which remained in the pure 1-ODE supernatant, was also collected. This remaining supernatant, after all other fractions had been isolated, is referred to as 1-ODE NC. The SAXS pattern for 1-ODE NC (Fig. 4(b), maroon trace) showed no evidence of NC–NC interactions or mesoscale ordering. Instead, the scattering pattern was most closely related to that of the early fractions and the Parent NC (Fig. 4(b), dark blue trace), indicating the NCs that remained in the 1-ODE supernatant were freely dispersed. We then compared the absorption and photoluminescence spectra of the 1-ODE NC sample with that of Fraction 6 (Fig. 5). The comparison is provided, because these samples show photoluminescence emission at an energy that is more similar than any other fraction, suggesting the closest similarity in size. The peak photoluminescence emission for the 1-ODE NC sample was slightly blue-shifted and centered at 503 nm, compared to that of Fraction 6, which was centered at 507 nm. Despite being more quantum-confined than Fraction 6, the band-edge absorption structure of the 1-ODE NC sample (Fig. 5(a), maroon trace) did not show the same splitting of the excitonic feature observed in Fig. 5 (Fig. 5(a), light blue trace, splitting energies at 2.566 eV (green dotted line) and 2.484 eV (pink dotted line)) or the other fractions. Therefore, the splitting of energy states in the band-edge is only correlated with the mesoscale ordering of NCs into SLs, and it is not the result of quantum confinement effects. To evaluate the scattering induced by SLs in solution, we compared the relative scattering of Fraction 6 and 1-ODE NC. Both samples were excited with 420 nm light at equal concentrations, and the scattered excitation and photoluminescence were collected normal to the path of incidence. The spectra obtained for both samples are shown in Fig. 5(c), with scattered excitation observed at 420 nm for both. Our results indicated that the relative integrated scattering of the excitation beam by Fraction 6 was around 8.7 times greater than that by the 1-ODE NC sample. This increase in scattering from Fraction 6 provides further evidence supporting the observed formation of SLs in solution, as confirmed by DLS and SAXS studies.
Our structural analysis suggests that the self-assembly of NCs occurs in solution as a result of the hexane evaporation process. However, we cannot rule out other mechanisms that may lead to the formation of SLs, especially since recent reports suggest that NCs with near-ideal size distributions can become well-ordered in solution during their synthesis when local interactions favor spontaneous ordering.48,49 Further studies will be required to determine the full mechanism, as the solvent evaporation rate, the instantaneous concentration, and NC size disparity likely affect the SL formation in the solution phase. Nonetheless, our studies suggest that NC size dispersity is an important structural parameter that must be controlled during the formation of both solution and solid-state assemblies. Samples isolated by this method also formed well-ordered SLs in the solid state when solutions were drop-cast onto a silicon wafer substrate for powder X-ray diffraction (XRD) measurements (Fig. 6). We observed long-range structural coherence in the XRD patterns for all fractions, as evidenced by the presence of higher-order Bragg reflections. These Bragg reflections only occur if SLs made of well-defined and nearly identical NC shapes are present.3 The Bragg reflections around the peak at 2θ = 15° have been previously assigned to the (110), (1![[1 with combining macron]](https://www.rsc.org/images/entities/char_0031_0304.gif) 0), and (002) planes of orthorhombic CsPbBr3 NCs that are close-packed in SLs.3,16 The SL constant for each fraction was calculated as the separation distance between the (110) and (1
0), and (002) planes of orthorhombic CsPbBr3 NCs that are close-packed in SLs.3,16 The SL constant for each fraction was calculated as the separation distance between the (110) and (1![[1 with combining macron]](https://www.rsc.org/images/entities/char_0031_0304.gif) 0) planes using XRD. Our results showed SL constants of 15.4 nm, 15.1 nm, 14.4 nm, 13.1 nm, and 12.2 nm for Fraction 2, 3, 4, 5, and 6, respectively. The SL constants for Fractions 4–6 determined by SAXS (Fig. 4) are similar in magnitude to those measured through XRD and exhibit the same decreasing trend. The facile formation of solid-state SLs, like the ones measured by XRD, was further confirmed by scanning electron microscope (SEM) imaging as shown in Fig. 7(a) for a concentrated solution of Fraction 6 (30 μL with 0.8 μM concentration) drop-cast onto a gold substrate. The SLs prepared this way had an average length of 2.96 μm and width of 3.27 μm, larger than the solution-phase hydrodynamic diameter measured as peak 2 in the DLS studies shown in Fig. 3 and summarized by Table 1. The solid-state SLs were also imaged by TEM as shown in Fig. 7(b) by diluting 1 drop of the Fraction 6 stock solution with 5 drops of hexane, and then drop casting onto a carbon coated copper grid. The SLs have an average size of 100–150 nm, consistent with the average size measured by DLS for peak 2 in Fig. 3 and Table 1. Using the average size for peak 2 obtained by DLS measurements (Table 1), we estimated the size of SLs in solution for Fraction 6 to be 100 nm. Combining this with the average NC size of 8.5 nm by TEM (Fig. 3), we determined the approximate number of NCs per SL to be 1600. The observed differences in the dimensions of the SLs seen in the SEM and TEM images presented in Fig. 7 may be attributed to the higher concentration of the NCs used for deposition of the film imaged by SEM. This observation suggests that the NC concentration is an important factor in determining the ordering process and formation of solid-state SLs. Ongoing studies are currently focused on controlling the size of the SLs and identifying factors that modify the formation of solid-state assemblies in thin films.
0) planes using XRD. Our results showed SL constants of 15.4 nm, 15.1 nm, 14.4 nm, 13.1 nm, and 12.2 nm for Fraction 2, 3, 4, 5, and 6, respectively. The SL constants for Fractions 4–6 determined by SAXS (Fig. 4) are similar in magnitude to those measured through XRD and exhibit the same decreasing trend. The facile formation of solid-state SLs, like the ones measured by XRD, was further confirmed by scanning electron microscope (SEM) imaging as shown in Fig. 7(a) for a concentrated solution of Fraction 6 (30 μL with 0.8 μM concentration) drop-cast onto a gold substrate. The SLs prepared this way had an average length of 2.96 μm and width of 3.27 μm, larger than the solution-phase hydrodynamic diameter measured as peak 2 in the DLS studies shown in Fig. 3 and summarized by Table 1. The solid-state SLs were also imaged by TEM as shown in Fig. 7(b) by diluting 1 drop of the Fraction 6 stock solution with 5 drops of hexane, and then drop casting onto a carbon coated copper grid. The SLs have an average size of 100–150 nm, consistent with the average size measured by DLS for peak 2 in Fig. 3 and Table 1. Using the average size for peak 2 obtained by DLS measurements (Table 1), we estimated the size of SLs in solution for Fraction 6 to be 100 nm. Combining this with the average NC size of 8.5 nm by TEM (Fig. 3), we determined the approximate number of NCs per SL to be 1600. The observed differences in the dimensions of the SLs seen in the SEM and TEM images presented in Fig. 7 may be attributed to the higher concentration of the NCs used for deposition of the film imaged by SEM. This observation suggests that the NC concentration is an important factor in determining the ordering process and formation of solid-state SLs. Ongoing studies are currently focused on controlling the size of the SLs and identifying factors that modify the formation of solid-state assemblies in thin films.
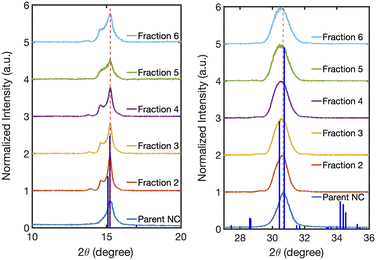 | ||
| Fig. 6 Powder XRD patterns of the Parent NCs and Fractions 2–6. The XRD patterns indicate an orthorhombic crystal phase for all samples. The dotted red lines are drawn at the 2θ = 15° and 30.6° reflection peak maxima of the Parent NCs. The XRD pattern for all the fractions shows peak splitting at 2θ = 15° due to the formation of SLs.3 The card-file for the orthorhombic crystal phase of CsPbBr3 (Pbnm, COD 1503362) is shown in blue bars. | ||
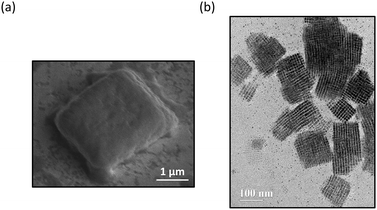 | ||
| Fig. 7 (a) SEM image of an isolated SL of Fraction 6 deposited onto a gold substrate. (b) TEM of multiple SLs of Fraction 6 deposited onto a carbon coated copper grid. | ||
Optoelectronic response of dispersed NCs vs. SLs
The isolated fractions were prepared with much greater uniformity of the NC size distribution compared to a conventional synthesis protocol. Therefore, we studied Fractions 2–6 to understand how the optoelectronic properties are modified as the NC size disparity is minimized, ultimately resulting in highly ordered SLs of emitters in the solution phase. Fig. 8 summarizes the room-temperature solution phase photoluminescence lifetime of Fractions 2–6. The radiative recombination rates for the fast and slow components were determined by fitting the photoluminescence time trace to a biexponential decay, | (1) |
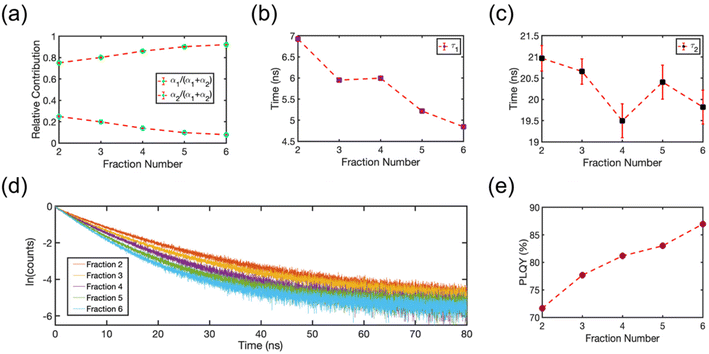 | ||
| Fig. 8 (a) Relative contribution of the fast (green circles) and slow (blue circles) component of the photoluminescence decay, α1 or α2, for each fraction. (b) Photoluminescence lifetime of the fast component, τ1, plotted for each fraction. (c) Photoluminescence lifetime of the slow component, τ2, plotted for each fraction. The error bars in (a–c) are 95% confidence intervals for the fitted terms in eqn (1). (d) Photoluminescence decay signal plotted for each fraction. (e) Absolute PLQY plotted for each fraction. The photoluminescence yield increases and the photoluminescence lifetime decreases as NCs assemble into SLs. | ||
To gain a deeper understanding of the photoluminescence decay kinetics, we measured the PLQY of the product fractions in solution. We used an integrating sphere with samples in a closed cuvette to perform the measurement at room temperature at the same concentration as the photoluminescence lifetime studies. To account for the large path-length of the integrating sphere and the spectral response of the setup, we corrected the PLQYs for any possible re-absorption effects and for the spectral response of the detection setup. Fig. 8(e) shows the absolute PLQY of the collected fractions in solution. The PLQY systematically increased with subsequent fraction number. Multiple previous studies suggest that accelerated photoluminescence decay kinetics, as reported Fig. 8(d), would be expected for NCs if the sample processing is stripping surface ligands and introducing a greater number of fast-quenching trap states that also lower PLQYs.50,51 However, the observed improvement of PLQY is in stark contrast to this commonly observed behavior that results from conventional cleaning and isolation strategies. This trend clearly illustrates that is it possible to isolate extremely uniform CsPbBr3 NCs with excellent optical properties. The isolated NCs in the early fractions and the SLs in the later fractions remained colloidally stable during structural and spectroscopic measurements and their optical quality remained constant over the course of six months when refrigerated and stored in an inert atmosphere. Further, the additional structure in the absorption spectra (Fig. 1(b)) is not due to the introduction of trap states or defects that compete with radiative recombination. Instead, these spectral features are plausibly explained by amplified electronic coupling interactions between NCs as they form into SLs. The splitting of the exciton absorption feature into two electronic states is a result of charge delocalization in SLs made of NCs. This is especially clear in the later fractions comprised of nearly identical NCs. The two absorption peaks observed at 2.566 eV and 2.488 eV in Fraction 6 (Fig. 1(b)) represent the energy levels of the hybridized electronic states. As observed in solid-state CsPbBr3 SLs, close packing of nearly identical NCs can result in the formation of minibands,19 due to the coupling of delocalized electronic states near the band-edge. These minibands, in turn, facilitate accelerated radiative recombination dynamics. We hypothesize a similar effect is occurring in the solution-phase SLs in our studies.
Conclusion
The structural quality of CsPbBr3 SLs is strongly linked to the size distribution of their constituent NCs, whereas the promising optoelectronic applications proposed for SLs also requires that the NCs maintain their defect-free electronic structure during the size-selective processing. Our results show that SLs of CsPbBr3 NCs form spontaneously in solution, and that this behavior can be promoted without degrading the underlying electronic structure of the NCs. Our report is the first analysis of the optical response of solution-phase CsPbBr3 SLs. Previously, SLs have only been observed in the solid state. In the solution-phase, it appears that CsPbBr3 SLs exhibit unique, accelerated radiative recombination dynamics that effectively improve the radiative recombination efficiency. Our study provides additional insight into possible strategies for further enhancing radiative recombination and outcompeting the kinetics of non-radiative electronic recombination.Conflicts of interest
The authors declare no competing financial interest.Acknowledgements
This work was supported by the National Science Foundation (Grant No. DMR-2131408) and the Welch Foundation (A-1886). The authors would like to thank Annika Lee in the Department of Chemistry at Texas A&M University for assistance with SEM imaging. The authors would like to thank Lanyin Luo and Alexei Sokolov in the Department of Physics at Texas A&M University for use of their PL lifetime setup.Notes and references
- F. Krieg, P. C. Sercel, M. Burian, H. Andrusiv, M. I. Bodnarchuk, T. Stöferle, R. F. Mahrt, D. Naumenko, H. Amenitsch and G. Rainò, ACS Cent. Sci., 2020, 7, 135–144 CrossRef PubMed.
- J. S. van der Burgt, J. J. Geuchies, B. van der Meer, H. Vanrompay, D. Zanaga, Y. Zhang, W. Albrecht, A. V. Petukhov, L. Filion and S. Bals, J. Phys. Chem. C, 2018, 122, 15706–15712 CrossRef CAS PubMed.
- S. Toso, D. Baranov, C. Giannini, S. Marras and L. Manna, ACS Mater. Lett., 2019, 1, 272–276 CrossRef CAS PubMed.
- K. T. Cho, S. Paek, G. Grancini, C. Roldán-Carmona, P. Gao, Y. Lee and M. K. Nazeeruddin, Energy Environ. Sci., 2017, 10, 621–627 RSC.
- M. A. Green, A. Ho-Baillie and H. J. Snaith, Nat. Photonics, 2014, 8, 506–514 CrossRef CAS.
- N. J. Jeon, J. H. Noh, Y. C. Kim, W. S. Yang, S. Ryu and S. I. Seok, Nat. Mater., 2014, 13, 897–903 CrossRef CAS PubMed.
- Y. Cao, N. Wang, H. Tian, J. Guo, Y. Wei, H. Chen, Y. Miao, W. Zou, K. Pan and Y. He, Nature, 2018, 562, 249–253 CrossRef CAS PubMed.
- K. Lin, J. Xing, L. N. Quan, F. P. G. de Arquer, X. Gong, J. Lu, L. Xie, W. Zhao, D. Zhang, C. Yan, W. Li, X. Liu, Y. Lu, J. Kirman, E. H. Sargent, Q. Xiong and Z. Wei, Nature, 2018, 562, 245–248 CrossRef CAS PubMed.
- M. H. Park, J. Park, J. Lee, H. S. So, H. Kim, S. H. Jeong, T. H. Han, C. Wolf, H. Lee and S. Yoo, Adv. Funct. Mater., 2019, 29, 1902017 CrossRef.
- Y. Shen, L. P. Cheng, Y. Q. Li, W. Li, J. D. Chen, S. T. Lee and J. X. Tang, Adv. Mater., 2019, 31, 1901517 CrossRef PubMed.
- M. A. M. Hasan, Y. Wang, C. R. Bowen and Y. Yang, Nano-Micro Lett., 2021, 13, 1–41 CrossRef PubMed.
- B. J. Roman and M. T. Sheldon, Nanophotonics, 2019, 8, 599–605 CrossRef CAS.
- B. J. Roman, N. M. Villegas, K. Lytle and M. Sheldon, Nano Lett., 2020, 20, 8874–8879 CrossRef CAS PubMed.
- K. Huang, K. K. Green, L. Huang, H. Hallen, G. Han and S. F. Lim, Nat. Photonics, 2022, 16, 737–742 CrossRef CAS.
- S. Ortega, M. Ibáñez, Y. Liu, Y. Zhang, M. V. Kovalenko, D. Cadavid and A. Cabot, Chem. Soc. Rev., 2017, 46, 3510–3528 RSC.
- F. Bertolotti, A. Vivani, F. Ferri, P. Anzini, A. Cervellino, M. I. Bodnarchuk, G. Nedelcu, C. Bernasconi, M. V. Kovalenko and N. Masciocchi, Chem. Mater., 2022, 34, 594–608 CrossRef CAS.
- D. D. Blach, V. A. Lumsargis, D. E. Clark, C. Chuang, K. Wang, L. Dou, R. D. Schaller, J. Cao, C. W. Li and L. Huang, Nano Lett., 2022, 22, 7811–7818 CrossRef CAS PubMed.
- E. Penzo, A. Loiudice, E. S. Barnard, N. J. Borys, M. J. Jurow, M. Lorenzon, I. Rajzbaum, E. K. Wong, Y. Liu and A. M. Schwartzberg, ACS Nano, 2020, 14, 6999–7007 CrossRef CAS PubMed.
- Y. Tang, D. Poonia, M. Van Der Laan, D. Timmerman, S. Kinge, L. D. Siebbeles and P. Schall, ACS Appl. Energy Mater., 2022, 5, 5415–5422 CrossRef CAS PubMed.
- I. Cherniukh, G. Rainò, T. Stöferle, M. Burian, A. Travesset, D. Naumenko, H. Amenitsch, R. Erni, R. F. Mahrt and M. I. Bodnarchuk, Nature, 2021, 593, 535–542 CrossRef CAS PubMed.
- G. Rainò, M. A. Becker, M. I. Bodnarchuk, R. F. Mahrt, M. V. Kovalenko and T. Stöferle, Nature, 2018, 563, 671–675 CrossRef PubMed.
- M. A. Becker, L. Scarpelli, G. Nedelcu, G. Rainò, F. Masia, P. Borri, T. Stöferle, M. V. Kovalenko, W. Langbein and R. F. Mahrt, Nano Lett., 2018, 18, 7546–7551 CrossRef CAS PubMed.
- H. Utzat, W. Sun, A. E. Kaplan, F. Krieg, M. Ginterseder, B. Spokoyny, N. D. Klein, K. E. Shulenberger, C. F. Perkinson and M. V. Kovalenko, Science, 2019, 363, 1068–1072 CrossRef CAS PubMed.
- C. R. Kagan and C. B. Murray, Nat. Nanotechnol., 2015, 10, 1013–1026 CrossRef CAS PubMed.
- J. G. Bohnet, Z. Chen, J. M. Weiner, D. Meiser, M. J. Holland and J. K. Thompson, Nature, 2012, 484, 78–81 CrossRef CAS PubMed.
- H. Altug, D. Englund and J. Vučković, Nat. Phys., 2006, 2, 484–488 Search PubMed.
- P. L. Gourley, Sci. Am., 1998, 278, 56–61 CrossRef CAS PubMed.
- Y.-J. Lu, J. Kim, H.-Y. Chen, C. Wu, N. Dabidian, C. E. Sanders, C.-Y. Wang, M.-Y. Lu, B.-H. Li and X. Qiu, Plasmonic Nanolaser Using Epitaxially Grown Silver Film, Science, 2012, 337, 450–453 CrossRef CAS PubMed.
- F. Mattiotti, M. Kuno, F. Borgonovi, B. Jankó and G. L. Celardo, Nano Lett., 2020, 20, 7382–7388 CrossRef CAS PubMed.
- C. B. Murray, C. R. Kagan and M. G. Bawendi, Annu. Rev. Mater. Sci., 2000, 30, 545–610 CrossRef CAS.
- M. Nakaya, Y. Tsuchiya, K. Ito, Y. Oumi, T. Sano and T. Teranishi, Chem. Lett., 2004, 33, 130–131 CrossRef CAS.
- E. V. Shevchenko, D. V. Talapin, C. B. Murray and S. O'Brien, J. Am. Chem. Soc., 2006, 128, 3620–3637 CrossRef CAS PubMed.
- I. Coropceanu, E. M. Janke, J. Portner, D. Haubold, T. D. Nguyen, A. Das, C. P. Tanner, J. K. Utterback, S. W. Teitelbaum and M. H. Hudson, Science, 2022, 375, 1422–1426 CrossRef CAS PubMed.
- M. A. Boles, M. Engel and D. V. Talapin, Chem. Rev., 2016, 116, 11220–11289 CrossRef CAS PubMed.
- J. Liu, X. Zheng, O. F. Mohammed and O. M. Bakr, Acc. Chem. Res., 2022, 55, 262–274 CrossRef CAS PubMed.
- M. Kapuscinski, P. Munier, M. Segad and L. Bergström, Nano Lett., 2020, 20, 7359–7366 CrossRef CAS PubMed.
- N. Mukharamova, D. Lapkin, I. A. Zaluzhnyy, A. André, S. Lazarev, Y. Y. Kim, M. Sprung, R. P. Kurta, F. Schreiber and I. A. Vartanyants, Small, 2019, 15, 1904954 CrossRef CAS PubMed.
- J. Ye, Z. Li, D. J. Kubicki, Y. Zhang, L. Dai, C. Otero-Martínez, M. A. Reus, R. Arul, K. R. Dudipala and Z. Andaji-Garmaroudi, J. Am. Chem. Soc., 2022, 144, 12102–12115 CrossRef CAS PubMed.
- R. Babu and S. P. Singh, Langmuir, 2018, 34, 15507–15516 CrossRef CAS PubMed.
- J. De Roo, M. Ibáñez, P. Geiregat, G. Nedelcu, W. Walravens, J. Maes, J. C. Martins, I. Van Driessche, M. V. Kovalenko and Z. Hens, ACS Nano, 2016, 10, 2071–2081 CrossRef CAS PubMed.
- M. I. Bodnarchuk, S. C. Boehme, S. Ten Brinck, C. Bernasconi, Y. Shynkarenko, F. Krieg, R. Widmer, B. Aeschlimann, D. Günther and M. V. Kovalenko, ACS Energy Lett., 2018, 4, 63–74 CrossRef PubMed.
- K. Chen, Q. Zhong, W. Chen, B. Sang, Y. Wang, T. Yang, Y. Liu, Y. Zhang and H. Zhang, Adv. Funct. Mater., 2019, 29, 1900991 CrossRef.
- J. Liu, K. Song, Y. Shin, X. Liu, J. Chen, K. X. Yao, J. Pan, C. Yang, J. Yin and L.-J. Xu, Chem. Mater., 2019, 31, 6642–6649 CrossRef CAS.
- J. Liu, K. Song, X. Zheng, J. Yin, K. X. Yao, C. Chen, H. Yang, M. N. Hedhili, W. Zhang and P. Han, J. Phys. Chem. Lett., 2021, 12, 10402–10409 CrossRef CAS PubMed.
- Y. Nagaoka, K. Hills-Kimball, R. Tan, R. Li, Z. Wang and O. Chen, Adv. Mater., 2017, 29, 1606666 CrossRef PubMed.
- Y. Tong, B. J. Bohn, E. Bladt, K. Wang, P. Müller-Buschbaum, S. Bals, A. S. Urban, L. Polavarapu and J. Feldmann, Angew. Chem., Int. Ed., 2017, 56, 13887–13892 CrossRef CAS PubMed.
- O. Glatter, J. Appl. Crystallogr., 1980, 13, 7–11 CrossRef CAS.
- H. Huang, M. W. Feil, S. Fuchs, T. Debnath, A. F. Richter, Y. Tong, L. Wu, Y. Wang, M. Döblinger and B. Nickel, Chem. Mater., 2020, 32, 8877–8884 CrossRef CAS.
- F. Montanarella, Q. A. Akkerman, D. Bonatz, M. M. van der Sluijs, J. C. van der Bok, P. T. Prins, M. Aebli, A. Mews, D. Vanmaekelbergh and M. V. Kovalenko, Nano Lett., 2023, 23(2), 667–676 CrossRef CAS PubMed.
- D. W. Dequilettes, K. Frohna, D. Emin, T. Kirchartz, V. Bulovic, D. S. Ginger and S. D. Stranks, Chem. Rev., 2019, 119, 11007–11019 CrossRef CAS PubMed.
- F. Xu, X. Kong, W. Wang, F. Juan, M. Wang, H. Wei, J. Li and B. Cao, J. Alloys Compd., 2020, 831, 154834 CrossRef CAS.
| This journal is © The Royal Society of Chemistry 2023 |

