
 Open Access Article
 This Open Access Article is licensed under a Creative Commons Attribution-Non Commercial 3.0 Unported Licence
Withania somnifera-derived carbon dots protect human epidermal cells against UVB-induced cell death and support growth factor-mediated wound healing†
Acharya
Balkrishna
abc,
Meenu
Tomar
a,
Kunal
Bhattacharya
 *a and
Anurag
Varshney
*abd
*a and
Anurag
Varshney
*abd
aDrug Discovery and Development Division, Patanjali Research Institute, Haridwar, India. E-mail: anurag@patanjali.res.in; anurag@prft.co.in; kunalbhattacharya@patanjali.res.in; kunalbhattacharya@prft.co.in
bDepartment of Allied and Applied Sciences, University of Patanjali, Haridwar, India
cPatanjali Yog Peeth (UK) Trust, 40 Lambhill Street, Kinning Park, UK
dSpecial Centre for Systems Medicine, Jawahar Lal Nehru University, New Delhi, India
First published on 9th December 2022
Abstract
Solar radiation comprising UVA and UVB regions is considered a skin-damaging factor inducing inflammation, oxidative stress, hyperpigmentation, and photo-aging. Photoluminescent carbon dots (CDs) were synthesized from the root extract of a Withania somnifera (L.) Dunal plant and urea, using a one-step microwave method. These Withania somnifera CDs (wsCDs) were 14.4 ± 0.18 d nm in diameter and presented photoluminescence. UV absorbance showed the presence of π–π* (C![[double bond, length as m-dash]](https://www.rsc.org/images/entities/char_e001.gif) C) and n–π* (CO) transition regions in wsCDs. FTIR analysis indicated the presence of nitrogen and carboxylic functional groups on the surface of wsCDs. HPLC analysis of wsCDs showed the presence of withanoside IV, withanoside V, and withanolide A. The wsCDs were found to be biocompatible in human skin epidermal (A431) cells and hindered UVB irradiation-induced loss of metabolic activity and oxidative stress. The wsCDs supported rapid dermal wound healing through augmented TGF-β1 and EGF gene expression levels in A431 cells. Finally, wsCDs were found to be biodegradable through a myeloperoxidase-catalyzed peroxidation reaction. The study concluded that under in vitro conditions, Withania somnifera root extract-derived biocompatible carbon dots provided photo-protection against UVB-stimulated epidermal cell damage and supported rapid wound healing.
C) and n–π* (CO) transition regions in wsCDs. FTIR analysis indicated the presence of nitrogen and carboxylic functional groups on the surface of wsCDs. HPLC analysis of wsCDs showed the presence of withanoside IV, withanoside V, and withanolide A. The wsCDs were found to be biocompatible in human skin epidermal (A431) cells and hindered UVB irradiation-induced loss of metabolic activity and oxidative stress. The wsCDs supported rapid dermal wound healing through augmented TGF-β1 and EGF gene expression levels in A431 cells. Finally, wsCDs were found to be biodegradable through a myeloperoxidase-catalyzed peroxidation reaction. The study concluded that under in vitro conditions, Withania somnifera root extract-derived biocompatible carbon dots provided photo-protection against UVB-stimulated epidermal cell damage and supported rapid wound healing.
1. Introduction
Sunlight is composed of 50% infrared, 40% visible, and 10% ultraviolet (UV) radiation. During outdoor activities, the skin is exposed to high levels of UV radiation depending upon the location on Earth, seasonal variation, and ozone layer thickness. Wavelengths of the solar UV radiation reaching the Earth's surface range between 290 and 400 nm and are further divided into UVA (400–315 nm) and UVB (315–290 nm) bands, which are typically present in a ratio of 41![[thin space (1/6-em)]](https://www.rsc.org/images/entities/char_2009.gif) :1.1 While UV exposure is beneficial for vitamin D production, too much of it can cause skin hyperpigmentation, photo-aging, cancer as well as sunburns that manifest as redness and painful blisters.2 In order to reduce dangerous UV exposure during prolonged outdoor activities, UV protection is administered in the form of sunscreen creams and sprays.
:1.1 While UV exposure is beneficial for vitamin D production, too much of it can cause skin hyperpigmentation, photo-aging, cancer as well as sunburns that manifest as redness and painful blisters.2 In order to reduce dangerous UV exposure during prolonged outdoor activities, UV protection is administered in the form of sunscreen creams and sprays.
In recent times, the cosmetic industry has flooded the market with sunscreens featuring a variety of organic and inorganic active components. However, according to the Environmental Protection Group (EWG), only one of four products exhibits efficient UVA and UVB protection.3 Additionally, a number of these sunscreens contain harmful chemicals that can injure individuals and the environment following an extended period of exposure. The United States Food and Drug Administration (US-FDA) has designated titanium dioxide (TiO2) and zinc oxide (ZnO) as GRASE ingredients up to a maximum level of 25 percent in certain over-the-counter sunscreen products.4 Other studies, however, have raised concerns regarding the consequences of human exposure/co-exposure to both TiO2 and ZnO nanoparticles that have been earlier reported as cyto and genotoxic.5,6 In China, co-exposure of cosmetic shop assistants/clerks to TiO2 and ZnO nanoparticles was found to elevate the levels of 8-hydroxy-2′-deoxyguanosine and creatinine in urine.7
Additionally, the non-biodegradable nature of inorganic sunscreens may make them accumulate and contribute to contamination of marine beaches, water, and aquatic life. Research conducted in aquatic environments has shown that exposure to nanoforms of TiO2 and ZnO may cause severe oxidative stress, and associated DNA strand breaks and adduct formations in organisms.8–10 TiO2 nanoparticle bioaccumulation in Danio rerio has been linked to altered hepatic superoxide dismutase levels, vacuolization, and disruption of the apical cytoplasm of intestinal epithelial cells.11 Environmental risks have also been linked to organic UV filters and their photocatalytic derivatives, including benzophenone and butyl methoxydibenzoylmethane.12–14 Hawaii has outlawed the use of sunscreens containing oxybenzone and octinoxate considering their contribution to marine pollution.15 Hence, the priority of the cosmetic industry has now shifted toward the creation of environmentally benign nanomaterials, that can serve as broad-spectrum UV protectors and nanocosmeceuticals.
Zero-dimension organic nanoparticles called carbon dots (CDs) exhibit exceptional biocompatibility and possess special features such as high quantum yield, photostability, hydrophilicity, and functional tunability.16,17 CDs have a diameter of less than 10 nm and are made up of carbon, hydrogen, nitrogen, and oxygen elements. Based on their chemical structure and surface functional groups, CDs can absorb a wide range of UV-irradiation and transform them into brilliant, tunable photoluminescence (PL).16,18 Parallel to this, CDs can function as nanocosmeceuticals and drug carriers for targeted therapeutic approaches and are biodegradable reducing their environmental footprint and organ-based bioaccumulation.19,20
The Indian traditional medical system known as ‘Ayurveda’ uses herbal, herbo-mineral, and mineral-based formulations for preventive and therapeutic approaches against diseases. Withania somnifera (L.) Dunal (family: Solanaceae) (WS) also known as ‘Winter Cherry’ is a small woody plant growing in the Indian subcontinent region. The plant's common name is ‘Aśvagandhā’ (in Sanskrit). WS is considered a powerful plant showing excellent medicinal properties based on its phytochemical constituent triterpenoid steroidal lactones known as ‘withanolides’.21 Numerous studies have highlighted the anti-inflammatory, anti-tumor, cardioprotective, neuroprotective, and anti-microbial effects of withanolides.21–24
In this study, we used a one-step microwave-based synthesis technique to create CDs from WS root hydromethanolic extract (WS extract). We have used the dynamic light scattering method (DLS), UV spectroscopy, and Fourier transform infrared (FTIR) spectroscopy for examining the size distribution, zeta potential, chemical structure, and surface functional groups of WS CDs (wsCDs). We have used UV and fluorescence scans to further analyze the wsCDs’ PL and UV absorption characteristics. We have scrutinized the biocompatibility, UVB protection, and anti-oxidant properties of wsCDs along with their growth factor-augmented wound healing qualities in human epidermal A431 cells. Finally, we investigated the oxidation-based enzymatic breakdown of wsCDs using a myeloperoxidase-based enzymatic degradation system to showcase their biodegradability and the stability of phytochemicals under different pH conditions.
2. Materials and methods
2.1 Reagents
The WS root sample was obtained from the herbal garden of the Patanjali Research Institute, Haridwar, India, and authenticated as per the Raw Materials Herbarium and Museum, CSIR-National Institute of Science Communication and Information Resources, Government of India, New Delhi, India (Authentication Voucher No. – NISCAIR/RHMD/Consult/2019/3453-54-15). The HPLC grade solvents acetonitrile, methanol, and orthophosphoric acid were obtained from Rankem, Gurugram, Haryana, India. Analytical grade potassium dihydrogen phosphate was procured from Merck & Co, Rahway, NJ, USA. Deionized water was obtained from a Milli-Q system (Millipore, Burlington, MA, USA). Standards for withanoside IV (purity, 96.2%), withanoside V (purity, 97.6%), withaferine A (Purity, 98.0%), withanolide A (purity, 97.5%), withanone (purity, 93.7%) and withanolide B (purity, 95.0%) were purchased from Natural Remedies, Bangalore, Karnataka, India.2.2 Hydromethanolic extraction of the WS root by the reflux extraction method
Two kilograms of WS root powder was transferred into a round bottom flask and suspended in 10 L of hydromethanolic (water:methanol (1:1 v/v)) solvent. Solubilized phytochemicals were extracted in the hydromethanolic solvent at 65–70 °C for 2 h under reflux conditions with constant stirring. The extract was filtered through a 1 μm Whatman nitrocellulose filter paper and refluxed again under the same conditions. The filtrate was pooled and dried using a rota-evaporator at 40–50 °C under vacuum conditions. A light brown to brown colored powder was obtained with a yield of 10.8% w/w.
2.3 Preparation of wsCDs
Synthesis of wsCDs was performed by mixing 1.0 g of dry WS root extract powder and 1.0 g of urea in a 1:1 ratio. Four hundred μL of N,N-dimethylformamide solution was added to the mixture. The mixture was kept 2 cm away from the center in a 900 watts domestic microwave (LG Electronics, Seoul, South Korea; Model: MC2846SL), and irradiated at full power for 2 min. The charred mixture turned dark chocolate brown color and was then cooled to room temperature (RT). Fifty milliliters of MilliQ water was added to the charred mixture and the suspension was homogenized at 10000 rpm for 10 min (Wiggens GmbH, Straubenhardt, Germany; Model: D-500). The homogenized solution was centrifuged at 13000 rpm for 45 min to remove the larger particles, agglomerates, and residues. The supernatant was collected and dialyzed through a DiaEasy™ Dialyzer (20 ml) MWCO 1 kDa (BioVision Inc., Waltham, MA, USA) overnight in MilliQ water at RT under constant stirring at 100 rpm using a magnetic stirrer. The dialyzed sample was removed and hot air oven-dried at 50 °C. Dried wsCD samples were stored at 4 °C for long-term storage.
2.4 Determination of phytochemical content of wsCDs
Standards for withanoside IV, withanoside V, withaferine A, withanolide A, withanone, and withanolide B were dissolved in methanol individually to prepare 1000 ppm standard stock solutions. For the analysis, 50 ppm of standard mix working solution was prepared from each withanolide standard stock solution. wsCD and WS extract samples were suspended in MilliQ H2O at a 100 mg ml−1 concentration for phytochemical profiling and processed for HPLC analysis. For pH stability of phytochemical analysis, 100 mg of wsCDs was suspended in 1 ml of MilliQ H2O with pH adjusted to 2.0, 7.0, and 10.0 and water-bath sonicated for 10 min in ice-cold H2O. The wsCD suspension was then incubated for 24 h at 37 °C. At the end of incubation, the particle suspension was filtered through a 0.1 μM PTFE syringe filter Whatman™ (Maidstone, United Kingdom). The filtrate was provided for HPLC analysis. HPLC-PDA analysis was performed on an HPLC (Prominence-iLC-2030c 3D Plus, Shimadzu, Japan) and separation was achieved using a Shodex C18-4E (5 μm, 4.6 × 250 mm) column subjected to binary gradient elution. A gradient solvent system of solvent A (prepared by dissolving 0.14 g potassium dihydrogen phosphate in 900 ml of water with the addition of 0.5 ml orthophosphoric acid and then diluting to 1000 ml with water) and solvent B (acetonitrile) was used. The gradient elution program used during the analysis consisted of 5–45% B for 0–18 min, 45–80% B from 18–25 min, 80% B from 25–28 min, 80–5% B from 28–30 min, and 5% B from 30–40 min. The flow rate was set at 1.5 ml min−1 for chromatographic separation. The chromatographic detection of all the analytes was performed using a PDA detector at 227 nm. Temperature of the column was kept at 27 °C and the sample injection volume was 20 μl.2.5 Particle size distribution and functional group analysis of wsCDs
For the analysis, 100 μg ml−1 of wsCDs and WS extract were suspended individually in MilliQ H2O. The suspensions were mixed thoroughly using a bath-sonicator filled with ice-cold H2O for 15 min. Particle size distribution and zeta potential analysis were performed using a Malvern Zetasizer Advance Series (Malvern, UK) and analyzed using associated software. Fluorescence spectrum (300–750 nm) scans in varying UVB ranges (280–320 nm) and UV absorption scan (200–400 nm) of wsCDs and WS extract were performed using an Envision instrument (PerkinElmer, Waltham, MO, USA). Surface functional group analysis of the dry WS extract and wsCD samples was performed using a Cary 630 FTIR instrument (Agilent Scientific Instruments, Santa Clara, CA, USA). The acquired spectra were processed using Spectraglyph software (Software-Entwicklung, Oberstdorf, Germany).2.6 A431 cell culture
Human epidermal A431 cells were obtained from the National Centre for Cell Science (NCCS), Pune (an Indian cell line repository for the American Type Culture Collection). The cells were grown in high-glucose DMEM-supplemented with 10% heat-inactivated FBS, 10 mM HEPES buffer, 100 IU ml−1 penicillin, 100 μg ml−1 streptomycin and 1% non-essential amino acids. For determining the % metabolic activity and reactive oxygen species (ROS) studies, A431 cells were plated at a concentration of 1 × 10⁴ per well in 96 well plates. For the cytotoxicity and gene expression studies, A431 cells were seeded at a density of 1 × 10⁵ per well in 12 wells plates. The cells were pre-incubated overnight before the treatments.2.7 Percentage metabolic activity and cytotoxicity analysis
For the dose–response study, A431 cells were treated with varying concentrations of wsCDs and WS extract for 24 h and % metabolic activity was measured using Alamar blue™ dye and in a separate set of experiments with Trypan blue® dye. Media alone was used as a negative control. For the UV irradiation study, the distance of the UV source from the bottom of the cell culture plate and treatment time were calibrated to 10 cm distance for 30 min exposure. A431 cells were pre-treated with varying wsCD and WS extract concentrations and incubated for 24 h. For UVB irradiation, the treatment medium containing wsCDs was removed from the A431 cells. Cells were washed with sterile phosphate-buffered saline (PBS) solution and 100 μl of PBS was added to each well. A431 cells were then irradiated with UVB for 30 min at a 10 cm distance from the light source. PBS was then again replaced with the respective treatment medium containing wsCDs and further incubated for 24 h. On the next day, % metabolic activity was measured using the Alamar blue™ assay and cytotoxicity was measured using Trypan blue® dyes. Fluorescence spectra of the metabolized Alamar blue™ was measured at ex. 560 nm/em. 580 nm wavelengths using an EnVision multimode plate reader (PerkinElmer, Waltham, MA). Cell metabolic activity percentages under all the conditions were calculated for treated versus unexposed controls. For the cytotoxicity study, Trypan blue® treated A431 cells were measured for the number of viable versus dead cells using a Biorad TC20 automated cell counter (Hercules, CA, USA).2.8 Intracellular ROS determination
A431 cells were pre-treated with varying wsCD concentrations and incubated for 24 h. For UVB irradiation, the treatment medium containing wsCD was removed from the A431 cells. Cells were washed and soaked in 100 μl of PBS in each well. A431 cells were then irradiated with UVB for 30 min at a 10 cm distance. PBS was then again replaced with the respective treatment medium containing wsCDs and further incubated for 2 h and 24 h. At the end of the treatment time, cells were washed with sterile PBS and treated with 2′,7′- dichlorofluorescein diacetate dye (10 μg ml−1) mixed in serum-free culture media. Cells were incubated in the dark for 45 min at 37 °C and then washed with PBS to remove the extracellular dye. The fluorescence intensity of the transformed dichlorofluorescein dye was measured using the ex: 490 nm/em: 520 nm wavelengths using an EnVision multimode plate reader (PerkinElmer, Waltham, MA).2.9 Gene expression study
A431 cells were pre-treated with varying wsCD concentrations and incubated for 24 h and then treated with UVB as mentioned previously. At 24 h post-UVB irradiation and wsCD therapeutic treatment, A431 cells were washed with cold PBS and lysed using RNeasy lysis buffer (Qiagen, Frederick, MD) liberating the total RNA content. Complementary DNA (cDNA) was synthesized using a one-step Verso cDNA synthesis kit (ThermoFischer Scientific Inc., Waltham, MA). The primers used in the study were:Transforming growth factor-beta 1 (TGF-β1; NCBI Gene ID: 7040): FW: 5′CAATTCCTGGCGATACCTCAG3′, REV: 5′GCACAACTCCGGTGACATCAA3′.
Epidermal growth factor (EGF; NCBI Gene ID: 1950): FW: 5′GTGCAGCTTCAGGACCACAA3′, REV: 5′AAATGCATGTGTCGAATATCTTGAG3′.
Beta-actin (β-actin; house-keeping gene: NCBI Gene ID: 11461): FW: 5′GGCTGTATTCCCCTCCATCG3′, REV: 5′CCAGTTGGTAACAATGCCATGT3’.
All the primers were mixed with SYBR-green universal master mix and real-time PCR (RT-PCR) assay was run on a qTower3G RT-PCR instrument (Analytik-Jena AG, Jena, Germany). Conditions were set as 40 cycles per RT-PCR run with denaturation at 95 °C for 10 min, annealing at 60 °C for 1 min, and extension at 75 °C for 15 s. Based on the obtained ‘Ct values’, relative mRNA expression fold changes were calculated.
2.10 Wound healing (scratch assay)
For the assay, 1 × 10⁵ A431 cells were plated in 12 well plates and pre-incubated overnight. The next day, cells were pre-treated with varying concentrations of wsCDs and incubated for 24 h. For the scratch assay, the old treatment medium of the cells was removed from the cells and 1 ml of sterile PBS was added to each well. Scratch was introduced using a sterilized 200 μl pipette tip and then washed with PBS for removing the detached cells. Fresh media containing varying wsCD concentrations were given to their respective wells and images were acquired for each well through a marked region (single location per well) between 0 and 10 h at 2 h intervals, using a Zeiss Promovert (Zeiss AM, Oberkochen, Germany) inverted microscope attached to Zeiss AxioVision software (version 4.9.1.0). Images were analyzed using ImageJ software using the macro ‘wound healing size tool’.25,26 The parameters selected for the analysis were wound width (μm) and wound healing percentage calculated using the imageJ software using the eqn (1) (ref. 26)| Wound healing (%) = (A(t0) − A(tΔ))/(A(t0)). | (1) |
2.11 Enzymatic biodegradation study
Enzymatic degradation assay was performed following the protocol mentioned by Mukherjee et al.27 Mixtures containing 5 μg ml−1 human origin MPO (Merck, Rahway, NJ, USA) per 50 μg of wsCDs (final concentration 100 μg ml−1) were suspended in 1 ml of autoclaved Milli-Q water containing 140 mM NaCl. H2O2 was added at a rate of 100 μM h−1 for 24 h. The MPO enzyme was replenished after 6 h and the reaction mixture was maintained at 37 °C. Equal amounts of wsCDs were suspended in 1 ml of autoclaved Milli-Q H2O and treated with/without H2O2 added at a rate of 100 μM h−1 for 24 h. At the end of the reaction time, the samples were immediately analyzed using a UV-1800 spectrometer (Shimadzu, Kyoto, Japan) for absorbance between 300 and 500 nm. The acquired spectra were processed using Spectraglyph software.2.12 Statistical analysis
All the experiments were performed in technical and biological triplicate and the results were presented as the mean ± SD. The results were analyzed by one-way ANOVA followed by Tukey's post hoc test using Graphpad software (GraphPad Software, Inc., La Jolla, CA, USA). Differences were considered statistically significant if p-value < 0.05.3 Results and discussion
3.1 Synthesis and physicochemical characterization of wsCDs
CDs can be fine-tuned in their functionality and PL properties through manipulation of their surface functional groups and chemical structures. In a recently published review, Ethordevic et al. put together a toolbox for the synthesis of CDs that may be functionalized according to their application needs.16 CDs may be created either by a top-down approach through disassembling of large carbon structures or by a bottom-up approach by constructing them from smaller carbon precursors. In the latter case, CDs are created using combustion/thermal/microwave/solvothermal techniques. One-step microwave-based synthesis of CDs has grown in popularity since it is an inexpensive method and produces little residual waste.28A 900 watt domestic microwave was used to synthesize wsCDs from a 1:1 ratio (w/w) mixture of WS extract and urea. These wsCDs had a hydrodynamic diameter of 14.4 ± 0.18 d nm (Fig. 1A) and a zeta potential of −3.9 ± 2.7 mV (Fig. 1B). In contrast, WS extract showed a size distribution of more than 1 μm (data not shown). Urea serves as a nitrogen functional group donor in this synthesis, presenting N–H groups on the surface of wsCDs.16 Contrasting with the turbid brown characteristic of their parent WS extract, the wsCDs projected a chocolate brown hue under ambient light (Fig. 1C). The synthesized wsCDs showed a blue colored PL when excited at UVB range wavelengths of 280–320 nm (Fig. 1D and F). In contrast, WS extract showed a low intensity fluorescence emission possibly originating from the presence of fluorescent aromatic and phenolic natural compounds (Fig. 1D and E).29 Maximum PL emission from the wsCDs was found at ex. 320 nm with an em. at 430 nm (Fig. 1F). The intensity of PL from wsCDs was 6× times higher than that of PL from WS extract at the highest emission wavelength (ex. 320 nm and ex. 430 nm) (Fig. 1E and F). In CDs, the presence of emissive traps, triplet carbenes at the zigzag edges, aromatic conjugate structures, and attached chemical groups such as carboxyl and oxygen-rich hydroxyl groups all contribute to the blue color PL.30–32
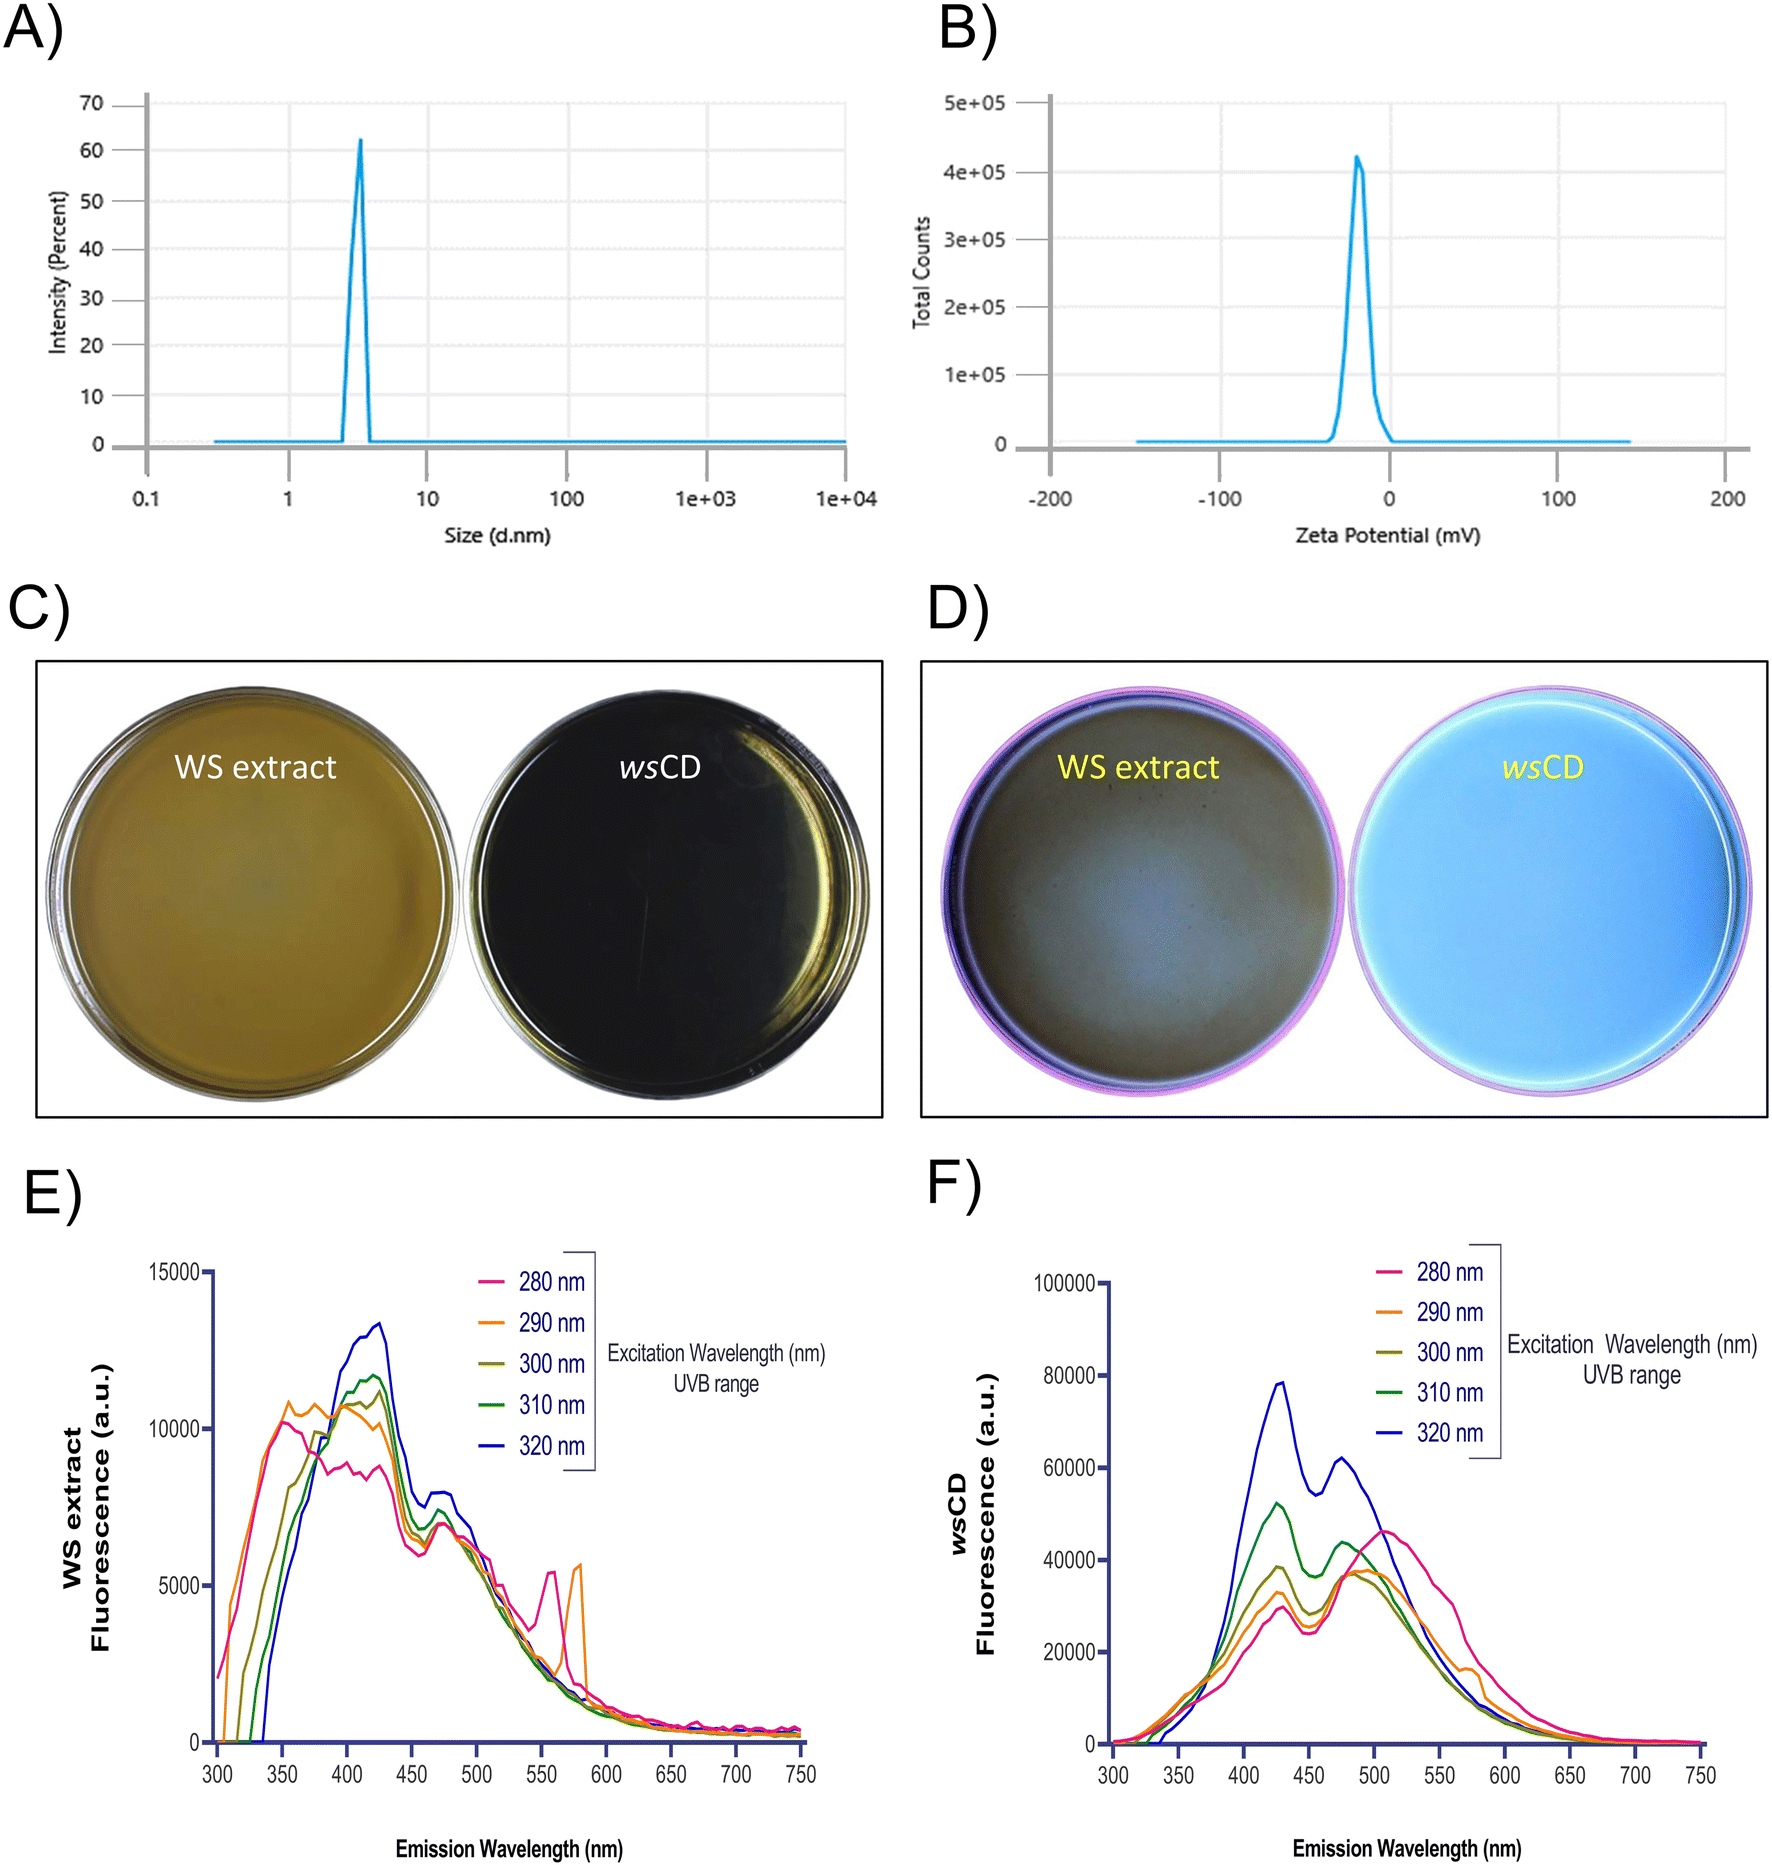 | ||
| Fig. 1 Physicochemical analysis of wsCDs and WS extract. (A) Particle size distribution of carbon dots; (B) zeta potential of carbon dots; (C) image of WS extract and wsCDs under white light; (D) photoluminescence of WS extract and wsCDs under UV excitation; (E) fluorescence emission scan of WS extract at varying UVB excitation wavelengths; (F) fluorescence emission scan of wsCDs at varying UVB excitation wavelengths. | ||
UV spectrum analysis of wsCDs revealed absorbance between 200 and 270 nm, with the λmax at 227 nm (Fig. 2A). This region of the UV absorbance spectrum has been attributed to the π–π* transitions of CC bonds belonging to the carbon core of the sp2 domain.33 A second UV absorbance shoulder peak was observed between 279 and 400 nm range ascribed to the n–π* transition of CO surface groups.33 As a result, the chemical structure of wsCDs revealed the existence of sp2 transition CC and CO bonds (Fig. 2A). Other CDs synthesized from herbal and animal origin sources have shown a similar presence of π–π* and n–π* electronic transition regions in their UV absorbance spectra.34,35 It is interesting to note that these previous investigations have also reported a brilliant blue PL emission from their CDs when exposed to UV light, which is comparable to that from wsCDs. FTIR spectroscopy reveals the chemical nature of functional groups present on the surface of the nanomaterials. FTIR analysis of the wsCDs revealed the presence of N–H and O–H (stretching modes) between 3463 and 3186 cm−1, C–H (stretching mode) at 2920 cm−1, large CC (stretching mode) at 1662 cm−1, CO (stretching mode) at 1600 cm−1, C–O–H (bending mode) at 1412 cm−1, and C–O–C (stretching mode) at 1069 cm−1 (Fig. 2B). Similar functional groups have been observed previously using FTIR in other synthesized CDs.36–39 The results revealed the presence of amino and carboxylic groups on the surface of the wsCDs originating from the urea doping and microwave-based oxidation process. In the WS extract, O–H (stretching mode) was observed at 3308 and 2922 cm−1 originating from compounds containing phenol and carboxylic acid (Fig. 2B). A peak originating from N–H originating from aliphatic primary amines was observed at 1618 cm−1. A peak originating from C–O–H was observed at 1316 cm−1 originating from phenol (Fig. 2B). FTIR peaks originating from different phytochemicals present in the WS extract have been extensively discussed by Das et al.40 HPLC analysis showed the presence of withanoside IV, withanoside V, and withanolide A phytochemicals in wsCDs (Table 1). Due to the loss of withaferin A in wsCDs, the overall withanolide concentration (3.21 μg mg−1) was found to be lower than that of WS extract (4.05 μg mg−1) (Fig. 3A and B; Table 1 and ESI Fig. S1A and B†). Studies using the microwave process have shown that withaferin A is liberated from WS extract.41 Hence, it is possible that the microwave-based synthesis process and dialysis of the wsCDs might have completely removed withaferin A from nanoparticles (Table 1).
 | ||
| Fig. 2 Chemical structure and surface functional group analysis. (A) Chemical structure analysis of WS extract and wsCDs using UV absorption spectroscopy; (B) surface functional group analysis of WS extract (blue) and wsCDs (red) using Fourier transform infrared spectroscopy. | ||
| S. No. | Marker compounds | WS extract (μg mg−1) | wsCD (μg mg−1) |
|---|---|---|---|
| 1 | Withanoside IV | 1.604 | 1.998 |
| 2 | Withanoside V | 0.779 | 1.168 |
| 3 | Withaferine A | 0.916 | ND |
| 4 | Withanolide A | 0.749 | 0.047 |
| Total withanolide | 4.048 | 3.213 | |
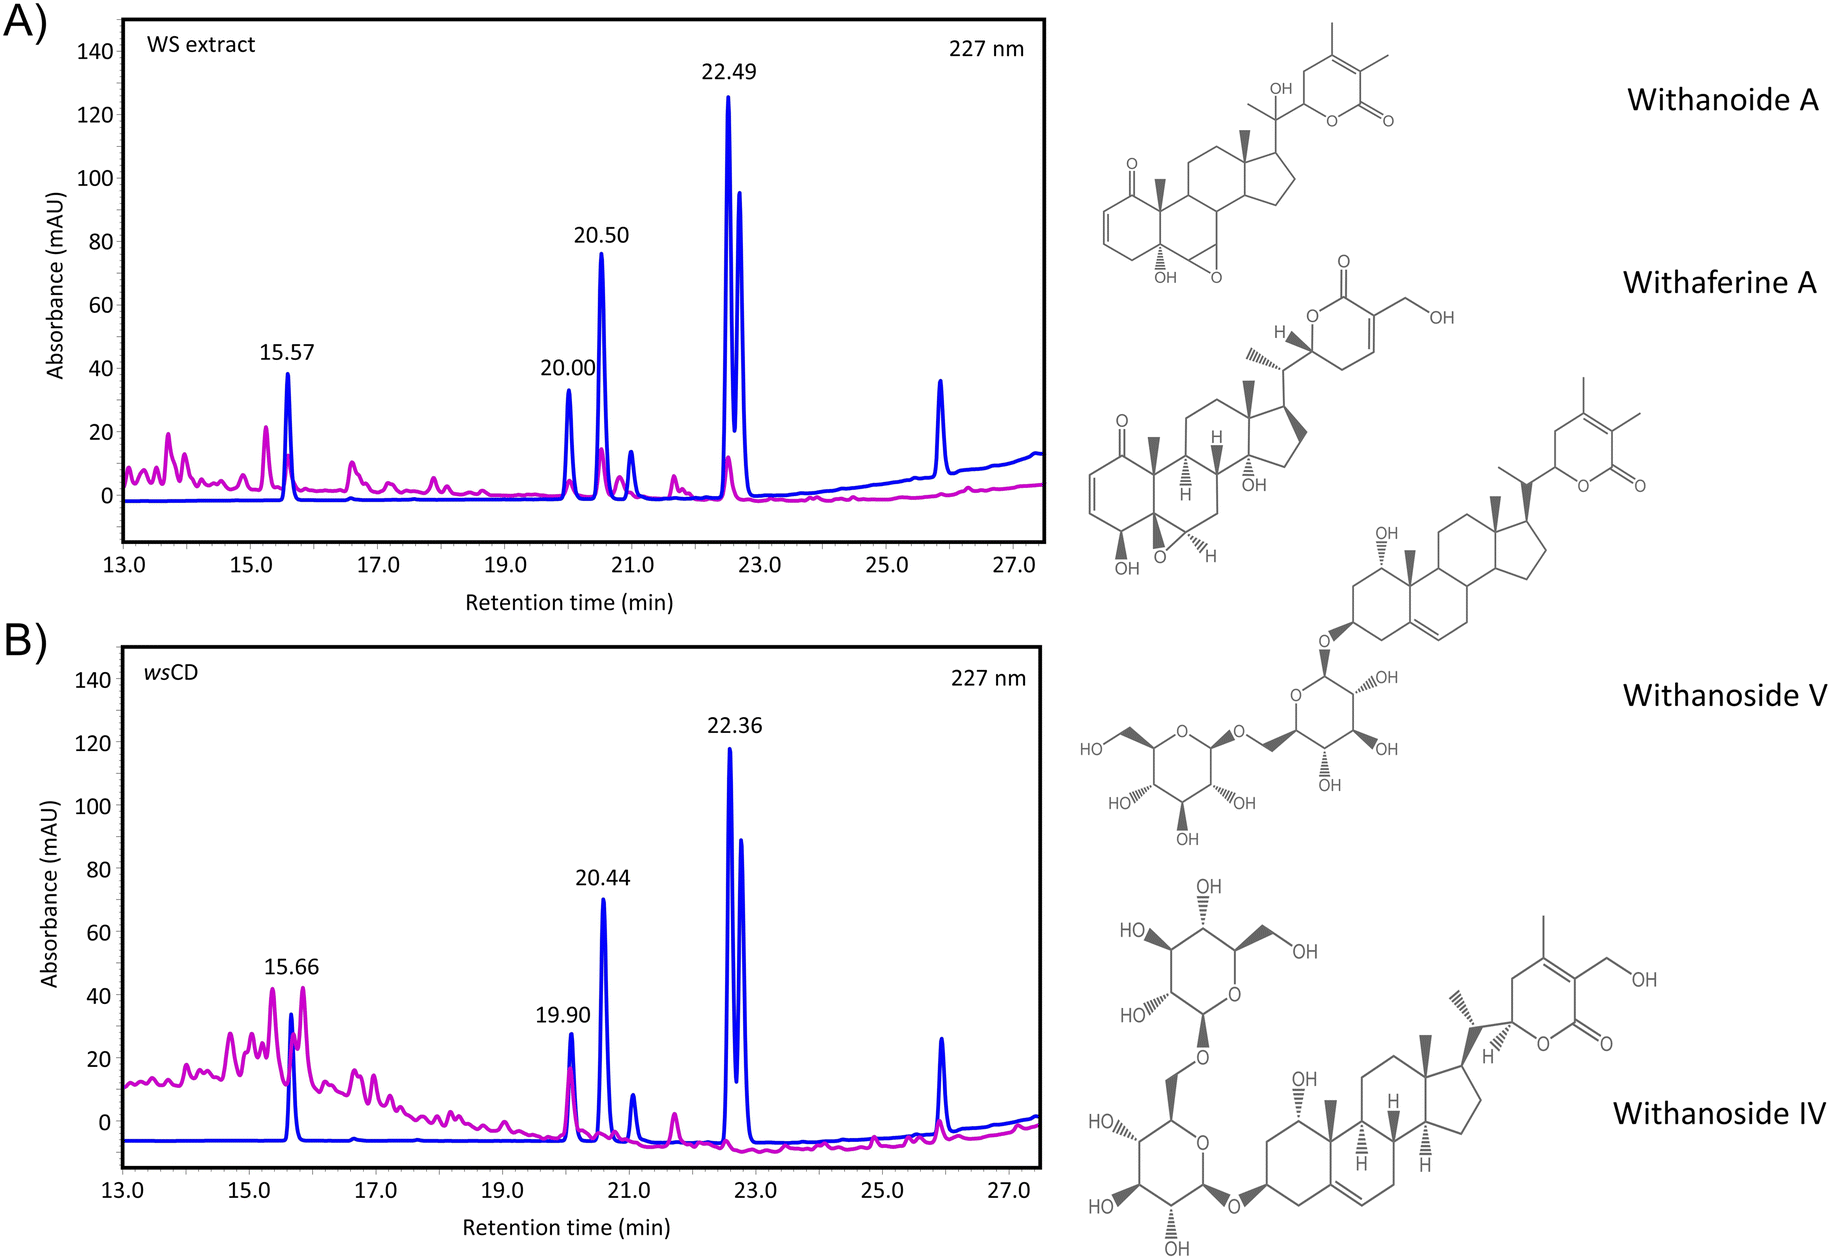 | ||
| Fig. 3 Phytochemical profiling of wsCDs and WS extract. (A) High-performance liquid chromatography analysis of WS extract for phytochemical profiling: withanoside IV (15.57 min); withanoside V (20.00 min); withaferine A (20.50 min), and withanolide A (22.49 min) (B) high-performance liquid chromatography analysis of wsCDs for phytochemical profiling: withanoside IV (15.66 min); withanoside V (19.90 min); withaferine A (20.44 min), and withanolide A (22.36 min). Quantitative data are presented in Table 1. The complete HPLC spectral range is provided in ESI Fig. S1A and B.† | ||
3.2 Biocompatibility, photo-protection, and antioxidant activity of wsCDs
Treatment of the A431 cells with WS extract showed a significant (p-value < 0.01) induction of cellular metabolic activity loss with a 50% inhibitory concentration determined at 440.5 μg ml−1 (Fig. 4A). On the other hand, the wsCDs were found to be biocompatible in human epidermal (A431) cells up to the measured dose of 3000 μg ml−1 and an exposure period of 24 h using % cell metabolic activity (Alamar blue™) assay (Fig. 4B). No response was observed in the A431 cells based on Trypan blue following treatment with both the WS extract and wsCDs (data not shown).This could be due to the lack of Trypan blue® assay sensitivity in comparison to the Alamar blue™ assay.42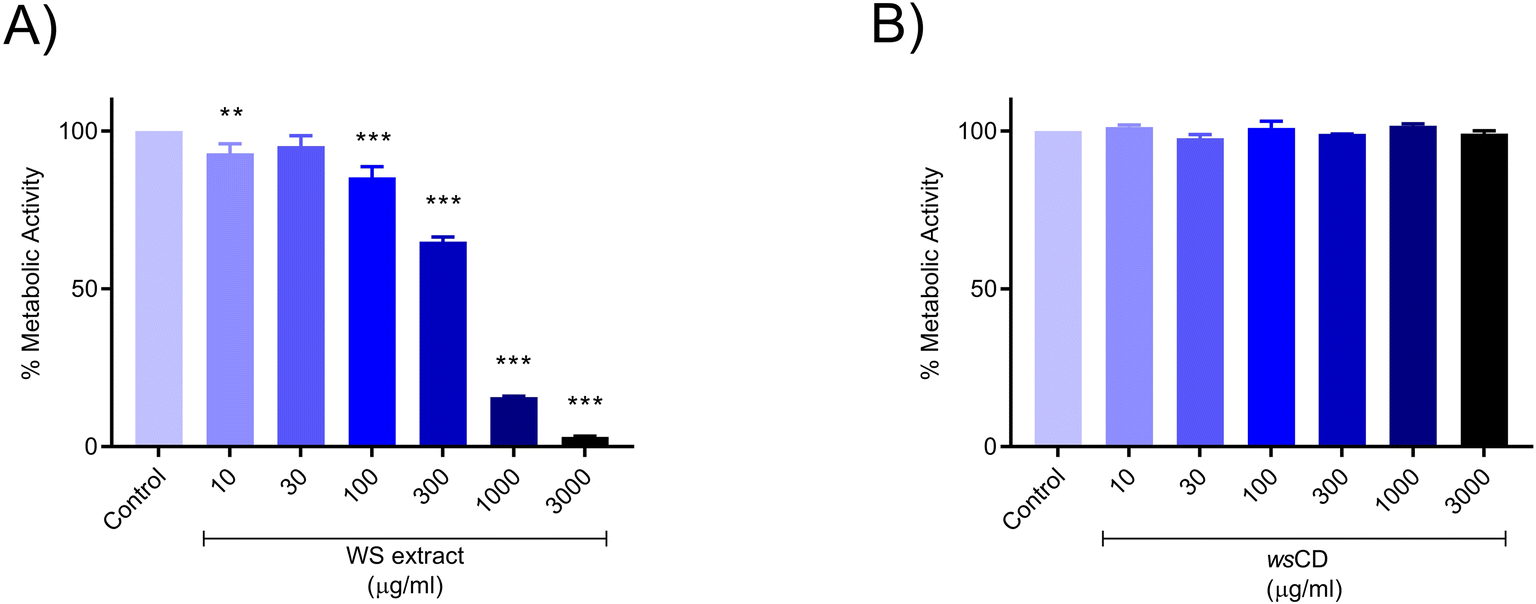 | ||
| Fig. 4 Biocompatibility study, (A) dose–response of WS extract in A431 cells during 24 h of exposure; (B) dose–response of wsCDs in A431 cells during 24 h of exposure. The results represent mean ± SD. Statistical analysis through one-way ANOVA followed by Tukey's post hoc test (control vs. varying doses). **p-value < 0.01; ***p-value < 0.001. | ||
Due to their absorbance in the UVA (315–400 nm) and UVB (280–315 nm) regions, CDs and their composites have gained importance as UV protectors.18,43–46 In comparison to their parent materials (WS extract), wsCDs showed a 3.6× enhanced absorbance (λmax – 340 nm) in the UV regions of 280–400 nm at an equal concentration of 1 mg ml−1 (Fig. 5A). For the in vitro UV protection assay, we used UVB (narrow-band 311 nm) as a cellular damage inducer in the cutaneous A431 cells. We measured the metabolic changes induced by UVB irradiation in the A431 cells after 30 min of exposure from a distance of 10, 15, and 20 cm using a 9 W UVB light source (Philips PL-S 9W/01/2P). We observed that at a distance of 10 cm UVB (narrow band 311 nm) caused a detrimental (p-value < 0.01) loss in cellular metabolic activity (52.19 ± 8.61%) in A431 cells following 30 min of treatment time (Fig. 5B). Pre-treatment of the A431 cells with WS extract did not provide any photo-protection against UVB exposure (Fig. 5C). A significant (p-value < 0.001) photo-protective effect of wsCDs was observed at 100 μg ml−1 (89.08 ± 1.15%) and 300 μg ml−1 (77.17 ± 4.76%) against UVB-induced loss of metabolic activity after pre- and post-treatment in the A431 cells (Fig. 5D). Using CDs made from Dunaliella salina (microalgae) as a preventative therapy, Chatzimitakos et al. demonstrated photo-protection in human keratinocytes (HaCat cells) against UV irradiation (314 nm) at the tested concentrations of 100 and 200 μg ml−1.43
 | ||
| Fig. 5 UV protection activity of WS extract and wsCDs. (A) Comparative UVA and UVB regions’ (200–400 nm) absorbance at a 100 μg ml concentration of wsCDs and WS extract; (B) calibration of UVB irradiation in A431 cells on the basis of cell viability loss at 30 min exposure time and 10, 15, and 20 cm distance between cells and the light source; (C) UVB photo-protection of WS extract at varying doses in A431 cells during 24 h of exposure; (D) UVB photo-protection of wsCDs at varying doses in A431 cells during 24 h of exposure. The results represent mean ± SD. Statistical analysis through one-way ANOVA followed by Tukey's post hoc test. ###p-value < 0.001 (control vs. UVB treatment); *p-value < 0.05; **p-value < 0.01; ***p-value < 0.001. | ||
The formation of reactive oxygen species (ROS) by catalase activity under UVB irradiation has been shown to cause oxidative stress-based cellular damage.47 In the present study, UVB treatment induced significant (p-value < 0.001) levels of intracellular ROS in A431 cells after 2 h and 24 h treatments (Fig. 6A–D). Pre- and post-treatment of UVB-exposed A431 cells with WS extract reduced the formation of intracellular ROS, showing that antioxidant action is possibly derived from the presence of phytochemicals (Fig. 6A and C). wsCD pre- and post-treatment also considerably (p-value < 0.001) reduced UVB-induced ROS levels in A431 cells at 2 h (44.34 ± 11.76%) and 24 h (81.55 ± 13.01%) post-irradiation (Fig. 6B and D). Beneficial phytochemicals such as withanoside V are known to have excellent free radical scavenging activity.48,49 Withanolides (1-oxo-5- and 6-beta-epoxy-with-2-enolide) discovered in WS extract have been shown to protect skin against UVB-induced malignancies through irradiation absorption and antioxidant activity.50
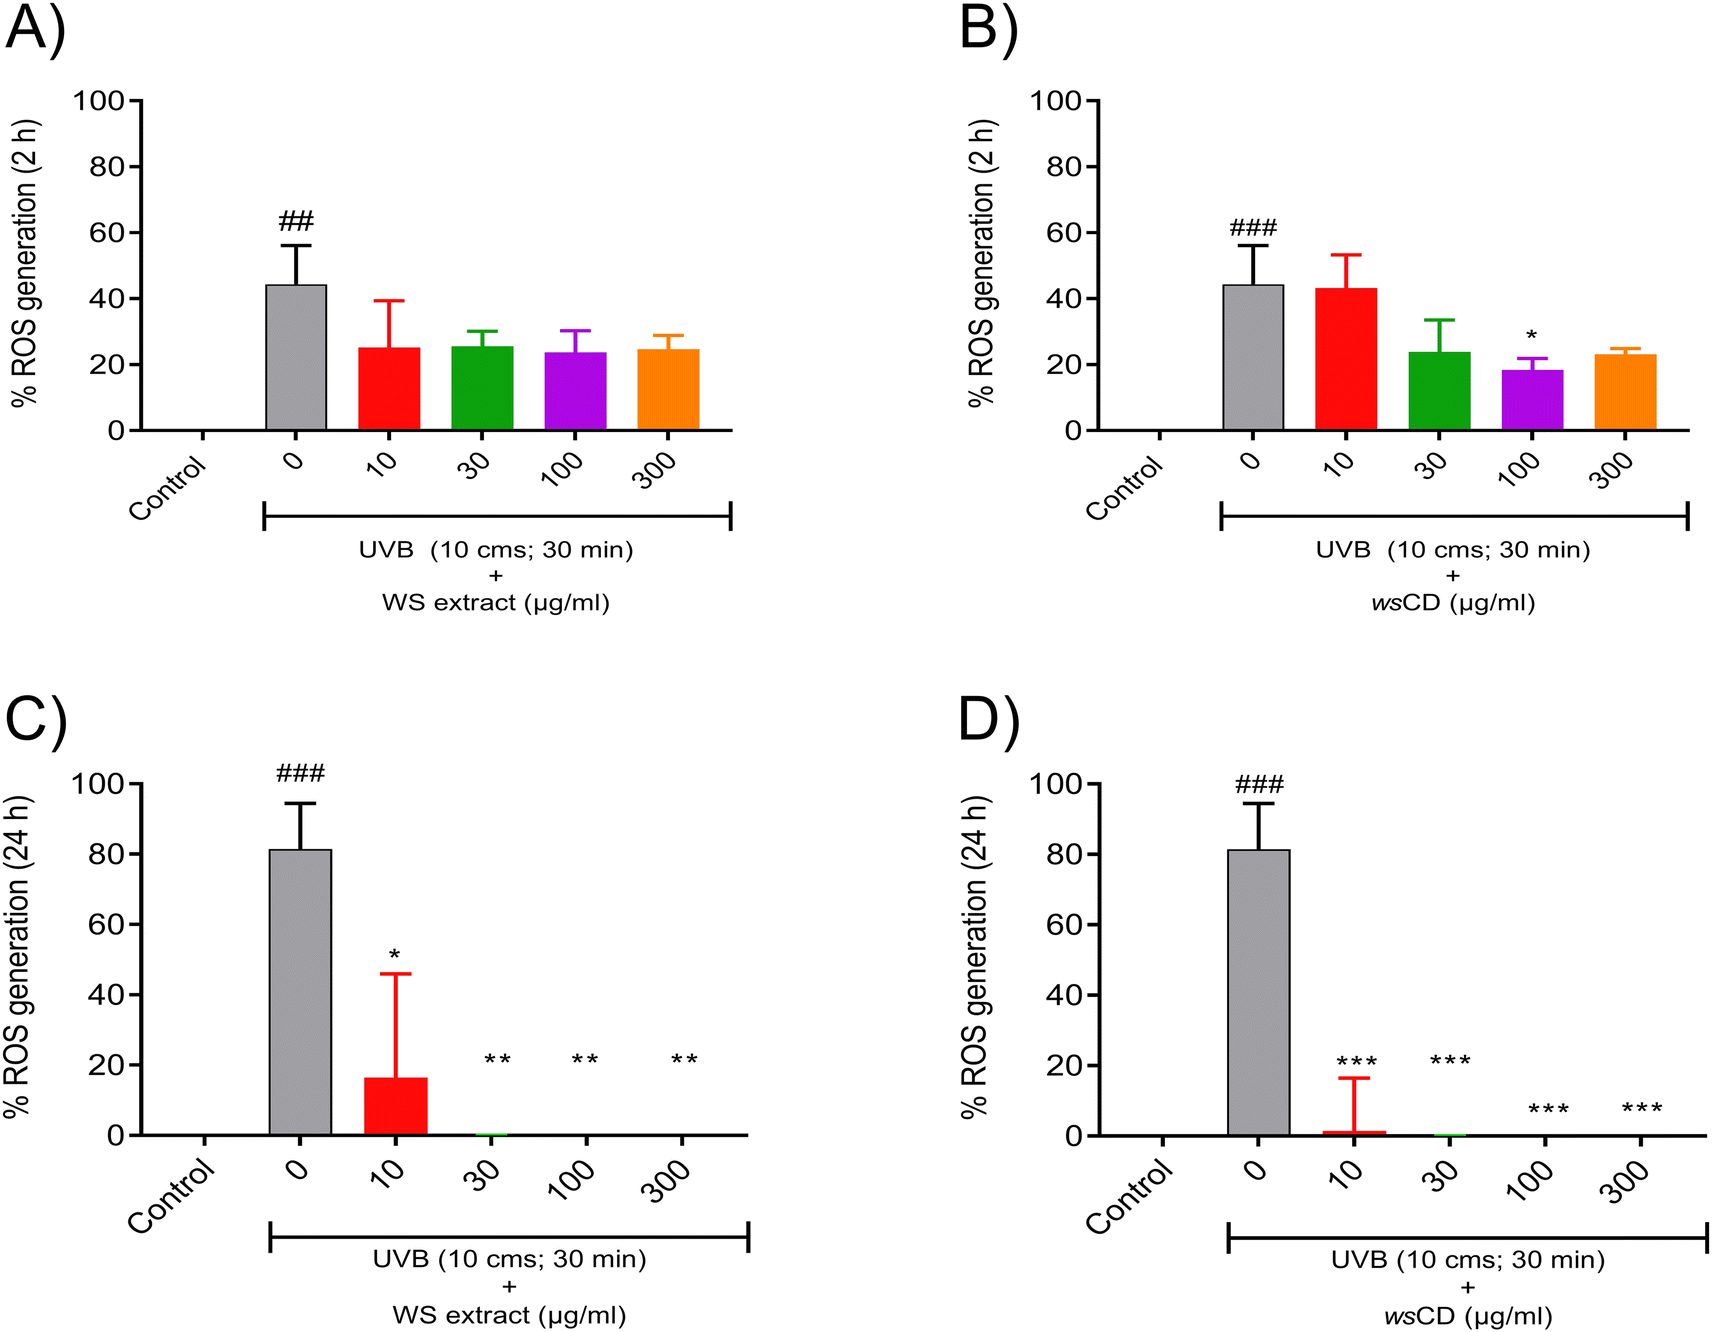 | ||
| Fig. 6 Aantioxidant activities of WS extract and wsCDs. (A) Antioxidant activity of WS extract in A431 cells 2 h post-UVB irradiation; (B) antioxidant activity of wsCDs in A431 cells 2 h post-UVB irradiation; (C) antioxidant activity of WS extract in A431 cells during 24 h post-UVB irradiation. (D) Antioxidant activity of wsCDs in A431 cells during 24 h post-UVB irradiation. The results represent mean ± SD. Statistical analysis through one-way ANOVA followed by Tukey's post hoc test. ##p-value < 0.01 (control vs. UVB treatment), ###p-value < 0.001 (control vs. UVB treatment); *p-value < 0.05; **p-value < 0.01; ***p-value < 0.001. | ||
3.3 Growth factor assisted wound healing properties of wsCDs
While UV radiation protection from sun-protective chemicals and composites can last for a long time, they are unable to fully protect the skin from long-term UV exposure. Normal A431 cells were used in the scratch analysis experiment, which revealed that wsCD-treated cells showed a better wound healing response than control (0 μg ml−1wsCD) cells (Fig. 7A). Substantial (p-value < 0.01) wound closure was observed on the basis of the wound width and wound healing percent in the A431 cells treated with a 100 μg ml−1 concentration of wsCDs at a measured time period of 10 h (Fig. 7B and C). A combination of UVB treatment in scratched A431 cells led to unrecoverable damage that did not support wound healing (data not shown). Growth factors play a major role in cell proliferation and wound healing processes. Transforming growth factor beta-1 (TGF-β1) and epidermal growth factor (EGF) are two key growth factors that were screened in the current investigation. TGF-β1 participates in a variety of wound healing processes, including inflammation, angiogenesis stimulation, fibroblast proliferation, collagen synthesis, extracellular matrix (ECM) deposition, and remodeling.51 EGF is also regarded as a crucial growth factor that contributes to the creation of granulation tissue, ECM component synthesis, keratinocyte migration, keratinocyte proliferation, and fibroblast activity during the healing of wounds.52 In the present study, UVB treatment alone in A431 cells induced a 1.53 ± 0.37-fold increase in the TGF-β1 and a 1.37 ± 0.02-fold increase in the EGF mRNA expression levels compared to those in the unexposed cells (Fig. 8A and B). TGF-β1 mRNA expression levels further increased significantly (p-value < 0.001) in UVB-irradiated A431 cells treated with varying concentrations of wsCDs (Fig. 8A). EGF mRNA expression levels were also significantly (p-value < 0.05) elevated in UVB-irradiated A431 cells treated with 100 μg ml−1wsCD (Fig. 8B). Hence, wsCDs stimulated a high mRNA expression of the growth factors EGF and TGF-β1 that might be related to the enhanced wound repair observed in the scratch assay (Fig. 7 and 8). UVB triggers TGF-β1 and EGF signaling in irradiated keratinocytes through the production of ROS and G-protein βγ subunit signaling pathways, respectively.53–55 Chronic and non-healing wounds often show a loss of TGF-β1 signaling.56 While no study has reported the effect of WS extract on keratinocyte EGF mRNA expression levels, it has been found to promote TGF-β1 mRNA expression in HaCat cells.57 Future studies would focus on intracellular delivery and release of individual phytochemicals loaded on wsCDs into epidermal cells and the role of these phytochemicals in stimulating rapid wound healing.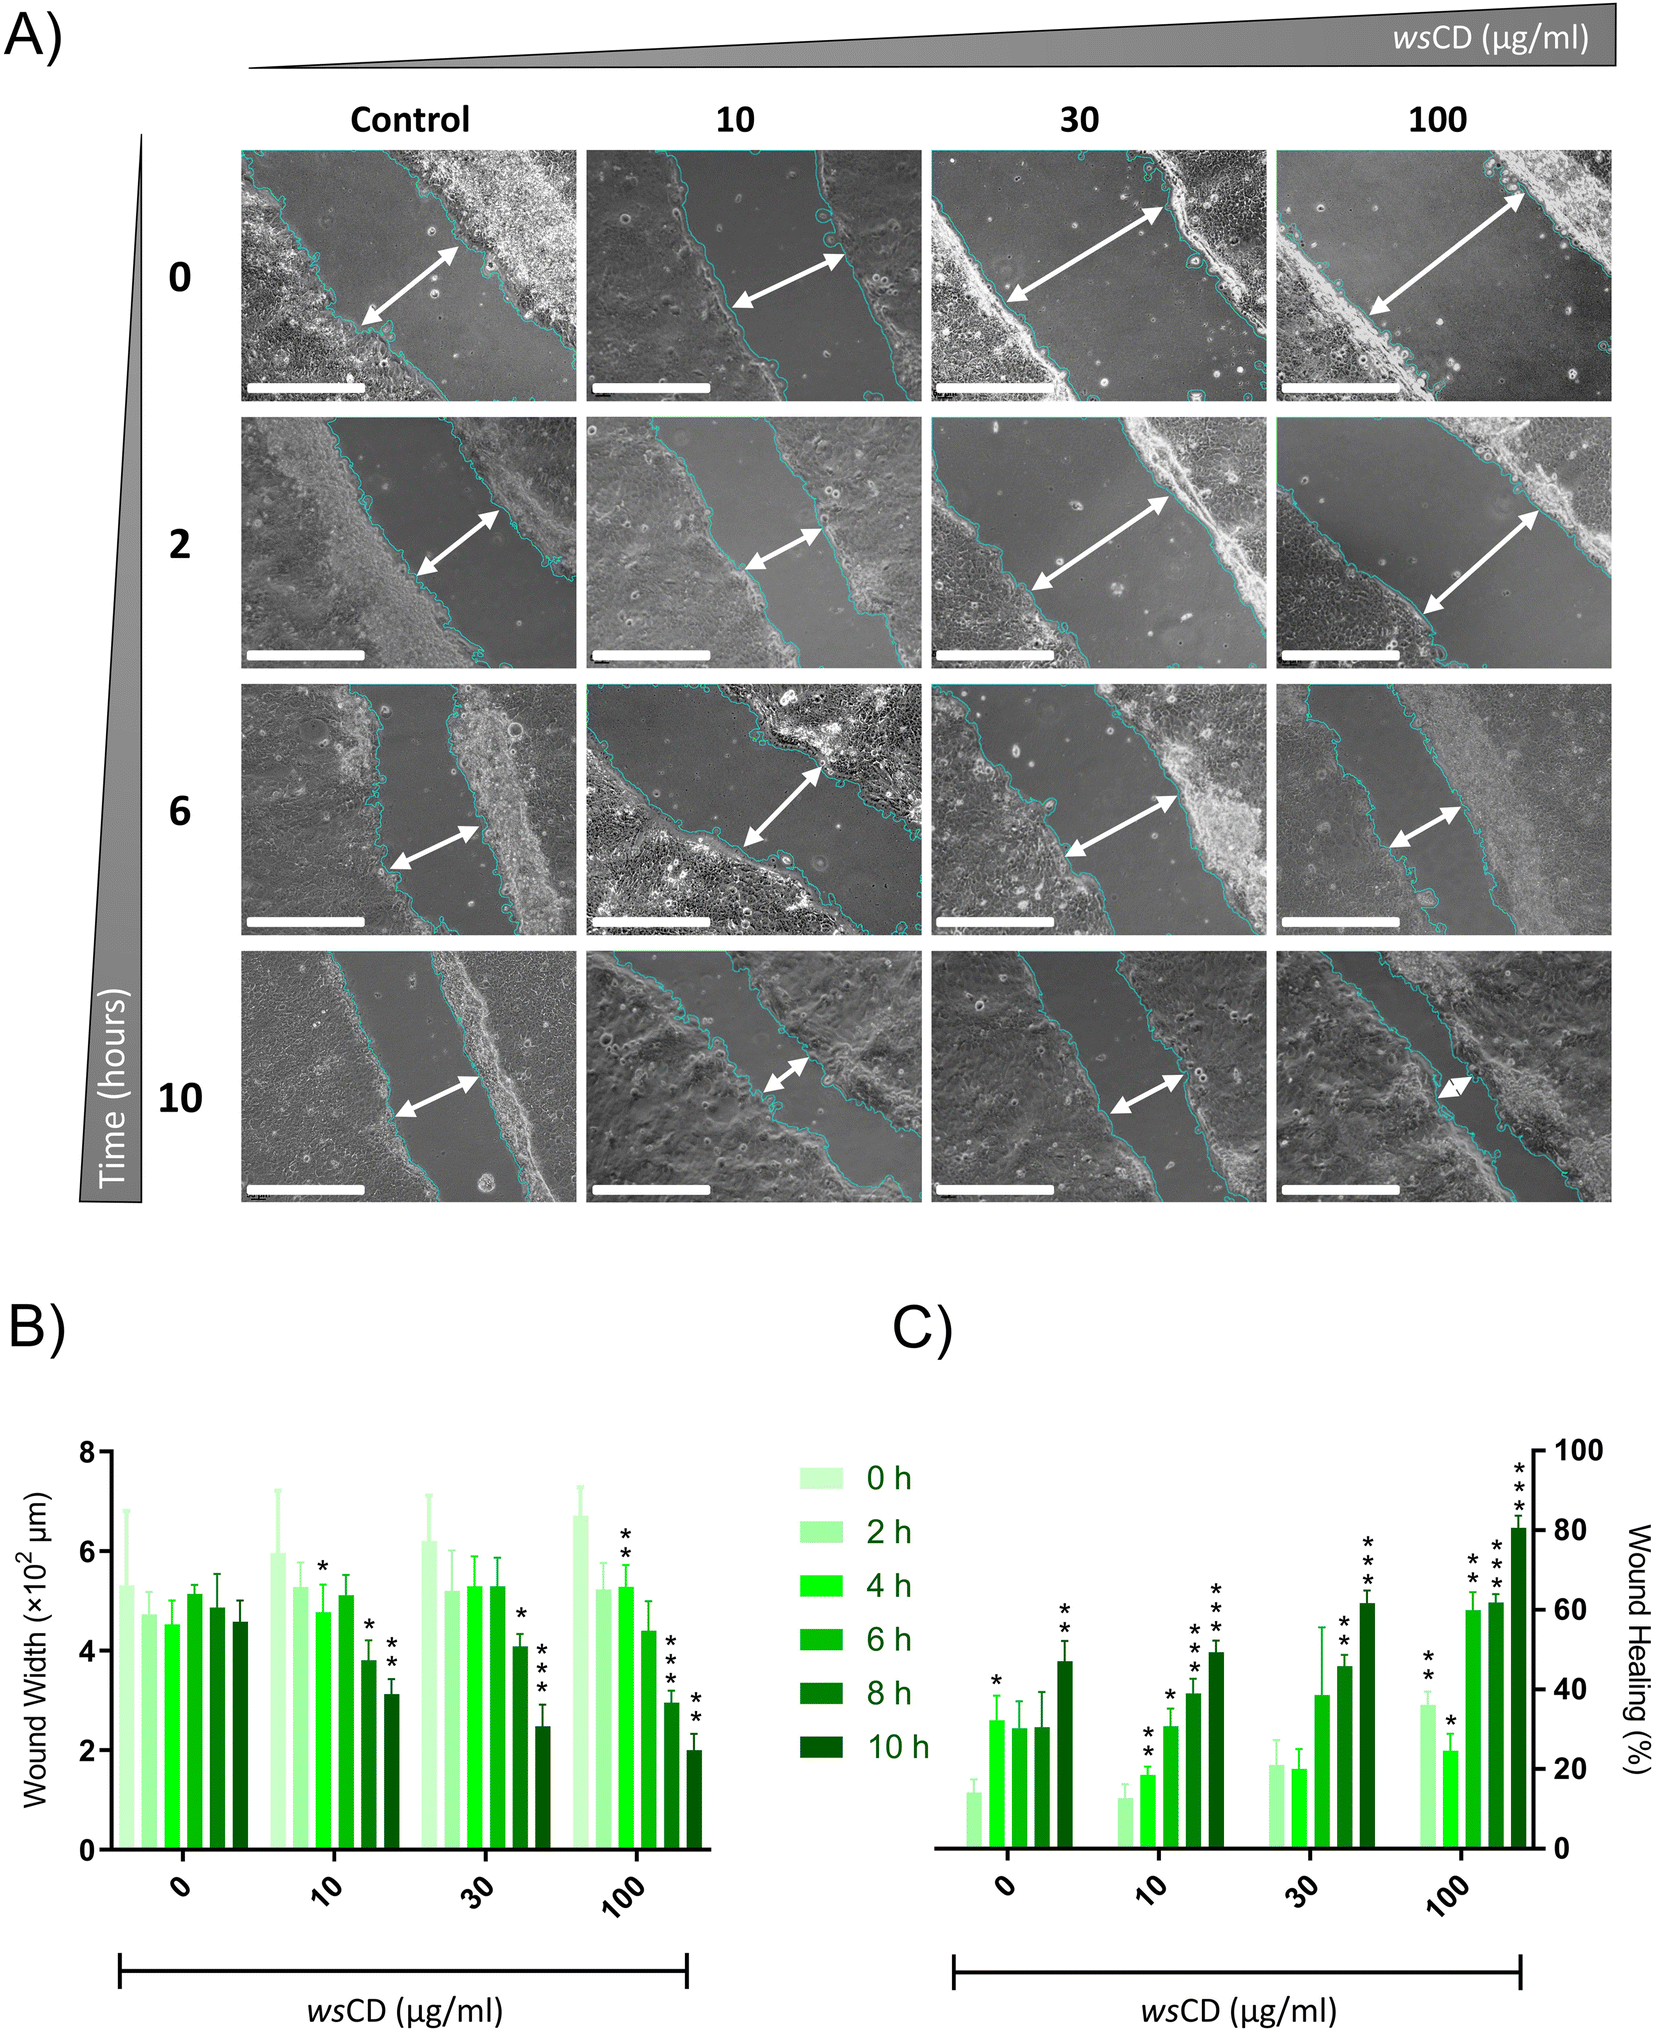 | ||
| Fig. 7 Wound healing properties of wsCDs. (A) Scratch assay analysis of A431 cells treated with varying concentrations of wsCDs over a period of 10 h. Microscopy images were acquired for analysis every 2 h (scale bar – 200 μm); (B) scratch wound width (μm); (C) scratch wound healing percent. The results represent mean ± SD. Statistical analysis through one-way ANOVA followed by Tukey's post hoc test. *p-value < 0.05; **p-value < 0.01; ***p-value < 0.001 (0 h vs. treatment time). | ||
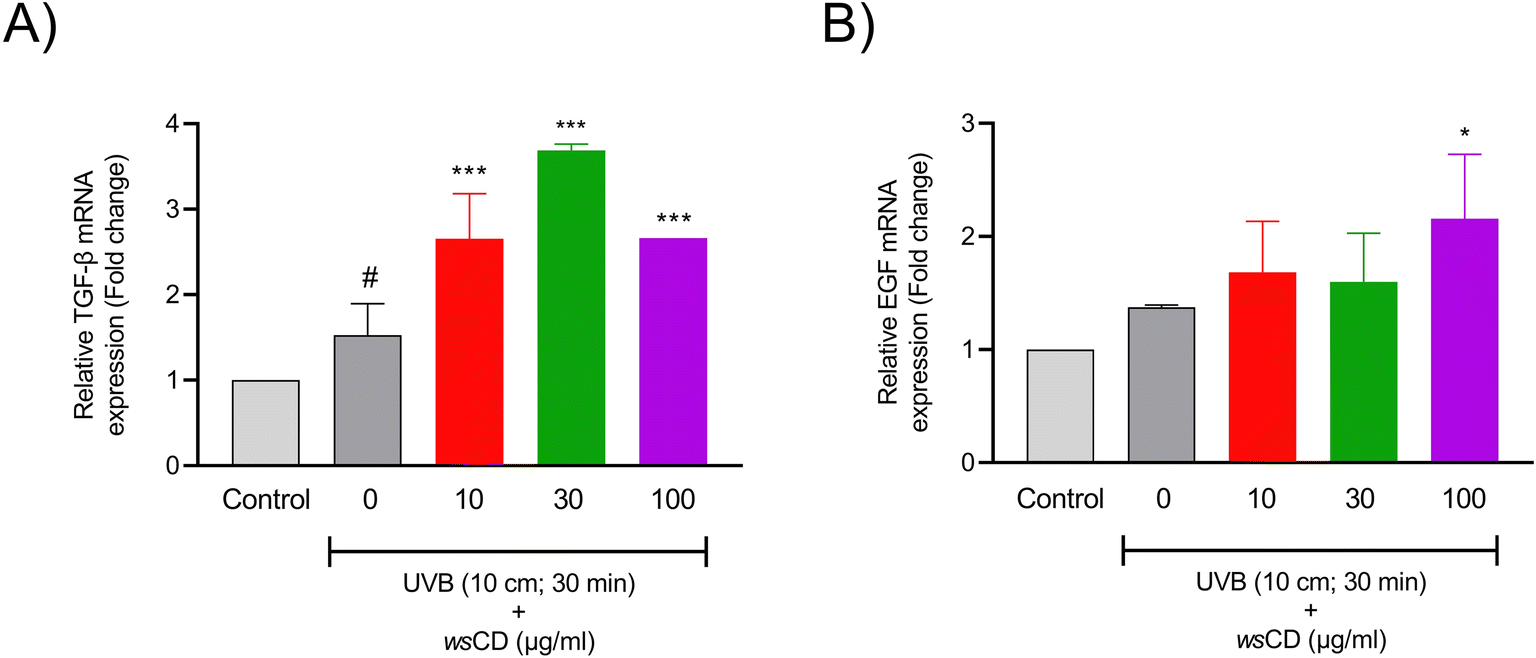 | ||
| Fig. 8 Growth factor mRNA expression. (A) Transforming growth factor-beta 1 (TGF-β1) mRNA expression in UVB irradiated A431 cells pre- and post-treated with wsCDs. (B) Epithelial growth factor (EGF) mRNA expression in UVB irradiated A431 cells pre- and post-treated with wsCDs. The results represent mean ± SD. Statistical analysis through one-way ANOVA followed by Tukey's post hoc test. #p-value < 0.05 (control vs. UVB treatment); *p-value < 0.05; ***p-value < 0.001. | ||
3.4 Enzymatic biodegradability of the wsCDs
Studying the wsCD biodegradability is crucial in addition to proving their biocompatibility, photo-protective and therapeutic qualities. Human myeloperoxidase and eosinophil peroxidase enzymes have been shown to enzymatically breakdown the graphitic structure of CDs and other carbonaceous nanomaterials through the oxidation reaction.20,58 Hence, we investigated the oxidative biodegradation of wsCDs using an MPO-based peroxide system. UV spectroscopy analysis of wsCDs showed a reduction in the n–p* transition region (CO) absorbance after 24 h of incubation with 5 μg ml−1 MPO, 140 mM NaCl, and 100 μM H2O2 compared to the wsCDs suspended in H2O (Fig. 9A and B). H2O2 alone also caused oxidative degradation of the wsCDs which was less compared to that caused by the MPO, NaCl, and H2O2-driven peroxide system (Fig. 9A and B). The body's initial line of defense comprises resident macrophages and neutrophils, which generate an MPO driven peroxide system against invading pathogens and foreign materials.59 For the enzymatic degradation of the CDs MPO binds to their surface OH groups present around defect sites, and breaks down the graphitic lattice through the catalytic production of sodium hypochlorous acid (NaHOCl).20,59 In the wsCDs the presence of OH was verified through the FTIR spectra (Fig. 2B). In the environment, biodegradation of organic materials is performed by a similar MPO-like bacterial peroxidases system.60,61wsCDs also function as nanovectors delivering phytochemicals loaded onto them into cell-based systems.
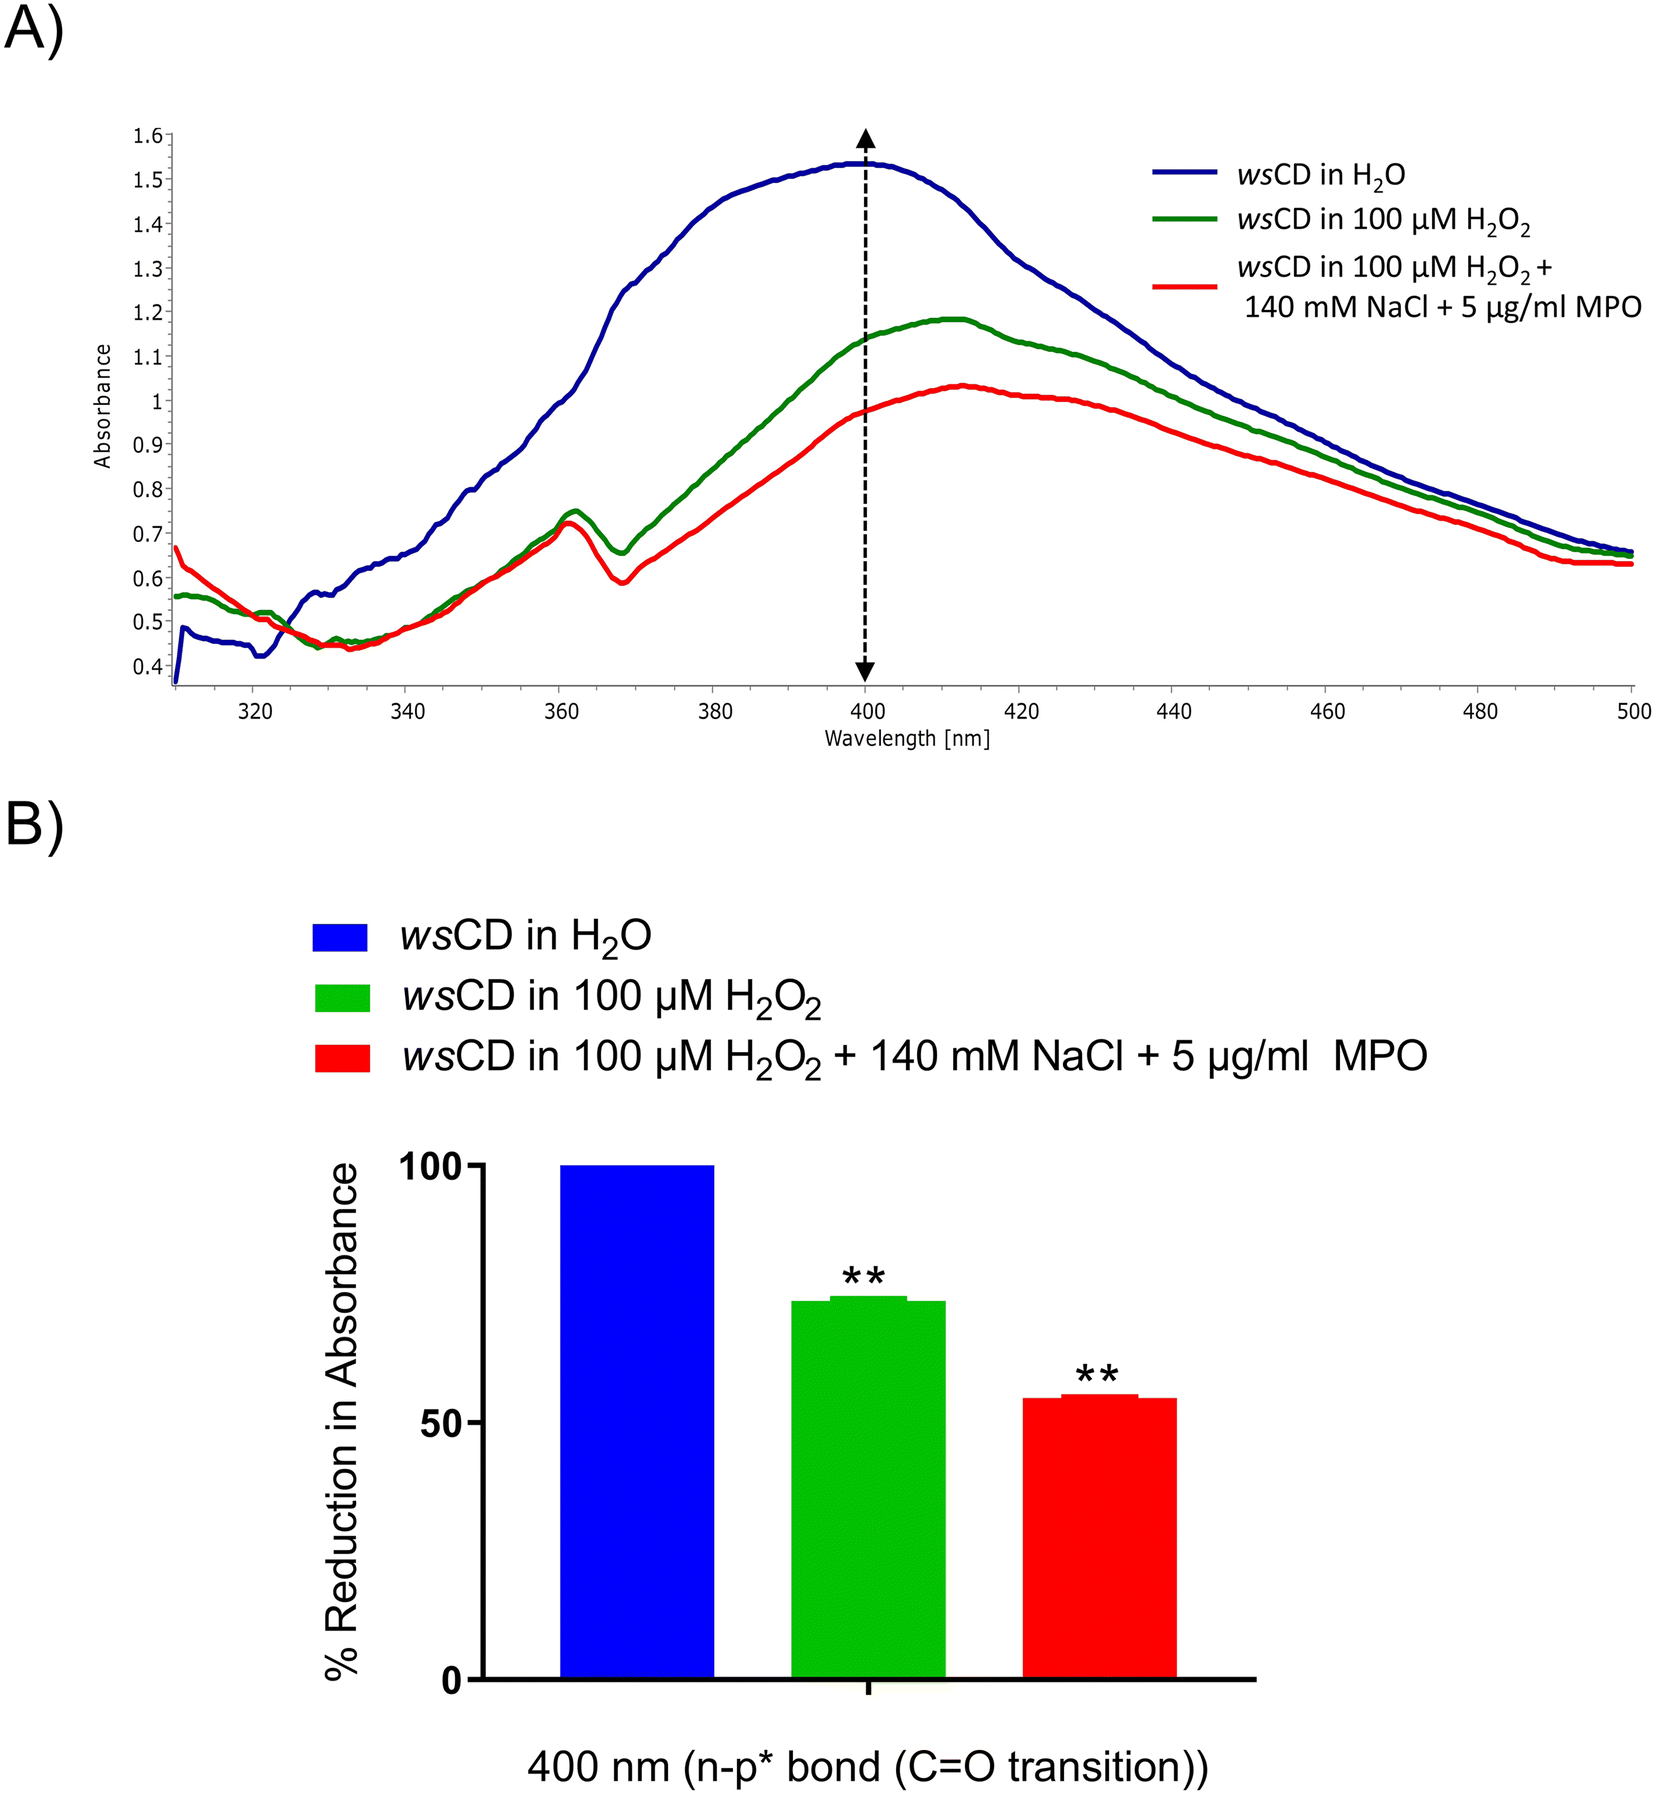 | ||
| Fig. 9 Enzymatic biodegradation of wsCDs. (A) UVB absorption spectra (300–500 nm) of wsCDs treated with H2O, 100 μm H2O2, and a complete peroxide system, (5 μg ml−1 human origin MPO, 140 mm NaCl, and 100 μm H2O2) for 24 h; (B) UV absorbance of wsCDs suspended under various conditions at 400 nm. The results represent mean ± SD. Statistical analysis through one-way ANOVA followed by Tukey's post hoc test. **p-value < 0.01 (treatments vs. H2O suspension). | ||
These phytochemicals are exposed to a range of acidic to basic pH during the uptake and biodegradation of the wsCDs. Therefore, the pH stability of the phytochemicals present in wsCDs was checked by suspending wsCDs under pH different conditions (2.0, 7.0, and 10.0) for 24 h. Using an HPLC instrument the total withanolide content was observed at 2.79 μg ml−1 at pH 2.0, 3.21 μg ml−1 at pH 7.0, and 3.04 μg ml−1 at pH 10.0 indicating a minor reduction in phytochemical load under acidic pH conditions (Fig. 10A–C; Table 2 and ESI Fig. S2†). Taken together, the wsCDs demonstrated strong UV absorption and PL, along with great biocompatibility, antioxidant activity, and wound healing qualities under in vitro conditions in epidermal A431 cells. Future research work will determine the protective effect of wsCDs in eliminating DNA adduct formations induced by UVB and their own genomic interaction compared to the other commercially available nanoparticles used in cosmeceuticals and sunscreens.
 | ||
| Fig. 10 pH stability of phytochemicals loaded onto wsCDs. The phytochemical content of wsCDs was analyzed using high-performance liquid chromatography (withanoside IV (15.66 min); withanoside IV (19.90 min); withaferine A (20.44 min); and withanolide A (22.37 min)) following treatments at (A) pH 2.0, (B) pH 7.0, and (C) 10.0. Quantitative data are presented in Table 2. The complete spectral range is provided in ESI image 2.† | ||
| S. No. | Marker compounds | wsCD pH 2.0 (μg mg−1) | wsCD pH 7.0 (μg mg−1) | wsCD pH 10.0 (μg mg−1) |
|---|---|---|---|---|
| 1 | Withanoside IV | 1.706 | 1.998 | 1.850 |
| 2 | Withanoside V | 1.080 | 1.168 | 1.115 |
| 3 | Withanolide A | 0.035 | 0.047 | 0.049 |
| Total withanolides | 2.7895 | 3.213 | 3.041 | |
4 Conclusion
The wsCDs displayed excellent sun protection qualities through absorption in the UV regions of 280–400 nm and photoluminescence while they carried the essential withanolides originating from the Withania somnifera (L.) Dunal extract. The human epidermal A431 cells were shielded by wsCDs from oxidative stress and cell viability loss brought on by UVB exposure. They accelerated wound healing by increasing the expression of growth factor mRNA in A431 cells. Under acidic pH circumstances, wsCDs were discovered to be enzymatically biodegradable with a little change in their phytochemical contents. Thus, the results support the benefits of wsCDs as a nanocosmeceutical for therapeutic applications and a sun-protection nanocomponent.Author contributions
AB, KB and AV contributed to the conceptualization of the study; KB and MT developed methodology and performed experimental work under the supervision of AB and AV; KB wrote the original draft and AB, MT and AV reviewed and performed the editing of the manuscript.Conflicts of interest
Acharya Balkrishna is a trustee in the Divya Yog Mandir Trust, Haridwar, India that governs Divya Pharmacy, Haridwar. In addition, Acharya Balkrishna is one of the founding promoters and holds an honorary managerial position at Patanjali Ayurved Ltd, Haridwar, India. These organizations were not involved in any aspects of this study. All other authors, Meenu Tomar, Kunal Bhattacharya and Anurag Varshney are employed at the Patanjali Research Institute which is governed by the Patanjali Research Foundation Trust (PRFT), Haridwar, Uttarakhand, India, a not-for-profit organization. In addition, Anurag Varshney is an Adjunct Professor in the Department of Allied and Applied Sciences, University of Patanjali, Haridwar, India; and in the Special Centre for Systems Medicine, Jawaharlal Nehru University, New Delhi, India. All other authors declare no competing interests.Acknowledgements
The authors would like to acknowledge Mr Vallabh P. Mullay and Dr Jyotish Srivastava for providing the Withania somnifera root extract. The authors also acknowledge Mr Sudeep Verma, Dr Rohit K. Singh, and Mr Pooja Singh for their great technical assistance with HPLC analysis and biodegradation studies. We are grateful for the prompt administrative assistance provided by Mr Tarun Rajput, Mr Gagan Kumar, and Mr Lalit Mohan. The authors would like to thank the Patanjali Research Foundation Trust for funding the study.References
- N. Kollias, E. Ruvolo Jr and R. M. Sayre, Photochem. Photobiol., 2011, 87, 1474 CrossRef CAS PubMed.
- R. B. Weller, Photochem. Photobiol. Sci., 2017, 16, 374 CrossRef CAS PubMed.
- D. Q. Andrews, K. Rauhe, C. Burns, E. Spilman, A. M. Temkin, S. Perrone-Gray, O. V. Naidenko and N. Leiba, Photodermatol., Photoimmunol. Photomed., 2022, 38, 224 CrossRef CAS PubMed.
- USFDA, OTC Monograph M020, 2021 Search PubMed.
- K. Bhattacharya, G. Kilic, P. M. Costa and B. Fadeel, Nanotoxicology, 2017, 11, 809 CAS.
- K. Bhattacharya, M. Davoren, J. Boertz, R. P. Schins, E. Hoffmann and E. Dopp, Part. Fibre Toxicol., 2009, 6, 17 CrossRef PubMed.
- C. C. Lee, Y. H. Lin, W. C. Hou, M. H. Li and J. W. Chang, Int. J. Environ. Res. Public Health, 2020, 17, 1 CrossRef PubMed.
- S. Yuan, J. Huang, X. Jiang, Y. Huang, X. Zhu and Z. Cai, Nanomaterials, 2022, 12, 699 CrossRef CAS PubMed.
- S. W. Chen, W. H. Lv, K. Wu, G. H. Chen, F. Chen, C. C. Song and Z. Luo, Int. J. Mol. Sci., 2021, 22, 12047 CrossRef CAS PubMed.
- A. P. Gondikas, F. v. d. Kammer, R. B. Reed, S. Wagner, J. F. Ranville and T. Hofmann, Environ. Sci. Technol., 2014, 48, 5415 CrossRef CAS PubMed.
- R. Cunha and L. de Brito-Gitirana, Ecotoxicol. Environ. Saf., 2020, 203, 111032 CrossRef CAS PubMed.
- Y. Li, Y. He, C. H. Lam and T. Nah, Sci. Total Environ., 2022, 839, 156145 CrossRef CAS PubMed.
- I. B. Miller, M. Moeller, M. Y. Kellermann, S. Nietzer, V. Di Mauro, E. Kamyab, S. Pawlowski, M. Petersen-Thiery and P. J. Schupp, Toxics, 2022, 10, 244 CrossRef CAS PubMed.
- J. de Oliveira-Lima, R. L. Dias da Cunha and L. de Brito-Gitirana, J. Environ. Sci. Health, Part B, 2022, 57, 81 CrossRef CAS PubMed.
- S. Suh, C. Pham, J. Smith and N. A. Mesinkovska, Int. J. Dermatol., 2020, 59, 1033 CrossRef PubMed.
- L. Ethordevic, F. Arcudi, M. Cacioppo and M. Prato, Nat. Nanotechnol., 2022, 17, 112 CrossRef PubMed.
- A. Sciortino, A. Cannizzo and F. Messina, C, 2018, 4, 67 CAS.
- G. Hu, B. Lei, X. Jiao, S. Wu, X. Zhang, J. Zhuang, X. Liu, C. Hu and Y. Liu, Opt. Express, 2019, 27, 7629 CrossRef CAS PubMed.
- Q. Zeng, D. Shao, X. He, Z. Ren, W. Ji, C. Shan, S. Qu, J. Li, L. Chen and Q. Li, J. Mater. Chem. B, 2016, 4, 5119 RSC.
- C. Martin, G. Jun, R. Schurhammer, G. Reina, P. Chen, A. Bianco and C. Menard-Moyon, Small, 2019, 15, e1905405 CrossRef PubMed.
- H. B. Shilpashree, S. J. Sudharshan, A. K. Shasany and D. A. Nagegowda, Sci. Rep., 2022, 12, 1602 CrossRef CAS PubMed.
- A. Balkrishna, S. Verma, V. P. Mulay, A. K. Gupta, S. Haldar and A. Varshney, PLoS Neglected Trop. Dis., 2022, 16, e0010484 CrossRef CAS PubMed.
- A. Balkrishna, S. K. Solleti, H. Singh, N. Sharma and A. Varshney, Planta Med., 2022, 88, 466 CrossRef CAS PubMed.
- M. H. Mirjalili, E. Moyano, M. Bonfill, R. M. Cusido and J. Palazon, Molecules, 2009, 14, 2373 CrossRef CAS PubMed.
- C. A. Schneider, W. S. Rasband and K. W. Eliceiri, Nat. Methods, 2012, 9, 671 CrossRef CAS PubMed.
- A. Suarez-Arnedo, F. Torres Figueroa, C. Clavijo, P. Arbelaez, J. C. Cruz and C. Munoz-Camargo, PLoS One, 2020, 15, e0232565 CrossRef CAS PubMed.
- S. P. Mukherjee, A. R. Gliga, B. Lazzaretto, B. Brandner, M. Fielden, C. Vogt, L. Newman, A. F. Rodrigues, W. Shao, P. M. Fournier, M. S. Toprak, A. Star, K. Kostarelos, K. Bhattacharya and B. Fadeel, Nanoscale, 2018, 10, 1180 RSC.
- S. Qu, X. Wang, Q. Lu, X. Liu and L. Wang, Angew. Chem., Int. Ed. Engl., 2012, 51, 12215 CrossRef CAS PubMed.
- R. Duval and C. Duplais, Nat. Prod. Rep., 2017, 34, 329 RSC.
- V. N. Mochalin and Y. Gogotsi, J. Am. Chem. Soc., 2009, 131, 4594 CrossRef CAS PubMed.
- N. Murugan and A. K. Sundramoorthy, New J. Chem., 2018, 42, 13297 RSC.
- M. Tan, L. Zhang, R. Tang, X. Song, Y. Li, H. Wu, Y. Wang, G. Lv, W. Liu and X. Ma, Talanta, 2013, 115, 950 CrossRef CAS PubMed.
- N. K. Khairol Anuar, H. L. Tan, Y. P. Lim, M. S. So’aib and N. F. Abu Bakar, Front. Energy Res., 2021, 9, 626549 CrossRef.
- G. Gedda, C.-Y. Lee, Y.-C. Lin and H.-f. Wu, Sens. Actuators, B, 2016, 224, 396 CrossRef CAS.
- V. N. Mehta, S. Jha, H. Basu, R. K. Singhal and S. K. Kailasa, Sens. Actuators, B, 2015, 213, 434 CrossRef CAS.
- C. Wang, H. Shi, M. Yang, Y. Yan, E. Liu, Z. Ji and J. Fan, Mater. Res. Bull., 2020, 124, 110730 CrossRef CAS.
- J. Joseph and A. A. Anappara, J. Lumin., 2017, 192, 761 CrossRef CAS.
- C. Wang, K. Jiang, Q. Wu, J. Wu and C. Zhang, Chemistry, 2016, 14475, DOI:10.1002/chem.201602795.
- L. Guo, J. Ge, W. Liu, G. Niu, Q. Jia, H. Wang and P. Wang, Nanoscale, 2016, 8, 729 RSC.
- C. Das, H. B. Samal, V. K. Meher, A. Mohanty and S. Dash, Ann. Phytomed., 2022, 11, 493–504 CAS.
- F. Mirzajani, A. Ghassempour, M. Jalali-Heravi and M. H. Mirjalili, Phytochem. Anal., 2010, 21, 544 CrossRef CAS PubMed.
- I. A. Zlatskiy, A. V. Zlatska, N. V. Antipova, S. A. Dolenko, I. M. Gordiienko, O. S. Gubar, R. G. Vasyliev, D. A. Zubov, S. N. Novikova and A. V. Syroeshkin, Sci. World J., 2020, 2020, 2373021 CAS.
- T. G. Chatzimitakos, A. Kasouni, A. Troganis, I. Leonardos, I. Tzovenis, A. Ntzouvaras and C. Stalikas, C-J. Carbon Res., 2020, 6, 69 CrossRef CAS.
- S. C. Hess, F. A. Permatasari, H. Fukazawa, E. M. Schneider, R. Balgis, T. Ogi, K. Okuyama and W. J. Stark, J. Mater. Chem. A, 2017, 5, 5187 RSC.
- X. Feng, Y. Zhao, Y. Jiang, M. Miao, S. Cao and J. Fang, Carbohydr. Polym., 2017, 161, 253 CrossRef CAS PubMed.
- D. Zuo, N. Liang, J. Xu, D. Chen and H. Zhang, Cellulose, 2019, 26, 4205 CrossRef CAS.
- D. E. Heck, A. M. Vetrano, T. M. Mariano and J. D. Laskin, J. Biol. Chem., 2003, 278, 22432 CrossRef CAS PubMed.
- K. Senthil, P. Thirugnanasambantham, T. J. Oh, S. H. Kim and H. K. Choi, PLoS One, 2015, 10, e0123360 CrossRef PubMed.
- S. T. Devkar, S. D. Jagtap, S. S. Katyare and M. V. Hegde, J. Planar Chromatogr.–Mod. TLC, 2014, 27, 157 CrossRef CAS.
- S. Mathur, P. Kaur, M. Sharma, A. Katyal, B. Singh, M. Tiwari and R. Chandra, Phytomedicine, 2004, 11, 452 CrossRef CAS PubMed.
- J. W. Penn, A. O. Grobbelaar and K. J. Rolfe, Int. J. Burns Trauma, 2012, 2, 18 CAS.
- J. Hardwicke, D. Schmaljohann, D. Boyce and D. Thomas, Surgeon, 2008, 6, 172 CrossRef CAS PubMed.
- T. Quan, T. He, S. Kang, J. J. Voorhees and G. J. Fisher, J. Invest. Dermatol., 2002, 119, 499 CrossRef CAS PubMed.
- M. Seo, M.-J. Lee, J. H. Heo, Y.-I. Lee, Y. Kim, S.-Y. Kim, E.-S. Lee and Y.-S. Juhnn, J. Biol. Chem., 2007, 282, 24720 CrossRef CAS PubMed.
- H. Wang and I. E. Kochevar, Free Radical Biol. Med., 2005, 38, 890 CrossRef CAS PubMed.
- I. Pastar, O. Stojadinovic, A. Krzyzanowska, S. Barrientos, C. Stuelten, K. Zimmerman, M. Blumenberg, H. Brem and M. Tomic-Canic, Mol. Med., 2010, 16, 92 CAS.
- A. Sikandan, T. Shinomiya and Y. Nagahara, Int. J. Mol. Med., 2018, 42, 425 CrossRef CAS PubMed.
- K. Bhattacharya, S. P. Mukherjee, A. Gallud, S. C. Burkert, S. Bistarelli, S. Bellucci, M. Bottini, A. Star and B. Fadeel, Nanomedicine, 2016, 12, 333 CrossRef CAS PubMed.
- V. E. Kagan, N. V. Konduru, W. Feng, B. L. Allen, J. Conroy, Y. Volkov, I. I. Vlasova, N. A. Belikova, N. Yanamala, A. Kapralov, Y. Y. Tyurina, J. Shi, E. R. Kisin, A. R. Murray, J. Franks, D. Stolz, P. Gou, J. Klein-Seetharaman, B. Fadeel, A. Star and A. A. Shvedova, Nat. Nanotechnol., 2010, 5, 354 CrossRef CAS PubMed.
- N. Bansal and S. S. Kanwar, Sci. World J., 2013, 2013, 714639 Search PubMed.
- L. Zhang, E. J. Petersen, M. Y. Habteselassie, L. Mao and Q. Huang, Environ. Pollut., 2013, 181, 335 CrossRef CAS PubMed.
Footnote |
| † Electronic supplementary information (ESI) available. See DOI: https://doi.org/10.1039/d2na00545j |
| This journal is © The Royal Society of Chemistry 2023 |