
 Open Access Article
 This Open Access Article is licensed under a Creative Commons Attribution-Non Commercial 3.0 Unported Licence
Variations in bile salt surfactant structure allow tuning of the sorting of single-wall carbon nanotubes by aqueous two-phase extraction†
Marina
Avramenko‡
 ,
Joeri
Defillet‡
,
Miguel Ángel
López Carrillo
,
Miles
Martinati
,
Wim
Wenseleers
* and
Sofie
Cambré
*
,
Joeri
Defillet‡
,
Miguel Ángel
López Carrillo
,
Miles
Martinati
,
Wim
Wenseleers
* and
Sofie
Cambré
*
Nanostructured and Organic Optical and Electronic Materials, Physics Department, University of Antwerp, Belgium. E-mail: wim.wenseleers@uantwerp.be; sofie.cambre@uantwerpen.be
First published on 13th October 2022
Abstract
Being some of the most efficient agents to individually solubilize single-wall carbon nanotubes (SWCNTs), bile salt surfactants (BSS) represent the foundation for the surfactant-based structure sorting and spectroscopic characterization of SWCNTs. In this work, we investigate three BSS in their ability to separate different SWCNT chiral structures by aqueous two-phase extraction (ATPE): sodium deoxycholate (DOC), sodium cholate (SC) and sodium chenodeoxycholate (CDOC). The small difference in their chemical structure (just one hydroxyl group) leads to significant differences in their stacking behavior on SWCNT walls with different diameter and chiral structure that, in turn, has direct consequences for the chiral sorting of SWCNTs using these BSS. By performing several series of systematic ATPE experiments, we reveal that, in general, the stacking of DOC and CDOC is more enantioselective than the stacking of SC on the SWCNT walls, while SC has a clear diameter preference for efficiently solubilizing the SWCNTs in comparison to DOC and CDOC. Moreover, combining sodium dodecylsulfate with SC allows for resolving the ATPE sorting transitions of empty and water-filled SWCNTs for a number of SWCNT chiralities. We also show that addition of SC to combinations of DOC and sodium dodecylbenzenesulfonate can enhance separations of particular chiralities.
Introduction
Bile salt surfactants (BSS) are inextricably linked with the solubilization, spectroscopic characterization and structure sorting of single-wall carbon nanotubes (SWCNTs) in an aqueous environment. SWCNTs are remarkable materials for numerous applications in different fields of contemporary science and technology1 due to their well-defined structure-dependent optical and electronic properties2 combined with unique thermal and mechanical characteristics. While originally found to be one of the most efficient surfactant types to solubilize SWCNTs without using sonication,3 and therefore also without opening and cutting of the SWCNTs,4 BSS currently lie at the basis of the surfactant-based structure sorting of SWCNTs by various methods, including density gradient ultracentrifugation,5,6 gel chromatography,7,8 and aqueous two-phase extraction (ATPE).9–13 The specific interaction of the surfactant with the SWCNT walls has played a central role in revealing their optical properties, in particular, since the BSS provide a very homogeneous environment for the SWCNTs as compared to other surfactants, thereby resulting in highly resolved optical spectra3 able to, for example, reveal the presence of both empty and water-filled SWCNTs.4,14 While very often interactions of molecules with SWCNTs were found to be selective for specific SWCNT structures, such as DNA- or polymer wrapping exploited to solubilize only one specific chiral species,15–19 most studies revealed that BSS worked as efficiently for SWCNTs with different diameters, chiral structure or metallicity.3,20 Nevertheless, both sodium deoxycholate (DOC) and sodium cholate (SC) (see Fig. 1 for their structure) are commonly used in literature for structure-sorting of SWCNTs, typically in combination with a cosurfactant like sodium dodecylsulfate (SDS) or sodium dodecylbenzenesulfonate (SDBS), and sorting according to metallicity (using a combination of SC/SDS5,21,22), SWCNT diameter and chiral structure (using combinations of SC/SDS,6 SC/DOC/SDS11–13 and DOC/SDS23–25) and even enantiomer separations (using SC,26 SC/SDS,6 SC/DOC/SDS13) have been achieved through BSS, thus hinting at their structure-specific stacking around different SWCNT chiralities. | ||
| Fig. 1 Bile salt surfactants (BSS) used in this paper: sodium deoxycholate (DOC), sodium cholate (SC), sodium chenodeoxycholate (CDOC). The difference in their chemical structure comes back to the positioning of the hydroxyl groups which are each time highlighted in green. | ||
Previously, we have demonstrated by in situ density gradient ultracentrifugation (DGU) experiments that some particular large-diameter SC-wrapped SWCNTs exhibited a very different density than other diameters, revealing a specific diameter-dependent stacking of these surfactants on the SWCNT walls14,27 that was later employed to separate these larger diameters by ATPE.13 More recently, we have developed a systematic ATPE approach that allows for revealing specific diameter-dependent stacking of surfactants on the SWCNT surface through the effect of this stacking on the hydrophilicity of the SWCNTs that determines the ATPE separations.28 In this systematic ATPE approach, multiple single-step ATPE separations are performed while systematically varying one specific sorting parameter. Afterwards, bottom and top phases are collected and characterized by absorption, wavelength-dependent photoluminescence-excitation (PLE) and multiwavelength resonant Raman scattering (RRS) spectroscopy. Subsequently, intensities are extracted from the experimental data by detailed fitting methods to follow the migration of every SWCNT chirality between the two phases as a function of the varied parameter. These results then provide a measure for the changing hydrophilicity of the surfactant/SWCNT hybrid structure driving the separations, which can be attributed to the changing stacking of the surfactants on the SWCNT walls.
In our previous work, we demonstrated the versatility of this approach by starting from a very low DOC concentration and systematically adding SDS as a cosurfactant. It was shown that the ATPE separation is driven by the specific stacking of DOC on the SWCNT walls and enhanced by the competition on the SWCNT wall of DOC with the cosurfactant SDS, where SDS makes the SWCNT less hydrophilic than DOC. For specific diameters, the circumference matches perfectly with the size of a discrete number of DOC molecules, therefore making the competition with SDS very difficult, while for other diameters open spaces exist along the SWCNT circumference, requiring relatively less SDS to replace the DOC on the SWCNT walls. When plotting SDS concentrations at which the different SWCNT chiralities migrate between the two phases as a function of SDS concentration and SWCNT diameter, a periodically modulated pattern is revealed that can be used for prediction of ideal ATPE sorting parameters for different chiral structures. The essential role of DOC and its stacking on the SWCNT surface revealed by these ATPE separations has led us to further explorations of other BSS and their chirality-dependent SWCNT wrapping.
Recently, by means of fluorescence spectroscopy, Sims et al.29 observed for four chiral structures (i.e., (8,3), (6,5), (7,5) and (7,6)) that the SWCNT emission intensity changes drastically when coated by either a BSS or an alkyl-based surfactant, allowing to study the direct competition of these two surfactants to stack on the SWCNT surface by varying their relative concentrations while monitoring the emission intensity. Comparing BSS and cosurfactants,29 the authors conclude that a small change in structure of the BSS or a change in alkyl length of the cosurfactant greatly affects the specific competition between the two types of surfactants, therefore observing fluorescence quenching at very different BSS/cosurfactant concentrations. Since in ATPE, a transition in phases is based on a change in surfactant wrapping,11 the obtained concentrations at which the fluorescence quenches could be directly related to corresponding ATPE phase transitions.
In this work, we investigate the effect of the BSS/cosurfactant stacking for a much broader range of different SWCNT chiralities (more than 30) through employing the previously developed methodology of systematic ATPE experiments,28 such that the underlying diameter- and chirality-dependent competition of surfactants in ATPE sorting can be revealed, which is essentially important for chiral sorting of the standard highly polydisperse SWCNT samples. We compare three similar surfactants that differ in one hydroxyl group from each other (see Fig. 1), namely DOC, SC and sodium chenodeoxycholate (CDOC). We show that the small difference in their chemical structure turns out to significantly affect their stacking behavior on the SWCNTs and also the competition with the cosurfactant SDS on the SWCNT walls as a function of SWCNT diameter and chiral structure, therefore directly impacting the diameter and handedness sorting of SWCNTs by means of ATPE.
Experimental
The general methodology of a systematic ATPE experiment is discussed in detail in our previous study for the variation of the SDS concentration at a fixed DOC concentration.28 In this section we briefly present a summary of the information necessary for understanding the results of this work, while all other details can be found in ref. 28.Materials
Following materials were used for the ATPE separations. Polyethyleneglycol (PEG, Alfa Aesar, MW 6 kDa), dextran (Tokyo Chemical Industry Co., MW 40 kDa), sodium deoxycholate (DOC, Acros Organics, 99%), sodium cholate (SC, Acros Organics, 99%), sodium dodecyl sulfate (SDS, Acros Organics, 99%), sodium dodecylbenzenesulfonate (SDBS, Acros Organics, 88%), sodium chenodeoxycholate (CDOC, Sigma-Aldrich, 97%), D2O (Cortecnet, 99.8 atom%D), HiPco SWCNTs (NoPo Nanotechnologies India Inc., batch number 2015.820).SWCNT solubilization
SWCNTs were first solubilized in a 10 g L−1 BSS solution in D2O. Typically, 40 mg of raw SWCNT powder and 4 mL of the 10 g L−1 BSS solution was stirred for at least 4 weeks using a magnetic stirring plate at room temperature. Note that the mass of raw SWCNT powder should not be taken too low, to enhance the final concentration of isolated SWCNTs.3 While D2O does not change the ATPE separations with respect to H2O, it does provide a higher transparency in the IR which is advantageous for the subsequent spectroscopic characterizations. Since for these systematic ATPE experiments a sufficiently high SWCNT concentration is required to allow for the detailed spectroscopic characterization, we also applied a brief sonication for 15 minutes the first three days of the solubilization procedure (bath sonicator, BRANSONIC, 1510E-MTH). After 4 weeks of stirring, a medium-speed centrifugation was applied (4 h at 16![[thin space (1/6-em)]](https://www.rsc.org/images/entities/char_2009.gif) 215 g with a tabletop centrifuge Sigma 2-16KCH in a swing-out rotor), and the supernatant was collected for the following ATPE separations.
215 g with a tabletop centrifuge Sigma 2-16KCH in a swing-out rotor), and the supernatant was collected for the following ATPE separations.
Preparation of stock solutions and systematic ATPE separations
To easily vary concentrations of one particular surfactant, while keeping the other sorting parameters fixed, we first prepared stock solutions of the surfactants and the polymers with different concentrations, so that for each step they can be easily mixed with the SWCNTs in different quantities. In the ESI,† we provide detailed descriptions of all the different stock solutions and volumes thereof, used for the different systematic ATPE experiments in this work (see Tables S1–S7†). Note that to simplify conversion from D2O to H2O, which is more often used in ATPE sorting, we specify the stock solution concentrations as mass per added volume: for example, a 1% wt/v DOC solution thus corresponds to mixing 10 mg of DOC with 1 mL of D2O. From separation to separation, the total volume and total SWCNT concentration was not changed, and we also verified that the actual phase separation itself did not change upon the parameter variation. It is important to point out that first all the surfactants and polymers were mixed and only then the SWCNT solution was added and remixed before phase separation to prevent bundling of the SWCNTs. In addition, all ATPE separations were performed in a temperature-controlled laboratory at a stable temperature of 21 °C to account for the sensitivity of the method to temperature variations.After phase separation, top and bottom phases were extracted manually using a syringe, and diluted by a factor of 2 with a 40 g L−1 DOC in D2O solution to reach a final DOC concentration above 20 g L−1. There are two reasons to do this. First, among the three considered BSS, Raman and PL cross-sections were found to be the highest in DOC. Second, DOC also appeared to be the most competitive surfactant of the ones used in this work, such that at sufficiently high concentration the surfactants are largely replaced by DOC. Thus, changes in Raman cross sections, PL quantum efficiencies and peak shifts of the SWCNT electronic transitions due to a different surfactant surrounding, as found for example in ref. 29 and 30, can be avoided in this manner. In addition, chiralities such as (5,3), (7,2) and some others were found to have drastically reduced Raman cross-sections in SC, preventing them to be measured in the systematic studies, whereas dilution to DOC allows for obtaining their signals. In Fig. S2.1 in the ESI,† the Raman spectra obtained at 710 nm (in resonance with the (5,3) chirality) and 570 nm (in resonance with the (6,5), (6,4) and (7,2) chiralities) are shown for a solution with 1% wt/v SC before and after a factor of 2 dilution of that same solution with 4% wt/v DOC, yielding overall a 0.5% wt/v SC and 2% wt/v DOC concentration. While the Raman intensities of the (5,3) and (7,2) chiralities are almost completely quenched before the dilution, erroneously suggesting that the chiralities are not present, they clearly appear when diluting to DOC. For other chiralities in the same spectrum, like the (9,1) nothing changes, and yet for other chiralities like (6,5) and (6,4) small shifts are found when diluting to DOC due to the slightly different environment (see Fig. S2.1†). The dilution to DOC furthermore also helps to prevent changes in the RRS and PL spectra (peak position, linewidth) for two different SWCNT enantiomers, such that they can be simultaneously fitted and analyzed.
Sample characterization by means of optical spectroscopy
Absorption spectra were measured in the range of 200–2500 nm with a Varian Cary 5000 UV-VIS-nIR spectrometer inside 60 μL micro-cuvettes with an optical path length of 3 mm.The PLE experiments were performed with an in-house developed setup comprising a high-power pulsed Xenon lamp (Edinburgh Instruments, custom adapted Xe900/XP920) for the excitation and two liquid-nitrogen cooled complementary detectors for the emission, namely, an InGaAs detector (Pylon-IR, Princeton Instruments, sensitive up to 1700 nm) and an extended InGaAs detector (Princeton instruments OMA V:1024/LN-2.2, sensitive up to 2200 nm). The PLE maps were collected in a 90° geometry with the samples contained inside 3 mm pathlength (60 μL) microcells. PLE maps were acquired with an average resolution of 10 nm in emission and 8 nm in excitation, selected by the gratings and slits of the excitation and emission spectrometers (Acton Spectrapro 2355 and 2156, respectively). Before detailed fitting, all necessary corrections were performed for spectral and temporal variations of the lamp intensity and spectral sensitivity of the detector as well as for the inner-filter effect of both excitation and emission paths. With highly concentrated bottom and top phases, the samples were additionally diluted before measuring to allow for such an inner-filter effect correction.
RRS measurements were performed with a Dilor XY800 triple spectrometer with liquid nitrogen cooled CCD detector at different excitation wavelengths coming from an Ar+ ion laser (457 and 502 nm), a tunable rhodamine 6G dye laser (570 nm), Kr+ ion laser (647 nm), and a tunable Ti:sapphire laser (710, 725, 785 and 824 nm).
Combined, PLE and RRS allow us to access more than 30 different SWCNT chiralities (see Tables S8 and S9 in the ESI†), with some chiralities available by both techniques, allowing to cross-check the relative abundance changes based both on the RRS and PLE intensities. While in our previous work28 both bottom and top phases were measured, in this work we focused only on the bottom phases, since it was shown that the top phases represent mirror images of the bottom phases (i.e., when a chirality is removed from the bottom phase, it will directly appear in the top phase) and thus only one phase needs to be measured to provide all the information needed. Moreover, as the bottom phases have smaller volumes, they are also more concentrated and thus yield better signal-to-noise ratios in the spectroscopic characterization.
Intensity extraction by detailed 2D fitting
To extract the migration of these 30 chiralities between both phases as a function of a specific surfactant concentration, the RRS and PLE intensities (i.e. proportional to SWCNT concentrations) of the different SWCNT chiralities need to be accurately determined, for which we employ previously developed fitting models for RRS spectra4,27,31 and wavelength-dependent PLE spectra of SWCNTs.13,32–35In brief, Raman spectra are fitted with a sum of Lorentzians, one for each observed radial breathing mode (RBM). All Raman spectra within one systematic ATPE series are fitted simultaneously, meaning that position and line widths of the different RBMs are shared for all spectra, and only the relative amplitude of each RBM is allowed to vary between spectra. While the shared line widths and peak positions are optimized numerically by a least-squares algorithm, amplitudes of the RBMs in each spectrum are extracted analytically by linear regression. Whenever empty and water-filled SWCNT RBMs are clearly resolved through their difference in RBM frequency,4,31,35 we include two Lorentzians for each chirality: one for the empty and one for the water-filled SWCNT RBM signals.
Similarly, all PLE maps within one systematic ATPE series are fitted simultaneously with shared peak positions and line widths and varying relative amplitudes, using a 2D wavelength-dependent fitting model that we previously introduced.13,32–35 The model is based on an accurate description of the emission and excitation lineshapes for each chiral structure, including excitonic transitions, band-to-band transitions and phonon side bands, and is optimized to reduce the number of fit parameters to the minimum, for which more details can be found in the ref. 13 and 32–35.
Plotting the extracted RRS and PLE intensities as a function of the varied parameter then results in a transition curve between both phases for each detected chirality (n,m). Note that in principle the Raman spectra allow us to also extract intensities from empty (closed) and water-filled (opened) SWCNTs separately,4,14,31 which is only used when those empty and water-filled SWCNTs transition at a different concentration (see results and discussion). In all other cases (like the ones shown in Fig. S2.2†), intensities of empty and water-filled SWCNTs are summed together to provide a more accurate determination of the transition points.
Finally, to extract the transition points from these intensity curves, we follow the approach that we previously described in ref. 28 and fit the transition points with an error or complementary error function, allowing to extract both the transition points and the width of the transition, the latter determined as the standard deviation σ of the Gaussian distribution corresponding to the error function (i.e., meaning that 68% of the transition occurs within this concentration range). If available for the same phase, RRS and PL partition coefficient curves are fitted simultaneously in order to obtain the best values for the transition points for each chirality. In those cases where these fits were not good (e.g., due to a lack of experimental data points in the transition range), we estimated the width as the widest visible boundaries of the transition curve.28
Results and discussion
To reveal the differences in chirality-dependent stacking between the three different BSS that are displayed in Fig. 1, we performed a total of six different series of systematic one-step ATPE experiments that can be divided into two categories. First, we performed a series in which the concentration of each BSS is kept constant, while the concentration of the cosurfactant SDS is systematically increased. The main principle behind the transition of the SWCNTs between the two phases in such a series is the competition of the BSS and SDS on the SWCNT surface. While SWCNTs solubilized with SDS separate in the top phase, SWCNTs solubilized with DOC typically separate in the bottom phase. Therefore, addition of SDS results in less hydrophilic SWCNT/surfactant structures that then move to the top phase.28 For such a systematic ATPE separation to work, it is therefore important to select a suitable BSS concentration to start with, sufficiently high to obtain a good SWCNT dispersion and to separate the SWCNTs in the bottom phase, yet allowing for the BSS to be replaced at a feasible cosurfactant concentration.For DOC, the data of our previous work28 was used, where we based ourselves on the literature to define the exact concentration of DOC. Indeed, ATPE sorting using DOC as the BSS and SDS as a cosurfactant of SWCNTs with diameters in the range of HiPco SWCNTs typically uses a DOC concentration of 0.05% wt/v.11,23,24,30,36 To be exact, in this work we used a concentration of 0.0507% wt/v DOC, which results in the SWCNT chiralities residing mostly in the bottom phase in the absence of SDS. Using the same concentration for the two other BSS, however, results in strong aggregation of the SWCNTs and nearly all SWCNTs in the top phase or at the interface, hinting at a worse wrapping by those BSS in comparison with DOC and thus a smaller hydrophilicity of the BSS/SWCNT hybrid structures at the same BSS concentration.
To define the good concentration for the systematic ATPE studies with SC and CDOC, we therefore performed a systematic ATPE study in which only the BSS concentration is varied, without the cosurfactant, making sure that for the chosen fixed BSS concentration, without adding any SDS as cosurfactant, all SWCNTs reside in the bottom phase and have not yet started to transition. This resulted in the following determination of the fixed BSS concentrations for the SDS/BSS systematic series: 0.425% wt/v for SC and 0.35% wt/v for CDOC.
Systematic ATPE studies of SDS/BSS competitions
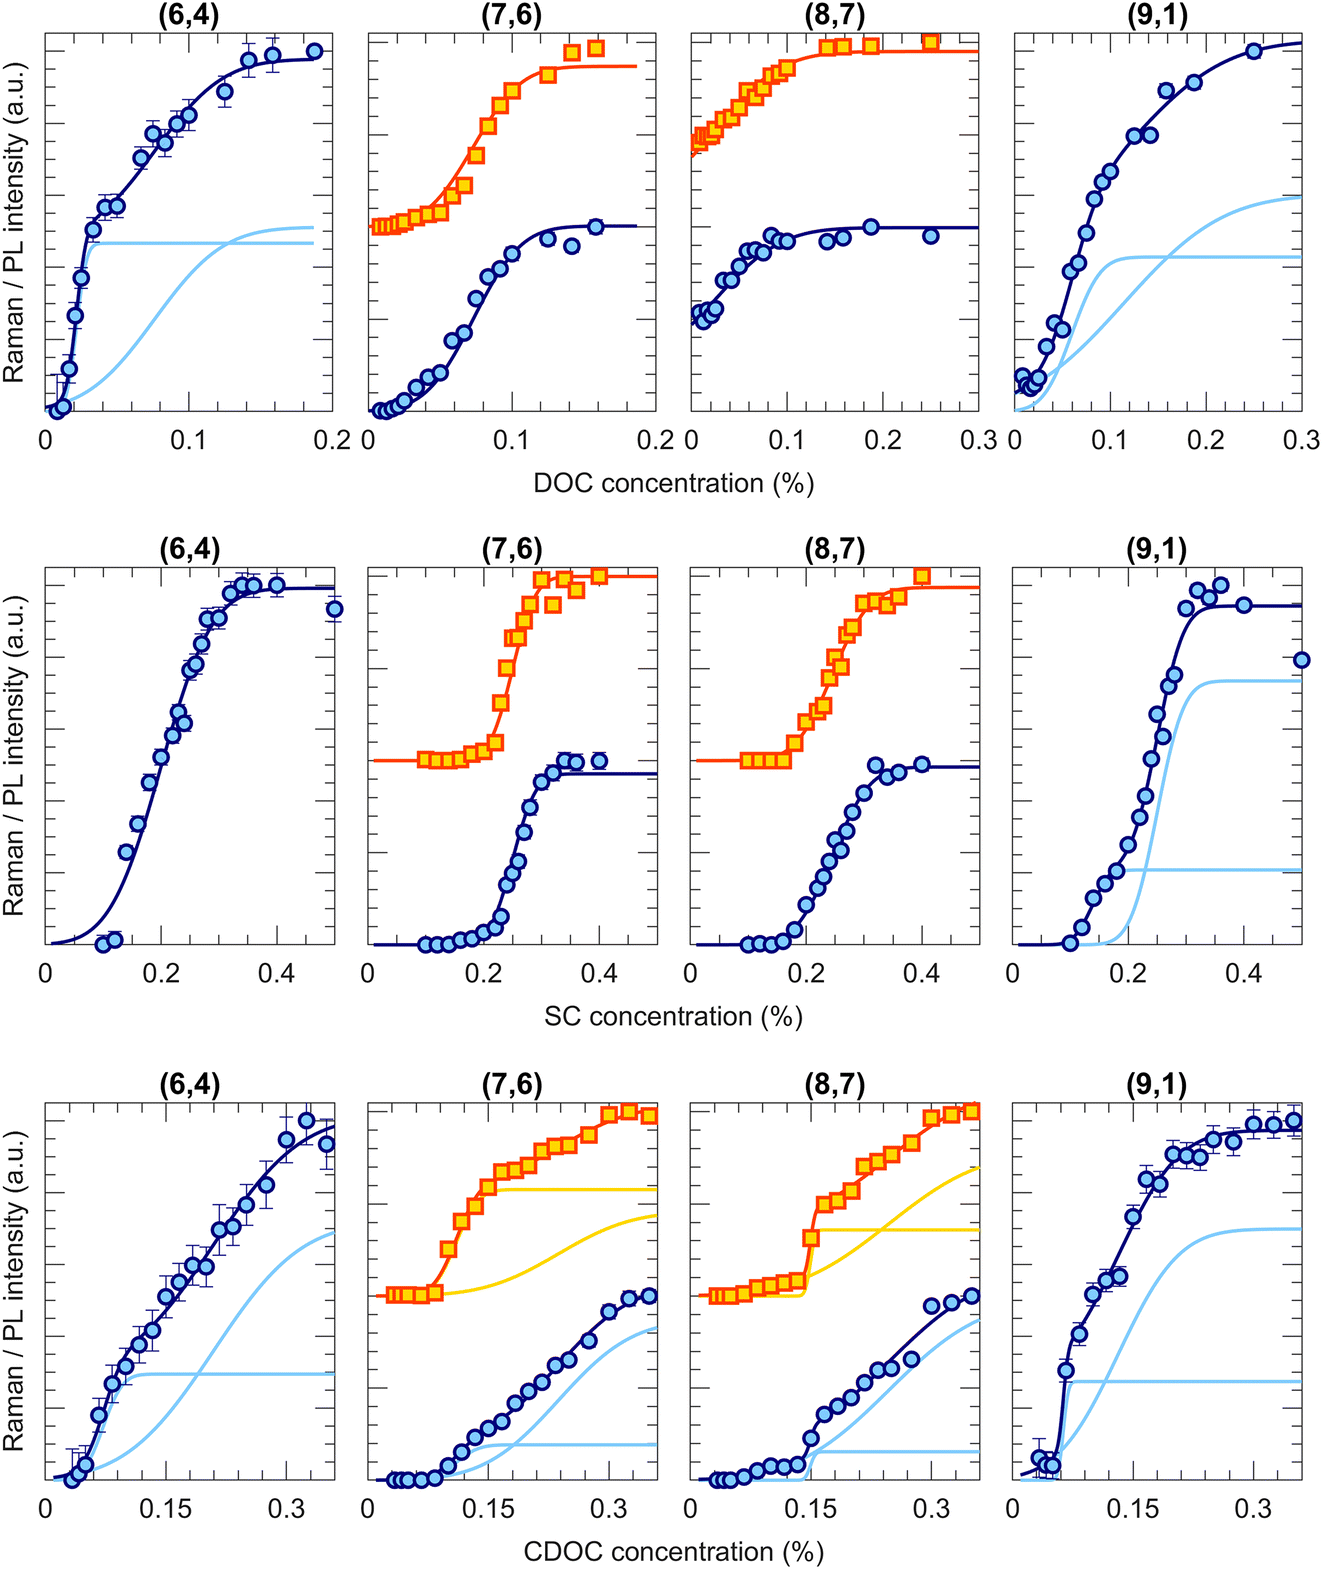
Fig. 2 shows a few examples of transition curves, where each marker point represents the intensity of that specific chirality in the bottom phase after an ATPE separation at a specific SDS/BSS ratio. Yellow squares are intensities obtained from fitting the PLE maps, while blue circles represent intensities obtained from the RRS spectra (all PLE maps, some examples of the PLE and RRS fits as well as additional transition curves from this work are given in Fig. S1.1–11, S3.1–8 and S4.1–2 in the ESI†). Whenever data from both techniques is available, both are plotted to make a direct comparison. As mentioned in the Methods section, each of the transition curves is fitted with a (sum of different) complementary error function(s) from which the transition point and the width of the transition can be determined. For all chiralities and all BSS, adding sufficient SDS moves the chirality from the bottom to the top phase, therefore decreasing the PL and RRS intensities in the bottom phase.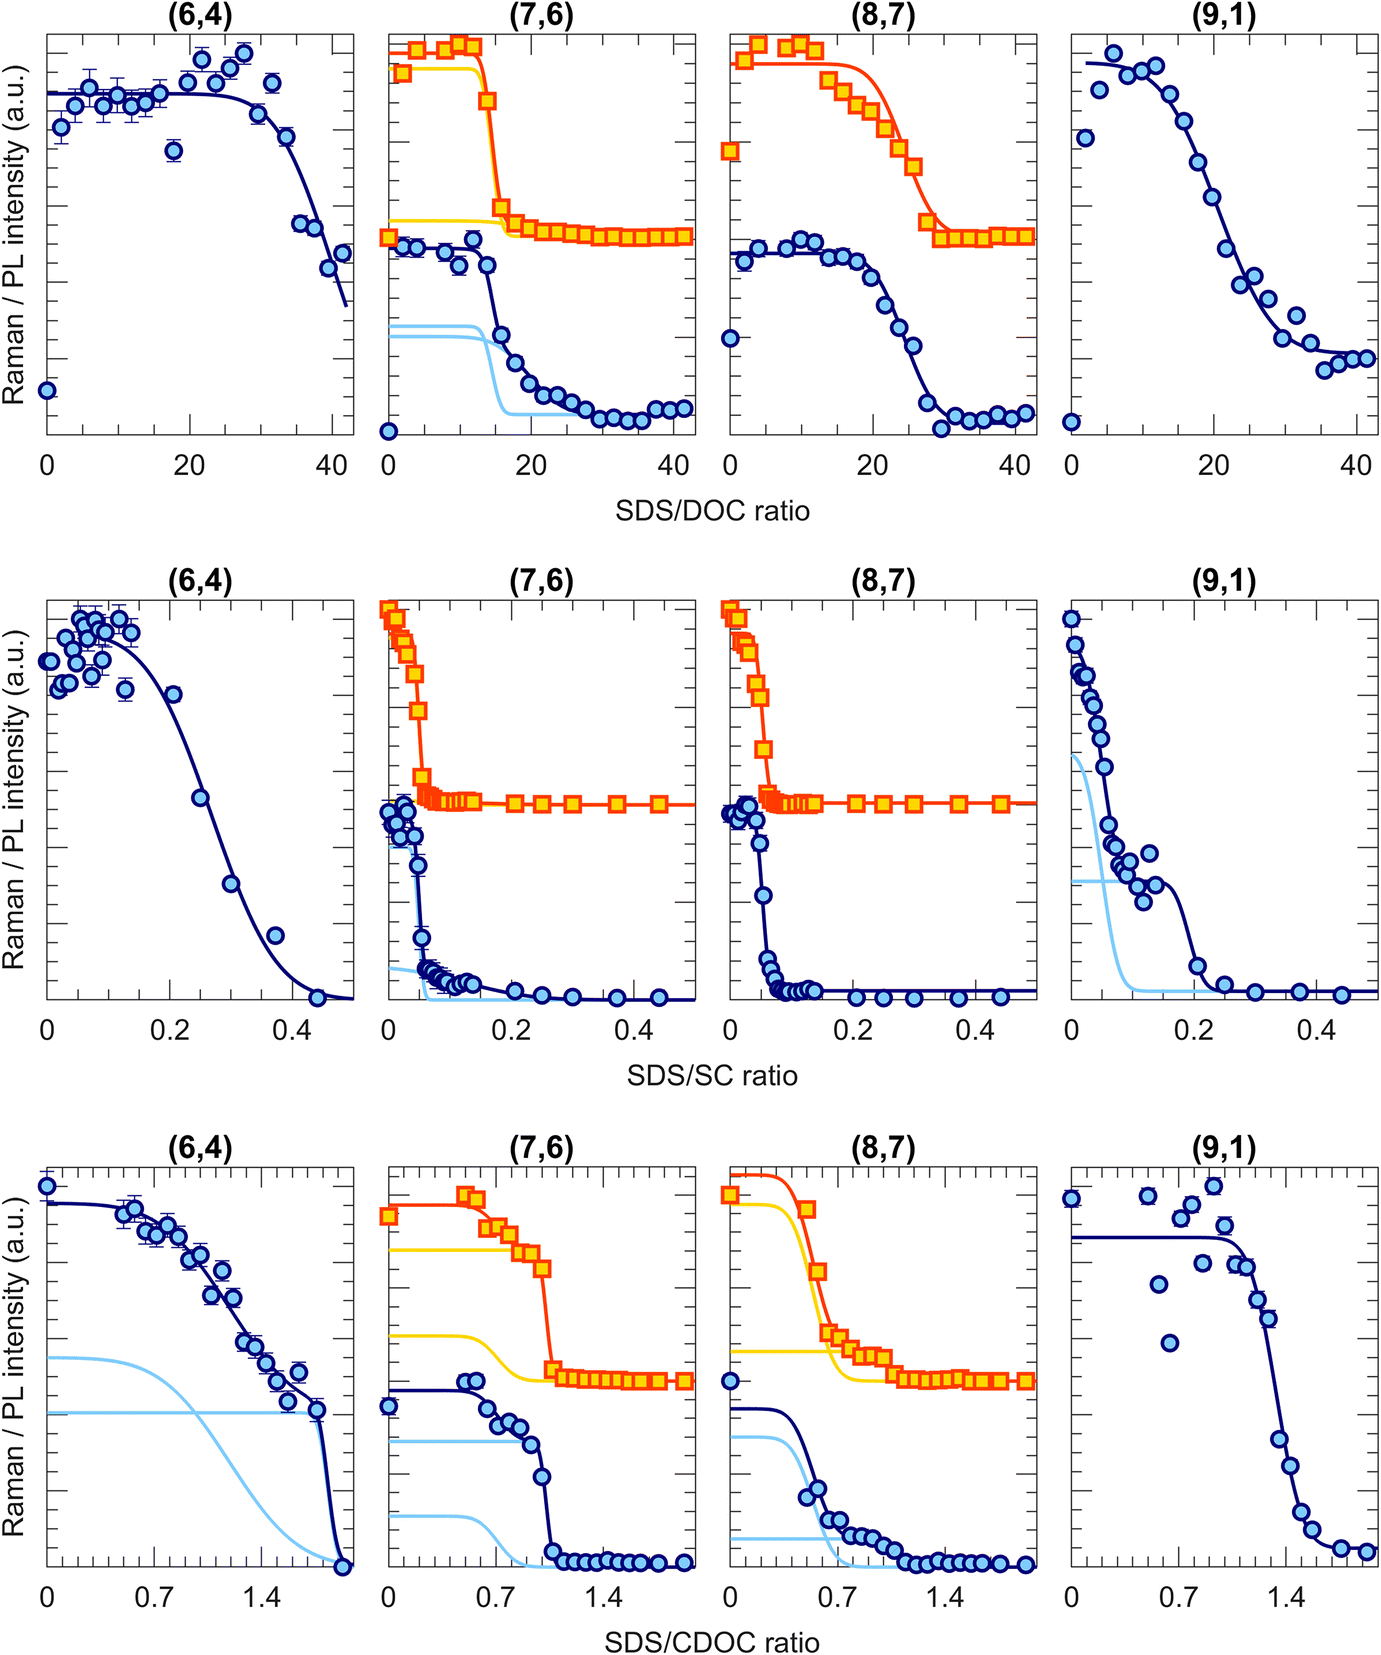 | ||
| Fig. 2 PL (yellow squares) and RRS (blue circles) intensities in the bottom phase, normalized for each chirality, for a representative set of SWCNT chiralities as a function of increasing SDS/DOC, SDS/SC and SDS/CDOC ratio (the upper, middle and lower rows, respectively). The BSS concentrations are kept constant at 0.0507% wt/v, 0.425% wt/v and 0.35% wt/v for DOC, SC and CDOC, respectively, while the SDS concentration is systematically increased. Transition points are obtained by fitting the data with a (sum of) complementary error functions of which the individual components are presented in yellow and light blue, and their sums are shown in orange and darker blue. We also plot the 1σ error bars on the data points (as obtained from the fit) even though they are not always visible as they are typically smaller than the size of the symbols. | ||
Interestingly, different transition curves are observed, either consisting of a single transition (e.g., (9,1) for SDS/DOC and SDS/CDOC, (8,7) for SDS/SC) while others consist of two steps (e.g., (7,6) for SDS/CDOC, (9,1) for SDS/SC). Such two-step transitions can be assigned to a different transition of left- and right-handed SWCNTs. Although the current one-step ATPE separations do not allow for circular dichroism studies to confirm the presence of these two enantiomers, since the single-step fractions each time still contain many different chiral structures in different relative concentrations, we can assign these two steps to the two enantiomers based on the previous work of M. Zhang et al.37 Indeed, by countercurrent chromatographic ATPE separations, in which the DOC concentration is kept constant and the SDS concentration is continuously increased while collecting fractions as a function of time, it was shown that some chiralities are eluted from the countercurrent setup at two distinct SDS concentrations. Those two fractions were afterwards found to show an inverse sign in circular dichroism. Such two elution SDS concentrations will be observed as two-step transitions in our work evidencing that two different surfactant concentrations can be required for sorting left- and right-handed SWCNTs. Indeed, the BSS used in this work only occur in one enantiomeric species (natural chiral surfactants) and thus might stack slightly differently around left- and right-handed SWCNTs. Similarly, also Sims et al.29,30 observed two-step changes of the PL emission intensity when titrating SDS to a DOC/PEG solution of SWCNTs, which were ascribed to the two enantiomers reacting differently to the addition of SDS to the surfactant layer. The observation of two transitions thus shows that ATPE is sufficiently sensitive to distinguish between these two enantiomers, allowing for enantiomer separations if the transition points are sufficiently separated from each other (e.g., the (9,1) chirality for SDS/SC in Fig. 2). Indeed, similar surfactant combinations have been found to allow for sorting different enantiomers from each other.10,13,30,37,38 Note that SWCNT samples are expected to contain a racemic mixture of left- and right-handed SWCNTs after synthesis, but a slight bias may result from solubilization and centrifugation to prepare the starting solutions. Moreover, due to the different interaction with the chiral BSS, the PL and RRS intensities can be very different, thus resulting in two steps with different amplitudes. Moreover, typically the width of the transition is also different for the two enantiomers, where most likely the narrowest transition can be assigned to those enantiomers that are best wrapped with the chiral surfactant.
It is important to note that a double transition is only assigned to enantiomers if it is clearly visible with a significant intensity. In some cases, for example the transition curve for the (7,6) chirality for the SDS/SC combination, the second step is only visible in RRS and not in PLE and has a very low intensity. In those cases, we assign the broad transition to a transition of small bundles, which remain visible in RRS but result in quenching of the PLE intensity.28 Therefore, we only include this transition to our fitting model to fit the other transition better, but they are not taken into account further on in the text and figures.
Taking the results for all the 37 chiralities that we detected with PLE and RRS, two-step transitions (i.e., two enantiomer steps) are observed for 13 of the considered chiralities for the SDS/DOC and for 7 for the SDS/CDOC separations, while being present only for the (9,1) chirality in the results of the SDS/SC experiments. Interestingly, the observation of such enantiomer steps depends significantly on the chirality itself and on the BSS. For example, note that the (6,4) and (9,1) chiralities demonstrate single or double transitions depending on the specific BSS, thus showing that the exact chiral structure and specific stacking of the chiral BSS on the walls of left- and right-handed enantiomers can be sometimes resolved in ATPE. It is worth mentioning that the steeper a transition is, the more interesting it is for the separation purpose.28
ATPE separation differences for empty and water-filled SWCNTs
Among the three SDS/BSS combinations, the case of SDS/SC is of particular interest. Normally, when fitting a RRS partition coefficient curve of a particular chirality, we work with the sum of the corresponding curves of empty and water-filled SWCNTs, because either the difference between transition curves for the empty and water-filled SWCNTs is negligibly small (see Fig. S2.2 in the ESI† for some examples) or empty and water-filled RBMs are not sufficiently resolved spectroscopically and thus fitted with only one Lorentzian. Interestingly, for 13 chiralities out of 37 studied in the SDS/SC ATPE series, the empty and water-filled SWCNTs transition between both phases are at distinguishably different surfactant concentrations. Thus, we fitted each transition curve separately, which led us to the results summarized in Fig. 3. The RRS spectra and their fit along with the corresponding transition curves are shown using the examples of the (5,4), (6,5) and (12,2) chiralities, while the transition points and linewidths are plotted in Fig. 3(g) for all 13 considered chiralities. Even though the transitions for the empty and water-filled SWCNTs of a particular chirality overlap, they can be clearly distinguished in almost all the cases. The transition points differ on average by approximately 0.0064%wt/v SDS, allowing one to potentially isolate empty and water-filled SWCNTs of some chiralities by ATPE in the future. It is very intriguing that filling with a single or double file of water molecules has such an effect on the sorting for just one particular BSS.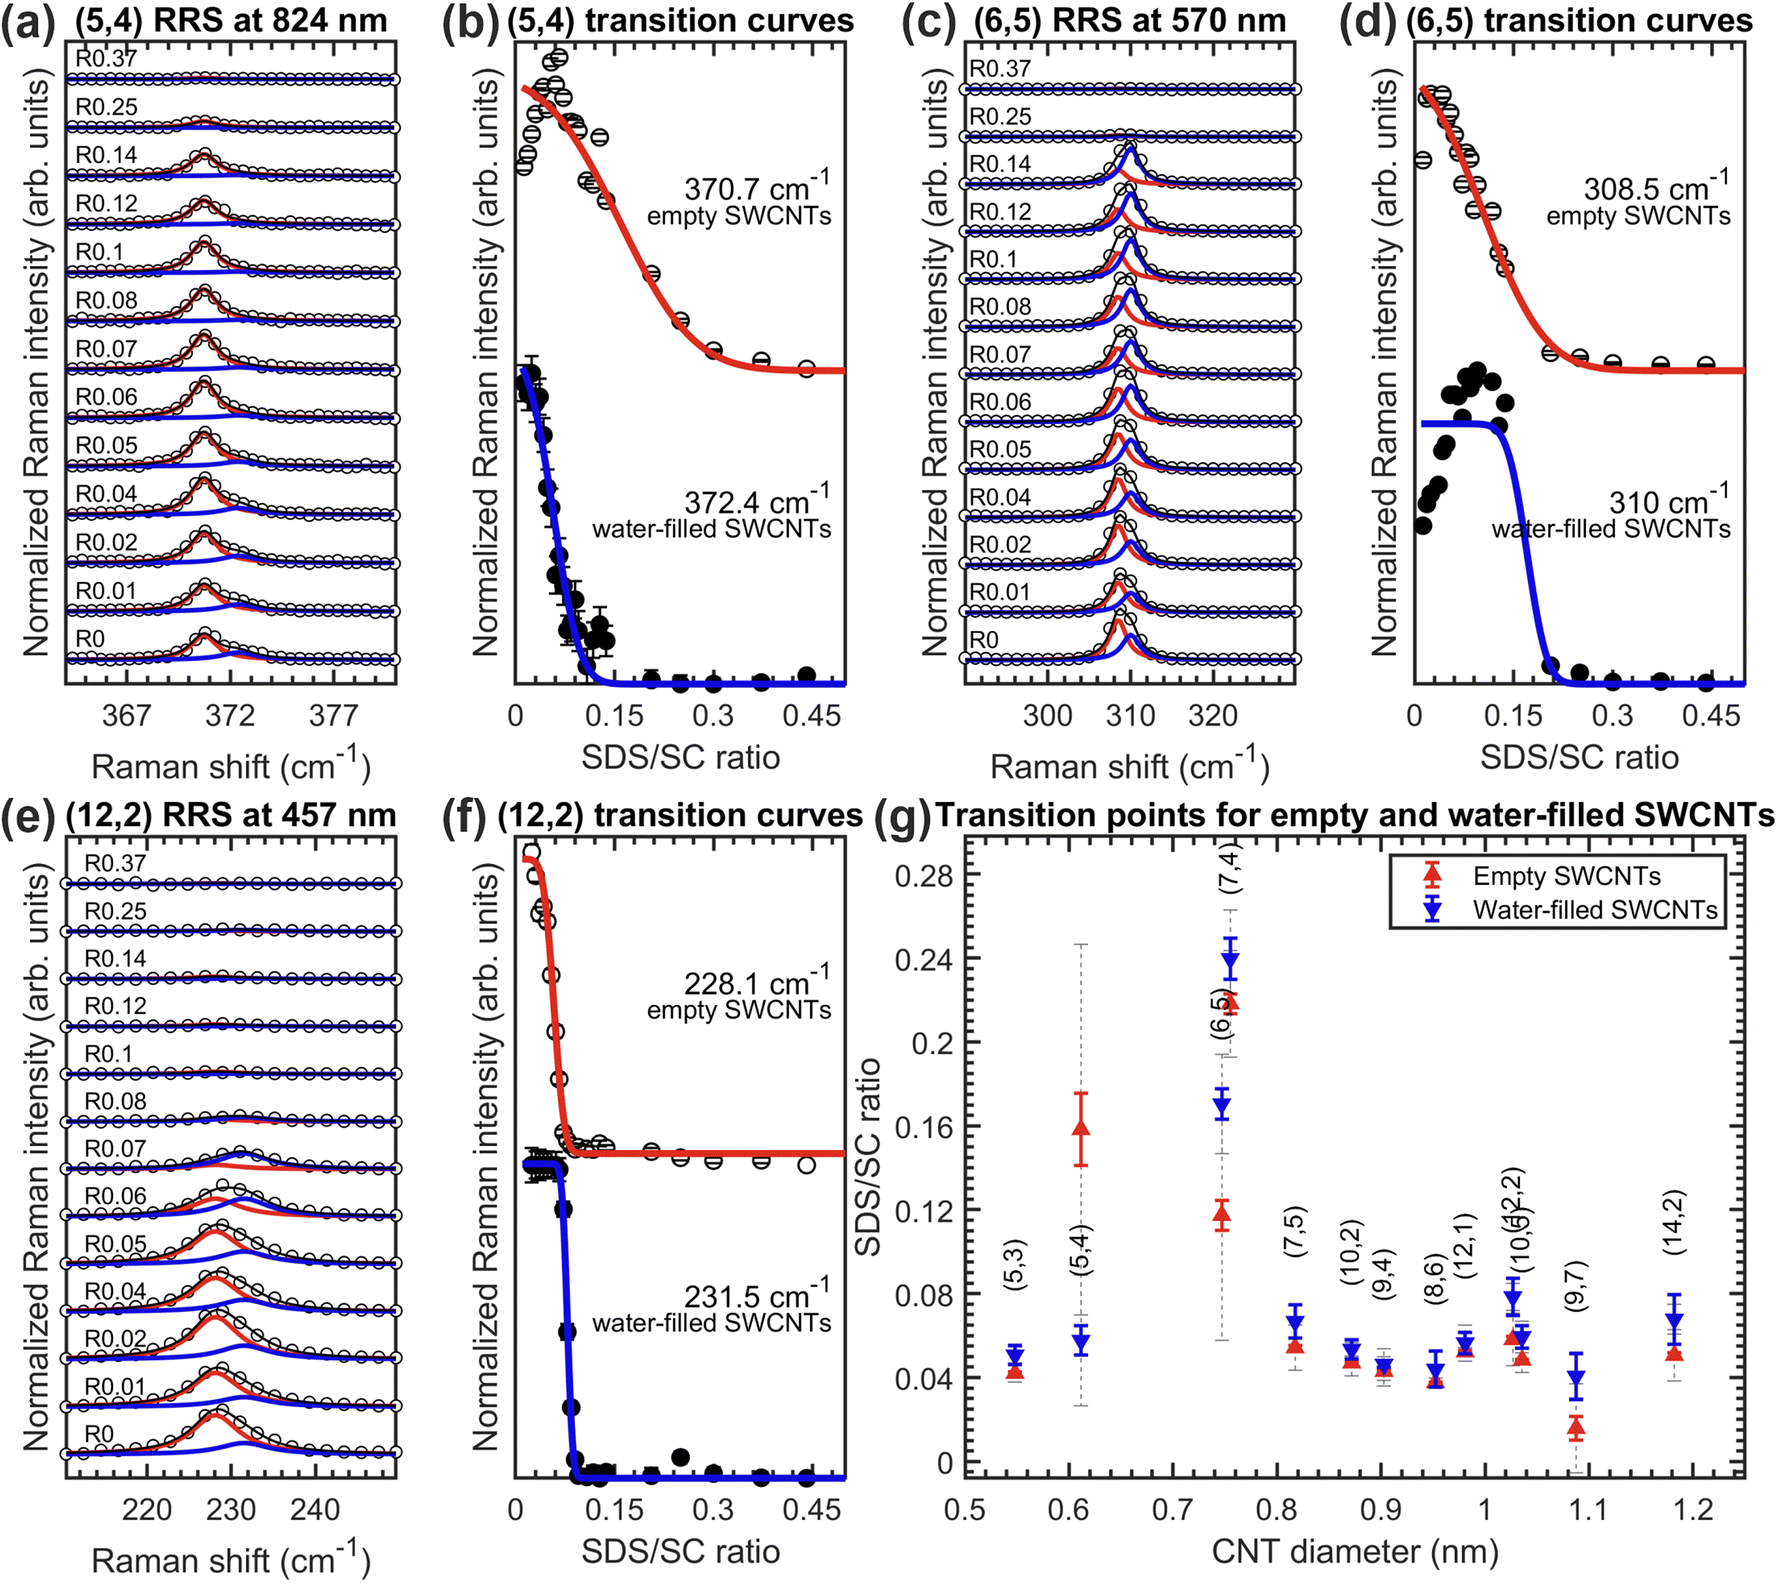 | ||
| Fig. 3 Empty and water-filled separations with SDS/SC, in particular (a, c and e) a selection of Raman spectra of the (5,4), (6,5) and (12,2) chiralities obtained in the bottom phase at 824, 570 and 457 nm, respectively (open circles) and their fit (in black) with two Lorentzians corresponding to the RBMs of empty (in red) and water-filled (in blue) SWCNTs. The ratios of SDS/SC for the shown spectra are denoted with R#; (b, d and f) Raman transition curves for empty (open circles) and water-filled (filled circles) (5,4), (6,5) and (12,2) SWCNTs and their fit with a complementary error function shown with the red and blue lines, respectively; (g) an overview of transition points for empty and water-filled SWCNTs of those chiralities for which a distinction between the transition curves is well-resolved. Dashed grey error bars are the transition linewidths obtained from the fit procedure (defined as the standard deviation or width (σ) of the corresponding Gaussians), blue and red error bars are 1σ errors of the transition point fit. | ||
In all but one chirality, the empty SWCNTs move first to the top phase, which seems to indicate that the endohedral water molecules make the SWCNT/surfactant hybrids slightly more hydrophilic. On the contrary, for the (5,4) SWCNT, the most upshifted RBM frequency, assigned to the water-filled SWCNTs, moves first to the top phase, as presented in the Fig. 3(a and b). In fact, only for the (5,4) chirality, the empty and water-filled SWCNT transition differently also for the SC and CDOC alone separations (vide infra, Fig. 6(b and c)). In these cases, the water-filled SWCNTs transition at higher BSS concentration than the empty ones, which would point out, similarly as in the SC/SDS case, that for the (5,4) chirality the water-filled SWCNTs are less hydrophilic than the empty (5,4) SWCNTs. Further investigation is needed to unravel the origin of this peculiarity.
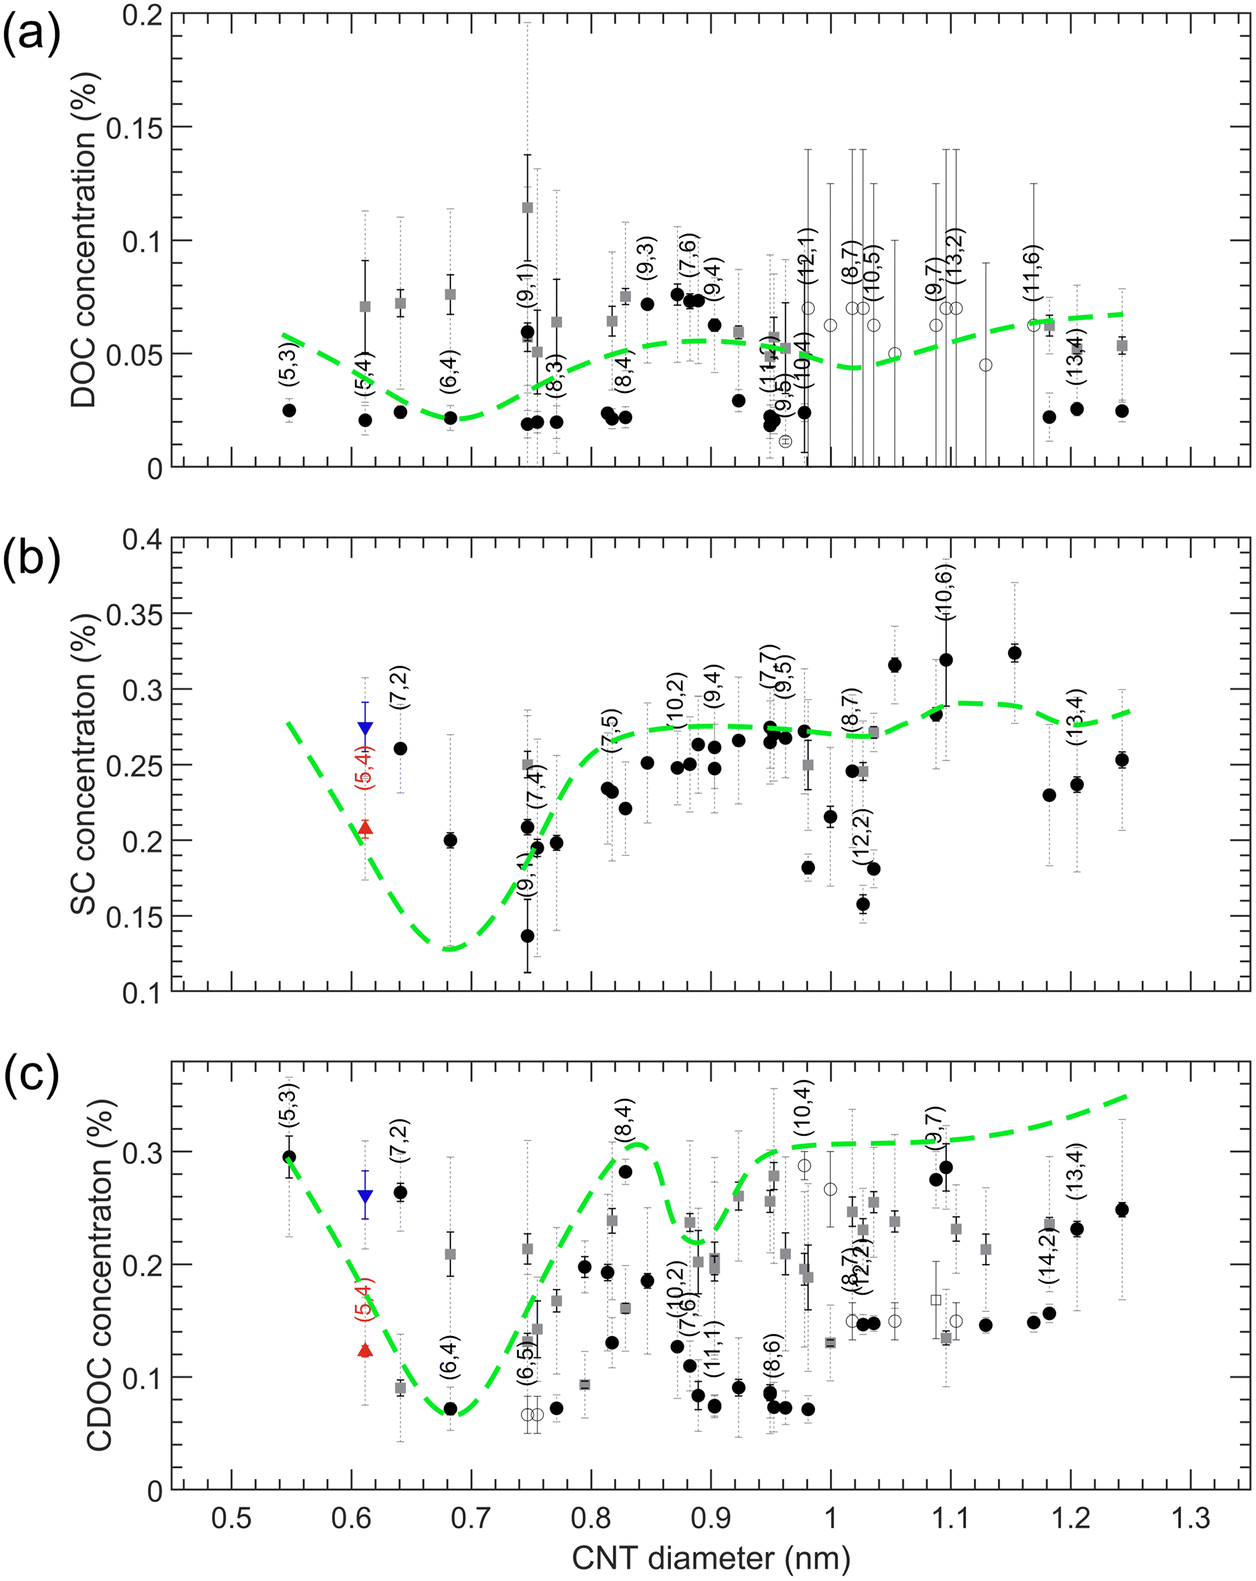
Diameter-dependent stacking of the BSS on SWCNTs
The results for transitions from the bottom to the top phase as a function of SWCNT diameter for SDS/BSS separations are summarized in Fig. 4 (numerical values of the transition points are presented in Tables S10–S12†). For the single-step transitions, transition points are plotted in black, while for the enantiomer-sensitive double-step transitions, we plot the steepest one in black, being the most important one for developing sorting methodologies, and the other, broader transition is plotted in dark grey. For the case of SDS/SC, the single transition points of empty and water-filled SWCNTs are plotted in red and blue colors. For each of the SDS/BSS cases, we observe a clear dependence on CNT diameter, which we highlight by a green dashed line serving as a guide to the eye. Interestingly, we find that the first maximum in the diameter-dependent modulation pattern occurs for all BSS for the same diameter of about 0.7 nm, corresponding to the (6,4) chirality, while for larger diameters a very different pattern is observed. While for SDS/DOC a second maximum is observed at ∼1.05 nm, for SDS/CDOC it is observed at ∼0.92 nm. At first sight, a second maximum is missing for the SDS/SC case, though a small ‘bump’ is observed at the same position where the maximum of SDS/DOC is seen. A third small ‘bump’ for the SDS/SC case at ∼1.2 nm can be noticed as well.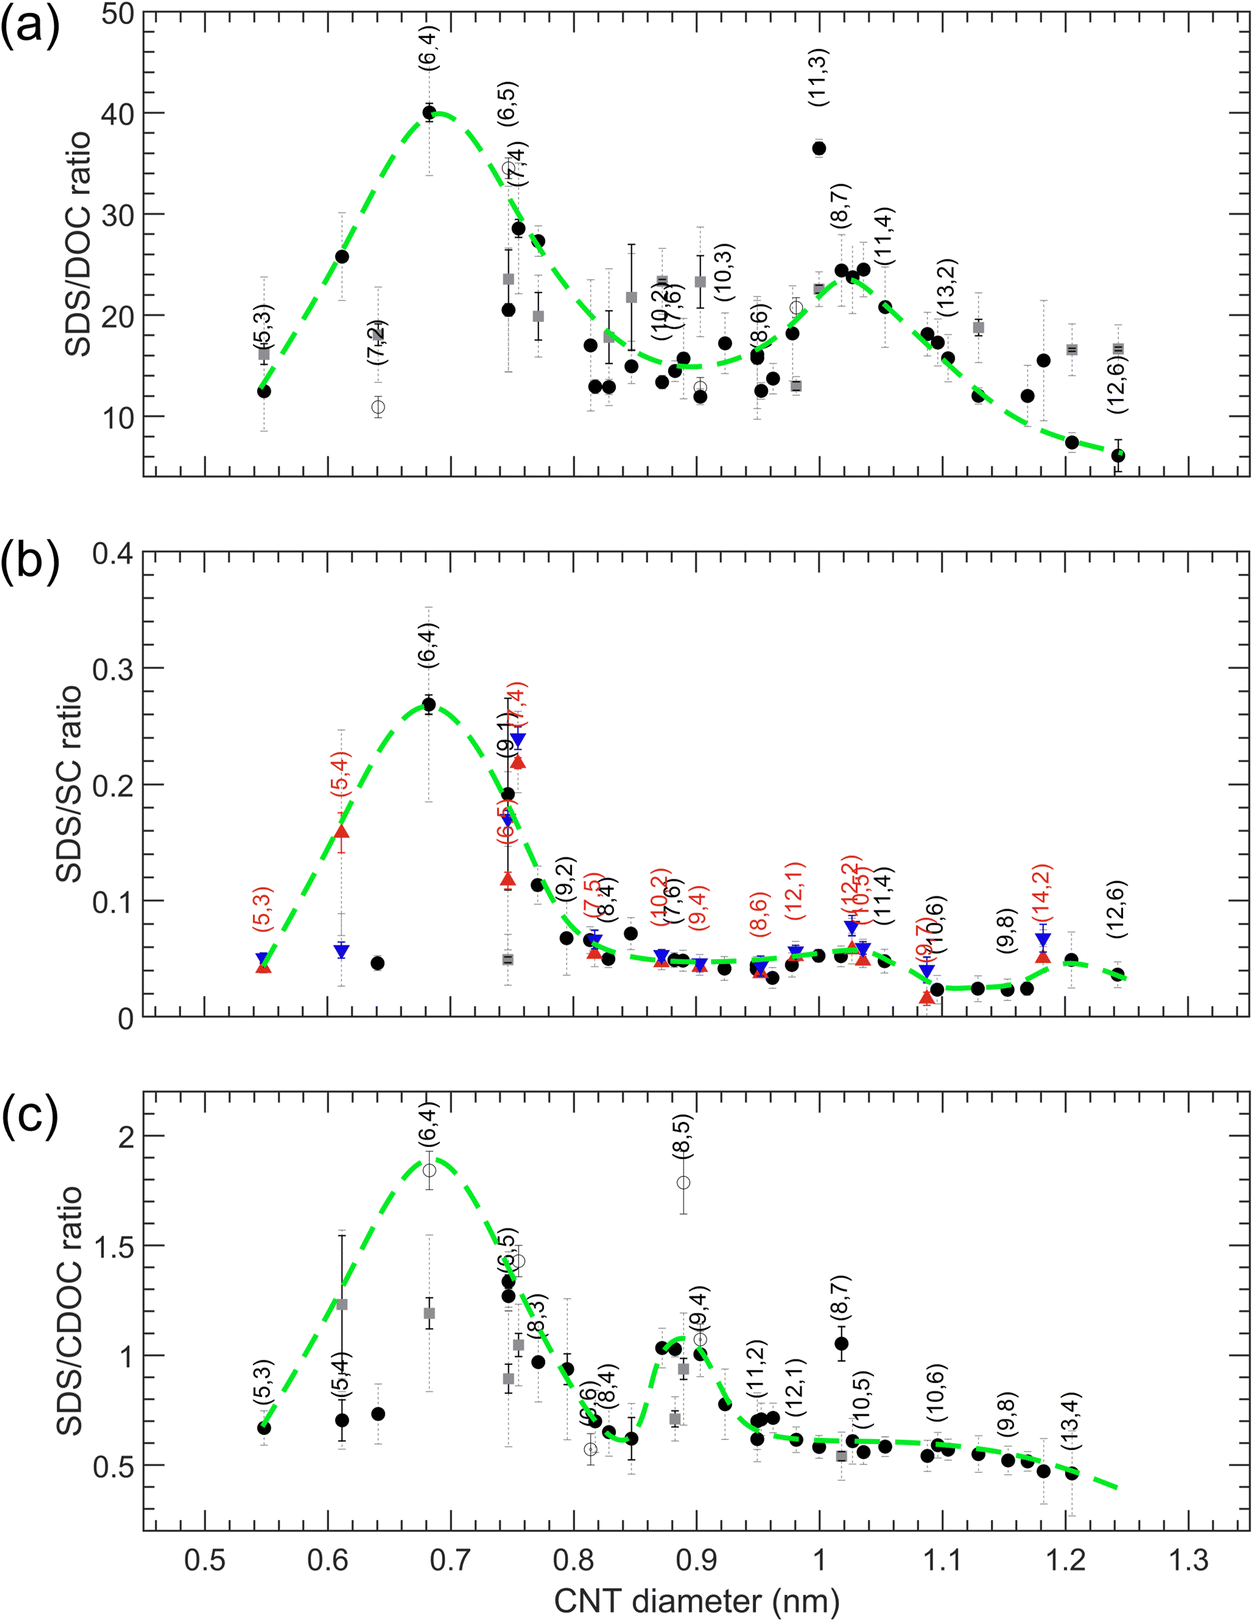 | ||
| Fig. 4 Bottom to top phase transition SDS concentrations (defined as SDS/BSS ratio) for SWCNTs in SDS/DOC (a), SDS/SC (b) and SDS/CDOC (c). The BSS concentrations are kept constant at 0.0507% wt/v, 0.425% wt/v and 0.35% wt/v for DOC, SC and CDOC, respectively, while the SDS concentration is systematically increased. The single or steepest transitions are presented in black, the other, broader transitions are presented in dark grey, while empty and water-filled transition points are shown in red and blue respectively. Transition linewidths are presented in dashed grey lines, transition point 1σ fit errors are shown in black. Open symbols correspond to visually estimated (not fitted) transitions, with the width determined by the two data points at lower and higher concentration from the transition. The green dashed curves are empirical lines to highlight the diameter-dependent modulation pattern. Note that for SDS/DOC the (6,4) and (12,2) SWCNTs have not fully transferred yet to the top phase at the highest SDS concentrations, so we therefore take the lowest possible concentration at which the transition takes place without showing an upper error bar. | ||
The significant difference between the different BSS shown in Fig. 4 is quite intriguing, given the very minor difference in structure of the three BSS, differing typically by only one hydroxyl group (Fig. 1). Previous in situ density gradient ultracentrifugation studies already showed marked differences between SC- and DOC-covered SWCNTs, finding a thicker overall surfactant layer for SC-wrapped SWCNTs as compared to DOC-wrapped SWCNTs, when analyzing densities of SWCNTs with a diameter ranging from 0.75–1.45 nm.27 For larger diameters (>1.2 nm), a marked change in density was observed for SC-wrapped SWCNTs, which was attributed to the specific shape of the BSS. It was postulated that for SC, the three OH groups on one side of the semi-rigid cholesterol group divide the BSS molecule into a polar and apolar face, such that the SC molecules will adopt a flat face-on stacking onto the SWCNT structure, while for DOC, the missing OH group on one side could allow for a more flexible stacking where DOC molecules can partially overlap.27 Secondly, analytical density gradient ultracentrifugation studies of chirality-purified (6,5) SWCNTs (diameter = 0.7468 nm) covered with DOC and SC showed that for that (6,5) chirality, the DOC hydration layer was thicker than observed for SC, which could hint again at a more overlapping surfactant wrapping whereas SC adopts a more face-on stacking on the SWCNTs.39 Finally, large-scale MD calculations40 of SC stacking on a (6,6) SWCNT found that a ring of surfactant molecules is formed around the SWCNT with the hydrophobic faces pointing inward (to the SWCNT) and the hydrophilic faces (having oxygen atoms) pointing outward, allowing for a maximal contact area between the hydrophobic SWCNT walls and the SC molecules. Interestingly, in those studies it was found that regardless of the specific SC concentration, SC molecules prefer to stack in a ring-like, side-by-side compact manner around the (6,6) SWCNT circumference, with the long axis of the surfactant molecules oriented parallel to the SWCNT axis, leaving open spaces at some parts of the SWCNT, such that the total thickness of the surfactant layer remains intact at higher concentrations, which is very different from SDS which was found to stack more randomly on the SWCNT walls, yielding a thicker surfactant layer at higher concentrations.41 Finally, these large-scale MD calculations find that the SC molecules tend to stack not only parallel to the SWCNT axis, but also perpendicularly to it, and although only one chirality was modelled (the (6,6) chirality), the ratio between these two configurations will probably change according to the SWCNT diameter (i.e., SWCNT wall curvature), due to the rigidity of the cholesterol groups.40 Unfortunately, such MD simulations as a function of SWCNT chiral structure or for the other BSS are not yet available to corroborate these results.
Systematic ATPE with only the BSS
Taking these previous findings in consideration, the different stacking of the BSS, e.g., different orientation along the SWCNT backbone, might be at the origin of the observations in Fig. 4, however, the role of the surfactant SDS cannot yet be ruled out. Therefore, we performed systematic ATPE experiments of the BSS by varying the BSS concentration, without adding any SDS.Examples of the corresponding transition curves are presented in Fig. 5, where in this case, with increasing BSS concentration, each time more chiralities end up in the bottom phase. In the case of DOC, 17 of the 36 studied chiralities demonstrate their first, steep transition at DOC concentrations below 0.04% wt/v (see (6,4) and (9,1) in Fig. 5, the upper row), which indeed shows that at the above used concentration of 0.0507% wt/v for SDS/DOC, these chiralities are all in the bottom phase without addition of SDS. For 11 of the considered 36 chiralities, however, a full transition cannot be observed, as even at the lowest possible DOC concentrations (before the SWCNTs bundle) the SWCNTs have not yet fully transitioned to the top phase, like for the (8,7) chirality (Fig. 5, the upper row). For the SC alone experiment, 4 of the studied 34 chiralities show two-step transitions (like (9,1) in Fig. 5, the middle row), which is more than in the case of SDS/SC but significantly less than observed for DOC and CDOC. Indeed, for the CDOC alone case, two-step separations take place for 29 of the considered 38 chiralities (like all the examples shown in Fig. 5, the lowest row). This fact brings us to the conclusion that in general, DOC and CDOC are more sensitive to the difference between enantiomers than SC (see Tables S10–S15†). Interestingly, when including the cosurfactant SDS, the enantiomeric sensitivity is lost for some chiralities: indeed, for CDOC 29 (out of 38) transitions show two step transitions, while for SDS/CDOC only 7 (out of 37) transitions show a double step. Similarly for SC alone, 4 (out of 34) chiralities show two-step transitions while only one chirality (out of 37) shows a two-step transition for SDS/SC and also for DOC alone almost one half of the transitions show two steps (17 out of 36), while for SDS/DOC one-third shows two steps (13 out of 37).
 | ||
| Fig. 5 PLE (yellow squares) and RRS (blue circles) intensities in the bottom phase, individually normalized, for a representative set of SWCNT chiralities as a function of the DOC, SC and CDOC concentration (the upper, middle, and lower rows, correspondingly). Data were fitted with a sum of error functions (orange and dark blue lines) of which the two separate components are shown with yellow and light blue lines. Note that error bars on the data points are also plotted but are typically smaller than the size of the symbols. | ||
The results of these three experiments are also summarized in the overview Fig. 6 (numerical values of the transition points are reported in Tables S13–S15†). In contrast to the SDS/BSS separations, in this case the SWCNT diameters that are better covered with the BSS will separate into the bottom phase at lower BSS concentrations while in the SDS/BSS combination those SWCNTs require a higher SDS concentration to separate to the top phase. One thus essentially expects a (scaled) mirror image of the modulation pattern presented in Fig. 4, which is represented by inverting the green dashed lines from Fig. 4 when plotting them in Fig. 6. For DOC, a direct comparison with the mirrored modulation pattern is difficult, as most of the chiralities with diameters above 0.96 nm show unfinished transitions at the lowest DOC concentrations. Nevertheless, we do observe a valley in the modulation pattern corresponding to the (6,4) diameter. In this case the use of a cosurfactant like SDS therefore helps to distinguish better between the small variations between the different chiralities, spreading them from each other. For the SC and CDOC alone separations (Fig. 6(b and c)), along with the first ‘valley’ seen at approximately the same position as for the DOC alone case, two other ‘valleys’ are distinguishable: the ones at ∼1.04 nm and ∼1.18 nm for SC, ∼0.95 nm and ∼1.15 nm for CDOC. For these two surfactants, it can be clearly seen that the absence of SDS uncovers the second and the third ‘valleys’ for SC and CDOC alone separations. It is interesting to note that the ‘valleys’ for CDOC are much broader in diameter range than for SC, implying that SC is more sensitive to the SWCNT diameter than CDOC.
 | ||
| Fig. 6 Top to bottom phase BSS transition concentrations for SWCNTs in DOC (a), SC (b) and CDOC (c) when increasing the BSS concentrations. The color coding is the same as for Fig. 4. The green dashed curves represent the scaled and mirrored guide-to-the-eye curves for SDS/BSS separations (taken from Fig. 4) shown for comparison purposes only. | ||
These results indicate that the competition of the BSS with SDS clearly affects the diameter-dependent separation order and the sensitivity towards enantiomers, the exact origin to be found in the specific stacking of the BSS molecules on the SWCNT walls. Reconsidering the MD calculations previously performed for SC in literature,40 it was found for a (6,6) SWCNT that the surfactant molecules preferentially stack with their long axis parallel to the SWCNT axis, leading to a ring-like compact stacking, while also a fraction of those surfactant molecules stack with their long-axis perpendicular to the SWCNT axis. It was hypothesized that the ratio between such compact ring-like stacking and a more perpendicular stacking will depend strongly on the exact diameter of the SWCNT. Indeed, in our previous work,28 we showed that the (6,4) SWCNT diameter perfectly matches with a discrete set of 7 DOC molecules fitting exactly around the SWCNT circumference and leaving no additional space for the cosurfactant. For such a diameter, it can therefore be expected that the perpendicular stacking is much less present than in the case of e.g., the (6,6) diameter, i.e., d = 0.8136 nm, for which a discrete number of BSS molecules cannot fully wrap the SWCNT circumference. Since for the perpendicular stacking, the interaction of the BSS with the SWCNT wall will be smaller, due to the SWCNT curvature and the rigid bended form of the BSS molecules, it might be easier to replace those perpendicularly stacked surfactant molecules with the cosurfactant SDS. This would then imply that transitions to the top phase will occur at lower added SDS concentrations for SWCNTs with relatively more perpendicularly stacked surfactant molecules. Previously, we also found that the second peak in the DOC modulation pattern as a function of SWCNT diameter most likely corresponds to a compact, ring-like packing with 8 DOC molecules, oriented parallel to the tube axis. However, we hypothesize that for these larger diameters, due to the lower curvature of the SWCNT wall, a less pronounced difference could be present between the two types of stacking, making it more dependent on subtle factors such as the exact BSS structure. As a result, SC and CDOC may align perpendicular to the tube axis (or at an angle) for these larger diameters, while for the small diameters corresponding to the first peak in the modulation pattern all three surfactants align in rings around the tubes with their long axis along the tube axis. This would explain why the second (and third) peak is largely suppressed for SC when combined with SDS and occurs at a different diameter for CDOC (because the non-parallel oriented surfactant molecules are more easily replaced by SDS), as well as the behavior observed when combining SC and DOC at the same time. Undoubtedly, the reason of such a difference in the BSS performance lies in the small though significant difference in their chemical structure and the stacking behavior considered above, making it an inspiring and promising topic for future theoretical studies, including more than one chiral SWCNT structure and different surfactant structures.
Combining SC, DOC and SDBS for chiral sorting
Previously, it has been shown that SC enhances the separation of (6,5) and (6,4) SWCNTs in combination with SDS/DOC,11 providing a higher yield. Also in other studies, combinations of SC/DOC/SDS sorting allowed for structure sorting, e.g., of particularly large SWCNT diameters.13 Moreover, in our previous work we demonstrated that using as a cosurfactant SDBS instead of SDS, it can also aid at increasing the separation yield, since the DOC concentration in that case can be doubled as SDBS is a stronger competitor for DOC than SDS.28 The previous results that the combination of SDS, DOC and SC enhances the (6,5)/(6,4) separations,11 can now be understood by the fact that both SC and DOC nicely fit around these specific diameters, therefore leaving the stacking highly ordered around these diameters even for the mixture of SC and DOC while making the surfactant stacking much less ordered for all other chiralities. To evidence this, we performed a new systematic ATPE experiment, in which we vary the addition of SC while keeping the SDBS and DOC concentrations constant slightly below the previously determined SDBS/DOC ratio for (6,5) sorting.28 In that work, the ideal ratio for SDBS/DOC separation of (6,5) SWCNTs was 12 at a DOC concentration of 0.1% wt/v. We therefore choose here to fix the ratio of SDBS and DOC to 11, i.e., an SDBS concentration of 1.1% wt/v and a DOC concentration of 0.1% wt/v, slightly below this ratio such that for sure the second transition of the (6,5) SWCNTs to the top phase has not started yet. Then, we increase the SC concentration from 0 to 1.5% wt/v to show how we can further increase the separation yield, while maintaining a similar chiral purity.Examples of the transition curves for this experiment are shown in Fig. S5 in the ESI.† At the chosen SDBS/DOC ratio without adding SC, the (6,4), (6,5), (11,3), (11,4) and (12,2) chiralities have not yet fully transitioned to the top phase and a non-negligible fraction is thus still present in the bottom phase, as previously shown in ref. 28. The curves for (11,3), (11,4) and (12,2) resemble each other (see, e.g., Fig. S5 in the ESI† for the (12,2) chirality). In turn, the curves for (6,4) and (6,5) take similar form as well (they start at about a 0.5 normalized intensity at 0% wt/v SC) but have different width and steepness of the second transition. (8,3) is the only chirality from the whole set that shows two transitions, while all the rest demonstrate one transition that looks like (9,5) in Fig. S5.†
The results of this experiment are presented in Fig. 7 and Table S16.† What is interesting is that for the (6,5) chirality, addition of SC enhances the concentration in the bottom phase smoothly, while for other chiralities, steep curves are obtained. It then comes to choosing an appropriate SC concentration that is as high as possible to increase the (6,5) yield but is still below the transition points of the other chiralities (approximately 1.1% wt/v). Note that in this case along with (6,5), other chiralities such as (6,4) and (8,3) are also present in the bottom phase (see Fig. 7), and an additional separation step is needed in order to isolate (6,5), as shown in ref. 11.
 | ||
| Fig. 7 Top to bottom phase SC transition concentrations for SWCNTs in SC-enhanced SDBS/DOC separations. The concentrations of DOC and SDBS are kept constant at 0.1 and 1.1% wt/v, respectively, while increasing the concentration of SC. The color coding is the same as for Fig. 4 and 6. | ||
It can be clearly seen that SC enhances the separation of the chiralities that belong only to the first maximum of the SDBS/DOC periodically modulated pattern. This is quite interesting, as it directly allows to diminish impurities from the larger diameter SWCNTs when sorting the (6,5)/(6,4) chirality. As suggested above, a possible explanation for this is that in the first maximum, which looks very similar for the different BSS, the BSS indeed stack in a similar way (e.g., with their long axis parallel to the SWCNT axis) and hence for these chiralities they can also form similarly stacked mixed BSS coatings, thus preserving the first maximum. On the other hand, from the individual BSS behaviors presented in Fig. 4, the BSS stacking for larger diameters depends significantly on the exact BSS, so that it can be expected that the mixed BSS coatings for these diameters are more disordered, resulting in the observed weaker chirality dependence for larger diameters. Interestingly, these results show that the knowledge of peculiarities of periodically modulated patterns of different BSS can help in making their combinations to enhance separations of particular chiralities, both in yield and in chiral purity.
Conclusions
To conclude, we present a comparison study of three bile salt surfactants (sodium deoxycholate, sodium cholate and sodium chenodeoxycholate) and their chirality- and diameter-dependent interactions with SWCNT walls by performing systematic one-step ATPE experiments. In such an experiment, surfactant concentrations are systematically varied one by one, while monitoring the migration of more than 30 SWCNT chiralities between the two phases using a combination of absorption, resonant Raman and PLE spectroscopy. We find that the small difference between these surfactants, just one hydroxyl group, turns out to be very important, leading to different chirality- and diameter-dependent surfactant stacking on the SWCNT walls and, as a result, to different sorting behavior presented in the form of periodically modulated patterns as a function of diameter. In particular, SC is found to form highly ordered micellar structures only around particular small diameters, while for DOC and CDOC more than one ideal wrapping diameter is observed in the periodically modulated patterns. Moreover, DOC and CDOC, when used without SDS, reveal mostly two transitions, indicative of a sensitivity towards the handedness of the SWCNT structure, while for SC in general one-step transitions are found. Addition of SDS seems to decrease the handedness sensitivity for some chiral structures. We hypothesize that the competition between a BSS and SDS depends on the specific orientation of the BSS stacking, and, in particular, on the ratio of an ordered ring-like stacking with respect to a less-ordered surface stacking under a specific angle, and that these ratios strongly depend on SWCNT diameter and BSS structure, leading to changes in the SDS/BSS periodically modulated patterns in comparison to the BSS alone cases. We also verify that a combination of DOC and SC forms highly-ordered micelles around (6,5)/(6,4) chiralities, while forming less-ordered micelles around the larger-diameter SWCNTs, therefore allowing SDBS to compete better for the larger diameters, leaving only small-diameter SWCNTs in the more hydrophilic bottom phase. Intriguingly, we find that a combination of SDS and SC also allows resolving the transitions of empty and water-filled SWCNTs for 13 chiralities, unexpectedly enabling the sorting of empty and filled SWCNTs through ATPE.This study needs to find its continuation in advanced theoretical modelling of the complex interactions between bile salt surfactants and SWCNTs of different chiralities. Moreover, interesting results may be obtained when extending our experiments to larger diameter SWCNTs due to the previous findings in DGU27 and ATPE experiments with SC/SDS/DOC combinations.13
Author contributions
Marina Avramenko: Investigation; data curation; validation; formal analysis; visualization; writing – original draft. Joeri Defillet: Investigation; data curation; methodology; formal analysis; writing – review & editing. Miguel Ángel López Carrillo: Investigation; data curation; formal analysis; writing – review & editing. Miles Martinati: Investigation; formal analysis; writing – review & editing. Wim Wenseleers: Methodology; investigation; software; resources; visualization; supervision; funding acquisition; writing – review & editing. Sofie Cambré: Conceptualization; investigation; software; data curation; methodology; resources; visualization; supervision; funding acquisition; writing – original draft. Marina Avramenko and Joeri Defillet contributed equally to this work.Conflicts of interest
There are no conflicts to declare.Acknowledgements
JD, MA, MM and SC acknowledge funding from the European Research Council through an ERC Starting Grant No. 679841 (ORDERin1D) which was granted to SC and partially funded the research of JD, MM and MA. MM and MALC acknowledge the University of Antwerp Research Fund (BOF-DOCPRO4) that provided them with a PhD grant. This research was furthermore also supported by the Fund for Scientific Research Flanders (FWO) through projects G040011N, G021112N, G035918N and G036618N and the EOS CHARMING project G0G6218N [EOS-ID 30467715].References
- A. Jorio, M. S. Dresselhaus and G. Dresselhaus, Carbon nanotubes: advanced topics in the synthesis, structure, properties and applications, Springer, 2008 Search PubMed.
- H. Kataura, Y. Kumazawa, Y. Maniwa, I. Umezu, S. Suzuki, Y. Ohtsuka and Y. Achiba, Synth. Met., 1999, 103, 2555–2558 CrossRef CAS.
- W. Wenseleers, I. I. Vlasov, E. Goovaerts, E. D. Obraztsova, A. S. Lobach and A. Bouwen, Adv. Funct. Mater., 2004, 14, 1105–1112 CrossRef CAS.
- W. Wenseleers, S. Cambré, J. Čulin, A. Bouwen and E. Goovaerts, Adv. Mater., 2007, 19, 2274–2278 CrossRef CAS.
- M. S. Arnold, A. A. Green, J. F. Hulvat, S. I. Stupp and M. C. Hersam, Nat. Nanotechnol., 2006, 1, 60–65 CrossRef CAS PubMed.
- S. Ghosh, S. M. Bachilo and R. B. Weisman, Nat. Nanotechnol., 2010, 5, 443–450 CrossRef CAS PubMed.
- H. Liu, D. Nishide, T. Tanaka and H. Kataura, Nat. Commun., 2011, 2, 309 CrossRef PubMed.
- R. Inori, T. Okada, T. Arie and S. Akita, Nanotechnology, 2012, 23, 235708 CrossRef PubMed.
- C. Y. Khripin, J. A. Fagan and M. Zheng, J. Am. Chem. Soc., 2013, 135, 6822–6825 CrossRef CAS PubMed.
- J. A. Fagan, Nanoscale Adv., 2019, 1, 3307–3324 RSC.
- N. K. Subbaiyan, S. Cambré, A. N. G. Parra-Vasquez, E. H. Hároz, S. K. Doorn and J. G. Duque, ACS Nano, 2014, 8, 1619–1628 CrossRef CAS PubMed.
- H. Li, G. Gordeev, O. Garrity, S. Reich and B. S. Flavel, ACS Nano, 2019, 13(2), 2567–2578 CAS.
- H. Li, G. Gordeev, O. Garrity, N. A. Peyyety, P. B. Selvasundaram, S. Dehm, R. Krupke, S. Cambré, W. Wenseleers, S. Reich, M. Zheng, J. A. Fagan and B. S. Flavel, ACS Nano, 2020, 14, 948–963 CrossRef CAS PubMed.
- S. Cambré and W. Wenseleers, Angew. Chem., Int. Ed., 2011, 50, 2764–2768 CrossRef PubMed.
- M. Zheng, A. Jagota, M. S. Strano, A. P. Santos, P. Barone, S. G. Chou, B. A. Diner, M. S. Dresselhaus, R. S. Mclean, G. B. Onoa, G. G. Samsonidze, E. D. Semke, M. Usrey and D. J. Walls, Science, 2003, 302, 1545–1548 CrossRef CAS PubMed.
- X. Tu, S. Manohar, A. Jagota and M. Zheng, Nature, 2009, 460, 250–253 CrossRef CAS PubMed.
- N. Stürzl, F. Hennrich, S. Lebedkin and M. M. Kappes, J. Phys. Chem. C, 2009, 113, 14628–14632 CrossRef.
- K. Akazaki, F. Toshimitsu, H. Ozawa, T. Fujigaya and N. Nakashima, J. Am. Chem. Soc., 2012, 134, 12700–12707 CrossRef CAS PubMed.
- F. Lemasson, N. Berton, J. Tittmann, F. Hennrich, M. M. Kappes and M. Mayor, Macromolecules, 2012, 45, 713–722 CrossRef CAS.
- R. Haggenmueller, S. S. Rahatekar, J. A. Fagan, J. Chun, M. L. Becker, R. R. Naik, T. Krauss, L. Carlson, J. F. Kadla, P. C. Trulove, D. F. Fox, H. C. DeLong, Z. Fang, S. O. Kelley and J. W. Gilman, Langmuir, 2008, 24, 5070–5078 CrossRef CAS PubMed.
- H. Gui, J. K. Streit, J. A. Fagan, A. R. Hight Walker, C. Zhou and M. Zheng, Nano Lett., 2015, 15, 1642–1646 CrossRef CAS PubMed.
- L. Wei, B. S. Flavel, W. Li, R. Krupke and Y. Chen, Nanoscale, 2017, 9, 11640–11646 RSC.
- J. A. Fagan, C. Y. Khripin, C. A. Silvera Batista, J. R. Simpson, E. H. Hároz, A. R. Hight Walker and M. Zheng, Adv. Mater., 2014, 26, 2800–2804 CrossRef CAS PubMed.
- J. A. Fagan, E. H. Hároz, R. Ihly, H. Gui, J. L. Blackburn, J. R. Simpson, S. Lam, A. R. Hight Walker, S. K. Doorn and M. Zheng, ACS Nano, 2015, 9, 5377–5390 CrossRef CAS PubMed.
- X. Zeng, D. Yang, H. Liu, N. Zhou, Y. Wang, W. Zhou, S. Xie and H. Kataura, Adv. Mater. Interfaces, 2018, 5, 1700727 CrossRef.
- A. A. Green, M. C. Duch and M. C. Hersam, Nano Res., 2009, 2, 69–77 CrossRef CAS.
- S. Cambré, P. Muyshondt, R. Federicci and W. Wenseleers, Nanoscale, 2015, 7, 20015–20024 RSC.
- J. Defillet, M. Avramenko, M. Martinati, M. Á. López Carrillo, D. van der Elst, W. Wenseleers and S. Cambré, Carbon, 2022, 195, 349–363 CrossRef CAS.
- C. M. Sims and J. A. Fagan, Carbon, 2022, 191, 215–226 CrossRef CAS.
- C. M. Sims and J. A. Fagan, Carbon, 2020, 165, 196–203 CrossRef CAS.
- S. Cambré, B. Schoeters, S. Luyckx, E. Goovaerts and W. Wenseleers, Phys. Rev. Lett., 2010, 104, 207401 CrossRef PubMed.
- S. Cambré, J. Campo, C. Beirnaert, C. Verlackt, P. Cool and W. Wenseleers, Nat. Nanotechnol., 2015, 10, 248–252 CrossRef PubMed.
- A. Castan, S. Forel, F. Fossard, J. Defillet, A. Ghedjatti, D. Levshov, W. Wenseleers, S. Cambré and A. Loiseau, Carbon, 2021, 171, 968–979 CrossRef CAS.
- S. van Bezouw, D. H. Arias, R. Ihly, S. Cambré, A. J. Ferguson, J. Campo, J. C. Johnson, J. Defillet, W. Wenseleers and J. L. Blackburn, ACS Nano, 2018, 12, 6881–6894 CrossRef CAS PubMed.
- J. Campo, S. Cambré, B. Botka, J. Obrzut, W. Wenseleers and J. A. Fagan, ACS Nano, 2021, 15, 2301–2317 CrossRef CAS PubMed.
- N. K. Subbaiyan, A. N. G. Parra-Vasquez, S. Cambré, M. A. S. Cordoba, S. E. Yalcin, C. E. Hamilton, N. H. Mack, J. L. Blackburn, S. K. Doorn and J. G. Duque, Nano Res., 2015, 8, 1755–1769 CrossRef CAS.
- M. Zhang, C. Y. Khripin, J. A. Fagan, P. McPhie, Y. Ito and M. Zheng, Anal. Chem., 2014, 86, 3980–3984 CrossRef CAS PubMed.
- J. K. Streit, J. A. Fagan and M. Zheng, Anal. Chem., 2017, 89, 10496–10503 CrossRef CAS PubMed.
- J. A. Fagan, M. Zheng, V. Rastogi, J. R. Simpson, C. Y. Khripin, C. A. Silvera Batista and A. R. Hight Walker, ACS Nano, 2013, 7, 3373–3387 CrossRef CAS PubMed.
- S. Lin and D. Blankschtein, J. Phys. Chem. B, 2010, 114, 15616–15625 CrossRef CAS PubMed.
- N. R. Tummala and A. Striolo, ACS Nano, 2009, 3, 595–602 CrossRef CAS PubMed.
Footnotes |
| † Electronic supplementary information (ESI) available: (1) Details of all systematic parameter variations, (2) 2D PLE maps for different surfactant and cosurfactant variations and examples of their fits to obtain the PL intensities for each chirality, (3) examples of resonant Raman spectra and fits at different excitation wavelengths, (4) examples of the fits of the partition coefficient curves and (5) tables of transition points for all surfactant combinations. See DOI: https://doi.org/10.1039/d2nr03883h |
| ‡ These authors contributed equally to this work. |
| This journal is © The Royal Society of Chemistry 2022 |