
A sensor array based on DNA-wrapped bimetallic zeolitic imidazolate frameworks for detection of ATP hydrolysis products†
Zhen
Wang
ab,
Xumei
Zhou
a,
Zhicheng
Huang
b,
Jing
Han
 a,
Gang
Xie
*a and
Juewen
Liu
*b
a,
Gang
Xie
*a and
Juewen
Liu
*b
aKey Laboratory of Synthetic and Natural Functional Molecule Chemistry of Ministry of Education, College of Chemistry & Materials Science, Northwest University, Xi'an, Shaanxi 710127, China. E-mail: xiegang@nwu.edu.cn
bDepartment of Chemistry, Waterloo Institute for Nanotechnology, University of Waterloo, Waterloo, Ontario N2L 3G1, Canada. E-mail: liujw@uwaterloo.ca
First published on 6th December 2021
Abstract
Most current biosensors were designed for the detection of individual analytes, or a group of chemically similar analytes. We reason that sensors designed to track both reactants and products might be useful for following chemical reactions. Adenosine triphosphate (ATP) is a key biomolecule that participates in various biochemical reactions, and its hydrolysis plays a fundamental role in life. ATP can be converted to adenosine diphosphate (ADP) and inorganic phosphate (Pi) via the dephosphorylation process. ATP can also be hydrolyzed to adenosine monophosphate (AMP) and pyrophosphate (PPi) through depyrophosphorylation, depending on where the bond is cleaved. The detection of ATP-related hydrolysates would enable a better understanding of the different reaction pathways with a high level of robustness and confidence. Herein, we prepared a fluorescent sensor array based on a series of bimetallic zeolite imidazole frameworks M/ZIF-8 (M = Ni, Mn, Cu) and ZIF-67 to discriminate ATP hydrolysis and detect ATP hydrolysis related analytes. A fluorescently-labeled DNA oligonucleotide was used for signaling. Interestingly, Cu/ZIF-8 exhibited an ultrahigh selectivity for recognizing pyrophosphate with a detection limit of 2.5 μM. Moreover, the practicality of this sensor array was demonstrated in fetal bovine serum, clearly discriminating ATP hydrolysis products.
Introduction
Most current biosensors were designed to measure individual analytes such as glucose, heavy metal ions and antibiotics in biomedical, environmental and food safety applications.1–5 Sensor arrays have also been reported to detect multiple analytes at the same time,6,7 such as different proteins in blood,8–10 various metal ions,11 pesticides,12 explosives13 and thiols.14 Such analytes were grouped based on their chemical similarity, although they may not be related to a specific analytical problem. We reason that another important grouping could be based on chemical reactions to monitor the decrease of reactants and the generation of products.Adenosine triphosphate (ATP) is a key biomolecule participating in various biochemical reactions.15 For example, the hydrolysis of ATP results in the release of chemical energy needed for life, leaving behind adenosine diphosphate (ADP) and inorganic phosphate (Pi).16 On the other hand, ATP is also a monomer for RNA, where its polymerization into RNA produces pyrophosphate (PPi) as a by-product.17 Nucleotide pyrophosphatase can convert ATP to adenosine monophosphate (AMP) and PPi. These reactions all start from ATP, but depending on where the bond is cleaved, they produce four related products (AMP, ADP, Pi and PPi). Being able to detect these ATP-related hydrolysis products simultaneously would allow an understanding of different reaction pathways of ATP with a high level of robustness and confidence. Since these molecules are made of different combinations of adenine and phosphate, sensor probes should be designed to interact with these specific compounds.
Metal–organic frameworks (MOFs) are built by metal nodes and bridging ligands.18 Owing to their structural diversity, ultrahigh surface area and versatile functionality, MOFs have been utilized in biosensing.19–25 One idea is to adsorb fluorophore-labeled single-stranded DNA (ssDNA) or aptamer probes on MOFs resulting in a quenched fluorescence. Then in the presence of a target metal ion,26,27 protein,28,29 or nucleic acid,30,31 the formed ssDNA/target complexes are desorbed from the MOFs resulting in enhanced fluorescence.
Zeolite imidazole framework-8 (ZIF-8) is a subfamily of MOFs, which is formed by the self-assembly of Zn2+ and 2-methylimidazole (2-MI).32 Due to the structural simplicity and ease of synthesis, ZIF-8 has become an ideal candidate in biological analysis.33–35 To tune potential interactions with phosphate, systematic metal substitution might be performed. For example, metal and ligand substitution in MOFs36–38 have been used for gas separation39 and catalysis.40 By doping other metal ions in ZIF-8, the DNA adsorption efficiency and molecular recognition behavior of the ZIFs might change. Based on different metal compositions in ZIFs, their interactions with the ATP hydrolysis products might also be different, allowing the detection of these compounds.41,42
Herein, we partially substituted Zn2+ in ZIF-8 with other transition metal ions to prepare a series of bimetallic M/ZIF-8 (M = Ni, Mn, Cu). These ZIFs were combined with DNA probes to form a sensor array to detect ATP and the four hydrolysis products. Interestingly, Cu/ZIF-8 exhibited ultrahigh selectivity for recognizing pyrophosphate. With this array, different reaction products can be identified. Moreover, the practicality of this sensor array was demonstrated in a biological sample.
Experimental
Synthesis of ZIF-8, Cu/ZIF-8, Mn/ZIF-8 and Ni/ZIF-8
ZIF-8 was prepared according to the previous literature.43 Typically, 0.5 mmol Zn(NO3)2 and 4 mmol 2-methylimidazole were separately dissolved in 7 mL methanol. Subsequently, the 2-methylimidazole solution was rapidly added into the Zn(NO3)2 solution and kept static for 24 h at room temperature. Finally, the products were collected by centrifugation, washed with methanol and dried overnight at 60 °C. The three bimetallic ZIFs were synthesized by a similar method of ZIF-8, except that 0.5 mmol Zn(NO3)2 was replaced by the mixture of 0.4 mmol Zn(NO3)2 and 0.1 mmol M2+ (Cu2+, Mn2+ or Ni2+), respectively.DNA adsorption on bimetallic ZIFs
In a typical experiment, 10 μL of different ZIFs were respectively mixed with 90 μL of 10 nM FAM-12mer DNA in HEPES buffer (10 mM, pH 7.6) and incubated for 40 min. After centrifugation at 15![[thin space (1/6-em)]](https://www.rsc.org/images/entities/char_2009.gif) 000 rpm, the fluorescence intensity of the supernatant (containing the non-adsorbed DNA) was recorded using a microplate reader with excitation at 485 nm and emission at 535 nm. To measure DNA adsorption kinetics, the background fluorescence was first collected from 95 μL of the FAM-12mer (10 nM) in 10 mM HEPES buffer (pH 7.6) for 5 min. After that, 5 μL of a different ZIF was added and the fluorescence intensity was monitored for 40 min.
000 rpm, the fluorescence intensity of the supernatant (containing the non-adsorbed DNA) was recorded using a microplate reader with excitation at 485 nm and emission at 535 nm. To measure DNA adsorption kinetics, the background fluorescence was first collected from 95 μL of the FAM-12mer (10 nM) in 10 mM HEPES buffer (pH 7.6) for 5 min. After that, 5 μL of a different ZIF was added and the fluorescence intensity was monitored for 40 min.
DNA desorption
DNA desorption was studied by following the fluorescence increase after adding various competing agents to the four FAM-12mer/ZIFs conjugates. Typically, FAM-12mer (10 nM) was pre-adsorbed on 500 μg mL−1 ZIF-8, 200 μg mL−1 Cu/ZIF-8, Mn/ZIF-8 or Ni/ZIF-8 in HEPES buffer (10 mM, pH 7.6). Different competing molecules were subsequently introduced to the above FAM-12mer/ZIFs conjugates. After another 45 min of incubation, followed by centrifugation, the fluorescence of the supernatant indicative of desorbed DNA was measured. The percentage of desorbed DNA was calculated by taking the fluorescence intensity of the free DNA as 100%.Determination of PPi
The PPi assay was first prepared by adsorbing FAM-12mer (10 nM) onto 200 μg mL−1 Cu/ZIF-8 in HEPES buffer (10 mM, pH 7.6). After that, PPi samples from 0 to 1 mM were added into the FAM-12mer/Cu/ZIF-8 dispersion at room temperature to release FAM-12mer, where DNA desorption was studied by monitoring the kinetics of fluorescence increase. The data were evaluated by calculating the fluorescence enhancement factor F/F0 − 1, in which F0 and F are the fluorescence of the assay in the absence and presence of PPi, respectively.Discrimination of phosphates using ZIF sensor arrays
FAM-12mer (10 nM) was respectively pre-adsorbed on 500 μg mL−1 ZIF-8, 50 μg mL−1 ZIF-67, 200 μg mL−1 Cu/ZIF-8, Mn/ZIF-8, and Ni/ZIF-8 in HEPES buffer (10 mM, pH 7.6). Then, the fluorescence changes of the above solutions were recorded with the addition of designated concentrations of phosphates (i.e., ATP, ADP, AMP, PPi, and PO43−). Consequently, the five kinds of phosphates were tested with the five kinds of ZIFs for six times. Finally, the fluorescence patterns of the training matrix (5 ZIFs × 5 phosphates × 6 replicates) were subjected to principal component analysis (PCA) and hierarchical cluster analysis (HCA) using the OriginLab software.Phosphates detection in diluted serum
The standard addition method was used to detect PPi in 1% fetal bovine serum (FBS), which was diluted with 10 mM HEPES (pH 7.6). FAM-12mer was pre-adsorbed on Cu/ZIF-8, PPi of varying concentrations was added, and the kinetics of fluorescence recovery was monitored. Discrimination of the phosphate containing molecules based on the ZIF sensor array was also performed in 1% FBS. First, the five kinds of FAM-12mer/ZIFs were prepared, followed by adding different phosphate anions. The subsequent processes were the same as the above-described sensing procedures.Simulation of different hydrolysis processes of ATP
In order to simulate the products of ATP hydrolysis from different pathways, we prepared various mixtures of phosphate-containing molecules. For example, for 50% ATP hydrolysis, three samples were prepared: ATP, 50% ATP + 50% (ADP + Pi), and 50% ATP + 50% (AMP + PPi). Afterwards, we used the ZIF sensor array to distinguish the three samples following the same method stated above.Results and discussion
Synthesis and characterization of ZIF-8 and the bimetallic ZIFs
ZIF-8, Cu/ZIF-8, Mn/ZIF-8 and Ni/ZIF-8 were prepared via a co-precipitation method. As demonstrated in Fig. 1A, the different dopant ions were respectively introduced during the growth of the ZIF nanocrystals by simultaneously adding 2-MI and Zn2+ with Cu2+, Mn2+ or Ni2+. Because of their similar ionic radius and valence, a fraction of these divalent metal ions were incorporated into the ZIF-8 framework by substituting some of the Zn2+ sites.44,45 In addition to the Zn–N4 complex, tetrahedral M–N4 (M = Cu, Mn or Ni) structures likely existed in the ZIF structures.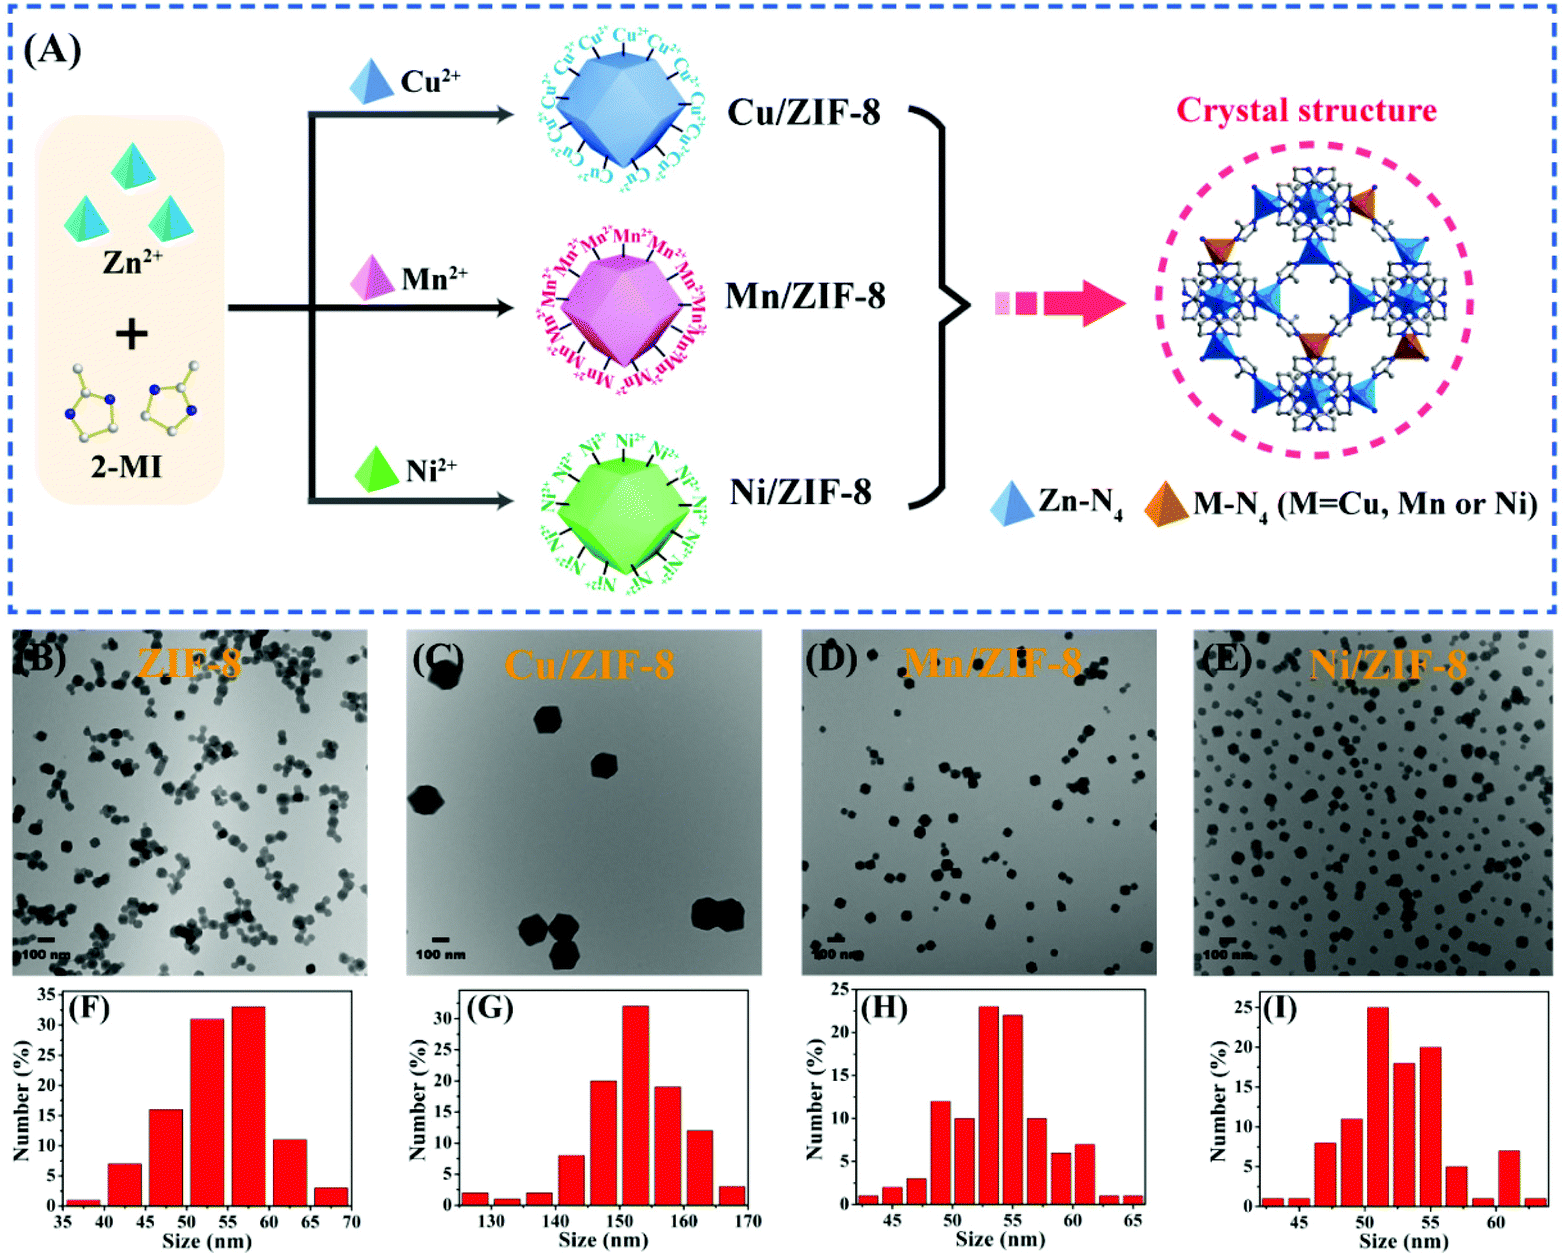 | ||
| Fig. 1 (A) Schematic illustration of co-precipitation synthesis of the three bimetallic ZIFs. TEM images of (B) ZIF-8, (C) Cu/ZIF-8, (D) Mn/ZIF-8 and (E) Ni/ZIF-8. Histographs showing the size distribution of (F) ZIF-8, (G) Cu/ZIF-8, (H) Mn/ZIF-8 and (I) Ni/ZIF-8. | ||
The TEM images in Fig. 1B–E show that these four ZIFs were all similar hexagonal nanoparticles with approximate mean sizes of 50 nm, except for Cu/ZIF-8 being ∼150 nm. The corresponding size distributions of four ZIFs are showed in Fig. 1F–I. The crystalline structures of the four ZIFs were confirmed by powder X-ray diffraction (PXRD) analysis (Fig. S1†). They were all in good agreement with the theoretically simulated ZIF, indicating that the metal dopants did not change the crystal structure. Inductively coupled plasma mass spectrometry (ICP-MS) indicated the actual amount of the doped metal ions in these three bimetallic ZIFs to be 5.09% Cu2+, 1.14% Mn2+ and 0.46% Ni2+ (Table S1†). Thus, the actual doping was lower than the initial percentage of the synthesis (20%), which was consistent with previous studies.46 Interestingly, Cu/ZIF-8 with highest dopant concentration had the largest size among the samples.
Fourier transform infrared (FT-IR) spectroscopy was further performed (Fig. S2†), and the spectra of all the three bimetallic ZIFs samples were consistent with that of ZIF-8. The peak located at 1581 cm−1 was assigned to the stretching vibration of C![[double bond, length as m-dash]](https://www.rsc.org/images/entities/char_e001.gif) N, the bands in the range of 900–1500 cm−1 were assigned to the bending of the imidazole rings, and the peaks at 400–550 cm−1 were attributed to the M–N stretching (M = Zn, Cu, Mn or Ni).47,48 Finally, their surfaces were all positively charged as indicated by their zeta-potential values (Fig. 2A).
N, the bands in the range of 900–1500 cm−1 were assigned to the bending of the imidazole rings, and the peaks at 400–550 cm−1 were attributed to the M–N stretching (M = Zn, Cu, Mn or Ni).47,48 Finally, their surfaces were all positively charged as indicated by their zeta-potential values (Fig. 2A).
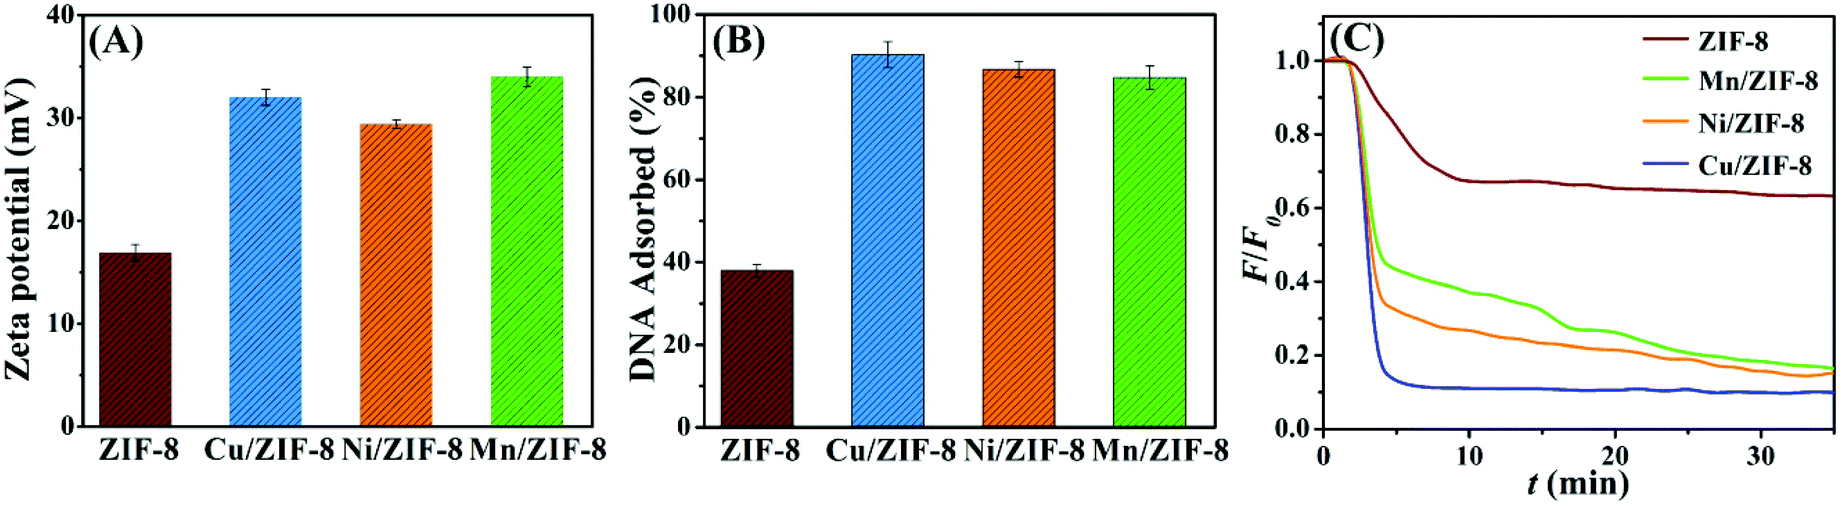 | ||
| Fig. 2 (A) Zeta-potentials of the synthesized ZIFs. (B) Adsorption efficiencies and the corresponding (C) adsorption kinetics of FAM-12mer (10 nM) on 200 μg mL−1 ZIF-8, Cu/ZIF-8, Mn/ZIF-8 and Ni/ZIF-8 in HEPES buffer (10 mM, pH 7.6). Error bars are indicated by standard deviation. | ||
DNA adsorption on ZIF-8 and bimetallic ZIFs
Because of their positive surface charge, all the four ZIF materials were expected to adsorb negatively charged DNA. In addition, the transition metals in the ZIFs might quench fluorescence. Therefore, we used a FAM (6-carboxyfluorescein)-labeled 12-mer DNA oligonucleotide to study DNA adsorption. The FAM-12mer (10 nM) was respectively mixed with 200 μg mL−1 the four ZIF materials in HEPES buffer (10 mM, pH 7.6). After incubation and centrifugation, the fluorescence intensity of the supernatant in each sample was measured to quantify the DNA adsorption efficiency. As shown in Fig. 2B, compared with ZIF-8, the three bimetallic ZIFs all exhibited more DNA adsorption. Since free metal ions may quench the fluorescence of FAM, we further added 1 mM EDTA to the supernatants. It can be seen from Fig. S3A,† the fluorescence intensity remained low, indicating the absence of a significant amount of free metal ions in the supernatants. For the FAM-12mer mixed with free metal ions, EDTA could recover the metal-quenched fluorescence up to 80–90%.49We also redispersed the precipitates and measured their fluorescence, the fluorescence intensities of the four FAM-12mer/ZIF complexes were also very low (Fig. S3B†), indicating that the DNA was stably adsorbed. In addition, the kinetics of fluorescence decrease indicative of DNA adsorption on the ZIFs were also tracked in Fig. 2C, further verifying the faster DNA adsorption and better fluorescence quenching ability of the bimetallic ZIFs. The DNA adsorption followed the order of Cu/ZIF-8 > Mn/ZIF-8 ≈ Ni/ZIF-8 > ZIF-8.
Cu/ZIF-8 is highly selective of PPi
After confirming DNA adsorption, to further investigate the interaction affinity and mechanism between DNA and the bimetallic ZIFs, systematic DNA desorption experiments were performed. Since DNA has two main functional building blocks for adsorption: (1) nucleobases and (2) phosphate backbone, to pinpoint which one is more important, we designed the following competition assays.First, four types of 1 mM nucleosides (adenosine, thymidine, cytidine, and guanosine) were respectively added to the FAM-12mer/ZIF complexes. Following centrifugation, the desorbed DNA was measured from the supernatant fluorescence. As shown in Fig. 3 (the first four bars), none of the ZIF samples exhibited any fluorescence recovery, suggesting that DNA bases were not the main contributors to adsorption. We then evaluated various phosphate containing molecules, including 1 mM phosphate, PPi, and sodium triphosphate (STPP). For ZIF-8 (Fig. 3A), Ni/ZIF-8 (Fig. 3B) and Mn/ZIF-8 (Fig. 3C), when 1 mM of each phosphate species was added, more DNA desorbed from them with longer phosphate chains, suggesting that polyvalent phosphate adsorption could be very strong on these three ZIFs. We then tested three nucleoside triphosphates: ATP, GTP, and CTP, which all exhibited obvious fluorescence recovery, indicating a strong desorption capability. The DNA desorption induced by ADP was slightly lower, while AMP, GMP and CMP exhibited the lowest desorption capabilities since they only contain one phosphate unit.
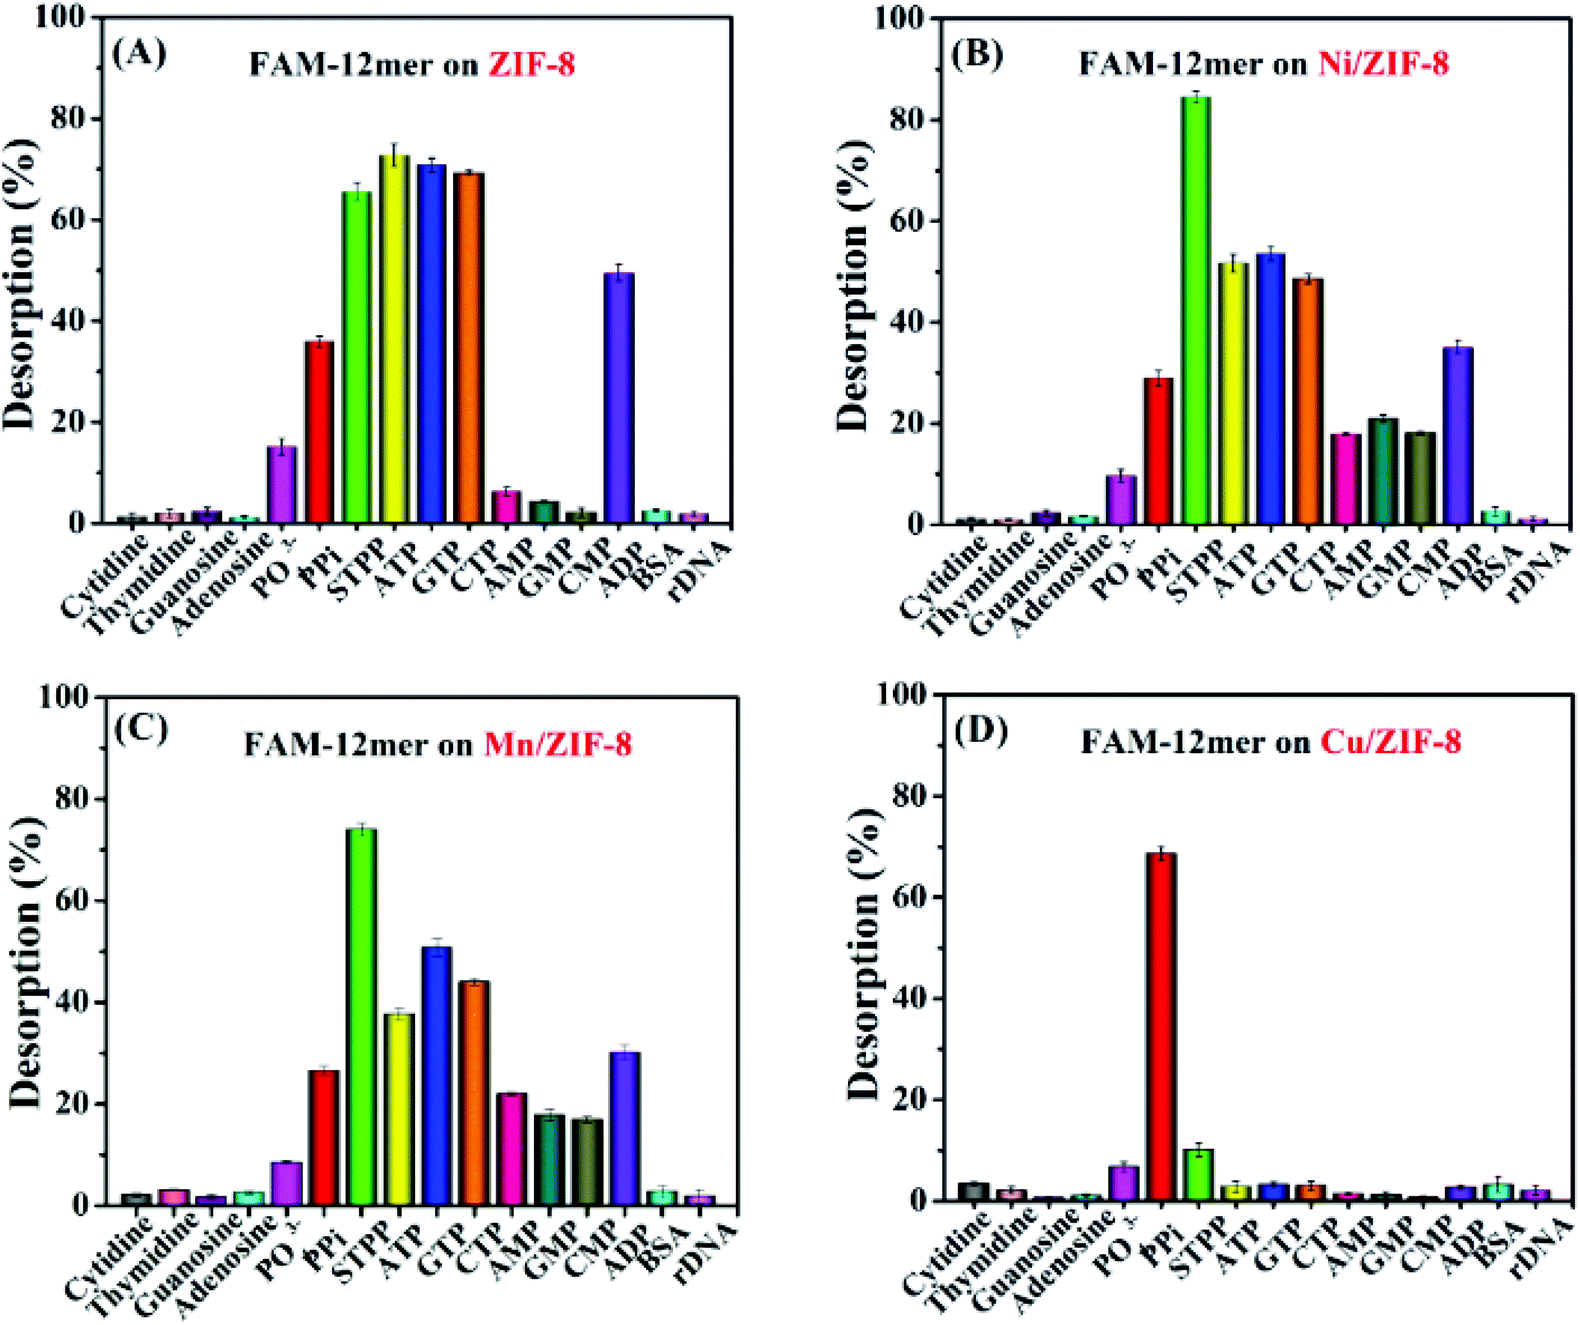 | ||
| Fig. 3 Desorption efficiencies of FAM-12mer (10 nM) from (A) 500 μg mL−1 ZIF-8 and 200 μg mL−1 (B) Ni/ZIF-8, (C) Mn/ZIF-8 and (D) Cu/ZIF-8 induced by 1 mM of different competing agents after 45 min of reaction. Error bars are indicated by standard deviation. | ||
Interestingly, the Cu/ZIF-8/FAM-12mer sample showed a completely different pattern of response (Fig. 3D). Upon the addition of the various competing molecules, only PPi induced a significant DNA desorption (about 70%), followed by STPP (10%) and orthophosphate (7%), whereas other phosphate-containing analytes including ADP induced nearly no desorption. In addition, the kinetics of fluorescence increase from Cu/ZIF-8 (Fig. S4†) further indicated excellent selective response of Cu/ZIF-8 to PPi.
Finally, bovine serum albumin (BSA) and a 12-mer random DNA (rDNA) were also respectively added, but neither of them could desorb FAM-12mer from any of the ZIFs. This result suggested that these ZIFs can resist interference from biological sample matrix.
The excellent selectivity of PPi was attributed to the higher binding affinity between PPi and divalent copper ion (Cu2+) on the surface of Cu/ZIF-8. It was reported that PPi preferentially binds to Cu2+ with a high stability constant (K) (logKCu-PPi = 12.45), while orthophosphate has a low affinity to Cu2+.50,51 This binding force competed favourably with Cu2+–DNA interactions, resulting in DNA desorption.
Highly sensitive detection of PPi
Our observation allowed us to develop a fluorescent sensing method for PPi as shown in Fig. 4A. When the FAM-12mer was adsorbed onto Cu/ZIF-8, the fluorescence was effectively quenched. Upon the addition of PPi, based on the competitive coordination of Cu2+ between DNA and PPi, FAM-12mer was displaced from Cu/ZIF-8, leading to a fluorescence recovery. Fig. 4B depicts the fold of fluorescence enhancement (F/F0 − 1) toward various concentrations of PPi, and Fig. 4C plots the fluorescence enhancement as a function of PPi concentration. The inset also exhibits a clear linear relationship in the low PPi concentration region from 0 to 100 μM, and the detection limit was calculated to be 2.5 μM PPi based on 3σ/slope, where σ is the standard deviation of the background fluorescence.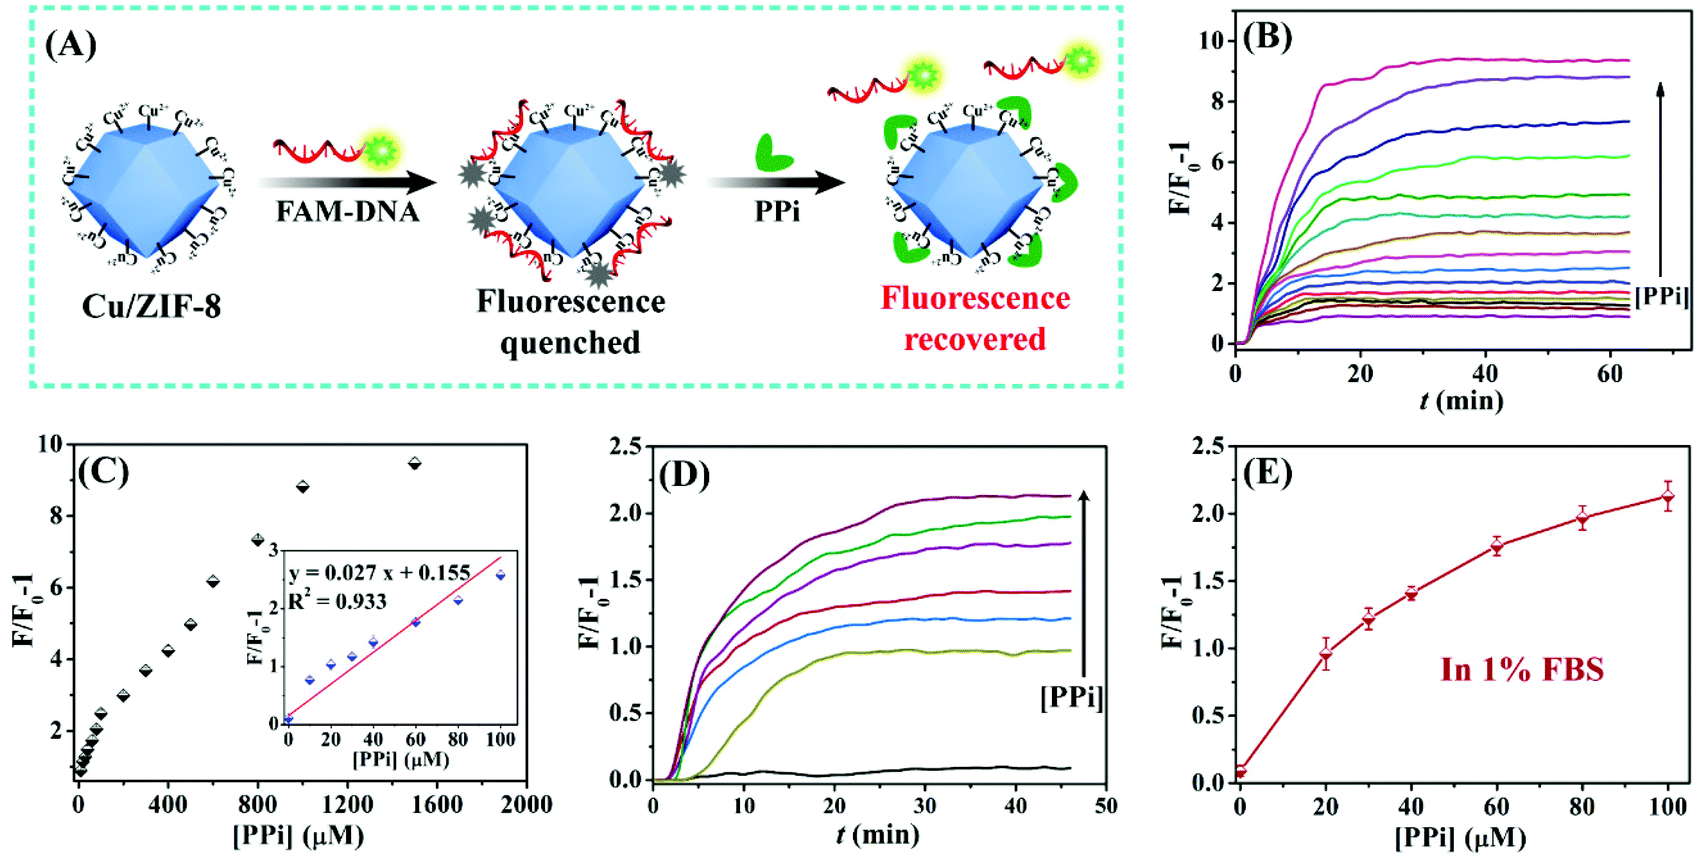 | ||
| Fig. 4 (A) Schematic illustration of PPi fluorescence sensing on the basis of Cu/ZIF-8. (B) Kinetics of fluorescent recovery of FAM-12mer (10 nM) from 200 μg mL−1 Cu/ZIF-8 induced by different concentrations of PPi. (C) Relative fluorescence enhancement in different concentrations of PPi. The inset shows a linearity fitted relationship in the low concentration range from 0 to 100 μM. (D) Kinetics of fluorescent recovery and (E) relative fluorescence enhancement of FAM-12mer (10 nM) from 200 μg mL−1 Cu/ZIF-8 induced by different concentrations of PPi in 1% FBS. Error bars indicate standard deviation. | ||
To investigate the practicality in real samples, PPi detection in fetal bovine serum (FBS) was tested. As shown in Fig. 4D and E, with the addition of various concentrations of PPi, the fluorescence of FAM-12mer from Cu/ZIF-8 increased gradually. The fluorescence enhancement trend in FBS was consistent with that in the HEPES buffer, indicating that the designed biosensor works for PPi detection in real samples.
Discrimination of ATP hydrolysis products by a ZIF sensor array
As shown in Fig. 3, different DNA/ZIFs showed different fluorescence recovery patterns to different analytes. In our previous study, ZIF-67 (isomorphic with ZIF-8, except that Zn2+ is fully replaced by Co2+) exhibited selective recognition of ATP.41 Therefore, a sensor array based on the five ZIFs was prepared for detection and discrimination of ATP and its hydrolysis products (Fig. 5A). To evaluate the discrimination capability of the sensor arrays, FAM-12mer was first adsorbed on ZIF-8, Cu/ZIF-8, Mn/ZIF-8, Ni/ZIF-8, and ZIF-67 respectively. Then, the DNA fluorescence recovery induced by PO43−, PPi, AMP, ADP, and ATP were respectively recorded. The fluorescence fingerprint maps for 200 μM phosphates were constructed (Fig. 5B). Then, the fluorescence patterns of the training matrix (5 ZIFs × 5 phosphates × 6 replicates) were subjected to principal component analysis (PCA) to generate a 2D canonical plot, which can reduce the dimension of the data by using linear operations to achieve maximal separation.52,53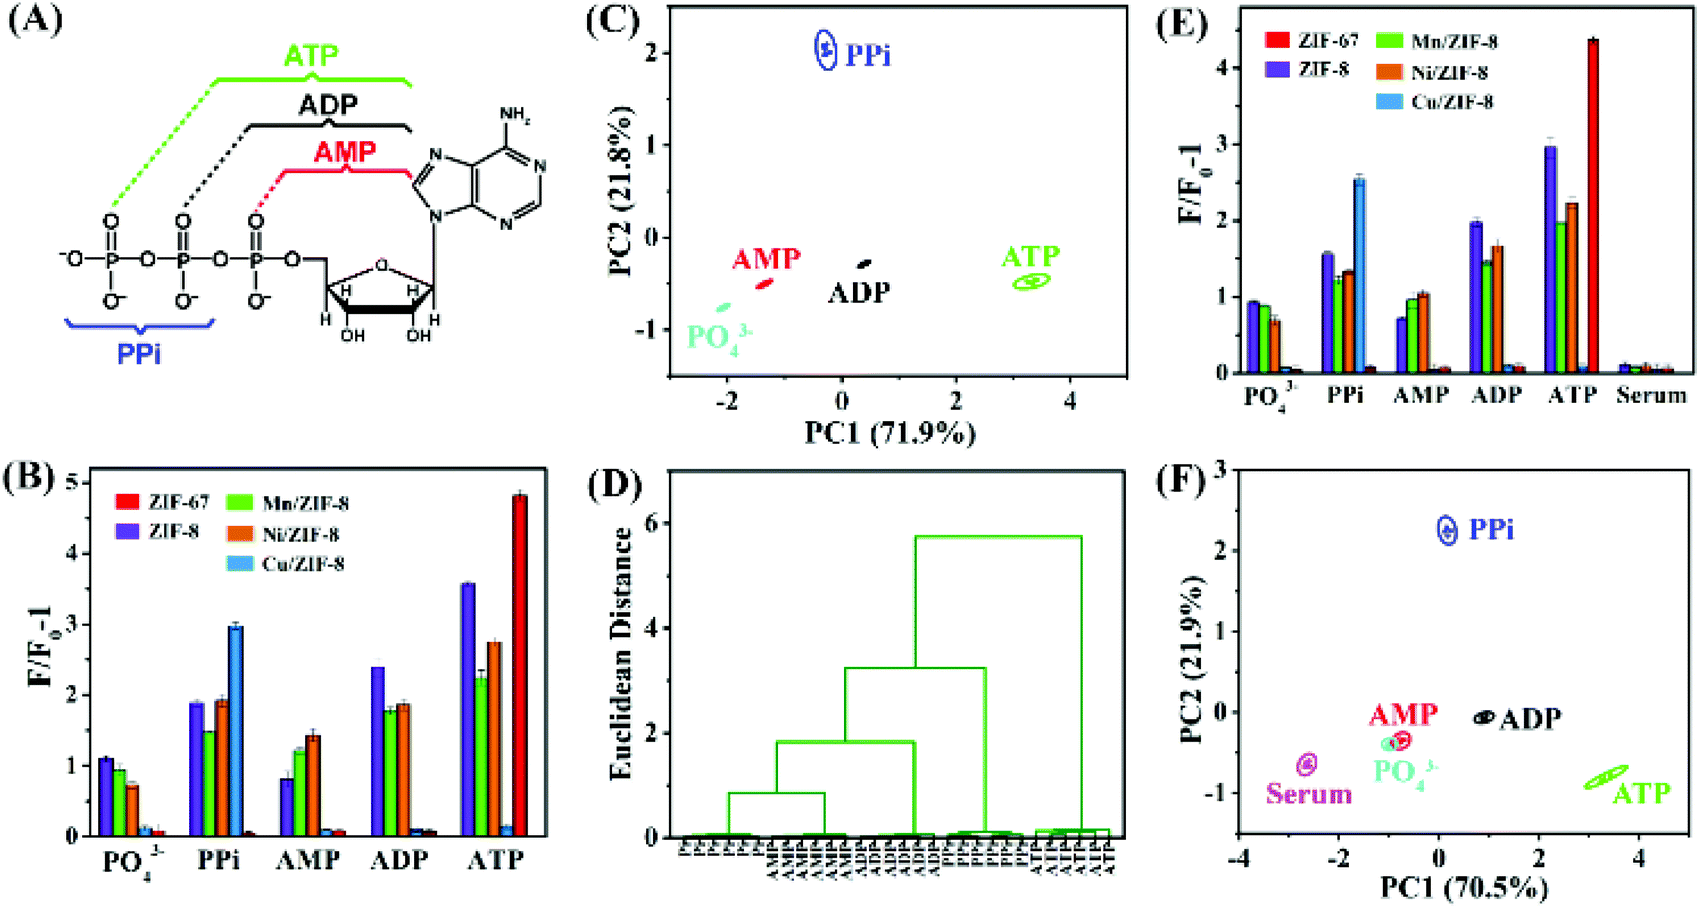 | ||
| Fig. 5 (A) Structure of the phosphate-containing species tested. (B) Relative fluorescence enhancement of FAM-12mer (10 nM) from the five ZIFs induced by different analytes (200 μM). (C) PCA and (D) hierarchical cluster analysis (HCA) plot for the discrimination of the five analytes based on the relative fluorescence enhancement of the ZIF sensor array. (E) The relative fluorescence enhancement and (F) corresponding PCA of the ZIF sensor array towards different analytes (200 μM) in 1% FBS. Each error bar was calculated from six independent measurements, and the ellipse indicates 95% confidence. Error bars indicate standard deviation. | ||
As shown in Fig. 5C, the canonical patterns were clustered into five groups, where all the five species were well separated from each other with no misclassification, and the first two most significant discrimination factors PC1 and PC2 account for 71.9% and 21.8% of the total variability in the data respectively. In addition, hierarchical cluster analysis (HCA) was also performed to provide further evidence for the recognition ability of this ZIF sensor array (Fig. 5D), displaying clear discrimination of these phosphates without cross influences.
The feasibility of the sensor array for discriminating phosphates in FBS was also validated. It can be seen from Fig. 5E that although FBS produced a background response, when 200 μM PO43−, PPi, AMP, ADP and ATP were spiked, these analytes were still well separated. Therefore, this robust sensor array exhibited a good performance in FBS. In addition, the five analytes were located in different matrices and distinguished from each other using the PCA pattern, except for a partial overlap between PO43− and AMP (Fig. 5F).
To further investigate the discriminative capability of this ZIF sensing array, other concentrations of analytes from 5 μM to 1 mM were also measured (Fig. S5 and S6†). Similarly, these analytes were fully classified into separated clustering groups by the PCA, displaying efficient discriminative performance. These results clearly demonstrate that the proposed ZIF sensor array could be used to accurately identify different phosphates over a wide range of concentrations with a great discrimination power.
Moreover, to assess the quantification function of the ZIF sensor arrays, discrimination tests toward various concentrations of each analyte were performed. As shown in Fig. S7,† different concentrations of PPi, AMP, ADP, and ATP were clearly distinguished in the PCA patterns, although the 5 μM and 10 μM of PO43− data overlapped with each other, indicating that PO43− in very low concentrations would not be discriminated well. Overall, the above results confirm that the sensor array has high specificity and differentiation capability for these five analytes.
Analysis of different hydrolysis processes of ATP
As mentioned in the introduction, ATP can be hydrolyzed in two ways (Fig. 6A). In the dephosphorylation path (route 1), ATP is hydrolyzed to ADP and Pi. In the depyrophosphorylation path (route 2), ATP is converted to AMP and PPi. Our sensor array can discriminate all the five related analytes in these two reaction pathways. To simulate the different ATP hydrolysis reactions and distinguish the resulting hydrolysis products, we prepared various samples on the basis of decrease in the reactants (ATP) and the generation of products (AMP, ADP, Pi and PPi). ATP, 50% ATP + 50% (ADP + Pi), and 50% ATP + 50% (AMP + PPi) were modeled and performed by PCA (Fig. 6B and C). The canonical patterns were clustered into three groups, and each group was well separated from each other without misclassification. In addition, the HCA pattern (Fig. 6D) further indicated the discrimination capability of the sensor array towards different hydrolysis processes of ATP. The results demonstrate that the designed sensor array has the potential to distinguish different hydrolysis processes of ATP.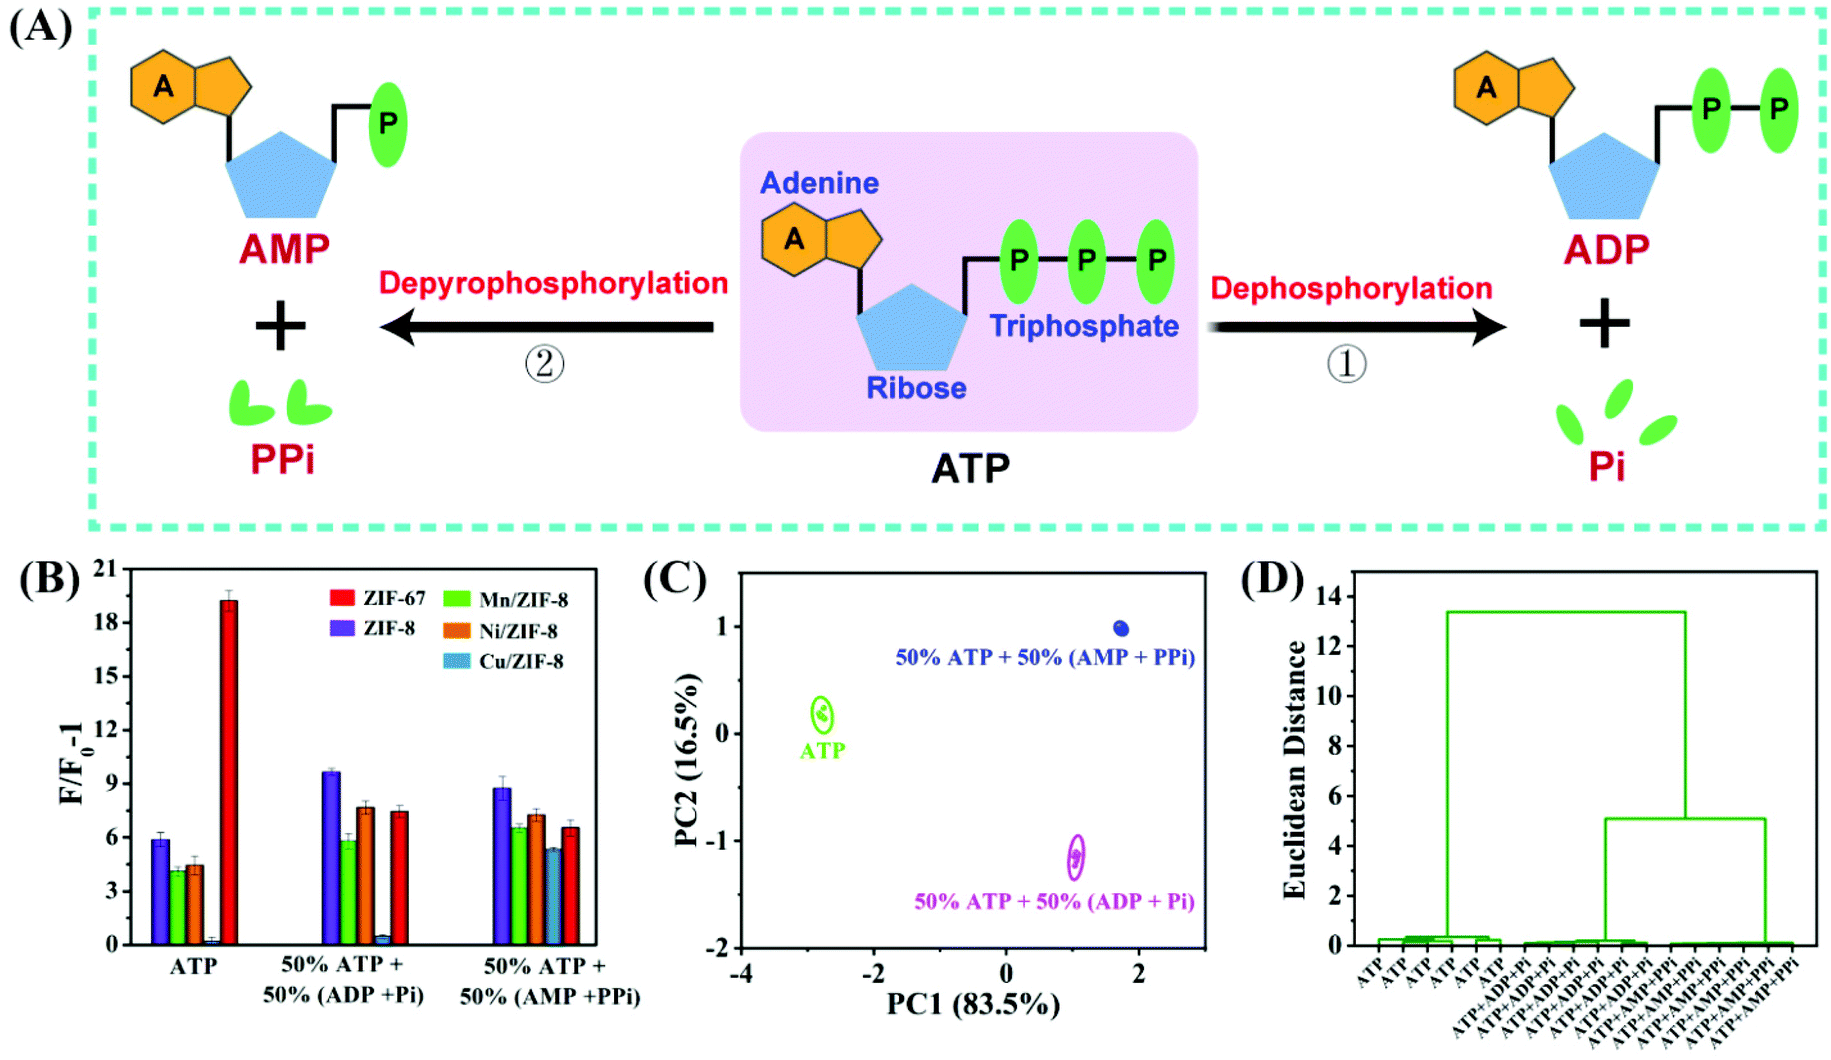 | ||
| Fig. 6 (A) Schematic illustration of two hydrolysis pathways of ATP and the related products. (B) Relative fluorescence enhancement of FAM-12mer (10 nM) from the five ZIFs induced by the hydrolysis of 50% ATP in the two pathways. (C) PCA and (D) HCA plots for the discrimination of different hydrolysis products of ATP with 50% hydrolysis yield. Each measurement was repeated six times, and the ellipse indicates 95% confidence. Error bars indicate the standard deviation. | ||
Other sensor arrays for discriminating and detecting chemically similar molecules were also reported, especially for ATP, ADP, AMP, PPi and Pi.6,54,55 Some enabled quantitative detection of analytes with superior performance, but they did not related the results to a specific chemical reaction. This work proposed a novel type of sensor array that can detect each molecule in a chemical reaction, following the decrease of reactants and the generation of products in the different hydrolysis pathways of ATP. By preparing reaction mixtures representing the two ATP hydrolysis pathways, we showed very different sensor responses to different reaction mixtures. The detection of ATP-related hydrolysates would enable a better understanding of the reaction pathways with a high level of robustness and confidence.
Conclusions
In summary, we demonstrated different responses of a few bimetallic MOFs to the hydrolysis products of ATP using DNA as a signaling probe. This system not only discriminated all these five compounds, but also it can distinguish different hydrolysis pathways. In addition, we discovered that the Cu/ZIF-8 had a high selectivity for PPi. All these reactions can be carried out both in simple buffers and in biological sample matrix such as FBS. This work brought new thinking in terms of the design and application of biosensor arrays. Instead of solely relying on biomolecules, through ligand design and the choice of different metal ions, we may obtain highly specific nanomaterials for detecting other molecules.Conflicts of interest
There are no conflicts to declare.Acknowledgements
Funding for this work was from the Natural Sciences and Engineering Research Council of Canada (NSERC). Z. Wang was supported by a China Scholarship Council Scholarship to visit the University of Waterloo.References
- R. J. Lake, Z. Yang, J. Zhang and Y. Lu, Acc. Chem. Res., 2019, 52, 3275–3286 CrossRef CAS PubMed.
- V. Montes-García, M. A. Squillaci, M. Diez-Castellnou, Q. K. Ong, F. Stellacci and P. Samorì, Chem. Soc. Rev., 2021, 50, 1269–1304 RSC.
- C. Ma, Y. Cao, X. Gou and J. Zhu, Anal. Chem., 2020, 92, 431–454 CrossRef CAS PubMed.
- J. Xue, F. Chen, M. Bai, X. Cao, W. Fu, J. Zhang and Y. Zhao, ACS Appl. Mater. Interfaces, 2021, 13, 9402–9411 CrossRef CAS.
- D. Liu, J. Wang, L. Wu, Y. Huang, Y. Zhang, M. Zhu, Y. Wang, Z. Zhu and C. Yang, TrAC, Trends Anal. Chem., 2020, 122, 115701 CrossRef CAS.
- Q. Yan, X. Y. Ding, Z. H. Chen, S. F. Xue, X. Y. Han, Z. Y. Lin, M. Yang, G. Shi and M. Zhang, Anal. Chem., 2018, 90, 10536–10542 CrossRef CAS PubMed.
- C. You, O. R. Miranda, B. Gider, P. S. Ghosh, I. B. Kim, B. Erdogan, S. A. Krovi, U. H. Bunz and V. M. Rotello, Nat. Nanotechnol., 2007, 2, 318–323 CrossRef CAS PubMed.
- M. De, S. Rana, H. Akpinar, O. R. Miranda, R. R. Arvizo, U. H. Bunz and V. M. Rotello, Nat. Chem., 2009, 1, 461–465 CrossRef CAS PubMed.
- H. Pei, J. Li, M. Lv, J. Wang, J. Gao, J. Lu, Y. Li, Q. Huang, J. Hu and C. Fan, J. Am. Chem. Soc., 2012, 134, 13843–13849 CrossRef CAS PubMed.
- M. S. Hizir, N. M. Robertson, M. Balcioglu, E. Alp, M. Rana and M. V. Yigit, Chem. Sci., 2017, 8, 5735–5745 RSC.
- W. He, L. Luo, Q. Liu and Z. Chen, Anal. Chem., 2018, 90, 4770–4775 CrossRef CAS PubMed.
- S. Qian and H. Lin, Anal. Chem., 2015, 87, 5395–5400 CrossRef CAS PubMed.
- M. Zhao, H. Yu and Y. He, Sens. Actuators, B, 2019, 283, 329–333 CrossRef CAS.
- C. Lei, H. Dai, Y. Fu, Y. Ying and Y. Li, Anal. Chem., 2016, 88, 8542–8547 CrossRef CAS PubMed.
- A. V. Gourine, E. Llaudet, N. Dale and K. M. Spyer, Nature, 2005, 436, 108–111 CrossRef CAS PubMed.
- E. D. Korn, M. F. Carlier and D. Pantaloni, Science, 1987, 238, 638–644 CrossRef CAS PubMed.
- P. Nyrén, Anal. Biochem., 1987, 167, 235–238 CrossRef.
- H. Furukawa, K. E. Cordova, M. O'Keeffe and O. M. Yaghi, Science, 2013, 341, 1230444 CrossRef PubMed.
- Y. Zhao, H. Zeng, X. Zhu, W. Lu and D. Li, Chem. Soc. Rev., 2021, 50, 4484–4513 RSC.
- B. Li, T. Suo, S. Xie, A. Xia, Y. Ma, H. Huang, X. Zhang and Q. Hu, TrAC, Trends Anal. Chem., 2021, 135, 116163 CrossRef CAS.
- Q. Yu, Z. Li, Q. Cao, S. Qu and Q. Jia, TrAC, Trends Anal. Chem., 2020, 129, 115939 CrossRef CAS.
- H. Wang, X. Wang, R. M. Kong, L. Xia and F. Qu, Chin. Chem. Lett., 2021, 32, 198–202 CrossRef CAS.
- Y. Li, W. Ling, X. Liu, X. Shang, P. Zhou, Z. Chen, H. Xu and X. Huang, Nano Res., 2021, 14, 1–29 CrossRef.
- K. Yu, T. Wei, Z. Li, J. Li, Z. Wang and Z. Dai, J. Am. Chem. Soc., 2020, 142, 21267–21271 CrossRef CAS PubMed.
- Y. Shao, B. Liu, Z. Di, G. Zhang, L. Sun, L. Li and C. Yan, J. Am. Chem. Soc., 2020, 142, 3939–3946 CrossRef CAS PubMed.
- P. Hu, N. Liu, K. Wu, L. Zhai, B. Xie, B. Sun, W. Duan, W. Zhang and J. Chen, Inorg. Chem., 2018, 57, 8382–8389 CrossRef CAS.
- X. Shi, H. Meng, X. Geng, L. Qu and Z. Li, ACS Sens., 2020, 5, 3150–3157 CrossRef CAS PubMed.
- J. Li, Y. Zhang, Z. Zou, Z. Qing, S. Yang, J. Yang, L. Zhang, F. Feng and R. Yang, ACS Omega, 2019, 4, 9074–9080 CrossRef CAS PubMed.
- Y. Pan, S. Zhan and F. Xia, Anal. Biochem., 2018, 546, 5–9 CrossRef CAS PubMed.
- H. Wang, H. Liu, K. Wang, Y. Ding, J. Xu, X. Xia and H. Chen, Anal. Chem., 2017, 89, 11366–11371 CrossRef CAS.
- H. Zhang, J. Zhang, G. Huang, Z. Du and H. Jiang, Chem. Commun., 2014, 50, 12069–11207 RSC.
- H. Hayashi, A. P. Cote, H. Furukawa, M. O'Keeffe and O. M. Yaghi, Nat. Mater., 2007, 6, 501–506 CrossRef CAS.
- Y. V. Kaneti, S. Dutta, M. S. Hossain, M. J. Shiddiky, K. L. Tung, F. K. Shieh, C. K. Tsung, K. C. Wu and Y. Yamauchi, Adv. Mater., 2017, 29, 1700213 CrossRef PubMed.
- N. K. Maddigan, O. M. Linder-Patton, P. Falcaro, C. J. Sumby, S. G. Bell and C. J. Doonan, ACS Appl. Mater. Interfaces, 2021, 13, 51867–51875 CrossRef CAS PubMed.
- J. Wang, H. Chen, F. Ru, Z. Zhang, X. Mao, D. Shan, J. Chen and X. Lu, Chem. – Eur. J., 2018, 24, 3499–3505 CrossRef CAS PubMed.
- M. Y. Masoomi, A. Morsali, A. Dhakshinamoorthy and H. Garcia, Angew. Chem., Int. Ed., 2019, 58, 15188–15205 CrossRef CAS.
- X. Wang, L. Dong, M. Qiao, Y. Tang, J. Liu, Y. Li, S. Li, J. Su and Y. Lan, Angew. Chem., Int. Ed., 2018, 57, 9660–9664 CrossRef CAS PubMed.
- L. Chen, Z. Chen, X. Liu and X. Wang, Nano Res., 2021, 14, 1533–1540 CrossRef CAS.
- C. H. Lau, R. Babarao and M. R. Hill, Chem. Commun., 2013, 49, 3634–3636 RSC.
- F. Li, Q. Shao, X. Huang and J. Lang, Angew. Chem., Int. Ed., 2018, 57, 1888–1892 CrossRef CAS PubMed.
- Z. Wang, X. Zhou, Y. Li, Z. Huang, J. Han, G. Xie and J. Liu, Anal. Chem., 2021, 93, 7707–7713 CrossRef CAS.
- Z. Jiang, Y. Wang, L. Sun, B. Yuan, Y. Tian, L. Xiang, Y. Li, Y. Li, J. Li and A. Wu, Biomaterials, 2019, 197, 41–50 CrossRef CAS PubMed.
- T. Du, C. Zhao, F. Rehman, L. Lai, X. Li, Y. Sun, S. Luo, H. Jiang, N. Gu, M. Selke and X. Wang, Adv. Funct. Mater., 2017, 27, 1603926 CrossRef.
- X. Zhang, L. Huang, Q. Wang and S. Dong, J. Mater. Chem. A, 2017, 5, 18839–18844 RSC.
- Y. Chen, C. Wang, Z. Wu, Y. Xiong, Q. Xu, S. Yu and H. Jiang, Adv. Mater., 2015, 27, 5010–5016 CrossRef CAS PubMed.
- Y. Zhou, T. Yang, R. Namivandi-Zangeneh, C. Boyer, K. Liang and R. Chandrawati, J. Mater. Chem. B, 2021, 9, 1059–1068 RSC.
- Y. Hu, H. Kazemian, S. Rohani, Y. Huang and Y. Song, Chem. Commun., 2011, 47, 12694–12696 RSC.
- Y. Zhang, Z. Xie, Z. Wang, X. Feng, Y. Wang and A. Wu, Dalton Trans., 2016, 45, 12653–12660 RSC.
- Z. Wang, Z. Huang, J. Han, G. Xie and J. Liu, Langmuir, 2021, 37, 1037–1044 CrossRef CAS PubMed.
- J. B. English, A. E. Martell, R. J. Motekaitis and I. Murase, Inorg. Chim. Acta, 1997, 258, 183–192 CrossRef CAS.
- J. Ma, B. Yin, X. Wu and B. Ye, Anal. Chem., 2016, 88, 9219–9225 CrossRef CAS PubMed.
- S. Sun, K. Jiang, S. Qian, Y. Wang and H. Lin, Anal. Chem., 2017, 89, 5542–5548 CrossRef CAS PubMed.
- S. Xue, Z. Chen, X. Han, Z. Lin, Q. Wang, M. Zhang and G. Shi, Anal. Chem., 2018, 90, 3443–3451 CrossRef CAS PubMed.
- S. Z. Du, Z. Sun, L. Han, M. Qing, H. Q. Luo and N. B. Li, Sens. Actuators, B, 2020, 324, 128757 CrossRef CAS.
- X. Wei, Z. Chen, L. Tan, T. Lou and Y. Zhao, Anal. Chem., 2017, 89, 556–559 CrossRef CAS PubMed.
Footnote |
| † Electronic supplementary information (ESI) available. See DOI: 10.1039/d1nr05982c |
| This journal is © The Royal Society of Chemistry 2022 |