Total membrane lipid assay (MLA): simple and practical quantification of exosomes based on efficient membrane-specific dyes unaffected by proteins†
Ning
Li
 ,
Zhenlong
Huang
,
Zhiwei
Ye
,
Xinfu
Zhang
,
Lingcheng
Chen
,
Zhenlong
Huang
,
Zhiwei
Ye
,
Xinfu
Zhang
,
Lingcheng
Chen
 and
Yi
Xiao
 *
*
State Key Laboratory of Fine Chemicals, Dalian University of Technology, Dalian 116024, China. E-mail: xiaoyi@dlut.edu.cn
First published on 19th September 2018
Abstract
There has been a rapidly rising interest directed toward exosomes owing to their potential application in diagnosis and prognosis of major diseases. However, forthright and low-cost but accurate quantification of isolated or purified exosomes remains a technical challenge. Herein, we have developed a practical fluorimetry method to ratiometrically detect exosomes. Different from the conventional BCA total protein assay to quantify exosomes, we choose the exosome membrane lipids as the analyte and propose a new exosome quantification method called Total Membrane Lipid Assay (MLA). Our idea is based on two fluorescent dyes of completely different nature. The first one (Dye A) should be a membrane-specific dye that is non-fluorescent in aqueous buffer solutions but emits strong fluorescence once inserted into the membrane phospholipid bimolecular layer. The second one (Dye B) should be a highly water-soluble dye that has no affinity to membranes of exosomes. Therefore, the former is in charge of sensing exosomes and the latter acts as the internal reference insensitive to exosomes. The ratio of Dye A's fluorescence intensity to Dye B's (RA/B) can be used as the quantitative basis. We have screened several candidate dyes, and among them we have obtained two that meet our requirements for Dye A and Dye B, respectively. Then, a linear relationship between exosomes’ membrane lipid and RA/B has been established, with the detection limit as low as 0.342 ng μL−1 (MLA total membrane lipid content). Therefore, the analytical sensitivity of this ratiometric assay is recommendable. Finally, we confirm the practical applicability of this method by quantification of exosomes isolated from different real samples, including culture media of HeLa, MCF-7, MCF-10A cells and human serum.
Introduction
Exosomes are lipid bimolecular vesicles with a diameter of 30–150 nm, which contain a variety of proteins, lipids, coding and long non-coding RNAs, and other substances.1–4 Exosomes serve as intercellular communication vectors by transferring and delivering encapsulated molecules from their originating cells in physiological and pathological processes.5–7 They are widely distributed in human blood, urine, other body fluids and tumor cell culture medium.8,9 Tumor cells secrete exosomes to regulate the microenvironment, which promote tumor angiogenesis and affect tumor growth and metastasis.10–12 Exosomes are generally believed to be a potential source of biomarkers for disease theranostics.13–18 Therefore, more and more efforts have been directed toward exosome related research.19–21 Nowadays, several techniques to isolate/purify exosomes have been established, which has contributed to the rapid progress in exosome research.22 However, a reliable and economical method to quickly and accurately quantify exosomes, as another important basis for exosomes research, remains a technical challenge. At present, the major methods of quantifying exosomes include BCA protein assays and nanoparticle tracking analysis (NTA) and semi-quantitative approaches by using ELISA kits or western blotting (WB).23,24 BCA protein assay is mainly based on measuring the total mass of proteins in exosomes. This assay firstly needs to release the proteins from exosomes, and then use these proteins to reduce Cu2+ into Cu+ in order to produce changes in the absorption spectra. BCA assay is relatively tedious and the sensitivity of this absorbance-based assay can hardly be further improved. In addition, limited by the common technology to isolate exosomes (such as ultracentrifugation, polymer-based precipitation, sequential filtration and commercial kits22,25–27) there are always residue proteins mixed in the ‘purified’ exosomes to different degrees. Thus, the quantitative accuracy of BCA assay aimed at total mass of protein will be affected by the contamination of residue proteins. Another way to analyze exosomes is NTA (nanoparticle tracking analysis) technology that uses a camera to capture the scattered light generated by individual particles.28 NTA can provide high resolution exosome size distribution and concentration information. But the limitation of NTA is the high expense of the instrument and inaccurate particle concentration information due to the interference from lipoprotein particles and large protein aggregates. Besides BCA and NTA, some semi-quantitative exosome analyses (e.g. WB and ELISA) have also become popular.29,30 These semi-quantitative analyses are aimed at certain proteins specific in exosomes, such as the members of the tetraspanin family (CD9, CD63 and CD81).31–33 However, the relative proportions of these marker proteins seem to vary in different types of exosomes, and exosomes of different size contain different protein content34 and different membrane protein topology.35 So their contents can hardly be used to indicate the amount of exosomes. Altogether, although the above analytical methods have been commonly applied to quantitatively determine exosomes, they have some deficiencies such as time consuming processes, expensive instruments and unreliable results.Since there is still an urgent need to find a new way to quantify exosomes accurately, conveniently and economically, we propose a new idea to do so. Because, as mentioned above, the assays with proteins as analytes might be problematic in the quantification of exosomes, and also because exosomes are vesicles coated with phospholipid bilayer membranes,36–38 we are convinced that exosomes’ membranes should be valuable analytes. We also believe that fluorescence analysis takes the advantages of high sensitivity, low cost and simplicity in operation over many other analytical techniques. Based on these considerations, we develop a ratiometric fluorescence assay to accurately quantify exosomes’ membranes. Further, we confirm the practical application of this new method, in quantifying exosomes isolated from different biological samples, including HeLa and MCF-7 cells, MCF-10A and MCF-7 cell culture medium, and serum from a breast cancer patient.
Results and discussion
Experimental principle of exosome quantification
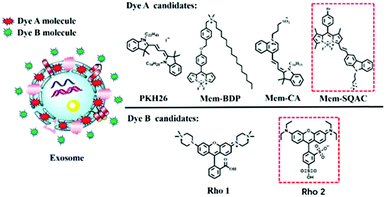
As depicted in Scheme 1, using the exosome membrane as a medium, we have developed a practical fluorimetry method to ratiometrically detect exosomes. This method is based on two fluorescent dyes of different nature. Dye A is in charge of sensing exosomes and Dye B acts as the internal reference insensitive to exosomes, and the ratio of Dye A's fluorescence intensity to Dye B's (RA/B) can be used as the quantitative basis. This ratiometric quantitative method needs to satisfy the requirements of the two dyes. Dye A should be a membrane-specific dye that is non-fluorescent in aqueous buffer solutions but emits strong fluorescence once it binds the exosome membranes. Dye B should be a highly water-soluble dye that has no affinity to membranes of exosomes.As shown in Scheme 1, the Dye A candidates include commercial PKH26 dye, Mem-BDP, Mem-CA and Mem-SQAC. Mem-BDP39 (Fig. S9, ESI†), Mem-CA40 and Mem-SQAC41 (Fig. S10, ESI†) have been designed and synthesized by our research team. The Dye B candidates include Rho1 and Rho2. Rho1 and Rho2 are piperazine rhodamine and commercial sulfonyl rhodamine. The two dyes should be able to be excited at the same wavelength and emit in different spectral ranges, in order to prevent the inaccuracy caused by different excitation light source. Dye A has been firstly screened from four candidate dyes, and based on the appropriate Dye A, Dye B has been screened from two candidate dyes. Finally we have obtained two fluorescent dyes that meet our requirements for Dye A and Dye B as shown in the red box, respectively.
Screening for a specific membrane dye (Dye A) insensitive to residue proteins mixed with exosomes
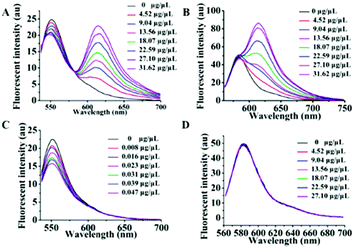
As is well known, exosomes isolated from different biological fluids always contain some residue proteins, due to the deficiencies of the existing exosome isolation/purification techniques. Thus, it is crucial that Dye A is exclusively responsive to membranes but is completely not affected by proteins. Therefore, the most important thing is to screen an optimal membrane-specific Dye A in the presence of different amounts of proteins. Different concentrations of BSA protein were used to simulate the conditions of residue proteins mixed with exosomes. We firstly chose the commercially available amphiphilic lipid PKH26 as the No. 1 candidate, because this dye stains biological membranes efficiently and has been widely applied to label exosomes.42,43 The response of PKH26 fluorescence spectra to different concentrations of BSA was tested. As shown in Fig. 1A, PKH26's fluorescence band peaking at 590 nm showed a remarkable enhancement with the BSA concentration increasing from 0 to 0.08 μg μL−1. Actually, since its suffers from protein interference, the qualification of PKH26 as Dye A could be eliminated at this stage. Thus, we turned to other three membrane-binding dyes developed in our laboratory (Scheme 1, Mem-BDP, Mem-CA, Mem-SQAC).39,41,44–47 As shown in Fig. 1B and C, Mem-BDP's fluorescence peaking at 510 nm and Mem-CA's at 640 nm showed a remarkable increase with BSA concentration. However, for Mem-SQAC, there is no such response to BSA. Actually, Mem-SQAC is almost non-fluorescent in buffer solution, and even when adding the highest concentration (0.08 μg μL−1) of BSA, the fluorescence intensity is still too low to be detectable, as shown in Fig. 1D. In our laboratory, with the BCA protein assay kit, the total protein (including the proteins in exosomes and residue proteins) concentration of the cell supernatant after centrifugation was determined to be about 0.06 μg μL−1, which falls in the BSA concentration range (0–0.08 μg μL−1) for this screening. Therefore, we can conclude that, among the four candidates including the commercially available PKH26 dye, our Mem-SQAC is the only one dye that is not affected by residual protein.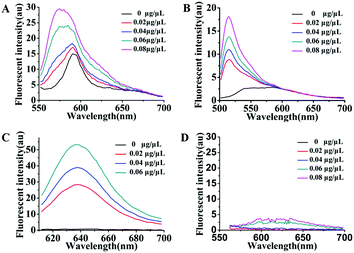 | ||
| Fig. 1 Fluorescence spectral changes of Dye A candidates induced by different concentrations (0–0.08 μg μL−1) of BSA protein: (A) PKH26 dye, (B) Mem-BDP, (C) Mem-CA, and (D) Mem-SQAC. | ||
There are high abundance lipoproteins in serum, although the residual quantity should be very low in the purified exosome samples. Therefore, another group of fluorescence titration experiments were performed to study the effects of lipoproteins on Dye A candidates. Different concentrations of lipoproteins were used to simulate the conditions of lipoprotein mixed with exosomes. As shown in Fig. 2, PKH26, Mem-BDP, and Mem-CA's fluorescence spectra showed significant changes in response to lipoprotein concentration increasing from 0 to 0.01 μg μL−1. However, in the same concentration range, lipoproteins only caused very slight variations of Mem-SQAC's fluorescence spectra, which proved the much lower sensitivity of Mem-SQAC toward lipoproteins compared to the other three membrane dyes.
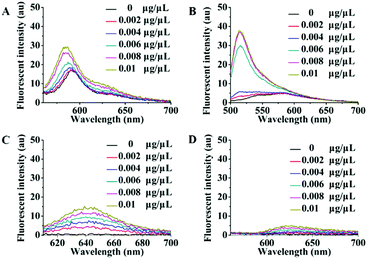 | ||
| Fig. 2 Fluorescence spectral changes of Dye A candidates induced by different concentrations of lipoproteins (0–0.01 μg μL−1): (A) PKH26 dye, (B) Mem-BDP, (C) Mem-CA, and (D) Mem-SQAC. | ||
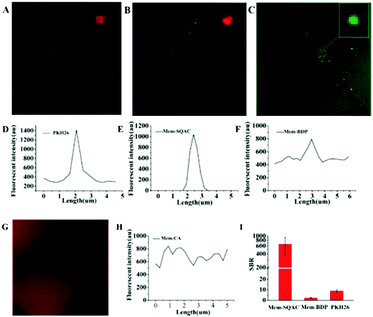
Then, we carried out exosome-staining experiments in which Mem-SQAC still outperformed the other Dye A candidates including PKH26, in terms of wash-free exosome staining, intensive emission on the exosome membrane, and high signal-to-noise ratio. Exosomes used for this investigation were isolated from the cell culture supernatant of MCF-7 cells by conventional ultracentrifugation to prepare standard exosome samples. Transmission electron microscopy (TEM) imaging gave the morphological appearance and the size distribution of collected exosomes (Fig. S2A, ESI†), which showed a diameter of approximately 50–100 nm. Dynamic Light Scattering (DLS) results further confirmed the size distribution of collected exosomes (Fig. S2C, ESI†). These results confirmed previous evidence on the characterization of exosomes,11 and so these isolated exosomes were used for the following screening experiments. In confocal imaging experiments using Dye A candidates, considering that there always existed uncertain residue proteins mixed in the isolated exosomes, we purposely supplemented 0.06% BSA into our standard exosome samples for testing the anti-interference ability. Since exosomes labeled with PKH26 had been studied using fluorescence microscopy,42,48 we decided to test PKH26's performance in exosome staining and imaging, before the other Dye A candidates. Confocal imaging of exosomes stained with PKH26 without the washing procedure demonstrated a few bright dots with red fluorescence, as shown in Fig. 3A. On zooming the area containing the bright spot and the adjacent spaces, apparent nonspecific emission in solution was observed, as shown in Fig. 3D. Then, the same experimental procedure was conducted to test Mem-SQAC. Under confocal microscopy, exosomes wash-free stained with Mem-SQAC demonstrated bright dots. After zooming, these small dots exhibited clearly spherical forms, as shown in Fig. 3B. Importantly, when we selected an area containing the bright spot and the adjacent spaces to extract the imaging data, it was found that the fluorescence signals of Mem-SQAC were completely focused on the bright dots (exosomes), without any background emission in solution, as shown in Fig. 3E. This wash-free exosome staining of Mem-SQAC could be ascribed to the strong aggregation-induced fluorescence quenching of Mem-SQAC in water solution and to the remarkable fluorescence enhancement upon intercalating into membranes.41 The performance of Mem-BDP in exosome staining and imaging was similar to that of PKH26. Although it could also label exosomes and emit relatively strong fluorescence on exosome membranes to generate bright spots, stronger background fluorescence in wide areas outside exosomes was clearly detectable, as shown in Fig. 3C and F. As for Mem-CA, it didn’t show a tendency to stain exosomes, because its background emission in solution was so strong that exosomes are not observed (Fig. 3G and H). To quantitatively evaluate the dyes’ specificity and efficiency in exosome staining and imaging, signal-to-background ratios (SBR) in the confocal images were analyzed. The SBR for Mem-SQAC was high up to 640, while under the same conditions, the SBR for Mem-BDP was only 3 and that for PKH26 was 9 (Fig. 3I). Therefore, Mem-SQAC's performance in exosome membrane imaging was outstanding and much better than that of the PKH26 dye commonly used for exosome staining and the other two tested membrane dyes (Mem-BDP and Mem-CA). On the one hand, Mem-SQAC dye's aggregates in aqueous solution are completely nonfluorescent, which is beneficial for the elimination of nonspecific background fluorescence, as proved in our previous work.41Mem-SQAC possesses a rigid and planar π-conjugation which facilitates the tight π–π stacking of Mem-SQAC molecules, and thus results in a very strong fluorescence quenching effect in the aggregates. On the other hand, the bipolar Mem-SQAC dye can be evenly embedded in and assembled into lipid bilayer membranes as single molecules rather than aggregates, which results in a very strong fluorescence enhancement upon membrane binding. Due to its rigid conjugation skeleton, Mem-SQAC molecules inside membranes will keep the single configuration and stable fluorescence properties. Therefore, the aggregation-related problems of nonspecific and nonuniform fluorescence suffered by PKH26 and other membrane dyes during exosome membrane staining are efficiently avoided in Mem-SQAC.
According to the results of the above two screening investigations, Mem-SQAC has two key advantages of anti-interference from residue proteins and specific wash-free exosome staining over the other three tested candidates. Therefore, Mem-SQAC was qualified as Dye A for further quantification of exosomes.
Screening for Dye B to cooperate with Dye A in exosome quantification
After optimizing out Mem-SQAC as the qualified exosome membrane dye (Dye A), we proceeded to screen a suitable internal reference dye (Dye B) according to the following two principles. Firstly, Dye B should possess constant fluorescence independent of exosomes and residue proteins. Secondly, Dye B should be excited at the same wavelength as Dye A, which will be perfect to avoid the quantitative inaccuracy induced by different excitations. Two rhodamine dyes were selected (Fig. S4 (ESI†), Rho 1 and Rho 2) for this screening. They are highly water-soluble because of their multiply charged structures, which may prevent them from binding hydrophobic exosome membranes. And they can be excited efficiently in the spectral range from 530 to 580 nm, similar to Dye A (Mem-SQAC).Firstly, we decided to use the total protein concentrations measured by using the BCA assay kit for exosome calibrations. The standard curve for BCA protein assay was established (Fig. S3, ESI†). The regression equation is y = 1.028x + 0.332 with a correlation coefficient of 0.979, where y and x represent the A560nm absorbance and the concentration of protein. The A560nm absorbance value showed a remarkable increase from 0.35 to 0.85, along with the concentration of BSA solution increasing from 0.01 to 0.5 μg μL−1. According to the above standard curve, the concentration of exosomes acquired from the MCF-7 cell culture supernatant was determined to be about 0.181 μg μL−1. These exosomes with BCA total protein concentrations were further used as standard exosome solutions for screening for Dye B. Then screening experiments were divided into two groups. Group 1 tested the combination of Rho 1 and Mem-SQAC for the response to standard exosome solutions, and Group 2 tested the combination of Rho 2 and Mem-SQAC. A series of fluorescence spectra for the two groups were measured along with the addition of a concentration gradient of standard exosome solutions. For Group 1, upon excitation at 530 nm, two well-separated fluorescence bands from Mem-SQAC (peaked at 615 nm) and from Rho 1 (peaked at 550 nm) increased with the increase of exosome concentration, as can be seen in Fig. 4A. While the increase of the former was sharp, that of the latter was also considerable, which indicated that the fluorescence of Rho 1 may also be affected by exosome membranes. To prove this point, we decided to study the effect of exosomes on the fluorescence of Rho 1 alone. As depicted in Fig. 4C, the fluorescence intensity of Rho 1 increased significantly with increased concentration of standard exosome solution. Although Rho 1 might be applicable in combination with Mem-SQAC, this positively charged dye seemed to be an unsuitable internal reference (Dye B) because of its apparent dependence on exosomes. The exosome responses of Group 2 are recorded in Fig. 4B. For this group, while the fluorescence intensity of Mem-SQAC increased dramatically upon the addition of standard exosome solutions, it was noteworthy that the fluorescence intensity of Rho 2 remained constant irrespective of the presence of high concentrations of exosomes. Again, we measured the fluorescence spectra of Rho 2 alone in the presence of different concentrations of exosomes. As illustrated in Fig. 4D, its fluorescence spectra did not show any detectable change, which unambiguously confirmed that Rho 2 was independent of exosomes, and thus, was the desirable internal reference Dye B. In addition, protein's influences on the fluorescence properties of Dye B candidates were studied, as shown in Fig. S6 (ESI†). It was found that Rho 2's fluorescence spectra remained unchanged upon addition of 0–0.08 μg μL−1 BSA.
To briefly summarize the above screening results, Rho 2 is the optimized Dye B (internal reference) and Mem-SQAC is Dye A (sensor for exosomes). The combination of these two dyes into a kit would be applied in the following exosome fluorescence quantification experiments.
Establishment of total membrane lipid assay (MLA) as a new method of exosome quantification
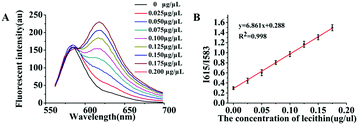
As mentioned previously, in essence the object of our analysis was the exosome membrane mainly composed of phospholipids. As we know, in BCA assay, the common method to quantitatively analyze total protein concentrations, BSA was used to make the standard protein solution. As lecithin is used as the simulant of total membrane phospholipids,49,50 herein, we proposed to make standard lecithin solution for our exosome membrane calibrations using the fluorescence ratio of Dye A (Mem-SQAC) to Dye B (Rho 2) as the quantitative basis, which we called the total membrane lipid assay (MLA). As shown in Fig. 5A, the fluorescence intensity of internal reference Dye B remains constant, and the peak fluorescence intensity of membrane Dye A regularly increases with the concentration of lecithin from 0.025 μg μL−1 to 0.2 μg μL−1. As can be seen from Fig. 5B, the regression equation is y = 6.861x + 0.288 with a correlation coefficient of 0.998, where y and x represent I615/I583 and the concentration of lecithin. Through conventional ultracentrifugation and then repeated washing with PBS to reduce the residual protein to a relatively low level, a series of exosome membrane standard solutions were obtained for MLA in order to establish the corresponding exosome calibration curve. According to the standard curve in Fig. 5B, the concentration of total membrane lipid (lecithin as simulant) in 100 μL of so-obtained exosome solution was about 0.031 μg μL−1. These exosomes with lecithin concentrations were further used as standard exosome solutions for the following experiments.Calibration of standard exosome solution by MLA
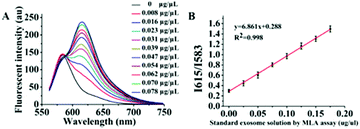
The fluorescence spectra of Dye A and Dye B combination in the presence of different concentrations of exosomes were measured to establish a relationship between exosome concentration and the ratio of Dye A's fluorescence intensity to that of Dye B, i.e. RA/B or I615/I583. As depicted in Fig. 6A, the fluorescence intensity of Dye B (Rho 2) remained constant, and the peak fluorescence intensity of Dye A (Mem-SQAC) regularly increased with the concentration of standard exosome solution from 0.008 to 0.078 μg μL−1 MLA total membrane lipid content. And I615/I583 was linearly dependent on the concentration of exosomes (Fig. 6B). The correlation equation could be expressed as y = 18.017x + 0.488 (R2 = 0.970), where y and x represent I615/I583 and the concentration of exosomes, respectively. The detection of limit (LOD) of this fluorescence quantification method of exosomes based on the 3σ method was 0.342 ng μL−1 MLA total membrane lipid content.Fluorescence quantification of exosomes from real biological samples
The practical applicability of this new analysis method was demonstrated by detecting the concentrations of exosomes from several real samples. Exosomes from the culture supernatant of breast cancer cells (MCF-7), normal breast gland cells (MCF-10A) and cervical cancer cells (HeLa) were isolated according to the previously published protocol. In addition, exosomes from human serum were isolated as another target analyte.Transmission electron microscopy (TEM) imaging gave the morphological appearance and the size distribution of collected exosomes (Fig. S2B, ESI†), which showed a diameter of approximately 50–100 nm. The collected exosomes fitted to the size distribution range reported used to distinguish exosomes from other cancerous cells and serum.16,51 Dynamic Light Scattering (DLS) results further confirmed the size distribution of collected exosomes (Fig. S7, ESI†). Simultaneously, we compared the protein distribution of cell lysates and exosomes. Firstly, the proteins extracted from HeLa cell lysates, MCF-7 cell lysates and exosome samples were separated by SDS-PAGE and subsequently stained by Coomassie brilliant blue (Fig. S2D, ESI†), and the result showed distinct protein profiles of these samples. In order to further confirm the efficacy of the collected exosomes, we analyzed CD63 protein by western blotting of the exosomes from MCF-7 cell culture medium and serum, and observed obvious bands (Fig. S2E, ESI†).
We then performed quantitative analyses of the above exosomes by using the Dye A–Dye B combination. The fluorescence spectra are recorded in Fig. 7. And for each determination, three independent experiments were repeated for data statistics. According to the calibration curve in Fig. 6B and the volume of the exosome sample taken, it could be seen that MCF-7 cells produced more exosomes (0.047 μg μL−1 MLA total membrane lipid content) compared to HeLa cells (0.031 μg μL−1 MLA total membrane lipid content) (Fig. 7A and B). And the content of exosomes in the human serum was detected to be 0.079 μg μL−1 MLA total membrane lipid content (Fig. 7C and D), which is considerably higher than exosome levels of all the tested culture supernatants. As shown in Fig. S8 (ESI†), at the established concentration, by measuring the influence of a mixture of residual proteins and an appropriate amount of exosomes on the Mem-SQAC spectra, we discovered that Mem-SQAC was insensitive to residue proteins (lipoproteins or BSA) mixed with exosomes. Also importantly, it was found that exosome content in the MCF-10A culture supernatant (0.023 μg μL−1 MLA total membrane lipid content, Fig. 7E and F) was only a third of the MCF-7 cell content, which revealed that breast cancer cells released much more exosomes than normal breast gland cells. The results were in accordance with previous reports.52
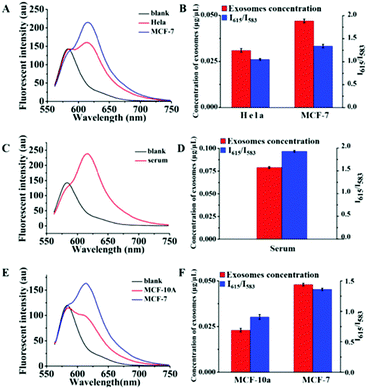 | ||
| Fig. 7 Fluorescence spectra of the combination of Dye A and Dye B in the presence of exosomes obtained (A) from HeLa cell and MCF-7 cell culture supernatants, (C) from a serum and (E) from MCF-10A and MCF-7 cell culture supernatants. Panels (B), (D) and (F) are the histograms listing I615/I583 values and the corresponding exosome concentrations (converted from I615/I583, according to the calibration curve in Fig. 6B) of the samples in panels (A), (C) and (E), respectively. The data represent the average of three independent experiments. | ||
Conclusions
In summary, we have demonstrated a ratiometric fluorescence analysis for exosome quantification which is named as Total Membrane Lipid Assay (MLA). This method, with exosome membrane lipid as the analyte, involved the combination of two kinds of fluorescent dyes: Dye A as sensor for exosome membranes and Dye B as an internal reference. From four candidates, we screened out a membrane-specific dye Mem-SQAC as the best Dye A, for its remarkable fluorescence enhancement upon binding exosome membranes as well as its insensitivity toward proteins. During our experiment of screening Dye A, we discovered that Mem-SQAC dye was significantly superior to the common exosome dye PKH26 and the other two membrane dyes, in terms of much better anti-protein interference and much higher signal to noise ratio of fluorescence imaging. We also screened out Rho 2 as the suitable Dye B because of its constant and strong fluorescence in aqueous solution that is independent of exosomes and proteins. Using the combination of Dye A and Dye B, our ratiometric analysis has been successfully applied to quantify exosomes (or, to be more specific, exosomes’ total membrane lipid content) from several real biological samples, including cell culture supernatants and human serum. Our new ratiometric fluorescence analysis is advantageous because of its high efficiency, high accuracy, low cost and simplicity of operation, and thus it holds promise for broad application in future research on exosomes.Experimental section
Materials and apparatus
HeLa cells, MCF-7 cells and MCF-10A cells were purchased from the Cell Bank of Type Culture Collection of Chinese Academy of Sciences. Rabbit anti-human CD63 polyclonal antibody was purchased from Abcam. Horseradish peroxidase (HRP)-conjugated secondary antibody was purchased from Tianjin Sungene Biotech. (Tianjin, China). Polyvinylidene fluoride membranes (PVDF) were purchased from Solarbio Sciences Technology (Beijing, China). RIPA buffer was purchased from Beyotime Biotechnology. 0.22 μm filters were purchased from Millipore Corp. (Bedford, MA, USA). Fetal bovine serum (FBS), Dulbecoo's modified Eagle's medium (DMEM), Minimal essential growth medium (MEGM) and penicillin–streptomycin were purchased from Hyclone. The cell membrane dye PKH26 was purchased from Sigma. Sulfonyl rhodamine was purchased from Sigma. Bovine serum albumin (BSA) and lipoprotein were purchased from Sigma.Fluorescence spectra were measured on a Hitachi F-4500 spectrometer. Fluorescent imaging was acquired on an Olympus FV1000 confocal microscope. The ultracentrifuge was purchased from Beckman (BEKMAN, USA). The transmission electron microscopy (TEM) images were acquired on a JEM-2010 microscope (JEOL Ltd, Japan). The images of proteins were obtained using the Bio-Rad ECL detecting system (Bio-Rad, USA). The CO2 incubator was purchased from Thermo Fisher Scientific. All chemicals were of analytical grade, and all solutions were prepared with ultrapure water obtained from an ELGA water purification system.
Cell culture and exosome isolation
HeLa cells and MCF-7 cells were maintained in Dulbecoo's modified Eagle's medium supplemented with 10% exosome-depleted fetal bovine serum, 1% penicillin and streptomycin. MCF-10A cells were cultured in minimal essential growth medium (MEGM) containing cholera toxin supplemented with 10% exosome-depleted fetal bovine serum. The cells were cultured in a CO2 incubator with a humidified atmosphere of 5% CO2/95% air at 37 °C. Cells were cultured in 75 cm2 flasks and cultured until 80% confluence. Exosomes were collected using conventional ultracentrifugation from the supernatant medium of cells.16,51 The cell culture medium was collected and centrifuged at 800g for 10 min at 4 °C. Then, the supernatant was centrifuged at 2000g for 10 min at 4 °C to discard the cellular debris, followed by filtration using a 0.22 μm filter. The filtered medium was then ultracentrifuged at 100![[thin space (1/6-em)]](https://www.rsc.org/images/entities/char_2009.gif) 000g for 2 h at 4 °C. The pellet was pipetted and washed with PBS, followed by another centrifugation at 100
000g for 2 h at 4 °C. The pellet was pipetted and washed with PBS, followed by another centrifugation at 100![[thin space (1/6-em)]](https://www.rsc.org/images/entities/char_2009.gif) 000g for 2 h at 4 °C. Finally, the supernatant was discarded, and exosomes were resuspended in 500 μL of PBS.
000g for 2 h at 4 °C. Finally, the supernatant was discarded, and exosomes were resuspended in 500 μL of PBS.
Exosome isolation from breast cancer patient serum
1 mL of breast cancer patient serum was subjected to filtration using a 0.22 μm filter, and the filtered medium was centrifuged at 2000g for 20 min and at 11![[thin space (1/6-em)]](https://www.rsc.org/images/entities/char_2009.gif) 000g for 30 min to remove unnecessary proteins. Subsequently, the supernatant was centrifuged at 100
000g for 30 min to remove unnecessary proteins. Subsequently, the supernatant was centrifuged at 100![[thin space (1/6-em)]](https://www.rsc.org/images/entities/char_2009.gif) 000g for 2 h to acquire exosomes as sediment.52 The pellet was repeatedly pipetted and washed with PBS, followed by another centrifugation at 100
000g for 2 h to acquire exosomes as sediment.52 The pellet was repeatedly pipetted and washed with PBS, followed by another centrifugation at 100![[thin space (1/6-em)]](https://www.rsc.org/images/entities/char_2009.gif) 000g for 2 h at 4 °C. Finally, the supernatant was discarded, and exosomes were resuspended in 500 μL of PBS.
000g for 2 h at 4 °C. Finally, the supernatant was discarded, and exosomes were resuspended in 500 μL of PBS.
Dynamic light scattering and transmission electron microscopy (TEM) of extracted exosomes
The size distribution of collected exosomes was characterized by using dynamic light scattering (DLS) and transmission electron microscopy (TEM). The sample was loaded on TEM copper grids and dried for 20 min. After washing with water twice, the sample was negatively stained by 2% phosphotungstic acid for 10 min. Then images were taken by transmission electron microscopy.Western blot analysis
Cells and exosomes were lysed for 20 min with RIPA buffer at 4 °C. Protein lysates were separated by 12% SDS-polyacrylamide gel electrophoresis (SDS-PAGE), and then the gels were transferred onto a polyvinylidene fluoride membrane (PVDF) in TBST for 120 min at room temperature. After blocking with 5% non-fat milk in TBST buffer (1× TBS containing 0.05% Tween 20), the PVDF membranes were incubated with rabbit anti-human CD63 antibody (anti-CD63) against CD63 protein overnight at 4 °C; the PVDF membranes were washed three times and incubated with HRP-conjugated goat anti-rabbit antibody at room temperature for 60 min, and then washed three times. The signal was obtained using the Gel Imaging System.Preparation of mother liquor of fluorescent dye
The mother liquor of Mem-BDP, Mem-CA and Mem-SQAC (1 mM) was prepared. The mother liquor of Rho 1 and Rho 2 (100 μM) was prepared. The initial dyes were diluted 1000 times with PBS, and the final concentration of membrane-specific Dye A was 1 μM and the final concentration of internal reference Dye B was 100 nM. The final concentration of PKH26 was 1 μM.Confocal imaging of exosomes stained with membrane-binding dye
The confocal dish was immersed in 0.1% polyethylenimine (PEI) aqueous solution for 20 minutes to ensure adequate assembly of positive charges. Into standard exosome solutions, appropriate amounts of the mother liquor of membrane-binding dye and BSA stock solution were added in order to adjust the final concentration of membrane dye to be 1 μM and that of BSA to be 0.06%. After staining for 10 min at room temperature, 50 μL of exosome solution stained with membrane dye was added to the confocal dish, and after sedimentation for 10 min, confocal imaging was performed. The confocal photos were processed using ImageJ software; the per unit area fluorescence intensities of the target location and the background location were obtained, and the signal-to-background ratio (SBR) was calculated by statistics.Establishment of exosomes' protein standard curve based on BCA method
The standard BSA solution (0.5 μg μL−1) of 0, 1, 2, 4, 8, 12, 16, and 20 μL was taken with the concentration of 0, 0.025, 0.05, 0.1, 0.2, 0.3, 0.4, and 0.5 μg μL−1 standard BSA samples, and if less than 20 μL, PBS was added to make up the volume. 200 μL of BCA solution was added and incubated for 30 min at 37 °C, and the absorbance value at 560 nm was measured, and then the standard curve was drawn. A certain amount of standard exosome solution was taken and lysate was added. The mixed liquor was oscillated at room temperature for 15 min; 10 μL of exosome lysate was taken according to the above steps to measure the absorbance at 560 nm.Screening of a membrane-specific dye and an internal reference dye for exosomes fluorescence quantitative analysis
An appropriate amount of BSA solution was taken with a concentration of 0, 0.02, 0.04, 0.06, and 0.08 μg μL−1. The PBS solution (over 0.22 μm filter) was added to a final volume of 2 mL. 2 μL of mother liquor of membrane Dye A (1 mM) was added so that the final concentration of membrane Dye A was 1 μM. After the shock, the reaction was carried out at room temperature for 10 min. The fluorescence spectra of membrane dye A were measured. A standard exosome solution of 0, 25, 50, 75, 100, 125, 150, and 175 μL was taken with a total protein concentration of 0, 4.52, 9.04, 13.56, 18.07, 22.59, 27.10, and 31.62 μg μL−1 respectively. PBS solution (over 0.22 μm filter) was added to a final volume of 2 mL. 2 μL of mother liquor of internal reference dye (Dye B) was added so that the final concentration of the solution was 100 nM. 2 μL of mother liquor of Dye A (1 mM) was added so that the final concentration of the solution was 1 μM. After the shock, the reaction was carried out at room temperature for 10 min. The fluorescence spectra of dyes were measured.Establishment of the lecithin quantitative standard curve
The lecithin mother liquor (10 μg μL−1) of 0, 5, 10, 15, 20, 25, 30, and 35 μL was taken with a concentration of 0, 0.025, 0.05, 0.075, 0.1, 0.125, 0.15, and 0.175 μg μL−1, respectively. PBS solution (over 0.22 μm filter) was added to a final volume of 2 mL. 2 μL of mother liquor of internal reference dye (Dye B) was added so that the final concentration of the solution was 100 nM. 2 μL of mother liquor of Mem-SQAC (Dye A) was added so that the final concentration of the solution was 1 μM. After the shock, the reaction was carried out at room temperature for 10 min. The fluorescence spectra of dyes were measured. With the ratio of Dye A fluorescence intensity at 615 nm and Dye B fluorescence intensity at 583 nm as the ordinate and the concentration of standard lecithin solution as the abscissa, the standard curve of lecithin quantification was made.Establishment of MLA assay for the quantification of exosomes' membrane lipids
Standard exosome solution (by MLA total membrane lipid assay) of 0, 25, 50, 75, 100, 125, 150, 175, 200, 225, and 250 μL was taken with a concentration of 0, 0.008, 0.016, 0.023, 0.031, 0.039, 0.047, 0.054, 0.062, 0.070, and 0.078 μg μL−1, respectively. PBS solution (over 0.22 μm filter) was added to a final volume of 2 mL. 2 μL of mother liquor of Mem-SQAC (1 mM) was added so that the final concentration was 1 μM (Dye A). 2 μL of mother liquor of Rho 2 (100 μM) was added so that the final concentration of internal reference dye solution was 100 nM (Dye B). After the shock, the reaction was carried out at room temperature for 10 min. The fluorescence spectra of Dye A and Dye B were measured. With the ratio of Dye A fluorescence intensity at 615 nm and Dye B fluorescence intensity at 583 nm as the ordinate and the concentration of standard exosome solution as the abscissa, the standard curve of exosome quantification was made.Fluorescence quantification of exosomes from biological samples
Exosomes were extracted from different cell-derived cultures, including HeLa and MCF-7 cell culture medium, and MCF-10A and MCF-7 cell culture medium. Exosomes were collected by conventional ultracentrifugation from 30 mL of cell culture supernatant. And the exosomes were extracted from the serum of breast cancer patients. Finally exosomes were resuspended in 500 μL of PBS. 150 μL of exosome sample was taken, and PBS solution (over 0.22 μm filter) was added to a final volume of 2 mL. 2 μL of mother liquor of Mem-SQAC (1 mM) was added so that the final concentration of Mem-SQAC was 1 μM (Dye A). 2 μL of mother liquor of Rho 2 was added so that the final concentration of internal reference dye solution was 100 nM (Dye B). After the shock, the reaction was carried out at room temperature for 10 min. The fluorescence spectra of Dye A and Dye B were measured. The ratio of the fluorescence intensity of Dye A at 615 nm and Dye B at 583 nm was calculated.Conflicts of interest
There are no conflicts to declare.Acknowledgements
This work is supported by the National Natural Science Foundation of China (No. 21421005, 21576040 and 21776037) and National Basic Research Program of China (No. 2013CB733702).Notes and references
- B. Fevrier and G. Raposo, Curr. Opin. Cell Biol., 2004, 16, 415–421 CrossRef CAS PubMed.
- L. Barile and G. Vassalli, Pharmacol. Ther., 2017, 174, 63–78 CrossRef CAS PubMed.
- A. S. Azmi, B. Bao and F. H. Sarkar, Cancer Metastasis Rev., 2013, 32, 623–642 CrossRef CAS PubMed.
- F. Fatima and M. Nawaz, Non-Coding RNA, 2017, 3, 10 CrossRef PubMed.
- H. K. Woo, V. Sunkara, J. Park, T. H. Kim, J. R. Han, C. J. Kim, H. I. Choi, Y. K. Kim and Y. K. Cho, ACS Nano, 2017, 11, 1360–1370 CrossRef CAS PubMed.
- S. A. Kooijmans, P. Vader, S. M. van Dommelen, W. W. van Solinge and R. M. Schiffelers, Int. J. Nanomed., 2012, 7, 1525–1541 CAS.
- Z. Chen, L. Yang, Y. Cui, Y. Zhou, X. Yin, J. Guo, G. Zhang, T. Wang and Q.-Y. He, Oncotarget, 2016, 7, 67387 Search PubMed.
- T. B. Steinbichler, J. Dudas, H. Riechelmann and I. I. Skvortsova, Semin. Cancer Biol., 2017, 44, 170–181 CrossRef CAS PubMed.
- T. Pisitkun, R.-F. Shen and M. A. Knepper, Proc. Natl. Acad. Sci. U. S. A., 2004, 101, 13368–13373 CrossRef CAS PubMed.
- B. H. Wunsch, J. T. Smith, S. M. Gifford, C. Wang, M. Brink, R. L. Bruce, R. H. Austin, G. Stolovitzky and Y. Astier, Nat. Nanotechnol., 2016, 11, 936–940 CrossRef CAS PubMed.
- H. Valadi, K. Ekstrom, A. Bossios, M. Sjostrand, J. J. Lee and J. O. Lotvall, Nat. Cell Biol., 2007, 9, 654–659 CrossRef CAS PubMed.
- Y. Teng, Y. Ren, X. Hu, J. Mu, A. Samykutty, X. Zhuang, Z. Deng, A. Kumar, L. Zhang, M. L. Merchant, J. Yan, D. M. Miller and H. G. Zhang, Nat. Commun., 2017, 8, 14448 CrossRef CAS PubMed.
- H. Zhang, T. Deng, R. Liu, M. Bai, L. Zhou, X. Wang, S. Li, X. Wang, H. Yang, J. Li, T. Ning, D. Huang, H. Li, L. Zhang, G. Ying and Y. Ba, Nat. Commun., 2017, 8, 15016 CrossRef CAS PubMed.
- C. Thery, M. Ostrowski and E. Segura, Nat. Rev. Immunol., 2009, 9, 581–593 CrossRef CAS PubMed.
- B. K. Thakur, H. Zhang, A. Becker, I. Matei, Y. Huang, B. Costa-Silva, Y. Zheng, A. Hoshino, H. Brazier, J. Xiang, C. Williams, R. Rodriguez-Barrueco, J. M. Silva, W. Zhang, S. Hearn, O. Elemento, N. Paknejad, K. Manova-Todorova, K. Welte, J. Bromberg, H. Peinado and D. Lyden, Cell Res., 2014, 24, 766–769 CrossRef CAS PubMed.
- S. A. Melo, L. B. Luecke, C. Kahlert, A. F. Fernandez, S. T. Gammon, J. Kaye, V. S. LeBleu, E. A. Mittendorf, J. Weitz, N. Rahbari, C. Reissfelder, C. Pilarsky, M. F. Fraga, D. Piwnica-Worms and R. Kalluri, Nature, 2015, 523, 177–182 CrossRef CAS PubMed.
- C. P. Lai, O. Mardini, M. Ericsson, S. Prabhakar, C. A. Maguire, J. W. Chen, B. A. Tannous and X. O. Breakefield, ACS Nano, 2014, 8, 483–494 CrossRef CAS PubMed.
- M. Nawaz, G. Camussi, H. Valadi, I. Nazarenko, K. Ekstrom, X. Wang, S. Principe, N. Shah, N. M. Ashraf, F. Fatima, L. Neder and T. Kislinger, Nat. Rev. Urol., 2014, 11, 688–701 CrossRef PubMed.
- T. Wang, K. W. Anderson and I. V. Turko, Anal. Chem., 2017, 89, 11070–11075 CrossRef CAS PubMed.
- D. J. Clark, W. E. Fondrie, Z. Liao, P. I. Hanson, A. Fulton, L. Mao and A. J. Yang, Anal. Chem., 2015, 87, 10462–10469 CrossRef CAS PubMed.
- B. Mateescu, E. J. Kowal, B. W. van Balkom, S. Bartel, S. N. Bhattacharyya, E. I. Buzas, A. H. Buck, P. de Candia, F. W. Chow, S. Das, T. A. Driedonks, L. Fernandez-Messina, F. Haderk, A. F. Hill, J. C. Jones, K. R. Van Keuren-Jensen, C. P. Lai, C. Lasser, I. D. Liegro, T. R. Lunavat, M. J. Lorenowicz, S. L. Maas, I. Mager, M. Mittelbrunn, S. Momma, K. Mukherjee, M. Nawaz, D. M. Pegtel, M. W. Pfaffl, R. M. Schiffelers, H. Tahara, C. Thery, J. P. Tosar, M. H. Wauben, K. W. Witwer and E. N. Nolte-'tHoen, J. Extracell. Vesicles, 2017, 6, 1286095 CrossRef PubMed.
- M. I. Ramirez, M. G. Amorim, C. Gadelha, I. Milic, J. A. Welsh, V. M. Freitas, M. Nawaz, N. Akbar, Y. Couch, L. Makin, F. Cooke, A. L. Vettore, P. X. Batista, R. Freezor, J. A. Pezuk, L. Rosa-Fernandes, A. C. O. Carreira, A. Devitt, L. Jacobs, I. T. Silva, G. Coakley, D. N. Nunes, D. Carter, G. Palmisano and E. Dias-Neto, Nanoscale, 2018, 10, 881–906 RSC.
- C. Théry, S. Amigorena, G. Raposo and A. Clayton, Curr. Protoc. Cell Biol., 2006, 30, 3.22.1–3.22.29 CrossRef PubMed.
- A. Clayton, H. Navabi, M. Adams, M. D. Mason, J. A. Hobot, G. R. Newman and B. Jasani, J. Immunol. Methods, 2001, 247, 163–174 CrossRef CAS PubMed.
- M. P. Zaborowski, L. Balaj, X. O. Breakefield and C. P. Lai, BioScience, 2015, 65, 783–797 CrossRef PubMed.
- H. Peinado, M. Aleckovic, S. Lavotshkin, I. Matei, B. Costa-Silva, G. Moreno-Bueno, M. Hergueta-Redondo, C. Williams, G. Garcia-Santos, C. Ghajar, A. Nitadori-Hoshino, C. Hoffman, K. Badal, B. A. Garcia, M. K. Callahan, J. Yuan, V. R. Martins, J. Skog, R. N. Kaplan, M. S. Brady, J. D. Wolchok, P. B. Chapman, Y. Kang, J. Bromberg and D. Lyden, Nat. Med., 2012, 18, 883–891 CrossRef CAS PubMed.
- T. An, S. Qin, Y. Xu, Y. Tang, Y. Huang, B. Situ, J. M. Inal and L. Zheng, J. Extracell. Vesicles, 2015, 4, 27522 CrossRef PubMed.
- C. Chen, S. Zong, Z. Wang, J. Lu, D. Zhu, Y. Zhang and Y. Cui, ACS Appl. Mater. Interfaces, 2016, 8, 25825–25833 CrossRef CAS PubMed.
- H. Zhou, P. S. Yuen, T. Pisitkun, P. A. Gonzales, H. Yasuda, J. W. Dear, P. Gross, M. A. Knepper and R. A. Star, Kidney Int., 2006, 69, 1471–1476 CrossRef CAS PubMed.
- K. Ueda, N. Ishikawa, A. Tatsuguchi, N. Saichi, R. Fujii and H. Nakagawa, Sci. Rep., 2014, 4, 6232 CrossRef CAS PubMed.
- J. Van Deun, P. Mestdagh, R. Sormunen, V. Cocquyt, K. Vermaelen, J. Vandesompele, M. Bracke, O. De Wever and A. Hendrix, J. Extracell. Vesicles, 2014, 3, 24858 CrossRef PubMed.
- H. Kalra, C. G. Adda, M. Liem, C. S. Ang, A. Mechler, R. J. Simpson, M. D. Hulett and S. Mathivanan, Proteomics, 2013, 13, 3354–3364 CrossRef CAS PubMed.
- J. Couzin, Science, 2005, 308, 1862 CrossRef CAS PubMed.
- J. Kowal, G. Arras and M. Colombo, Proc. Natl. Acad. Sci. U. S. A., 2016, 2, 201521230 Search PubMed.
- A. Cvjetkovic, S. C. Jang, B. Konecna, J. L. Hoog, C. Sihlbom, C. Lasser and J. Lotvall, Sci. Rep., 2016, 6, 36338 CrossRef CAS PubMed.
- Y. Wan, G. Cheng, X. Liu, S. J. Hao, M. Nisic, C. D. Zhu, Y. Q. Xia, W. Q. Li, Z. G. Wang, W. L. Zhang, S. J. Rice, A. Sebastian, I. Albert, C. P. Belani and S. Y. Zheng, Nat. Biomed. Eng., 2017, 1, 0058 CrossRef PubMed.
- T. Tian, Y. L. Zhu, F. H. Hu, Y. Y. Wang, N. P. Huang and Z. D. Xiao, J. Cell. Physiol., 2013, 228, 1487–1495 CrossRef CAS PubMed.
- F. He, H. Liu, X. Guo, B. C. Yin and B. C. Ye, Anal. Chem., 2017, 89, 12968–12975 CrossRef CAS PubMed.
- S. Xinbo, PhD dissertation, Dalian University of Technology, 2017.
- H. Mingyu, Master dissertation, Dalian University of Technology, 2017.
- X. Zhang, C. Wang, L. Jin, Z. Han and Y. Xiao, ACS Appl. Mater. Interfaces, 2014, 6, 12372–12379 CrossRef CAS PubMed.
- A. Riches, E. Campbell, E. Borger and S. Powis, Eur. J. Cancer, 2014, 50, 1025–1034 CrossRef CAS PubMed.
- C. A. Franzen, P. E. Simms, A. F. Van Huis, K. E. Foreman, P. C. Kuo and G. N. Gupta, BioMed Res. Int., 2014, 2014, 619829 Search PubMed.
- X. Zhang, Y. Xiao, J. Qi, J. Qu, B. Kim, X. Yue and K. D. Belfield, J. Org. Chem., 2013, 78, 9153–9160 CrossRef CAS PubMed.
- D. Zhang, V. Martin, I. Garcia-Moreno, A. Costela, M. E. Perez-Ojeda and Y. Xiao, Phys. Chem. Chem. Phys., 2011, 13, 13026–13033 RSC.
- R. F. Zwaal and A. J. Schroit, Blood, 1997, 89, 1121–1132 CAS.
- T. Parasassi, E. K. Krasnowska, L. Bagatolli and E. Gratton, J. Fluoresc., 1998, 8, 365–373 CrossRef CAS.
- A. E. Morelli, A. T. Larregina, W. J. Shufesky, M. L. Sullivan, D. B. Stolz, G. D. Papworth, A. F. Zahorchak, A. J. Logar, Z. Wang, S. C. Watkins, L. D. Falo, Jr. and A. W. Thomson, Blood, 2004, 104, 3257–3266 CrossRef CAS PubMed.
- F. Szoka and D. Papahadjopoulos, Proc. Natl. Acad. Sci. U. S. A., 1978, 75, 4194–4198 CrossRef CAS.
- K. Wojciechowski, M. Orczyk, M. Trapp and T. Gutberlet, Colloids Surf., A, 2016, 510, 150–158 CrossRef CAS.
- H. Kobayashi and P. L. Choyke, Acc. Chem. Res., 2010, 44, 83–90 CrossRef PubMed.
- Y. Xia, M. Liu, L. Wang, A. Yan, W. He, M. Chen, J. Lan, J. Xu, L. Guan and J. Chen, Biosens. Bioelectron., 2017, 92, 8–15 CrossRef CAS PubMed.
Footnote |
| † Electronic supplementary information (ESI) available: Fig. S1–S7. See DOI: 10.1039/c8qm00300a |
| This journal is © the Partner Organisations 2018 |

