Easily prepared ruthenium-complex nanomicelle probes for two-photon quantitative imaging of oxygen in aqueous media
Aamir A. Khan,
Susan K. Fullerton-Shirey and
Scott S. Howard*
Department of Electrical Engineering, University of Notre Dame, Notre Dame, IN 46556, USA. E-mail: showard@nd.edu
First published on 13th November 2014
Abstract
We present a simple and inexpensive technique to enable 3D, high-resolution, and quantitative imaging of dissolved oxygen in aqueous media using a commercially available hydrophobic dye, [Ru(dpp)3]2+. The dye is encapsulated in nanomicelles formed by a poloxamer (a biocompatible surfactant), allowing for uniform dispersion in aqueous media without long, complex, and expensive chemical synthesis procedures. The nanomicelle probes are tested and found to remain stable for several months in water and for several hours in biological media. The probes are sufficiently large in size for vasculature retention and enable intravenous oxygen imaging in vivo. The two-photon cross-section of the [Ru(dpp)3]2+ nanomicelle probes surpass that of the well-established and widely used oxygen-sensitive probes in multiphoton microscopy. We also characterize the oxygen-sensitivity of the probes as a proof of their viability as low cost and easily prepared markers for multiphoton quantitative oxygen imaging in vivo and for other applications in aqueous media.
1 Introduction
The measurement of dissolved oxygen plays an important role in physiological research as well as in many environmental and industrial applications.1–5 Several areas of medicinal research rely on information about oxygen concentration at the tissue and cellular levels. For example, quantitative information about oxygen levels in tumors can lead to optimized treatment methods in oncology.6 Oxygen imaging of brain vasculature can lead to a better understanding of brain activity in neurological research.7–10 At the intracellular level, oxygen imaging can provide insights into cellular signaling pathways and metabolic activity.2,4,11,12The measurement of dissolved oxygen can be accomplished either electrochemically or optically. Electrochemical techniques, such as the Clark electrode for example, have the disadvantage of consuming oxygen, thus needing constant stirring of the analyte that causes deterioration of the sensing electrode over time.3,5 In contrast, optical oxygen sensors provide a minimally invasive and non-consuming approach to measure oxygen. These are based on the principle that the photoluminescence from a phosphorescent luminophore depends upon the oxygen concentration in the local microenvironment. Oxygen molecules colliding with an excited luminophore provide a non-radiative pathway for high energy state electrons to relax. This phenomenon, called “collisional quenching”, decreases both the phosphorescence intensity and lifetime.1,13 Either quantity provides a quantitative measurement of oxygen; however, lifetime measurement is preferred because it is self-referencing and relatively less susceptible to light scattering, photobleaching, fluctuations in luminophore concentration, and drift in detector sensitivity and excitation power.13–15 Lifetime-based techniques are also utilized in fluorescence/phosphorescence lifetime imaging microscopy (FLIM/PLIM), an imaging modality for the quantitative measurement of oxygen in vivo7–10,16 and in vitro.4,17
Most optical oxygen sensors utilize phosphorescent luminophores that are quenchable by oxygen (also called dyes or indicators).1,2 Examples include porphyrins of platinum and palladium,18 molybdenum chloride clusters,5 and ruthenium complexes such as [Ru(dpp)3]2+ and [Ru(dpp)3]2+.4,12,15 Even though bioimaging and other aqueous oxygen sensing applications require the dyes to either be water-soluble or uniformly dispersible in water, the fact is that most of the oxygen-sensitive dyes are hydrophobic in nature.2,19 To overcome this problem, hydrophobic dyes are usually PEGylated which involves the attachment of hydrophilic functional groups and/or dendrimers to enhance water-solubility.2,20,21 The Oxyphor family of probes (Oxyphor-R2, -G2, -R4, and -G4) is a good example of changing the hydrophobicity of palladium-porphyrins by adding hydrophilic dendrimers.22–24 However, the Oxyphor probes lack two-photon cross-sections and thus they cannot be used in multiphoton microscopy25,26 for high-resolution and depth-resolved bioimaging.27 Vinogradov et al. address this problem by developing PtP-C343, a hydrophilic dendritic probe with two-photon absorbing antennae attached to a platinum-porphyrin core.6,28 PtP-C343 is a well-established probe and is widely used in 3D, high-resolution, and quantitative imaging of oxygen in vivo,8–10,16 but requires complex chemical synthesis procedures for preparation.
Hydrophobic dyes can also be immobilized in an oxygen-permeable polymer matrix (e.g., polystyrene,29 silicone,30 polysulfone,31 etc.) for localized immersion in aqueous media. The immobilizing matrix is usually deposited on a thin film5,19,30–32 or an optical-fiber tip,29,33 neither of which enables the uniform dispersion of dye molecules in water. The polymer matrix also adds a barrier between the dye and oxygen molecules, thereby reducing the oxygen-sensitivity and response time.3 Another technique, using PEBBLE nanosensors, encapsulates hydrophobic dyes in organically modified silicate matrices of 100–800 nm size. These nanosensors are prepared by a sol–gel process and are permeable to oxygen.3,12 In contrast to dendritic/PEGylated probes, PEBBLE nanosensors do not require any chemical synthesis to achieve a uniform dispersion of hydrophobic dyes in water.
One of the most important biological applications of oxygen-sensitive probes is oxygen imaging of brain vasculature in vivo.8–10 3D, high-resolution, and deep brain imaging and other in vivo intravenous applications require probes that are: (a) hydrophilic, (b) sufficiently large to be retained within the vasculature, (c) sensitive and permeable to oxygen, (d) compatible with multiphoton microscopy, (e) stable in biological media, and (f) commercially available or easily prepared. However, most water-soluble dyes (e.g., [Ru(bpy)3]2+ and rhodamine B) are small in size and tend to diffuse out of the capillaries into the interstitial fluid. Conjugation with large dextran molecules or grafting with organic luminophores is often required to retain these dyes inside the vasculature.8,34,35 On the other hand, hydrophilic PEBBLE nanosensors are too large in size (100–800 nm) and pose a greater risk of capillary damage.3 Only the PtP-C343 probe6,28 fits all of the design criteria except that it is not available commercially and requires complex preparation procedures.
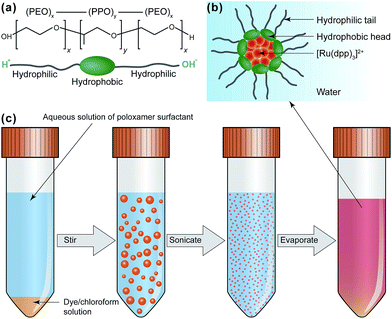
In this paper, we present a probe that is simple to prepare and addresses all of the requirements for 3D, high-resolution, and quantitative imaging of dissolved oxygen in vivo. A low cost, commercially available, oxygen-sensitive, two-photon compatible, and hydrophobic ruthenium-complex dye, [Ru(dpp)3]2+, is encapsulated by the process of surfactant micellization36 for uniform dispersion in aqueous media. Several methods to solubilize hydrophobic dyes in water through the micelle-encapsulation technique have been reported in the literature.35,37–39 We adapted a procedure reported for preparing an in vivo vasculature imaging probe,35 and applied it with several modifications to encapsulate [Ru(dpp)3]2+ for dissolved oxygen imaging in aqueous media. The procedure takes less than two hours and does not involve any laborious and complex chemical synthesis. The dye is first dissolved in chloroform and combined with a solution of surfactant and water. The surfactant, poloxamer-407, is a biocompatible,40–42 non-ionic A–B–A block copolymer. The B-block is polypropylene oxide (PPO) and the A-block is polyethylene oxide (PEO) as shown in Fig. 1a. Because chloroform is a good solvent for PPO, and water is a good solvent for PEO, nanometer-sized micelles of the surfactant encapsulating the dye are formed when high shear is applied by ultrasonication. The chloroform is evaporated and the solution is filtered to retain only the larger nanomicelles (>5 nm) that do not diffuse across the vasculature endothelium.7,35 As shown in Fig. 1b, the nanomicelles sequester the dye in the hydrophobic core while permitting oxygen diffusion, and the hydrophilic tails enable solvation of the surfactant to form a homogenous, aqueous solution.
Qualitative two-photon in vivo imaging of mouse brain vasculature has previously been demonstrated using [Ru(dpp)3]2+ and other dyes encapsulated in poloxamer nanomicelles.7,35 To obtain quantitative results, however, the oxygen-sensitivity of the nanomicelle probes needs to be measured carefully. In this paper, we present the photophysical characterization of the probes and show that the probes can be used for quantitative measurements of dissolved oxygen in aqueous media with sensitivity comparable to that of the well-established and widely used probes, while providing improved two-photon cross-section. The Stern–Volmer response of the probes is measured and shows a larger oxygen-sensitivity than that of [Ru(dpp)3]2+ dissolved in a hydrophobic solvent and [Ru(dpp)3]2+ encapsulated in PEBBLE nanosensors,12 and is comparable to that of PtP-C343.6,28 The two-photon excitation cross-section of the probes is found to be three times larger than that of PtP-C34328 and comparable to that of fluorescein.43 The probes remain stable for several months in water and for several hours in biological media without breaking down, thereby enabling extended time-lapse oxygen imaging in vivo and in vitro.
2 Preparation of nanomicelle probes
4 mg of [Ru(dpp)3]Cl2† dye (Alfa Aesar) is dissolved in 100 μL of chloroform. 100 mg of poloxamer-407 surfactant (Pluronic® F127; Sigma-Aldrich) is dissolved in 10 mL deionized (DI) water. A micropipette is used to transfer the dye/chloroform solution to the surfactant/aqueous solution. Because water and chloroform are immiscible, a two-phase mixture forms prior to emulsification. The solution is transferred to a 50 mL plastic centrifuge tube and mounted on a ring stand. An ultrasonic homogenizer (Branson Sonifier® SLPe 150 Watt) with a 1/8 inch diameter microtip is used to create the nanoemulsion. The ultrasonic homogenizer generates the high frequency mechanical energy required to create a stable, homogenous emulsion. The microtip is mounted on a ring stand and lowered into the plastic tube until the tip is immersed in at least 1 cm of solution. The solution is immersed in an ice bath to facilitate rapid cooling and prevent the evaporation of chloroform while the emulsion is formed. The Sonifier® is run continuously for 10 seconds, then turned off for 10 seconds allowing the solution to cool. This sequence is repeated six times at 50% amplitude for a total of 60 seconds of emulsification time. The opacity of the orange solution changes from transparent to opaque when the emulsion is formed. The plastic tube is transferred to a 62 °C water bath for 30 minutes to evaporate the chloroform, leaving a transparent, homogenous orange solution. (Note: phase separation indicates that the emulsification has failed). Aggregates larger than 2.5 μm are removed by passing the solution through Grade 5 Whatman filter paper. Excess surfactant is removed using an Amicon Ultra-15 centrifugal filter (EMD Millipore) with 10 kDa molecular weight cut-off (5 nm pore size). The solution is centrifuged at 5000 g for 30 minutes using a fixed angle rotor. The faint-orange colored filtrate contains excess water and surfactant, while the deep-orange colored concentrate contains 1.2 mL of [Ru(dpp)3]2+ nanomicelle probe solution (Fig. 1c). The probe solution is stored in a glass vial at room temperature and shows no visual signs of precipitation and/or micelle aggregation for at least 6 months.2.1 Concentration measurement
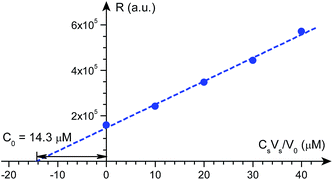
In the encapsulation procedure, some amount of [Ru(dpp)3]2+ is lost due to the incomplete mixing of the dye/chloroform and surfactant/water solutions, and the incomplete recovery of smaller nanomicelles (<5 nm) during centrifugal filtration. The concentration of [Ru(dpp)3]2+ in the nanomicelle solution will be overestimated if the lost amount is not accounted for. The matrix effect of the encapsulating surfactant further complicates the concentration measurement. To overcome these factors, the method of standard addition44 is used to measure the concentration of [Ru(dpp)3]2+ in the nanomicelle solution.3 Photophysical characterization
It is necessary to show that the nanomicelle probes are effective for the quantitative measurement of dissolved oxygen and are compatible with multiphoton microscopy. Four different properties of the probes are thus characterized in the subsequent sections: (a) absorption and emission, (b) sensitivity to dissolved oxygen, (c) two-photon excitation (TPE) cross-section, and (d) stability in various biological media.3.1 Absorption and emission spectra
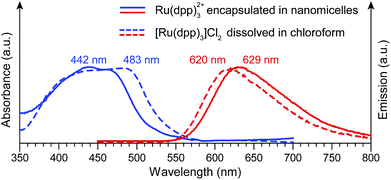
![[thin space (1/6-em)]](https://www.rsc.org/images/entities/char_2009.gif) 000 M−1 cm−1)45 and emission quantum yield (0.3)32,46 to change after encapsulation. The peaks are appropriate for linear optical excitation and show compatibility with the existing confocal fluorescence microscopy systems.
000 M−1 cm−1)45 and emission quantum yield (0.3)32,46 to change after encapsulation. The peaks are appropriate for linear optical excitation and show compatibility with the existing confocal fluorescence microscopy systems.
3.2 Sensitivity to dissolved oxygen
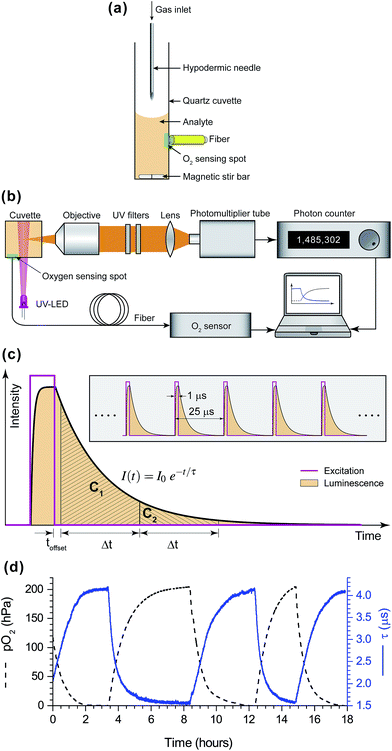
It is important to confirm that the nanomicelle probes are effective for sensing dissolved oxygen. Therefore, the oxygen-sensitivity is characterized by measuring the phosphorescence lifetime of the probes as a function of dissolved oxygen concentration.Fig. 4b shows the optical setup used to measure the phosphorescence lifetime (τ) by exciting the nanomicelle solution with an ultraviolet light source and recording the phosphorescence decay through a photon counter. An uncollimated UV-LED (365 nm peak wavelength) illuminates the analyte in the cuvette. As shown in Fig. 4c, the LED is switched by 5 V × 1 μs pulses at a repetition rate of 40 kHz, leaving more than 5 lifetimes (<24 μs) for the emission to decay sufficiently between successive excitation pulses. The phosphorescence from the analyte is collected by an objective lens (Carl-Zeiss EC Plan Neofluar, 10×, 0.3 NA) placed at a right angle to the excitation LED. The phosphorescence is then filtered through two 450 nm longpass UV filters (Thorlabs FEL0450) and detected by a thermoelectrically cooled Hamamatsu H7422PA-40 GaAsP photomultiplier tube (PMT) as outlined in Fig. 4b. All of the aforementioned optical components are housed inside a light-tight enclosure so that the optical measurements can be made under dark conditions (<15 photons per second). A photon counter (Stanford Research Systems SR400) is connected to the PMT output and controlled remotely through custom scripts written in MATLAB®. Lifetime is measured using the rapid lifetime determination (RLD) method as the analyte is being oxygenated and deoxygenated. As shown in Fig. 4c, the RLD scheme divides the emission decay profile into two gates of equal width (Δt) and uses the intensity ratio (C1/C2) to calculate τ according to the following equation,
 | (1) |
To account for the non-zero turn-off time of the excitation pulse, opening of the first gate is delayed by a small amount, toffset = 0.5 μs, before starting the RLD measurement. Shot noise in photon statistics introduces error in the lifetime value obtained from the RLD method. As shown by Ballew and Demas, the error can be minimized by setting the gate widths to 2.5τ.47 Thus, to minimize the error, the gate widths are adjusted for each RLD measurement as τ changes during the course of the experiment. Even in the absence of shot noise, the RLD scheme yields the true lifetime value only when the decay profile is perfectly monoexponential. For multiexponential decay, however, only an effective lifetime value that is indicative of the multiple rates in the luminescence decay process, can be obtained. Nevertheless, because multiexponential decay is a characteristic of the probe and will be manifested all the time under similar conditions, the nanomicelle probes can be characterized in terms of effective lifetime and reliable measurements of oxygen partial pressure can be made.14
 | (2) |
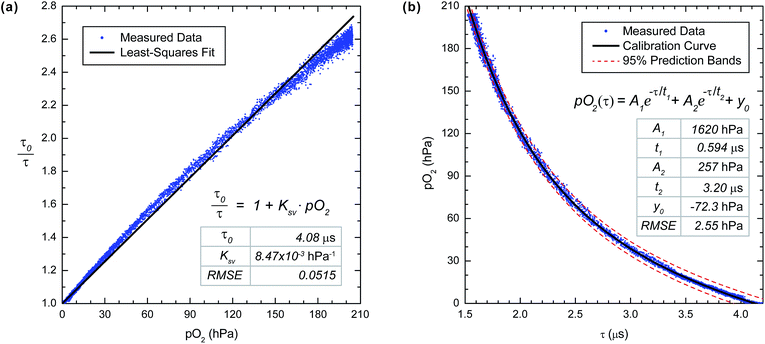 | ||
| Fig. 5 (a) The Stern–Volmer plot and (b) the calibration curve of the [Ru(dpp)3]2+ nanomicelle probes in aqueous solution obtained by fitting the measured data to eqn (2) and (3), respectively. The measured dataset consists of 6334 points collected from multiple cycles of oxygenation and deoxygenation (Fig. 4d) within a temperature range of 24.8 ± 0.9 °C. Fitting parameters and the root mean square error (RMSE) are shown for both the fits. | ||
The oxygen-sensitivity of the probe is directly related to the Stern–Volmer constant (KSV), therefore a larger value results in a wider dynamic range and a better contrast in imaging applications.1 However, an exceedingly large value of KSV is also undesirable because it requires a lifetime measurement setup of extended dynamic range and also deteriorates the signal-to-noise performance at high values of oxygen partial pressure (pO2). Other important design parameters for in vivo imaging probes are water-solubility and large particle size (10–100 nm) for vasculature retention.35 Two-photon excitation is also required for high-resolution and deep (∼1 mm) 3D imaging in vivo.48 Table 1 compares several oxygen-sensitive probes and shows that apart from this work, only the PtP-C343 probe6,28 fits all of these criteria for the two-photon imaging of dissolved oxygen in vivo. However, as mentioned in Section 1, PtP-C343 requires complex synthesis procedures in contrast to the easy preparation of the [Ru(dpp)3]2+ nanomicelle probes. When compared among water-soluble and two-photon compatible probes, the oxygen-sensitivity of the [Ru(dpp)3]2+ nanomicelle probes is comparable to that of PtP-C343,28 and larger than that of both [Ru(dpp)3]2+ encapsulated in PEBBLE nanosensors12 and the hydrophilic dye, [Ru(dpp)3]2+.15
| Probes | KSV (×10−3 hPa−1) | Water solubility | Vasculature retention | Two-photon excitation |
|---|---|---|---|---|
| a Probes with large KSV values have a poor signal-to-noise performance at high oxygen levels and require a measurement setup with extended dynamic range.b Large particle sizes (100–800 nm) pose a greater risk of capillary damage.3 | ||||
| [Ru(dpp)3]2+ nanomicelle probes | 8.47 | ✓ | ✓ | ✓ |
| PtP-C343 (dendritic Pt-porphyrin)28 | 7.65 | ✓ | ✓ | ✓ |
| Oxyphor-R2 (dendritic Pd-porphyrin)22 | 155a | ✓ | ✓ | |
| Oxyphor-G2 (dendritic Pd-porphyrin)22 | 39.6 | ✓ | ✓ | |
| Oxyphor-R4 (dendritic Pd-porphyrin)23 | 37.3 | ✓ | ✓ | |
| Oxyphor-G4 (dendritic Pd-porphyrin)23 | 34.5 | ✓ | ✓ | |
| PtOEPK PEBBLE nanosensors3 | 32.6 | ✓ | ✓b | |
| [Ru(dpp)3]2+ PEBBLE nanosensors12 | 3.94 | ✓ | ✓b | ✓ |
| [Ru(bpy)3]2+ dissolved in water15 | 2.47 | ✓ | ✓ | |
| [Ru(dpp)3]2+ dissolved in ethylene glycol15 | 6.72 | ✓ | ||
| [Ru(dpp)3]2+ immobilized in silicone30 | 30.1 | ✓ | ||
| K2Mo6Cl14 immobilized in silicone5 | 9.62 | ✓ | ||
As is evident in Fig. 5a, the Stern–Volmer plot of the nanomicelle probes deviates from a straight line and exhibits a concave curvature. This phenomenon is well known for the encapsulated probes and is caused by the non-uniform access of oxygen molecules to the encapsulated dye.12,30,32,49 Nevertheless, the reproducibility of the oxygen sensing response remains unaffected.28 For calibration purposes, however, another equation is needed in order to represent the observed response of the [Ru(dpp)3]2+ nanomicelle probes with minimal error. Fig. 5b shows the measured data fitted to an empirical biexponential decay model,8,10,50
| pO2(τ) = A1e−τ/t1 + A2e−τ/t2 + y0 | (3) |
It is to be noted that the values of KSV and calibration constants depend on the chemistry of the medium.23 Thus, the characterization of the oxygen sensing response of the [Ru(dpp)3]2+ nanomicelle probes, as shown in Fig. 5, is only valid in water. Future work is planned to generate calibration curves for using the probes in biological media. Nevertheless, the calibration in aqueous solution serves to show that [Ru(dpp)3]2+ remains sensitive to oxygen after encapsulation in the poloxamer nanomicelles.
3.3 Two-photon excitation cross-section spectrum
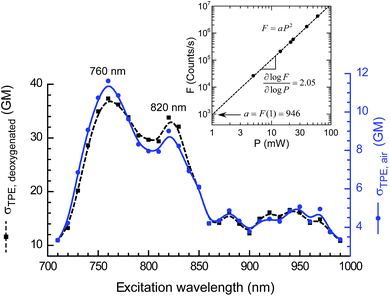
Two-photon luminescence is a non-linear optical phenomenon which is directly proportional to the squared excitation intensity (F ∝ P2). This phenomenon induces luminescence in a diffraction-limited and depth-resolved focal point to construct 3D images without a pinhole as required by confocal microscopy.25 The two-photon excitation cross-section (σTPE) of a probe is defined as the product of the two-photon luminescence quantum yield (η2) and two-photon absorption cross-section (σTPA),| σTPE = η2σTPA. | (4) |
A large value of the two-photon excitation (TPE) cross-section is desired because this enables deeper penetration and a higher signal-to-noise ratio in 3D multiphoton imaging.
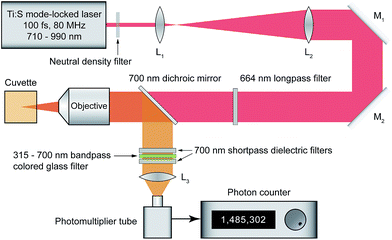 | ||
| Fig. 6 Two-photon fluorospectrometer for measuring the two-photon excitation cross-section spectrum. | ||
Six readings are taken at each excitation wavelength (710–990 nm in 10 nm steps) for the three samples: (a) fluorescein as the standard, (b) air-saturated nanomicelle solution, and (c) deoxygenated nanomicelle solution. For each reading, the neutral density filter is adjusted and the mechanized arm brings the power sensor to focus to measure P. Later, the power sensor is removed and the cuvette is focused to measure F. An objective lens of low numerical aperture (0.1) is used to avoid luminescence saturation. Furthermore, the strict quadratic dependence of two-photon luminescence (F = aP2) is confirmed at each wavelength over an extended range of excitation power (6–60 mW, corresponding to 75–750 pJ of pulse energy). The inset of Fig. 7 shows a representative set of such readings where the coefficient of quadratic dependence (a) is obtained by fitting the six data points to the linear equation, log![[thin space (1/6-em)]](https://www.rsc.org/images/entities/char_2009.gif) F = log
F = log![[thin space (1/6-em)]](https://www.rsc.org/images/entities/char_2009.gif) a + 2
a + 2![[thin space (1/6-em)]](https://www.rsc.org/images/entities/char_2009.gif) log
log![[thin space (1/6-em)]](https://www.rsc.org/images/entities/char_2009.gif) P. After determining the coefficients ‘a (λ)’ at each wavelength for all of the three samples, the TPE cross-section spectrum can be calculated according to the ratiometric method as,51
P. After determining the coefficients ‘a (λ)’ at each wavelength for all of the three samples, the TPE cross-section spectrum can be calculated according to the ratiometric method as,51
 | (5) |
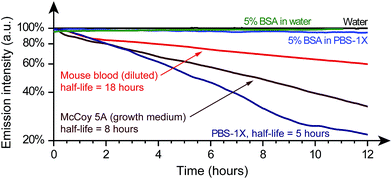
3.4 Stability in biological media
The poloxamer nanomicelles are formed by the hydrophobic–hydrophilic equilibrium of PPO and PEO blocks in water (Fig. 1a and b).55 Even though the nanomicelle probes are visually confirmed to be stable in DI water without any signs of precipitation and/or micelle aggregation for over 6 months, the presence of other chemical species in the aqueous solution, especially ions, can potentially disturb this equilibrium and cause the nanomicelles to break (demicellize), leading to phase separation.56 As the nanomicelles demicellize, the hydrophobic [Ru(dpp)3]2+ molecules in the cores can no longer remain suspended in the aqueous solution.36 Thus, it is important to characterize the stability of the probes in the biological media of interest.The stability data presented in Fig. 8 are collected at room temperature. At higher temperature, poloxamer micelles tend to aggregate, leading to increased solution viscosity.57 Therefore, the use of [Ru(dpp)3]2+ nanomicelle probes at a physiologically relevant temperature (37 °C) is not expected to increase the demicellization rate; however, the effect of micelle aggregation on performance as an oxygen sensing probe will require further investigation.
4 Conclusions
We have demonstrated a simple and low cost procedure for preparing a hydrophobic phosphorescence dye, [Ru(dpp)3]2+, for quantitative imaging of dissolved oxygen in aqueous media. The procedure requires less than two hours to prepare the nanomicelle probes which remain stable for several months in water. The probes remain stable in biological media for several hours readily exceeding the time required for in vivo imaging. The surfactant used for encapsulation, Pluronic® F127 (poloxamer-407), is also biocompatible40–42 thus making the nanomicelle probes an attractive choice for quick and inexpensive bioimaging applications.We have also described the experimental techniques for characterizing the oxygen sensing response of any phosphorescence dye for a wide range of oxygen conditions (0–213 hPa). The [Ru(dpp)3]2+ nanomicelle probes show at least twice as much sensitivity to dissolved oxygen than that of [Ru(bpy)3]2+ dissolved in water,15 [Ru(dpp)3]2+ encapsulated in PEBBLE nanosensors,12 and a comparable sensitivity to that of the state-of-the-art oxygen imaging probe, PtP-C343.6,28 Because the phenomena of phosphorescence emission and phosphorescence quenching by oxygen are both independent of the pathway by which the luminophore is promoted to the excited state, the Stern–Volmer and the calibration parameters measured under linear (ultraviolet) excitation (Fig. 5) are also valid for oxygen measurement with two-photon excitation.6,8 The probes are also compatible with multiphoton microscopy, showing a three times larger two-photon excitation cross-section than that of PtP-C34328 and comparable to that of fluorescein.43
The nanomicelle probes, however, have a few shortcomings as well. [Ru(dpp)3]2+, though inexpensive, suffers from photobleaching and has a temperature-dependent oxygen sensing response. To be used as an in vivo oxygen imaging probe, both the temperature and solvent-dependent calibration curves for oxygen-sensitivity need to be measured. Even with these fundamental limitations, the experimental results demonstrate that the [Ru(dpp)3]2+ nanomicelle probes are comparably sensitive to dissolved oxygen and are also suitable for two-photon oxygen imaging of vasculature in vivo.7 Future work with the nanomicelle probes aims to study in vivo stability, size distribution of the nanomicelles, temperature dependence of oxygen-sensitivity, oxygen monitoring in cell culture medium, and two-photon in vivo imaging of mouse ischemia models.
Acknowledgements
The authors would like to thank Dr Sergei Vinogradov (School of Medicine, University of Pennsylvania) and Dr Ruby Ghosh (Department of Physics & Astronomy, Michigan State University) for helpful discussions on oxygen-sensitive optical probes and gas dissolving techniques. Aamir A. Khan is supported by a graduate fellowship in Advanced Diagnostics & Therapeutics from the Berry Family Foundation (Dayton, Ohio, USA). Susan K. Fullerton-Shirey acknowledges support from the Notre Dame Center for Nanoscience and Technology (NDnano).References
- D. B. Papkovsky and R. I. Dmitriev, Chem. Soc. Rev., 2013, 42, 8700–8732 RSC
.
- M. Quaranta, S. M. Borisov and I. Klimant, Bioanal. Rev., 2012, 4, 115–157 CrossRef PubMed
.
- Y.-E. L. Koo, Y. Cao, R. Kopelman, S. M. Koo, M. Brasuel and M. A. Philbert, Anal. Chem., 2004, 76, 2498–2505 CrossRef CAS PubMed
.
- W. Zhong, P. Urayama and M.-A. Mycek, J. Phys. D: Appl. Phys., 2003, 36, 1689–1695 CrossRef CAS
.
- R. N. Ghosh, P. A. Askeland, S. Kramer and R. Loloee, Appl. Phys. Lett., 2011, 98, 221103 CrossRef PubMed
.
- O. S. Finikova, A. Y. Lebedev, A. Aprelev, T. Troxler, F. Gao, C. Garnacho, S. Muro, R. M. Hochstrasser and S. A. Vinogradov, ChemPhysChem, 2008, 9, 1673–1679 CrossRef CAS PubMed
.
- S. S. Howard, A. Straub, N. G. Horton, D. Kobat and C. Xu, Nat. Photonics, 2013, 7, 33–37 CrossRef CAS PubMed
.
- S. Sakadzić, E. Roussakis, M. A. Yaseen, E. T. Mandeville, V. J. Srinivasan, K. Arai, S. Ruvinskaya, A. Devor, E. H. Lo, S. A. Vinogradov and D. A. Boas, Nat. Methods, 2010, 7, 755–759 CrossRef PubMed
.
- J. Lecoq, A. Parpaleix, E. Roussakis, M. Ducros, Y. G. Houssen, S. A. Vinogradov and S. Charpak, Nat. Med., 2011, 17, 893–898 CrossRef CAS PubMed
.
- S. M. S. Kazmi, A. J. Salvaggio, A. D. Estrada, M. A. Hemati, N. K. Shaydyuk, E. Roussakis, T. A. Jones, S. A. Vinogradov and A. K. Dunn, Biomed. Opt. Express, 2013, 4, 1061–1073 CrossRef PubMed
.
- D. F. Wilson, O. S. Finikova, A. Y. Lebedev, S. Apreleva, A. Pastuszko, W. M. F. Lee and S. A. Vinogradov, Oxygen Transport to Tissue XXXII, Springer, US, 2011, vol. 701, pp. 53–59 Search PubMed
.
- H. Xu, J. W. Aylott, R. Kopelman, T. J. Miller and M. A. Philbert, Anal. Chem., 2001, 73, 4124–4133 CrossRef CAS
.
- H. C. Gerritsen, A. Draaijer, D. J. Heuvel and A. V. Agronskaia, Handbook Of Biological Confocal Microscopy, Springer, US, 3rd edn, 2006, pp. 516–534 Search PubMed
.
- M. I. J. Stich, L. H. Fischer and O. S. Wolfbeis, Chem. Soc. Rev., 2010, 39, 3102–3114 RSC
.
- K. J. Morris, M. S. Roach, W. Xu, J. N. Demas and B. A. DeGraff, Anal. Chem., 2007, 79, 9310–9314 CrossRef CAS PubMed
.
- J. A. Spencer, F. Ferraro, E. Roussakis, A. Klein, J. Wu, J. M. Runnels, W. Zaher, L. J. Mortensen, C. Alt, R. Turcotte, R. Yusuf, D. Côté, S. A. Vinogradov, D. T. Scadden and C. P. Lin, Nature, 2014, 508, 269–273 CrossRef CAS PubMed
.
- H. C. Gerritsen, R. Sanders, A. Draaijer, C. Ince and Y. K. Levine, J. Fluoresc., 1997, 7, 11–15 CrossRef CAS
.
- D. B. Papkovsky, G. V. Ponomarev, W. Trettnak and P. O’Leary, Anal. Chem., 1995, 67, 4112–4117 CrossRef CAS
.
- C. O’Donovan, J. Hynes, D. Yashunski and D. B. Papkovsky, J. Mater. Chem., 2005, 15, 2946 RSC
.
- D. Horn and J. Rieger, Angew. Chem., Int. Ed., 2001, 40, 4330–4361 CrossRef CAS
.
- U. Hahn, H. Luelf, H. D. F. Winkler, C. a. Schalley, F. Vögtle and L. De Cola, Chem.–Eur. J., 2012, 18, 15424–15432 CrossRef CAS PubMed
.
- I. Dunphy, S. A. Vinogradov and D. F. Wilson, Anal. Biochem., 2002, 310, 191–198 CrossRef CAS
.
- T. V. Esipova, A. Karagodov, J. Miller, D. F. Wilson, T. M. Busch and S. A. Vinogradov, Anal. Chem., 2011, 83, 8756–8765 CrossRef CAS PubMed
.
- S. A. Vinogradov and D. F. Wilson, Oxygen Transport to Tissue XIX, ed. D. K. Harrison and D. T. Delpy, Springer, US, 1997, vol. 428, pp. 657–662 Search PubMed
.
- W. R. Zipfel, R. M. Williams and W. W. Webb, Nat. Biotechnol., 2003, 21, 1369–1377 CrossRef CAS PubMed
.
- W. Denk, J. Strickler and W. Webb, Science, 1990, 248, 73–76 CAS
.
- M. A. Yaseen, V. J. Srinivasan, S. Sakadzić, W. Wu, S. Ruvinskaya, S. A. Vinogradov and D. A. Boas, Opt. Express, 2009, 17, 22341–22350 CrossRef CAS PubMed
.
- A. Y. Lebedev, T. Troxler and S. A. Vinogradov, J. Porphyrins Phthalocyanines, 2008, 12, 1261–1269 CrossRef CAS PubMed
.
- I. Klimant, V. Meyer and M. Kuhl, Limnol. Oceanogr., 1995, 40, 1159–1165 CrossRef CAS
.
- J. R. Bacon and J. N. Demas, Anal. Chem., 1987, 59, 2780–2785 CrossRef CAS
.
- D. Badocco, A. Mondin, P. Pastore, S. Voltolina and S. Gross, Anal. Chim. Acta, 2008, 627, 239–246 CrossRef CAS PubMed
.
- A. Mills and M. Thomas, Analyst, 1997, 122, 63–68 RSC
.
- P. Jorge, C. Maule, A. Silva, R. Benrashid, J. Santos and F. Farahi, Anal. Chim. Acta, 2008, 606, 223–229 CrossRef CAS PubMed
.
- A. C. Kreitzer, K. R. Gee, E. A. Archer and W. G. Regehr, Neuron, 2000, 27, 25–32 CrossRef CAS
.
- M. Maurin, O. Stéphan, J.-C. Vial, S. R. Marder and B. van der Sanden, J. Biomed. Opt., 2011, 16, 036001 CrossRef PubMed
.
- P. Alexandridis and T. A. Hatton, Colloids Surf., A, 1995, 96, 1–46 CrossRef CAS
.
- M. Maurin, L. Vurth, J.-C. Vial, P. Baldeck, S. R. Marder, B. Van der Sanden and O. Stephan, Nanotechnology, 2009, 20, 235102 CrossRef PubMed
.
- C. D. Andrade, C. O. Yanez, M. A. Qaddoura, X. Wang, C. L. Arnett, S. A. Coombs, J. Yu, R. Bassiouni, M. V. Bondar and K. D. Belfield, J. Fluoresc., 2011, 21, 1223–1230 CrossRef CAS PubMed
.
- A. Tehrani-Bagha and K. Holmberg, Materials, 2013, 6, 580–608 CrossRef CAS PubMed
.
- Y. Shachaf, M. Gonen-Wadmany and D. Seliktar, Biomaterials, 2010, 31, 2836–2847 CrossRef CAS PubMed
.
- W. Hennink, E. V. Batrakova and A. V. Kabanov, J. Controlled Release, 2008, 130, 98–106 CrossRef PubMed
.
- G. Riess, Prog. Polym. Sci., 2003, 28, 1107–1170 CrossRef CAS
.
- C. Xu and W. Webb, J. Opt. Soc. Am. B, 1996, 13, 481–491 CrossRef CAS
.
- D. C. Harris, Quantitative Chemical Analysis, W. H. Freeman, New York, 6th edn, 2003 Search PubMed
.
- G. A. Crosby and R. J. Watts, J. Am. Chem. Soc., 1971, 93, 3184–3188 CrossRef CAS
.
- K. Nakamaru, K. Nishio and H. Nobe, Sci. Rep. Hirosaki Univ., 1979, 26, 57–62 CAS
.
- R. M. Ballew and J. N. Demas, Anal. Chem., 1989, 61, 30–33 CrossRef CAS
.
- F. Helmchen and W. Denk, Nat. Methods, 2005, 2, 932–940 CrossRef CAS PubMed
.
- J. Demas, B. DeGraff and W. Xu, Anal. Chem., 1995, 67, 1377–1380 CrossRef CAS
.
- S. Sakadzić, S. Yuan, E. Dilekoz, S. Ruvinskaya, S. A. Vinogradov, C. Ayata and D. A. Boas, Appl. Opt., 2009, 48, D169–D177 CrossRef
.
- M. A. Albota, C. Xu and W. W. Webb, Appl. Opt., 1998, 37, 7352–7356 CrossRef CAS
.
- G. A. Crosby and J. N. Demas, J. Phys. Chem., 1971, 75, 991–1024 CrossRef CAS
.
- T. Karstens and K. Kobs, J. Phys. Chem., 1980, 84, 1871–1872 CrossRef CAS
.
- NIH-NIBIB Biomedical Technology Resource, Developmental Resource for Biophysical Imaging Opto-Electronics (DRBIO), http://www.drbio.cornell.edu/cross_sections.html, accessed 21 February 2014.
- L. Jia, C. Guo, L. Yang, J. Xiang, Y. Tang, C. Liu and H. Liu, J. Colloid Interface Sci., 2010, 345, 332–337 CrossRef CAS PubMed
.
- P. Desai, N. Jain, R. Sharma and P. Bahadur, Colloids Surf., A, 2001, 178, 57–69 CrossRef CAS
.
- E. B. Jørgensen, S. Hvidt, W. Brown and K. Schillén, Macromolecules, 1997, 30, 2355–2364 CrossRef
.
Footnote |
| † Tris(4,7-diphenyl-1,10-phenanthroline)ruthenium(II) dichloride. |
| This journal is © The Royal Society of Chemistry 2015 |

