
Structure of solid lipid nanoparticles produced by a microwave-assisted microemulsion technique
Rohan M. Shah*a,
Gary Bryantb,
Matthew Taylorb,
Daniel S. Eldridgea,
Enzo A. Palomboa and
Ian H. Harding*a
aDepartment of Chemistry and Biotechnology, Faculty of Science, Engineering and Technology, Swinburne University of Technology, Hawthorn, Melbourne, Australia. E-mail: iharding@swin.edu.au; rshah@swin.edu.au; Fax: +61 3 9819 0834; Tel: +61 3 9214 8715
bCentre for Molecular and Nanoscale Physics (NanoPHYS), School of Applied Sciences, RMIT University, Melbourne, Australia
First published on 8th April 2016
Abstract
We have recently reported a novel microwave-assisted microemulsion technique for the production of solid lipid nanoparticles (SLNs). SLNs are colloidal carriers made from physiologically well-tolerated lipids that are normally solid at room and body temperature. These microwave-produced SLNs have small size, moderate zeta potential, high encapsulation efficiency and low crystallinity. The drug release studies conducted on drug-loaded SLNs are consistent with a core–shell structure for the microwave-produced SLNs, but with significantly different release profiles depending on the drug used. We further employed multi-angle static and dynamic light scattering (SLS/DLS) and small angle X-ray scattering (SAXS) techniques to help elucidate the structure of microwave-produced SLNs. The SLS/DLS data for the SLNs prepared in this study are consistent with a core–shell structure with a shell thickness of ∼13 nm. SAXS data suggest that the SLNs have a lipid lamellar structure with a repeat spacing of 41.0 ± 0.1 Å.
1. Introduction
Drug delivery vehicles are known to enhance efficiency and efficacy and to reduce the possible side effects of the drug encapsulated within. Various advanced nanostructures have been developed for this purpose including micelles, liposomes, polymeric nanoparticles and lipid nanoparticles. Lipid nanoparticles have many of the favorable features of the other nanostructures (biocompatibility, increased drug payload, controlled release, physical stability) but with reduced negative effects associated with those nanostructures (drug leakage, polymer and solvent toxicity).1Suspensions of solid lipid nanoparticles (SLNs) stabilized with emulsifiers have been thoroughly investigated since their inception in the 1990s.2,3 These are emulsions at high temperature when first prepared that, upon cooling, crystallize predominantly into SLNs. Our group has recently reported a novel microwave-assisted microemulsion-based technique to prepare such SLNs.4
The findings from our previous experiments indicate the suitability of these SLNs as potential carriers for lipophilic cargos.4 A variety of techniques have been used to characterize the SLNs including dynamic light scattering, zeta potential analysis, differential scanning calorimetry and X-ray diffraction. However, these techniques have either provided information about the whole assembled (macroscopic) structure or about atomic level structure, rather than the nano-sized structure of interest. It is believed that the structure of SLNs significantly changes in the presence of different drugs and in the presence of various physical stimuli (e.g. temperature, ionic condition of solvent). The structure of SLNs not only influences drug release properties and stability but also influences some of the important biological processes including biodistribution and cellular uptake.5,6 Drug association with SLNs has been well studied,7–10 however, the location of the drugs (within the nanoparticle core, within the shell, particle associated, or dispersed homogenously) often remains unclear. To facilitate further development of SLNs as drug vehicles, it is necessary to obtain a more thorough understanding of their structure at all scales.
The aim of this study is to investigate the nanostructure of the SLNs, and to study how structural morphology changes upon drug loading. Indomethacin and miconazole nitrate were selected as lipophilic “model” drugs based on their physicochemical properties (Table 1) and previous successes in encapsulation studies.11–14 To the best of our knowledge, this is the first study that investigates the structure of the microwave-produced SLNs encapsulated with and without drugs of interest, using light scattering and X-ray scattering techniques.
| SLNs | PCS radius (nm) | Zeta potential (mV) | Multi-angle DLS average radius (nm) |
|---|---|---|---|
| a PCS: photon correlation spectroscopy, DLS: dynamic light scattering. The results presented in this table are mean values ± SD. | |||
| Drug-free SLNs | 118 ± 2 | −25.4 ± 1.6 | 136 ± 2 |
| Indomethacin-loaded SLNs | 137 ± 4 | −21.4 ± 1.4 | 157 ± 3 |
| Miconazole nitrate-loaded SLNs | 143 ± 2 | +19.8 ± 1.0 | 164 ± 4 |
2. Experimental
2.1 Preparation of solid lipid nanoparticles
The SLNs were prepared by the microwave-assisted microemulsion technique reported recently by our group.4 Briefly, stearic acid (Sigma-Aldrich, Australia, 100 mg), Tween® 20 (Merck, Australia, 165 mg) and water (MilliQ®, 1.35 mL) were heated in a microwave reactor tube at 80 °C, with constant stirring at a variable microwave power not exceeding 18 W, for 10 min using a 2.45 GHz Discover LabMate microwave synthesizer (CEM Corporation, USA). For drug-loaded SLNs, indomethacin or miconazole nitrate, 5% (w/w) relative to stearic acid, was added to the tube prior to microwave heating. This microwave-assisted process constitutes a single-pot synthesis of the o/w microemulsion both in the presence and absence of encapsulated drug. The SLNs were generated by quick dispersion of hot o/w microemulsion into cold water (50 mL, 2–4 °C) under constant magnetic stirring (1000 rpm).2.2 Preliminary physicochemical characterization
A preliminary characterization was carried out to determine the mean hydrodynamic diameter and electrophoretic mobility of the SLNs by photon correlation spectroscopy (PCS) and phase analysis light scattering (PALS) respectively, using a 90Plus Particle Analyzer (Brookhaven Instruments, USA). Prior to measurements, each SLN sample was diluted with deionized water to obtain a weak opalescent dispersion. The viscosity (0.8937 cp) and refractive index (1.33) of water at 25 °C were used for all measurements. The instrument uses a 35 mW red diode laser (λ = 659 nm) with a photodetector at 90° and a thermostatted sample chamber set at 25 °C. The zeta potential of the SLNs was calculated from the electrophoretic mobility using the program “Zeta for windows”.15 The shape and particle size of the SLNs was also investigated using field emission scanning electron microscopy (FESEM) on a SUPRA™ 40VP (Carl Zeiss Microscopy GmbH, Jena).The encapsulation efficiency (EE) of the SLNs was determined by centrifugal ultrafiltration described previously by Shah et al.4 The amount of drug was determined by high performance liquid chromatography (HPLC) (see Section 2.4). The EE of SLNs was calculated as,

A preliminary investigation was also undertaken to study the crystallinity of the SLNs by thermal and X-ray diffraction studies. Thermal studies were undertaken by differential scanning calorimetry (DSC) using a 2920 Modulated DSC (TA Instruments, USA). Samples (∼5 mg) sealed in aluminum pans were kept under isothermal conditions at 25 °C for 10 min and further scanned between 25 °C and 80 °C at a heating rate of 10 °C min−1. The melting enthalpy (ΔH) was obtained by integration of the area under the transition thermogram peak and recrystallization index (RI) was calculated as,

The X-ray diffraction (XRD) patterns were obtained using a D8 Advance diffractometer (Bruker, Germany). The crystalline characteristics of bulk lipid and SLNs were analyzed using primary monochromatic radiation (Cu Kα1, λ = 1.5406 Å). Samples (∼5 mg) were placed on glass sample holders and scanned between 5° and 40° with an angular scan speed of 0.6° min−1. The operating voltage was 40 kV and the current was 40 mA.
2.3 Drug release studies
In vitro release studies were performed using the dialysis bag technique described previously by Gomes et al.16 Phosphate buffered saline (PBS; 100 mM, pH 7.4) supplemented with 0.1% Tween® 80 was used as the release medium, to mimic the action of the drug laden SLNs in blood, whether the delivery route be oral, nasal or topical. The dialysis bag (molecular weight cut off: 12–14 kDa, Livingstone, Australia) was soaked in deionized water for 12 h prior to use. A 5 mL aliquot of SLN dispersion was sealed in the dialysis bag and immersed in 50 mL of preheated release medium (37 ± 0.5 °C) in amber bottles. The bottles were placed in a thermostatic shaker (100 strokes per minute) at body temperature (37 ± 0.5 °C) and covered to prevent water evaporation. An aliquot of 1 mL of release medium was withdrawn at pre-determined time points and replaced immediately with the same volume of fresh medium to maintain the sink conditions. The concentration of drug in the aliquot was quantified by HPLC analysis (see Section 2.4). Cumulative drug released was calculated and expressed as a percentage of the theoretical maximum drug content.A comparison of drug release profiles is often performed to evaluate changes in the release profiles of a newly developed product when compared to the release profiles of a previously approved product. Several approaches (including statistical, model-dependent and model-independent approaches) have been proposed for comparison of drug release profiles.17 In this study, drug release profile comparison was carried out by model-independent approaches (determination of similarity and difference factors, determination of Rescigno indices and the bootstrap f2 method).18–20
The drug release profiles were compared to achieve a preliminary indication of the SLN structure (with respect to drug localization). The structure of nanomaterials often dictates the drug release behavior. It must, however, be acknowledged that these methods are generally used for comparison of two products – an approved product and a “changed” product. Therefore, the results here can only be used as an indicator of similar drug release profile, and hence similar SLN structure, but not proof of that structure.
2.4 High performance liquid chromatography (HPLC) analysis
HPLC analysis was performed using a LC-20AT Prominence LC double reciprocating plunger pump (Shimadzu, Japan). The UV-Vis detector was a SPD-M20A Photodiode Array Detector (Shimadzu, Japan). A reversed-phase Prevail™ C18 column (250 × 4.6 mm, 5 μm; Alltech, USA) was used at 30 °C. The mobile phase consisted of a 9![[thin space (1/6-em)]](https://www.rsc.org/images/entities/char_2009.gif) :1 mixture of methanol and sodium phosphate solution (50 mM, adjusted to pH 2.5). The detection wavelength was set at 318 nm and 230 nm for indomethacin and miconazole nitrate, respectively. The flow rate was set to 0.75 mL min−1 for isocratic elution, and the injection volume was 5 μL for all standards and samples.
:1 mixture of methanol and sodium phosphate solution (50 mM, adjusted to pH 2.5). The detection wavelength was set at 318 nm and 230 nm for indomethacin and miconazole nitrate, respectively. The flow rate was set to 0.75 mL min−1 for isocratic elution, and the injection volume was 5 μL for all standards and samples.
2.5 Multi-angle dynamic light scattering (multi-angle DLS/SLS)
DLS and SLS were conducted on an ALV-5022F light scattering spectrometer with samples in cylindrical cuvettes of 8 mm path length and sample concentrations of approximately 40 μg mL−1. For multi-angle DLS, measurements were carried out over the range 80–150° in 5° increments. Each measurement was 30 s, with 3 repeats at each angle. Measurements with intensity spikes due to dust were rejected. The average radius from the 3 measurements was calculated at each angle, and then the average and standard deviation over at least 10 angles was calculated.For SLS, scattered intensities were measured as a function of angle from 20–150° in 5° increments. The average intensity was plotted as a function of scattering angle, and fitted using Rayleigh-Gans-Debye scattering theory.21
The scattering intensity, P(q) for a homogeneous sphere of radius R can be written as,

n is the refractive index of the solvent, λ is the wavelength and θ is the scattering angle.
The scattering factor, P(q), for core–shell spheres with a shell of thickness t can be expressed:


To take into account polydispersity, fits are carried out for Gaussian, Schultz and log-normal distributions of particle sizes, characterized by a mean radius R, and a polydispersity σ. The analysis was carried out using an in-house program written in MATLAB as described previously.22,23
2.6 Small angle X-ray scattering (SAXS)
SAXS measurements were performed on a Bruker MicroCalix SAXS/WAXS system (on samples in vacuum sealed quartz capillaries) using a microfocus Cu Kα X-ray source operating at 50 W with a wavelength of 1.54 Å. Scattered light was detected using a Pilatus 100 k detector. Scattering and transmission measurements were performed with 2 h and 5 s exposure time, respectively. Absolute intensities were calculating by transmission. Data analysis (normalization, primary beam masking, and background subtraction) was carried out in Fit-2D. No smoothing was used, and the fit results were not significantly affected by normalization.3. Results and discussion
Stearic acid, a fatty acid, is the main component of the SLNs prepared in this study. The second important component is Tween® 20 which is a non-ionic surfactant used to stabilize the SLNs in the aqueous dispersion medium. The third important component (in case of the drug-loaded SLNs) is indomethacin or miconazole nitrate, both of which are lipophilic model drugs selected for this study.3.1 Preliminary characterization
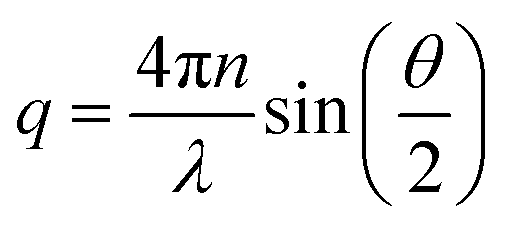
The particle size and zeta potential of SLNs were measured to determine the production of nano-sized (submicron) particles and their stability. The results are summarized in Table 1. The results indicate that the SLNs produced in this study were within the submicron range and possess moderate zeta potentials. While SEM is rarely used for measuring the size of SLNs, the SEM images in Fig. 1 clearly demonstrate that the SLNs reported in this thesis are well within the submicron (or nanometre) size range. The SLNs may not always but look largely spherical as determined by SEM, with different morphologies (oval-shaped, spherical, and/or irregular) being observed. However, these shapes may not reflect the actual particle shapes of the SLNs in solution, as the sample preparation requires removal of the solvent, which will necessarily distort these self-assembled particles.1 Nevertheless the images in Fig. 1 do indicate that particles are relatively spherical, albeit distorted, and are in the expected particle size range.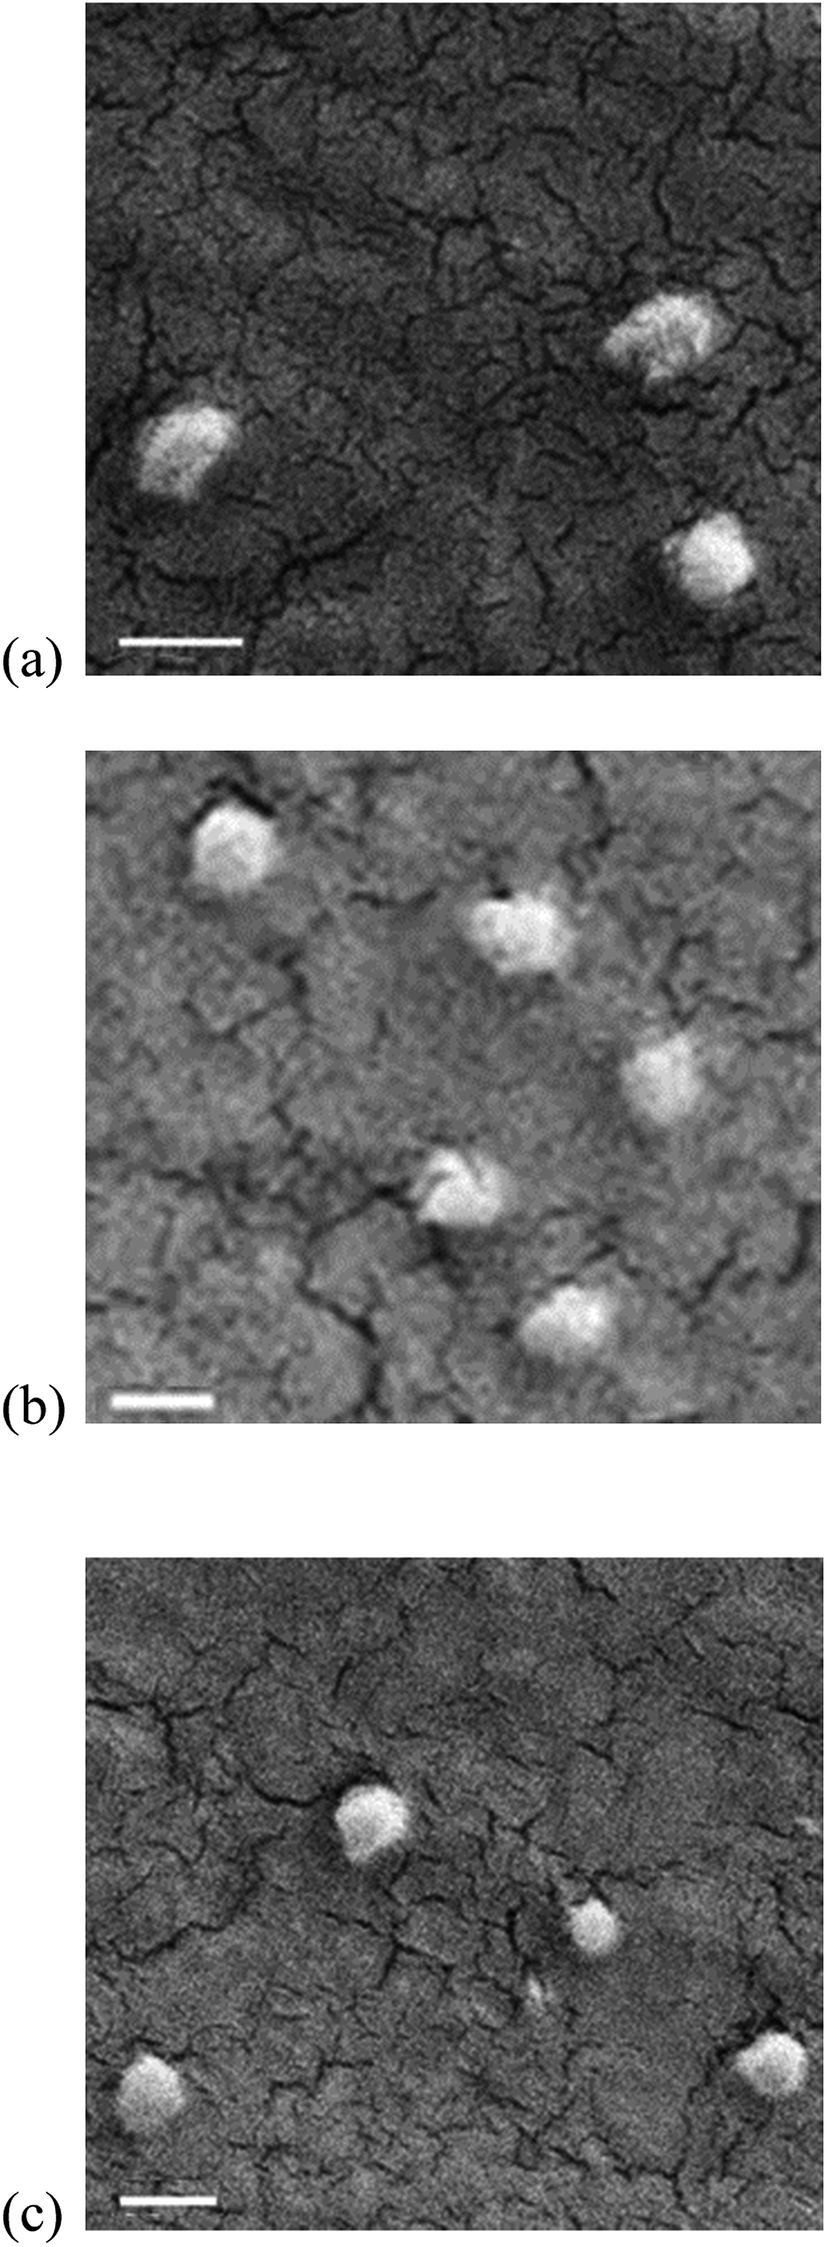 | ||
| Fig. 1 SEM images of (a) drug-free SLNs, (b) indomethacin-loaded SLNs and (c) miconazole nitrate-loaded SLNs viewed at 60000× magnification. The scale bar represents 200 nm. | ||
There was a significant (p < 0.05) increase in the particle size of drug-loaded SLNs. The negative zeta potential of the SLNs and indomethacin-loaded SLNs has been attributed to the dissociation of stearic acid and/or functional groups on the surface of the SLNs. Similar attribution of charge has been previously reported.24 Ionisation of indomethacin (which is an acidic drug) on the particle surface may also contribute to this charge. The positive zeta potential of miconazole nitrate-loaded SLNs is probably due to the exposure of cationic nitrogen atoms present in the structure of miconazole nitrate (which is an ionic drug) and must negate any intrinsic negative charge from the stearic acid. The magnitude of the zeta potential in all cases is sufficiently high to provide good physical stability of systems stabilized by non-ionic surfactants such as the one in this study.25
The crystallinity of the SLNs was investigated by DSC analysis. The DSC data of SLNs are summarized in Table 2 whilst the XRD patterns of the SLNs and stearic acid are shown in Fig. 2.
| SLNs | Tonset (°C) | Tmax (°C) | ΔH (J g−1) | RI (%) | EE (%) |
|---|---|---|---|---|---|
| a RI: recrystallization index, EE: encapsulation efficiency, NA: not applicable. | |||||
| Stearic acid | 66.9 | 71.5 | 173.0 | 100 | NA |
| Drug-free SLNs | 54.5 | 64.4 | 59.6 | 91 | NA |
| Indomethacin-loaded SLNs | 55.0 | 64.1 | 53.4 | 83 | 82.6 ± 3.8 |
| Miconazole nitrate-loaded SLNs | 62.1 | 63.3 | 52.2 | 80 | 86.6 ± 0.7 |
 | ||
| Fig. 2 X-ray diffraction patterns of SLNs. | ||
The presence of a melting endotherm (i.e. Tmax) indicates the solid nature of SLNs.26 Although the onset of melting (i.e. Tonset) remains above body temperature (i.e. >37 °C), the melting transition was reduced compared to bulk stearic acid. This may be due the presence of surfactant molecules on the surface or due to the Gibbs–Thomson “small-size” effect.27 The high surface energy associated with the small size of LNs increases the energy cost of the crystalline state, and thus decreases the melting point of stearic acid in SLNs. The reduction of melting enthalpy (ΔH) and RI is attributed to the reduced crystallinity of stearic acid in SLNs compared to their bulk counterparts.28 The crystallinity was further reduced in drug-loaded SLNs which can be attributed to the entrapment of drug molecules within the lipid imperfections.
The reduction in crystallinity of stearic acid was also evaluated by XRD analysis. The results in Fig. 2 indicate that the characteristic peaks present in the XRD pattern of bulk stearic acid (i.e. one sharp peak at 2θ = 21.7°, three medium-intensity peaks at 2θ = 6.7°, 20.6° and 24.3° and two low intensity peaks at 11.1° and 36.4°) were either reduced or absent in the XRD of SLNs, which is indicative of reduced crystallinity in SLNs29 and aligns well with the DSC data (Table 2).
3.2 Drug release studies
The in vitro release profiles of drugs obtained by the dialysis bag technique using phosphate buffered saline (pH 7.4) containing 1% Tween® 80 are shown in Fig. 3. The results indicate that two types of drug release profiles were observed for SLNs prepared in this study: | ||
| Fig. 3 Drug release studies of drug-loaded SLNs. | ||
• An initial burst release (∼75% in first 4 h) followed by a sustained release of drugs (∼15% in next 20 h) – in the case of indomethacin-loaded SLNs.
• A slow, sustained (∼15% in first 4 h) but incomplete release of drugs (∼50% in total after 24 h) – in case of miconazole nitrate-loaded SLNs.
The difference in the release pattern is evident in Fig. 3 which is an overlay of release profiles of indomethacin and miconazole nitrate. This may be due to the difference in physicochemical properties of the drugs: indomethacin is weakly acidic (due to the presence of carboxylic acid functional groups) and has a low partition coefficient in octanol–water systems, with logP = 3.4;30 miconazole nitrate is basic (due to the presence of imidazole ring) and has a high partition coefficient in octanol–water system, with logP = 6.3.31 These values suggest that miconazole nitrate has higher lipophilicity (and therefore, solubility in the lipid phase) than indomethacin. Thus, one interpretation of the release data is that indomethacin (low partition coefficient) is present predominantly in the shell (i.e. drug-enriched shell model) and released quickly. On the other hand, miconazole nitrate (high partition coefficient) should be solubilized in the molten lipid and crystallize within the lipid core (i.e. drug-enriched core model), thus providing a slower release. These findings support the hypothesis that indomethacin is primarily present in the shell and its release is diffusion-controlled.32 In contrast, the release of miconazole nitrate, which is predominantly present in the lipid core, is controlled by dissolution and diffusion.32
The drug release profiles from both the drug-loaded SLNs were compared by data modelling. Table 3 summarizes the results obtained after profile comparison by model-independent approaches. The indomethacin release data was considered to be the “reference” and miconazole nitrate data was considered to be the “test” formulations. The comparison was done by determination of similarity and difference factors, Rescigno indices and the Bootstrap f2 method. Such methods of profile comparison are often used to compare a “changed” form to an already “approved” product and rarely used to compare release profiles of different drugs from similar drug carriers, as in this study. Hence, the difference should be seen as a proof-of-concept and not as an absolute difference.
| Parameter | Value | Accept or reject |
|---|---|---|
| Difference factor (f1) | 68.94 | Reject |
| Similarity factor (f2) | 16.71 | |
| Rescigno index (ξ1) | 0.4451 | Reject |
| Rescigno index (ξ2) | 0.4314 | |
| Bootstrap f2 | 16.706 (16.156–17.308) | Reject |
The difference factor f1 is a measure of the relative error between two release profiles, while the similarity factor f2 is a measure of the similarity in the percent of drug release between two release profiles. For the profiles to be considered “similar”, f1 should be less than 15 (i.e. f1 ∈ [0, 15]) and f2 should be greater than 50 (i.e. f2 ∈ [50, 100]) according to current FDA guidelines for comparison of “changed” and “approved” products.33 The results in Table 3 show that none of these criteria are met which is an indication that the release profiles of indomethacin and miconazole nitrate from SLNs are dissimilar.
The results from difference and similarity factors were consistent with the results obtained by another pairwise procedure of profile comparison: determination of Rescigno indices. The Rescigno index takes on values from zero (indicating no difference between the reference and test formulations) to one (indicating complete release from one formulation before the other begins to release the drug). The results in Table 3 indicate that the profiles were not similar (since the Rescigno indices were ∼0.4 > 0).
The bootstrap f2 method was also used to compare the release profiles. The release profiles are similar, at a 0.05 significance level, if the 90% lower confidence limit of f2 is greater than 50. The results in Table 3 indicate that the 90% lower confidence limit (i.e. 16.156) is less than 50 and, therefore, the release profiles are dissimilar.
All these findings suggest that the release profiles of indomethacin and miconazole nitrate are dissimilar, and therefore the drug encapsulated SLNs may have distinctively different structures. As discussed earlier, however, it is not proof of different nanostructures. In the case of these two drugs, it is quite possible that the different release profiles are due to the different charges on the drugs, with the positively charged miconazole nitrate drug finding it more difficult to leave the SLN than the negatively charged indomethacin drug.
3.3 Multi-angle DLS analysis
Multi-angle DLS was performed on the SLN samples. Multi-angle measurements allow a more robust determination of size for polydispersed systems.34,35 The DLS results are shown in Table 1.The results in Table 1 are in broad agreement with the PCS measurements, but are slightly larger in all cases compared to the single angle measurements (PCS measurements are essentially single-angle DLS measurements). This is presumably due to slight polydispersity in particle size, which gives a different intensity weighting for each particle, meaning that measurements at a single angle can be different to an average over multiple angles. In other words, the measured particle size depends on the measuring technique. Both sets of results, however, show that the drug-free SLNs are considerably smaller than the indomethacin- and miconazole nitrate-loaded SLNs.
3.4 Determination of core–shell structure
SLS curves (intensity vs. scattering angle) are relatively low in information content for very polydisperse systems. However, they do allow for robust differentiation between homogeneous spheres and core–shell spheres, due to the different shapes of the scattering curves. Given the accurate values of average radius from the DLS results, these will be used as inputs in the SLS analysis. By fixing the outer radius, and allowing the polydispersity and shell thickness to be free parameters, we can determine the shell thickness. It was found that log-normal particle size distributions (PSD) provided the best fits to the SLS data. Fig. 4 shows SLS data with the best fits shown as solid lines. | ||
| Fig. 4 SLS data fitted to log normal PSD. (a) Drug-free SLNs, (b) indomethacin-loaded SLNs (I SLNs) and (c) miconazole nitrate-loaded SLNs (M SLNs). | ||
In all cases the best fit points to particles with a polydispersity of 60% (meaning, for example, that for drug-free SLNs the size of individual particles can vary from as little as 55 nm to as high as 215 nm). However, despite this, the shell thickness has a well-defined value of 13 ± 1 nm across the full range of particle sizes, i.e. it is the same for each individual particle. These results are in agreement with the drug release studies which indicate a core–shell type of structure of the SLNs. It was, however, very interesting that the shell thickness was independent of the drug, given that the release profiles of the two drugs were significantly different. This suggests that the different release profiles were not associated with different nano-structures but more likely due to intrinsic differences in kinetics of dissolution (possibly a result of the different charges).
Trying to fit the data using uniform spheres did not yield a good fit, regardless of polydispersity, for any of the samples. To illustrate this point, the dashed line in Fig. 4a shows the best fit for a homogeneous sphere of the same radius. These findings suggest that the SLNs present in this study are likely to be core–shell type structures.
3.5 SAXS analysis
The SAXS investigations of all three SLNs showed the same sharp peak, with a maximum at Q = 0.153 Å−1 (Fig. 5). These results suggest that the long spacing of the stearic acid lamellar structure was 41.0 ± 0.1 Å (i.e. 4.1 nm, using Bragg's equation). The lipid lamellar structure of stearic acid-based SLNs is consistent with a similar study reported by de Souza et al.36 The length of one stearic acid molecule is 23.2 Å (i.e. 2.32 nm),37 so a bilayer would have a reflection at a minimum separation of 46.4 Å (i.e. 4.64 nm). The fact that the measured crystallinity is smaller than this indicates that the stearic acid chain is aligned at an angle to the planar axis rather than perpendicular. These results are consistent with other studies reported previously for the C-form of stearic acid.38,39 The data in Fig. 5 are evidence of a low intensity third order peak (0.46 Å), which is almost at the limit of detection. The fact that the peak is in the same position for all three samples indicates that the lipid ordering is independent of drug loading. | ||
| Fig. 5 SAXS patterns of drug-free SLNs, indomethacin-loaded SLNs and miconazole nitrate-loaded SLNs. | ||
Crystallization from the melt and vapor phases produces the C-form of stearic acid, whereas A-, B- and C-forms all crystallize from solutions.40 Aquilano et al. reported the C-form of stearic acid after crystallization of molten stearic acid into lipospheres.41 The microwave-assisted technique of SLN production used in this study is based on similar principles of using microemulsion templates to produce lipospheres. The SAXS analysis indicated that stearic acid in the SLNs crystallized in the C-form. These results align well with the studies of Sato and Boistelle and Aquilano et al.40,41 Being the most stable polymorphic form, further transitions to other forms are less likely and, therefore, drug leakage from the SLNs during storage is less likely to occur.
4. Conclusions and future perspectives
The current study was aimed at establishing a preliminary structure of the SLNs prepared by our recently reported microwave-assisted microemulsion technique. The findings from SLS, DLS and SAXS suggest that the microwave-produced SLNs have a core–shell structure and possibly lamellar arrangement. However, it is not possible to conclude the exact location of the drug using SAXS alone. Contrast variation SANS along with synchrotron-based SAXS may provide opportunities to locate the drug within the SLNs to further understand the drug release behavior and stability of SLNs and, therefore, will be pursued in future work. Such experiments may help to explain the observation that drug release profiles were dissimilar even though the shell thickness and internal lamellar spacing were essentially the same.Acknowledgements
The authors are grateful to the Department of State Development, Business and Innovation (State Government of Victoria) for providing a Victoria India Doctoral Scholarship and the Australia India Institute for managing that scholarship.References
- R. Shah, D. Eldridge, E. Palombo and I. Harding, Lipid Nanoparticles: Production, Characterization and Stability, Springer, London, UK, 2015 Search PubMed.
- M. R. Gasco, Method for producing solid lipid microspheres having a narrow size distribution, US Pat., US5250236, 1993.
- R. H. Müller and J. S. Lucks, Arzneistoffträger aus festen lipidteilchen, feste lipidnanosphären (SLN), European Patent, EP0605497A1, 1996.
- R. Shah, F. Malherbe, D. Eldridge, E. Palombo and I. Harding, J. Colloid Interface Sci., 2014, 428, 286–294 CrossRef CAS PubMed.
- R. Müller, K. Mäder and S. Gohla, Eur. J. Pharm. Biopharm., 2000, 50, 161–177 CrossRef.
- R. M. Shah, D. Rajasekaran, M. Ludford-Menting, D. S. Eldridge, E. A. Palombo and I. H. Harding, Colloids Surf., B, 2016, 140, 204–212 CrossRef CAS PubMed.
- A. Seyfoddin and R. Al-Kassas, Drug Dev. Ind. Pharm., 2013, 39, 508–519 CrossRef CAS PubMed.
- Y.-C. Kuo and J.-F. Chung, Colloids Surf., B, 2011, 83, 299–306 CrossRef CAS PubMed.
- A. R. Neves, M. Lúcio, S. Martins, J. L. C. Lima and S. Reis, Int. J. Nanomed., 2013, 8, 177–187 CrossRef PubMed.
- S. Singh, A. K. Dobhal, A. Jain, J. K. Pandit and S. Chakraborty, Chem. Pharm. Bull., 2010, 58, 650–655 CrossRef CAS PubMed.
- R. M. Elmoslemany, O. Y. Abdallah, L. K. El-Khordagui and N. M. Khalafallah, AAPS PharmSciTech, 2012, 13, 723–731 CrossRef CAS PubMed.
- R. A. Graves, D. Poole, R. Moiseyev, L. A. Bostanian and T. K. Mandal, Drug Dev. Ind. Pharm., 2008, 34, 419–426 CrossRef CAS PubMed.
- K. Ofokansi, F. Kenechukwu, L. Charles and A. Attama, J. Pharm. Allied Sci., 2012, 9, 1458–1471 Search PubMed.
- P. Srinath, S. Vyas and P. V. Diwan, Drug Dev. Ind. Pharm., 2000, 26, 313–321 CrossRef CAS PubMed.
- M. Kosmulski, 2002, http://www.sourceforge.net.
- M. J. Gomes, S. Martins, D. Ferreira, M. A. Segundo and S. Reis, Int. J. Nanomed., 2014, 9, 1231–1242 CAS.
- Y. Zhang, M. Huo, J. Zhou, A. Zou, W. Li, C. Yao and S. Xie, AAPS J., 2010, 12, 263–271 CrossRef CAS PubMed.
- J. W. Moore and H. H. Flanner, Pharm. Technol., 1996, 20, 64–74 Search PubMed.
- A. Rescigno, Pharm. Res., 1992, 9, 925–928 CrossRef CAS.
- M. Vertzoni, M. Symillides, A. Iliadis, E. Nicolaides and C. Reppas, Eur. J. Pharm. Biopharm., 2003, 56, 421–428 CrossRef CAS PubMed.
- J. Pencer and F. R. Hallett, Langmuir, 2003, 19, 7488–7497 CrossRef CAS.
- G. Bryant, S. Martin, A. Budi and W. van Megen, Langmuir, 2003, 19, 616–621 CrossRef CAS.
- H. Schöpe, O. Marnette, W. Van Megen and G. Bryant, Langmuir, 2007, 23, 11534–11539 CrossRef PubMed.
- M. Alex, A. Chacko, S. Jose and E. Souto, Eur. J. Pharm. Sci., 2011, 42, 11–18 CrossRef PubMed.
- K. Mitri, R. Shegokar, S. Gohla, C. Anselmi and R. Müller, Int. J. Pharm., 2011, 414, 267–275 CrossRef CAS PubMed.
- A. Noack, G. Hause and K. Mäder, Int. J. Pharm., 2012, 423, 440–451 CrossRef CAS PubMed.
- A. B. Kovačević, R. H. Müller, S. D. Savić, G. M. Vuleta and C. M. Keck, Colloids Surf., A, 2014, 444, 15–25 CrossRef.
- S. Anantachaisilp, S. Smith, A. Treetong, S. Pratontep, S. Puttipipatkhachorn and U. Ruktanonchai, Nanotechnology, 2010, 21, 125102 CrossRef PubMed.
- K. Vivek, H. Reddy and R. Murthy, AAPS PharmSciTech, 2007, 8, 16–24 CrossRef PubMed.
- A. Sprunk, S. Page and P. Kleinebudde, Int. J. Pharm., 2013, 455, 189–196 CrossRef CAS PubMed.
- M. R. Bhalekar, V. Pokharkar, A. Madgulkar, N. Patil and N. Patil, AAPS PharmSciTech, 2009, 10, 289–296 CrossRef CAS PubMed.
- R. M. Shah, Microwave-assisted Production of Solid Lipid Nanoparticles, PhD Thesis, Swinburne University of Technology, 2016 Search PubMed.
- FDA, Guidance for Industry: Dissolution Testing of Immediate Release Solid Oral Dosage Forms, 1997 Search PubMed.
- G. Bryant, C. Abeynayake and J. C. Thomas, Langmuir, 1996, 12, 6224–6228 CrossRef CAS.
- M. Naiim, A. Boualem, C. Ferre, M. Jabloun, A. Jalocha and P. Ravier, Soft Matter, 2015, 11, 28–32 RSC.
- A. de Souza, T. Andreani, F. Nunes, D. Cassimiro, A. de Almeida, C. Ribeiro, V. Sarmento, M. Gremião, A. Silva and E. Souto, J. Therm. Anal. Calorim., 2012, 108, 353–360 CrossRef.
- T. Maruyama, M. Nakajima, S. Ichikawa, Y. Sano, H. Nabetani, S. Furusaki and M. Seki, Biosci., Biotechnol., Biochem., 2001, 65, 1003–1006 CrossRef CAS PubMed.
- S. Zhu, M. Heppenstall-Butler, M. Butler, P. Pudney, D. Ferdinando and K. Mutch, J. Phys. Chem. A, 2005, 109, 11753–11761 CrossRef CAS PubMed.
- B. Maiti and P. De, RSC Adv., 2013, 3, 24983–24990 RSC.
- K. Sato and R. Boistelle, J. Colloid Interface Sci., 1983, 94, 593–596 CrossRef CAS.
- D. Aquilano, R. Cavalli and M. R. Gasco, Thermochim. Acta, 1993, 230, 29–37 CrossRef CAS.
| This journal is © The Royal Society of Chemistry 2016 |