Tailoring of spectral response and intramolecular charge transfer in β-enaminones through band gap tuning: synthesis, spectroscopy and quantum chemical studies

Ramprasad Misra a, Pushkin Chakrabortyb, Subhas C. Royb, D. K. Maitycd and S. P. Bhattacharyya*e
aDepartment of Physical Chemistry, Indian Association for the Cultivation of Science, Jadavpur, Kolkata 700032, India
bDepartment of Organic Chemistry, Indian Association for the Cultivation of Science, Jadavpur, Kolkata 700032, India
cTheoretical Chemistry Section, Chemistry Group, Bhabha Atomic Research Centre, Mumbai 400085, India
dHomi Bhabha National Institute, Training School Complex, Anushaktinagar, Mumbai 400094, India
eDepartment of Chemistry, Indian Institute of Technology Bombay, Mumbai 400076, India. E-mail: pcspb@iacs.res.in; Fax: +91 3324732805

Received 6th January 2016 , Accepted 4th April 2016

First published on 6th April 2016


Abstract

In this paper, we investigate the synthetic tailoring of the spectral response and intramolecular charge transfer (ICT) of β-enaminones through bandgap modulation. Two donor/acceptor substituted β-enaminones, namely, 3-(4-methoxyphenylamino)-2-cyclohexen-1-one (OACO) and 3-(4-nitrophenylamino)-2-cyclohexen-1-one (NACO) have been synthesized along with their unsubstituted counterpart, 3-(phenylamino)-2-cyclohexen-1-one (PACO). Steady state as well as time resolved spectroscopic techniques with picosecond resolution are used to record their spectral responses. Substitution of the donor group (–OCH3) mildly enhances the charge transfer from the phenyl ring to the enaminone moiety, while substitution of the acceptor group (–NO2) jeopardizes the charge transfer through mutual electron withdrawing effects of PNA and enaminone moieties. Combined experimental and quantum chemical investigations reveal that the ground state photophysics of OACO and NACO in water are controlled by both microscopic and macroscopic solvation with dominant contribution from the former. Time dependent density functional theory (TDDFT) calculations predict that the HOMO to [LUMO+1] transition gives rise to the absorption spectra of OACO in water, while the absorption by the enaminone moiety of NACO arises as a result of a HOMO to LUMO transition. A crossing between the first (S1) and the second excited (S2) states takes place in the microclusters of PACO, OACO and NACO with water. The intersystem crossing (ISC) has been found to be the major reason for low quantum yields in these molecules. The band gap modulation through waxing and waning of the conjugation strength is expected to throw light on many ICT-driven processes and provides means of tuning the properties depending on it.

1. Introduction

Studies of intramolecular charge transfer (ICT) in organic molecules containing conjugated donor/acceptor units have gained importance due to their possible applications in science and technology, including, solar energy harvesting, organic catalysis, molecular electronics and organic photovoltaics,1–3 etc. The study of the ICT process provides us with precious information about the mechanism of many chemical and biological processes involving long-range charge separation, like, photosynthesis and metabolism.4,5 For these reasons, the search for new charge transfer based organic molecules and attempts at deciphering the charge transfer mechanism continue to be areas of intense research.6–23 A number of contributions reporting experimental findings and theoretical calculations on ICT molecules, and more recently, experimental work coupled with quantum chemical calculations have been reported.17–19 Excited state ICT often occurs through a π-electron bridge. The strength of charge transfer in such systems can be modulated by changing the donor/acceptor strengths and such modulation can lead to tailoring of the band gap as well.23 A judicious choice of donor/acceptor units in a molecule could facilitate simultaneous manipulation of the highest occupied molecular orbital (HOMO) and lowest unoccupied molecular orbital (LUMO) energies, opening up the possibility of tailoring the band gap and hence the properties shaped by the band gap, for example, the colour of the probe.22 This band gap tailoring technique has been used by many research groups,21–24 for example, for designing efficient polymers23 and developing organic semiconductor materials.24

In a recent contribution,25 we have experimentally shown that 3-(phenylamino)-2-cyclohexen-1-one (PACO) is an interesting ICT probe with dual fluorescence in polar solvents, due to emissions from a locally excited (LE) state and an intramolecular charge transfer (ICT) species with large dipole moment, formed in the excited state. The mechanism of excited state charge transfer in the molecule has been investigated through steady state and time-resolved spectroscopic techniques. Time dependent density functional theory (TDDFT) and configuration interaction calculations at the AM1/CI (SD) level of approximation turn out to be supportive of the proposed mechanism of ICT in this molecule. Molecules possessing donor–acceptor unit connected through a π-electron bridge have been widely studied as building blocks of molecule-based electro-optic materials which have immense potential for scientific and technological applications in optical telecommunication, signal processing, image reconstruction, data storage, optical computing, etc.26–29 Making use of the time dependent Hartree Fock (TDHF) method and second order Möller–Plesset perturbation (MP2) theory with Sadlej basis set, we have shown that molecules of β-enaminone family can be chromophores for effective non-linear optical (NLO) materials.30 The substitution of an electron donor group (–OCH3) in conjugation with the enaminone moiety was shown to enhance the NLO response while substitution of an electron accepting group (–CN) suppressed the response considerably. A complete understanding of the mechanism of intramolecular charge transfer in these molecules continues to remain important in this context. The molecules under investigation (Scheme 1), viz., PACO, OACO and NACO belong to β-enaminones, a molecular family well-known for its role as precursors31,32 in organic synthesis but little seems to have been known about their photo-physical properties until recently.


image file: c6ra00376a-s1.tif
Scheme 1 The structures of the probe molecules, hydrogen bonded with three water molecules. The acronyms of the molecule with the change in X is as follows: X = H, PACO; X = OCH3, OACO and X = NO2, NACO. Numbering of some heavy atoms is done for reference. The atoms of water molecules that form hydrogen bond with the probe are marked with (a–c).

The problem posed in this paper concerns the effects of substitution of an electron donor or acceptor at the para-position of the PACO on the spectral signatures of the ICT process. The layout of the paper is as follows. In the Section 2a, the syntheses and proton (1H) and carbon (13C) NMR, infra-red (IR) and high resolution mass spectroscopic (HRMS) characterization of the three probes have been described. The experimental methodologies and theoretical strategies adopted in this work have been described in Section 2b–d. The recorded absorption spectra in different solvents in room temperature are presented in Section 3a. The Section 3b deals with the electronic structure calculations of these molecules along with theoretical simulation of the absorption spectra. In Section 3c, we present the experimentally recorded emission spectra of these molecules in different solvents at room temperature. In the Section 3d, low temperature (77 K) fluorescence and phosphorescence spectra are presented. In Section 3e, an analysis of the results obtained from time dependent spectral studies are made and some inferences are drawn about the ICT process in these molecules. The findings of these investigations have been summarized in Section 4.

2. Materials and methods

2a. Synthesis of the probe molecules

The probe molecules used for our experimental studies, viz., PACO, OACO and NACO have been synthesized using the procedure we developed earlier.33 In brief, an equimolar mixture of 1,3-cyclohexane-di-one and aniline (or its p-substituted analogues) was used as the starting material. The reaction was performed under inert (nitrogen) atmosphere at room temperature in acetonitrile in the presence of a catalytic amount (20 mol%) of cerium(IV) ammonium nitrate. The reaction was completed in a few minutes with excellent yield. The crude products obtained were washed with doubly distilled water, followed by brine and dried over MgSO4. Column chromatographic purification was done over silica gel (120 mesh) using 50% ethyl acetate–petroleum ether solution. The purity of these compounds has been checked for spectroscopic studies. The structures of the molecules were confirmed through 1H and 13C NMR, IR and HRMS spectroscopic characterizations. The spectral characterization data of the probe molecules under investigation are as follows:
PACO. 1H NMR (300 MHz, CDCl3, in ppm): δ 7.26–7.04 (m, 5H), 5.49 (S, 1H), 2.41 (t, 2H, J = 6.10 Hz), 2.27 (t, 2H, J = 6.4 Hz), 1.99–1.90 (m, 2H); 13C NMR (75 MHz, CDCl3, in ppm): δ 21.9, 29.7, 36.6, 99.5, 124.0, 125.5, 129.3, 138.2, 162.8, 198.495 and IR (KBr, in cm−1): 3263, 2943, 1602, 1570, 1527, 1492, 1425, 1244.

HRMS calculated for C12H14NO+: 188.1070, found 188.1070.

OACO. 1H NMR (300 MHz, CDCl3, in ppm): δ 7.06 (d, 2H, J = 8.8 Hz), 6.84 (d, 2H, J = 8.8 Hz), 5.37 (S, 1H), 3.78 (s, 1H), 2.47 (t, 2H, J = 6.1 Hz), 2.32 (t, 2H, J = 6.4 Hz), 2.04–19.4 (m, 2H); 13C NMR (75 MHz, CDCl3, in ppm): δ 195.5, 165.5, 155.8, 128.7, 124.1, 112.5, 95.4, 53.6, 33.4, 27.2, 19.8.

IR (KBr, in cm−1): 3215, 2941, 1610, 1570, 1508, 1240, 1180, 1033.

HRMS: calculated for C13H16NO2+: 218.1176, found: 218.1176.

NACO. 1H NMR (300 MHz, CDCl3, in ppm): δ 8.17 (d, 2H, J = 9.0 Hz), 7.26 (d, 2H, J = 9.0 Hz), 5.83 (s, 1H), 2.55 (t, 2H, J = 6.0 Hz), 2.40 (t, 2H, J = 6.4 Hz), 2.10–2.02 (m, 2H); 13C NMR (75 MHz, CDCl3, in ppm): 199.0, 159.6, 144.9, 143.4, 143.4, 125.4, 121.3, 103.4, 36.6, 30.0, 21.7; IR (KBr, in cm−1): 3282, 3111, 1606, 1541, 1492, 1325, 1176, 1139, 1109, 750.

HRMS: calculated for C12H13N2O3+: 233.0921, found 233.0923.

2b. Steady-state spectroscopic studies

The steady state electronic absorption and emission spectra of OACO and NACO were recorded in different solvents on a Shimadzu UV-VIS recording Spectrophotometer UV-2401 (PC) S220V and Fluoro Max 3 (Jobin Yvon Horiba) fluorimeter, respectively. The solvents were of spectroscopic grade and were purchased from commercial sources (Merck/Spectrochem). Some of the solvents were made scrupulously dry using standard procedures. Triply distilled water was used to prepare all aqueous solutions and was checked for residual fluorescence, if any, before use. The quantum yields in different solvents have been measured by following the standard procedure. To avoid the effect of concentration, very dilute solutions were taken for measuring quantum yield measurement of the probe. The low temperature (77 K) emission spectra of OACO and NACO in ethanol glass matrix were recorded on a HITACHI spectrophotometer model F4500. The low temperature environment was produced by using liquid nitrogen (N2) as the coolant. For this purpose a small quartz Dewar was used which was fitted to the aforesaid instrument. The phosphorescence of the molecule was recorded at 77 K using the same spectrometer, where a rotary chopper was used to collect the phosphorescence. Except for the low temperature (77 K) studies, all other spectral data were collected at an ambient temperature of 23 °C.

2c. Time resolved measurements

The time-resolved emission decays of OACO and NACO in different solvents have been recorded by using Time Correlated Single Photon Counting (TCSPC) technique using a HORIBA JOBIN YVON instrument. The samples were excited at 295 nm and 280 nm for OACO and NACO, respectively. Light emitting diodes (IBH Nanoled-07) were used as excitation sources. The detector used was a Hamamatsu MCP plate photomultiplier (R3809U). The single photon counting technique comprised of an Ortec 9327 discriminator (CFD, Tenelec TC 454) and Fluoro Hub Single Photon Counting controller. The data were collected with a DAQ card as a multichannel analyzer. The spectra obtained were analyzed by using the DAS6 Software at Data Station v2.3 through exponential fitting, yielding the corresponding lifetimes. The quality of the exponential fit was judged in terms of a Durbin–Watson (DW) parameter, weighted residuals, and reduced χ2 values.

2d. Quantum chemical calculations

The quantum chemical calculations have been performed using state of the art density functional theory (DFT). A hybrid Becke's three-parameter – Lee–Yang–Parr (B3LYP) functional has been used for optimization of the ground state molecular electronic structures of the probe molecules with aug-cc-pVDZ basis set. TDDFT calculations have been performed at the respective ground state geometries using CAM-B3LYP functional and aug-cc-pVDZ basis set to obtain the energies and oscillator strengths of first twenty vertical excitations in the molecules under investigation. The long-range corrected DFT functional (CAM-B3LYP) has been reported to be adequate to compute the properties of weakly interacting systems.34 The aforesaid calculations have been performed using a quantum chemistry software package, Gaussian09.35 The visualization of the optimized structures has been done by using Gausview05.36 The effect of macroscopic solvation of the probe molecules have been studied using self-consistent reaction field (SCRF) employing the solvation model density (SMD)37 model based approach. The polarizability (αav) and first hyperpolarizability (βtotal) are calculated from their individual components using the eqn (1) and (2), respectively38,39 within the framework of the finite field self consistent field method. Only the gas phase molecules and their microhydrates were studied.
 
image file: c6ra00376a-t1.tif(1)
 
image file: c6ra00376a-t2.tif(2)

3. Results and discussion

3a. Absorption spectra of PACO, OACO and NACO in different solvents

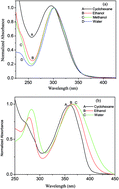
The absorption spectra of PACO, OACO and NACO have been recorded at room temperature in solvents of widely varying polarities (ε i.e. the dielectric constant, ranging from 2 to 80). The absorption spectra of OACO and NACO in different solvents are displayed in Fig. 1 and the recorded absorption maxima (λmax) are reported in Table 1 for ready reference. The absorption spectrum of OACO (Fig. 1a) in cyclohexane (ε = 2) shows a broad band with a maximum (λmax) at 295 nm, same as in the case of its unsubstituted analogue, PACO, for which a peak at 295 nm was observed in cyclohexane. The λmax values of OACO in ethanol (ε = 24.6), methanol (ε = 32.7) and water (ε = 80) are 301 nm, 301 nm and 302 nm, respectively. So, like PACO, the λmax values of OACO show a small red shift with increase in the dielectric constant of the medium, the relative change in λmax being small in media with higher dielectric constant. The red shift in λmax is somewhat smaller than what is observed for PACO for which of PACO, where a red shift of 12 nm is observed as the medium is changed from cyclohexane to water. From the similarity of the absorption profiles and absorption maxima of PACO and OACO in different solvents, we can conclude that the absorption by the enaminone moiety is dominantly responsible for the observed spectrum of OACO. We will discuss it in greater detail in Section 3b. In contrast with PACO and OACO, the nitro substituted analogue, NACO has two peaks in the recorded absorption spectra in different solvents at room temperature (Fig. 1b). In cyclohexane, a nonpolar solvent, the peaks appear at 272 nm and 359 nm. The 272 nm peak is reminiscent of a similar transition in PACO in cyclohexene and can be attributed to absorption by the enaminone moiety in NACO. It has been reported by Warman and co-workers40 that the p-nitro-aniline (PNA) shows an absorption maximum at 384 nm in a nonpolar solvent (benzene). Thus, the 359 nm peak in NACO can be assigned to the lower energy absorption by the PNA moiety. Both the shorter and longer wavelength peaks in NACO get somewhat blue shifted relative to that of PACO (272 nm compared to 295 nm) and p-nitro-aniline (359 nm compared to 384 nm), respectively, presumably due to the mutual electron withdrawing abilities of the enaminone and PNA moieties. Both the peaks get red shifted with increase in solvent polarity. The absorption maxima of NACO in ethanol for example, are 278 and 364 nm, which become 280 and 364 nm in methanol and 283 and 369 nm in water, respectively. The pattern of red shift indicates that excited states originating from the enaminone and PNA moieties are both progressively stabilized with increase in solvent polarity.
image file: c6ra00376a-f1.tif
Fig. 1 The recorded absorption spectra of (a) OACO and (b) NACO in cyclohexane, ethanol, methanol and water.
Table 1 The recorded absorption (λabs) and emission (λem) maxima (nm) of PACO, OACO and NACO in cyclohexane, ethanol, methanol and water. Solutions of PACO and OACO were excited at 290 nm. λem1 and λem2 represent the emission maxima of NACO corresponding to excitation wavelengths of 270 nm and 360 nm, respectively. The dielectric constant (ε) and hydrogen bond donor abilities (B) of the solvents have also been reported
Solvent ε B PACOa OACO NACO
λabs (nm) λem (nm) λabs (nm) λem (nm) λabs (nm) λem1 (nm) λem2 (nm)
a The values taken from ref. 25.
Cyclohexane 1.9 0 295 334 295 330, 430 272, 359 324, 470 378, 470
Ethanol 24.6 0.83 307 346, 431 301 342, 440 278, 364 325, 432 381, 453
Methanol 32.7 0.93 305 370, 440 301 346, 445 280, 364 307, 442 380, 444
Water 80.0 1.17 306 380, 455 302 355, 451 283, 369 330, 470 471


3b. Calculation of ground state geometry and simulation of absorption spectra of free OACO and NACO and their microhydrates

It has been well known that solvents play a major role in determining the structure and reactivity of an organic molecule.41–44 We have shown earlier that solvents play a major role in shaping the photophysical properties of PACO.25,45–48 To understand the role of solvents in shaping the absorption spectra of OACO and NACO, we have theoretically simulated their absorption spectra in water. The ground state geometries of PACO, OACO and NACO have been optimized fully in the gas phase. The microscopic solvations of OACO and NACO have been taken care of by studying the formation of molecular clusters of these molecules with water. It transpires that OACO forms a well defined 1[thin space (1/6-em)]:[thin space (1/6-em)]4 molecular cluster while NACO forms a 1[thin space (1/6-em)]:[thin space (1/6-em)]5 molecular cluster with water in the gas phase. PACO, however forms a 1[thin space (1/6-em)]:[thin space (1/6-em)]3 cluster with water.25 The macroscopic solvation of the free probes and their microhydrates has been studied using SCRF employing the SMD model. The minimum energy structures have been confirmed through vibrational analysis of the obtained structures at the same level of theory. The optimized structures are shown in Fig. 2(a and b) and S1–S3 in the ESI and the key geometrical parameters of the molecules are reported in Table 2. It can be seen that the ground state bond distances along the enaminone moiety, that is, along the charge transfer pathway, are modulated by the substitution of donor/acceptor groups. For example, the predicted C7–N8 bond distance is 1.375 Å and 1.386 Å, in OACO and NACO, respectively. The N8–C9 bond lengths are on the other hand 1.420 Å and 1.399 Å in OACO and NACO, respectively. The C4[double bond, length as m-dash]C7 bond predicted to be 1.368 Å and 1.363 Å in OACO and NACO, respectively. On the other hand, the C1[double bond, length as m-dash]O3 bond length, which is 1.231 Å in OACO, becomes 1.228 Å in NACO. The hydrogen bonding distances and angles of microhydrated PACO, OACO and NACO are reported in Table 3. The hydrogen bonding distances in the microhydrates become shorter in bulk water than in the gas phase, for all the three probe molecules, indicating a possible role of macrosolvation in reinforcing H-bonding in the microhydrates. Table 4 reports the predicted HOMO–LUMO gaps (band gap) in PACO, OACO and NACO and their gas phase microhydrates. The band gap is clearly attenuated both by substitution and microhydration. The computed polarizabilities (αav) and first hyperpolarizabilities (βtotal) of the probe molecules and their microhydrates are presented in Table 4, while their individual components are reported in Tables S1 and S2 of the ESI. The first hyperpolarizability (βtotal) of the free probe molecules increases as the HOMO–LUMO gap decreases from PACO → OACO → NACO. The values of βtotal of the gas phase microclusters of the probe molecules with water are uniformly higher than the corresponding free molecules. The high NLO response of the NACO is a bit surprising. It could be due to contributions from two competing charge transfer channels.
image file: c6ra00376a-f2.tif
Fig. 2 The ground state optimized structures of (a) OACO·4H2O and (b) NACO·5H2O in SCRF of water. The macroscopic solvation has been taken care of using Cramer and Truhler's SMD model.
Table 2 The distances (Å) of some of the atom pairs of PACO, OACO and NACO in the ground state as obtained using density functional theory calculation employing B3LYP functional and aug-cc-pVDZ basis set
System C1[double bond, length as m-dash]O3 C1–C4 C4[double bond, length as m-dash]C7 C7–N8 N8–C9 N8–H15
(i) OACO 1.231 1.456 1.368 1.375 1.420 1.010
(ii) OACO + SCRF 1.261 1.431 1.384 1.356 1.423 1.014
(iii) OACO·4H2O 1.251 1.437 1.377 1.362 1.419 1.016
(iv) OACO·4H2O + SCRF 1.272 1.418 1.391 1.347 1.425 1.025
(v) NACO 1.228 1.465 1.363 1.386 1.399 1.011
(vi) NACO + SCRF 1.253 1.442 1.374 1.373 1.396 1.015
(vii) NACO·5H2O 1.246 1.447 1.369 1.376 1.400 1.018
(viii) NACO·5H2O + SCRF 1.262 1.432 1.379 1.367 1.395 1.029
(ix) PACO 1.230 1.459 1.366 1.378 1.415 1.011
(x) PACO + SCRF 1.259 1.433 1.382 1.359 1.418 1.014
(xi) PACO·3H2O 1.251 1.382 1.376 1.364 1.418 1.016
(xii) PACO·3H2O + SCRF 1.270 1.420 1.389 1.351 1.421 1.025


Table 3 The computed hydrogen bonding distances (Å) and angles (in degrees) in PACO·3H2O, OACO·4H2O and NACO·5H2O molecular clusters in the gas phase and in SCRF of water, as calculated using DFT, employing B3LYP functional and aug-cc-pVDZ basis set
Media H15–Oa N8–H15–Oa O3–Hb C1[double bond, length as m-dash]O3–Hb O3–Hc C1[double bond, length as m-dash]O3–Hc
(i) PACO·3H2O
Gas phase 2.051 171.6 1.845 117.9 1.851 115.3
Water (SCRF) 1.965 174.5 1.766 121.5 1.771 120.9
[thin space (1/6-em)]
(ii) OACO·4H2O
Gas phase 2.045 172.6 1.843 117.7 1.846 115.1
Water (SCRF) 1.938 172.6 1.761 121.5 1.768 120.9
[thin space (1/6-em)]
(iii) NACO·5H2O
Gas phase 2.041 174.8 1.878 117.0 1.900 112.5
Water (SCRF) 1.908 178.1 1.791 121.2 1.793 121.8


Table 4 Predicted HOMO–LUMO gap (band gap), polarizability (αav) and first hyperpolarizability (βtotal) in PACO, OACO and NACO and their gas phase microhydrates
Molecule/cluster HOMO–LUMO gap (eV) αav (a.u.) βtotal (a.u.)
PACO 7.21 165.41 486.68
PACO·3H2O 4.50 200.35 762.44
OACO 7.08 185.97 1325.95
OACO·4H2O 6.57 232.62 1785.84
NACO 6.20 196.07 3007.01
NACO·5H2O 5.90 259.83 4611.30


Time dependent density functional theory (TDDFT) has been invoked to calculate the first twenty vertical transition energies and corresponding oscillator strengths. The computed quantities have been reported in Table 5. The molecular orbitals dominating the aforesaid transitions are reported in Table S3 in the ESI. The simulated absorption spectra of OACO and NACO in water are shown in Fig. 3. The computed energy and oscillator strength of S0 → S1 transition in free OACO are 300.8 nm and 0.0008, respectively. The calculated oscillator strength is much too smaller compared to that obtained experimentally (near about 0.5). We can safely assume therefore that this transition is not responsible for the recorded absorption spectrum of OACO. The S0 → S2 and S0 → S3 transitions are predicted to occur at 272.8 nm and 266.7 nm with oscillator strengths 0.2916 and 0.2252, respectively. The transitions to higher (S4, S5…) excited states have very low oscillator strengths. The picture becomes very different in OACO microhydrate. In OACO·4H2O, S0 → S1 and S0 → S2 transitions occur at 283.4 nm and 269.8 nm with the oscillator strengths of 0.5542 and 0.0166, respectively. We can infer therefore that a crossing between the first (S1) and the second excited (S2) states takes place in the OACO·4H2O microcluster. Macrohydration of the cluster affects the band profile further. The energy and oscillator strengths of S0 → S1 transition now becomes 278.5 nm and 0.5379, respectively, while the same for S0 → S2 transition is 271.3 nm and 0.0485, respectively for OACO·4H2O microcluster, macrosolvated (SCRF) in water.

Table 5 The vertical transition maxima (nm) and oscillator strengths of different transitions of PACO, OACO and NACO and their 1[thin space (1/6-em)]:[thin space (1/6-em)]3, 1[thin space (1/6-em)]:[thin space (1/6-em)]4 and 1[thin space (1/6-em)]:[thin space (1/6-em)]5 molecular clusters, respectively as predicted by Time Dependent Density Functional Theory (TDDFT) employing CAM-B3LYP functional and aug-cc-pVDZ basis set
Molecule/medium PACO OACO NACO
E (nm) f E (nm) f E (nm) f
(i) Gas phase
S1 303.74 0.0006 300.85 0.0008 319.11 0.0457
S2 271.67 0.472 272.82 0.2916 314.66 0.1636
S3   266.74 0.2252 311.83 0.3589
[thin space (1/6-em)]
(ii) In SCRF
S1 314.42 0.0008 311.94 0.0010 338.41 0.0049
S2 274.40 0.490 276.31 0.3878 326.02 0.0308
S3   267.88 0.1552 319.90 0.5537
[thin space (1/6-em)]
(iii) Cluster
S1 280.39 0.5480 283.43 0.5542 333.53 0.6524
S2 270.96 0.0424 269.83 0.0166 313.87 0.0095
S3   268.68 0.0933 284.24 0.0016
[thin space (1/6-em)]
(iv) Molecular cluster in SCRF
S1 280.21 0.5073 278.55 0.5379 339.10 0.6308
S2 273.25 0.0709 271.29 0.0485 325.25 0.0553
S3   262.51 0.0495 289.48 0.0028


image file: c6ra00376a-f3.tif
Fig. 3 The simulated absorption spectra of (a) PACO (b) OACO and (c) NACO and their clusters in the gas phase and macrosolvated in water.

The TDDFT calculation on NACO in the gas phase shows two transitions in the UV-Visible region with high oscillator strengths. The first one is the S0 → S2 transition at 314.7 nm with an oscillator strength of 0.1636. The second one is the S0 → S3 transition at 311.8 nm with an oscillator strength of 0.3589. In the gas phase NACO·5H2O cluster, S0 → S1 and S0 → S2 transitions are predicted to occur at 333.5 nm and 313.9 nm with the oscillator strengths of 0.6524 and 0.0095, respectively. Following macrosolvation of the pentahydrate in water both the transitions get red-shifted. The energy and oscillator strength of S0 → S1 transition becomes 339.1 nm 0.6308, while the S0 → S2 transition is predicted to occur at 325.2 nm with an oscillator strength of 0.0553. Like in PACO and OACO, a crossing between the first (S1) and the second excited (S2) states in an isolated NACO molecule takes place in the NACO·5H2O microcluster and the most intense transition predicted by TDDFT calculations appear to be due to absorption by the enaminone moiety. The foregoing results seem to indicate that the specific (microscopic) solvation and not the macroscopic solvation dominantly shapes the observed features of the absorption spectra of OACO and NACO in water. Although TDDFT is known to predict reliable excitation energies for many organic molecules, the transition energies (ΔE) of molecules with ICT may differ from their experimental counterparts.49,50 Since the probe molecules under investigation possess ICT, we can anticipate our computed ΔE to differ from that obtained experimentally. The experimentally observed λmax of the probe molecules in water are somewhat red shifted compared to their theoretical counterparts. The molecular orbital structures of macrosolvated OACO·4H2O and NACO·5H2O clusters are shown in Fig. 4 and 5, respectively. The TDDFT calculations also predict that HOMO to (LUMO+1) and HOMO to LUMO transitions are the dominant ones in the absorption spectra of the OACO and NACO in water, respectively.


image file: c6ra00376a-f4.tif
Fig. 4 The HOMO, LUMO and (LUMO+1) pictures of OACO·4H2O molecular cluster in SCRF water. In the gas phase as well as in aqueous medium, the HOMO to (LUMO+1) transition mainly contributes in the observed absorption spectra of this molecule.

image file: c6ra00376a-f5.tif
Fig. 5 The HOMO and LUMO pictures of NACO·5H2O molecular cluster in SCRF of water. In the gas phase as well as in aqueous medium, the HOMO to LUMO transition mainly contributes in the observed absorption spectra of this molecule.

3c. Room temperature emission spectral studies of OACO and NACO

The emission spectra of OACO in different solvents at room temperature have been shown in Fig. 6. The emission maxima are reported in Table 1. In the emission spectra of OACO in different media, two important features have been observed. There is a notable Stokes' shift in the emission spectra of the probe, which is found to be strongly dependent on the polarity of the medium. Dual fluorescence of OACO has been observed in all the solvents used in this study with an increase in the higher wavelength peak intensity with increase in solvent polarity. These two observations are quite similar to what was observed earlier in the emission spectra of PACO.25 The only difference is that OACO shows dual fluorescence even in nonpolar solvents like cyclohexane, in which a single emission peak has been observed for PACO. The emission spectrum of OACO in cyclohexane shows two peaks at 330 nm and 430 nm, with the shorter wavelength peak having the higher intensity. Both the emission peaks get red shifted with increase in solvent polarity and the intensity of the longer wavelength peak increases with a concomitant decrease in the intensity of the shorter wavelength peak. The λmax of the shorter wavelength emission from OACO increases from 330 nm to 355 nm as the solvent is changed from cyclohexane to ethanol. The same species gets stabilized at 346 nm and 355 nm in methanol and water, respectively. The longer wavelength species shows similar red shifts with increase in solvent polarity. This species shows the highest peak intensity at 430 nm in cyclohexane that gets red shifted to 440 nm, 445 nm and 451 nm in ethanol, methanol and water, respectively. From the similarity of the emission behavior of OACO and PACO, the two observed peaks of the dual fluorescence can be assigned to the locally excited (LE) state of the probe molecule and the intramolecular charge transfer (ICT) species formed in the excited state. It has been reported by different research groups6,11,15 that organic molecules with a donor and an acceptor moiety conjugated through a π-electron bridge can emit fluorescence from two relaxed singlet excited states, resulting in dual fluorescence. There are many possible pathways of formation of an ICT state following electronic excitation. Generally, absorption of radiation leads the probe molecule to a locally excited state, from which a charge transfer state with larger dipole moment, known as the ICT state, is formed. It has been argued earlier25 that in PACO the absorption of radiation excites the molecule to a higher excited state (S2), which probably has a conical intersection with the locally excited (LE) and the intramolecular charge transfer (ICT) states of the probe. Excitation to the S2 state ultimately populates both the LE and the ICT states, from which emission of radiation occurs, giving rise to dual fluorescence. A similar process seems to be at play in OACO also. The emission spectrum of NACO reveals the presence of multiple emitting species. Since NACO has two peaks in its absorption spectra in different solvents, we have recorded the emission spectrum of NACO by exciting the molecule at both the wavelengths. When excited at 270 nm, the emission spectrum of NACO in cyclohexane shows a dual fluorescence with peaks at 324 and 470 nm, respectively. The 324 nm peak of NACO in cyclohexane gets red shifted to 330 nm in water. As the emission intensity of NACO is quite low, we have studied the excitation wavelength dependent emission from the probe (not shown). The emission pattern at the excitation wavelength (λex) of 270 nm indicates that the 324 nm emission is coming from a state dominantly originating in the β-enaminone moiety. The recorded emission spectra of NACO corresponding to excitation wavelength (λex) at 360 nm in different solvents are displayed in Fig. S4 of the ESI. The emission wavelength in cyclohexane and water are the same, indicating this emission is not due to ICT. Warman et al.40 reported that PNA has no emission but methyl substituted PNA gives rise to emission at around 430 nm in benzene. Therefore, we can surmise that the 470 nm emission of NACO has probably originated from the perturbed PNA moiety. This also indicates substitution of –NO2 group jeopardizes the ICT of enaminone moiety in NACO, compared to its unsubstituted counterpart. The probable ICT mechanism in the probe molecules has been depicted in Scheme 2.
image file: c6ra00376a-f6.tif
Fig. 6 The room temperature emission spectra of OACO in cyclohexane, ethanol, methanol and water. The excitation wavelength (λex) is 290 nm.

image file: c6ra00376a-s2.tif
Scheme 2 The schematic representation of intramolecular charge transfer in β-enaminones (X = H, PACO; X = OCH3, OACO and X = NO2, NACO).

3d. Low-temperature (77 K) emission spectra of the probe

The emission spectra of the new probe molecules under investigation, viz., OACO and NACO have been recorded in ethanol glass matrix formed at 77 K. The low temperature emission spectra have been displayed in Fig. 7(a and b) while the recorded emission maxima have been reported in Table 6. It may be noted that the dual emission of PACO in ethanol observed and analyzed earlier25 with peaks at 370 nm and 440 nm at room temperature was replaced by single broad emission band with a peak at 450 nm in the ethanol glass. The response appeared to be consistent with results of Boxer and co-worker51 who reported that with decrease in temperature, the effective polarity of solvents increases as the scale of thermal fluctuation gets reduced and the viscosity of the medium increases at low temperatures. The increase in effective polarity of the medium increases the local ordering of solvent molecules around the dipolar probe at low temperatures and when the solvent freezes, the enhanced local organization of solute and solvent molecules also freezes. The emission spectrum of OACO in ethanol glass matrix shows a similar behavior. When excited at 280 nm, the emission spectrum of OACO consists of an intense peak at 450 nm with a low intensity peak at 340 nm. The 450 nm peak can be assigned to emission from the ICT species formed in ethanol glass matrix and the 340 nm peak to emission from the LE state. The low temperature (77 K) emission spectrum of NACO in ethanol, when excited at 280 nm reveals three peaks. Two of the three peaks are at the same positions as noted for OACO, the highest intensity peak being at 500 nm. This band of NACO has probably its origin in the PNA moiety.38 The shorter wavelength peaks can be assigned to the LE and the ICT states by comparison with OACO emission under the same condition. The phosphorescence spectra of the probe molecules have been recorded in ethanol glass matrix formed at 77 K. The phosphorescence spectrum of OACO in ethanol glass matrix shows a peak at 450 nm. The intensity ratio of fluorescence to that of phosphorescence at this temperature was found to be 149. The phosphorescence spectrum of NACO in ethanol glass matrix shows two peaks at 450 nm and 507 nm, respectively, when excited at 280 nm. The intensity ratio of fluorescence to phosphorescence shows a dramatic decrease compared to what was observed for OACO. When excited at 360 nm, the intensity ratio decreases further. The similarity of peak positions of the shorter wavelength emission between PACO and OACO indicates that this peak arises due to the intersystem crossing between the first singlet (S1) state and first triplet (T1) state originating from the enaminone moiety. It has been reported by Warman et al.40 that in PNA the S1–T1 mixing efficiency is almost unity. We may argue therefore that the 507 nm phosphorescence peak of NACO arises due to the intersystem crossing from a singlet (S1) state to a triplet (T1) state originating in the PNA moiety. The energy of the T1 ← S0 transitions of PACO·3H2O, OACO·4H2O and NACO·5H2O clusters solvated in water have been computed using TDDFT calculation and reported in Table 6. It can be seen that the T1 ← S0 transition energies are quite similar to those obtained experimentally.
image file: c6ra00376a-f7.tif
Fig. 7 (a) Low temperature (77 K) fluorescence spectra of OACO and NACO in ethanol glass matrices. (b) The phosphorescence spectra of OACO and NACO in ethanol glass matrices, formed at 77 K. The samples were excited (λex) at 280 nm.
Table 6 The fluorescence (Fl-λmax) and phosphorescence (Ph-λmax) maxima (in nm) at corresponding excitation wavelength (λex) of OACO and NACO in ethanol glass matrix formed at 77 K. The ratios of fluorescence intensities to that of phosphorescence intensities (Fl/Ph) of OACO and NACO have also been reported. The energy of lowest triplet states (Ph-theo, in nm) of the OACO·4H2O and NACO·5H2O clusters in SCRF of water (TDDFT) are reported for comparison
Probe λex (nm) Fl-λmax (nm) Ph-λmax (nm) (Fl/Ph) Ph-theoa (nm)
a The energy of lowest triplet states (nm) of the PACO·3H2O cluster in the SCRF of water (TDDFT) is 442.63 nm.
OACO 280 445 447 149 439.39
NACO 280 445, 500 432, 507 14.5 501.43
NACO 360 500 507 2.40


3e. Time resolved emission studies at room temperature

Room temperature time resolved emissions of OACO and NACO in different media have been obtained by exciting the sample (λex) at 295 nm and 280 nm for OACO and NACO, respectively and the emissions were monitored at the corresponding steady state emission maxima of a particular probe. The time resolved emission data [I(t)] have been fitted to a sum of decaying exponentials for extracting lifetimes of the excited state species formed in different media. Thus we have
 
image file: c6ra00376a-t3.tif(3)

In eqn (3), τi is the lifetime of the i-th excited state species and A is the background. Ai is the relative amplitude of the species with lifetimes τi. In general, the time resolved decay curves fit well to tri-exponentials. The lifetime components we get after fitting are displayed in Tables 7 and 8. Time resolved emission decay curves of OACO and NACO at room temperature in ethanol are displayed in Fig. 8(a and b). Just as previously observed for PACO, two distinct species of OACO are detected in each solvent. When monitored at 330–335 nm regions, the lifetimes of these two species in OACO are 2.09 ns and 9.38 ns with relative contribution of 35% and 20%, respectively. The lower lifetime species is attributed to the locally excited (LE) state while the longer lifetime species is assigned to the intramolecular charge transfer (ICT) state of OACO formed in the excited state. For every solvent, a component with picosecond lifetime is observed presumably due to the solvent relaxation. The lifetimes of both the LE and ICT species are seen to increase with increase in solvent polarity; in ethanol they are 3.78 ns and 13.48 ns with the relative amplitudes of 31.7% and 59.3%, respectively. The lifetimes of the both the LE and ICT species of OACO in methanol [2.04 ns (22.9%) and 8.06 ns (17.9%)] are lower than those in ethanol. The behaviour is reminiscent of what was observed for PACO earlier. We also observed that the lifetimes of both the species decreased due to the addition of acid to the solvent. The observed pattern of response of PACO in alcoholic solvents and in the presence of acid led us to conclude that the decrease in lifetime was due to the hydrogen bond donor abilities of the solvents.25 Extending the argument to OACO which behaves similarly we tend to conclude that the lifetimes of LE and ICT species of OACO are lower in methanol than those in ethanol due to the higher hydrogen bond donor ability (B, Table 1) of the former than the later. The lifetimes of LE and ICT species of OACO in water further decrease to 1.85 ns (34.8%) and 6.65 ns (34.4%), respectively. The time-resolved emission of OACO in cyclohexane, ethanol, methanol and water, when monitored at the 430–455 nm regions was found to respond qualitatively in the same way as seen while monitoring the emission at the 330–335 nm region. For example, two excited state species of OACO have been detected in cyclohexane with lifetimes of 0.67 ns and 3.09 ns with relative amplitudes of 44.5% and 19.2%, respectively, when the emission was monitored in the 430–455 nm region.

Table 7 The lifetime of the excited state species (in nano-second) of OACO formed in different solvents. The sample was excited at 295 nm. The numbers in the parenthesis represent the relative contribution of the species in percentage (%) scale
Medium OACO lifetimes
λmon = 330–355 nm λmon = 430–451 nm
τ1 (ns) τ2 (ns) τ3 (ns) τ1 (ns) τ2 (ns) τ3 (ns)
(i) Cyclohexane 0.05 (45.0) 2.09 (35.0) 9.38 (20.0) 0.16 (36.3) 0.67 (44.5) 3.09 (19.2)
(ii) Ethanol 0.73 (8.9) 3.78 (31.7) 13.48 (59.3) 0.21 (27.4) 2.42 (44.9) 8.67 (27.7)
(iii) Methanol 0.06 (59.2) 2.04 (22.9) 8.06 (17.9) 0.14 (11.0) 1.56 (19.4) 7.68 (69.5)
(iv) Water 0.09 (30.8) 1.85 (34.8) 6.65 (34.4) 0.26 (5.1) 5.41 (47.1) 7.96 (47.8)


Table 8 The lifetime of the excited state species (in nano-second) of NACO formed in different solvents. The sample was excited at 280 nm. The numbers in the parenthesis represent the relative contribution of the species in percentage (%) scale
Medium Lifetimes
λmon = 324–330 nm λmon = 432–470 nm
τ1 (ns) τ2 (ns) τ3 (ns) τ1 (ns) τ2 (ns) τ3 (ns)
(i) Cyclohexane 0.11 (16.1) 2.93 (54.4) 10.0 (29.5) 0.09 (72.0) 2.06 (23.5) 13.37 (4.5)
(ii) Ethanol 1.17 (4.7) 4.63 (34.3) 14.09 (61.0) 0.25 (27.5) 3.90 (40.1) 24.87 (32.3)
(iii) Methanol 0.12 (34.4) 2.45 (43.8) 8.90 (21.8) 0.12 (67.5) 1.73 (21.0) 7.32 (11.5)
(iv) Water 0.17 (18.4) 2.71 (51.7) 8.37 (29.9) 0.10 (42.3) 3.47 (21.4) 10.74 (36.4)


image file: c6ra00376a-f8.tif
Fig. 8 The time-resolved emission spectra of (a) OACO and (b) NACO in ethanol. The sample was excited (λex) at 295 nm and 280 nm for OACO and NACO, respectively, while the emission were monitored at 342 nm and 325 nm for OACO and NACO, respectively.

In NACO, two species with lifetimes in the nanosecond region are formed with a picosecond component arising due to the solvent relaxation. In cyclohexane, when monitored at the 325–330 nm region, two species of lifetimes 2.93 ns and 10.0 ns with relative amplitudes of 54.4% and 29.5%, respectively are found. The 2.93 ns component is assigned to the LE species while the 10.0 ns component is assigned to the ICT species of NACO, formed in the excited state. The lifetimes of both the species of NACO are seen to increase from cyclohexane to ethanol. In ethanol, the lifetime of the LE and ICT species of NACO are seen to be 4.63 ns (34.3%) and 14.09 ns (61.0%), respectively. As in PACO and OACO, the lifetime of the LE and ICT species of NACO in methanol are lower than those in ethanol due to higher hydrogen bond donor ability of methanol than ethanol. The lifetimes of two species formed in water are 2.71 ns and 8.37 ns with relative amplitude of 51.7% and 29.9%, respectively. From the similarity in lifetime of NACO with PACO and OACO, the two excited state species detected may be assumed to originate from the enaminone moiety. The time-resolved emission decay behavior of NACO is quite similar whether monitored at the 325–330 nm or in the 430–470 nm regions. The results obtained from our time-resolved emission studies therefore indicate formation of ICT states of the probe molecules, following excitation by light. The media play a crucial role in shaping the lifetime of the species formed in the excited state.

4. Conclusion

The intramolecular charge transfer process in three molecules, namely, PACO, OACO and NACO, belonging to the β-enaminone molecular family, appears to be affected by the substitution of electron donor or acceptor groups in conjugation with the enaminone moiety and modulates band gaps. The induction of an electron donating –OCH3 group in the para-position of the phenyl ring mildly enhances the charge transfer and the spectral response is qualitatively similar to that of PACO. The induction of electron withdrawing –NO2 group in the same position opens competing charge transfer channels and the spectral response resembles mixed responses from enaminone and PNA moieties. The NLO response is predicted to be strong. Microhydration further modulates the band gaps and enhances NLO response in all the microhydrates. These results indicate that a judicious choice of donor or acceptor groups can tune the band gap in β-enaminones, opening up the possibility of tailoring their properties, spectral or otherwise and designing low optical band gap materials.

Acknowledgements

SPB thanks DAE, Government of India, New Delhi for the Raja Ramanna Fellowship. We thank Dr Gopa Mondal and Mr Subrata Das, Department of Spectroscopy, IACS for their assistance in low-temperature and time-resolved spectroscopic measurements. RM is grateful to Mr Saptarshi Mandal for technical help and Prof. D. S. Ray, IACS for many fruitful discussions.

References

  1. A. Bauer, F. Westkamper, S. Grimme and T. Bach, Nature, 2005, 436, 1139 CrossRef CAS PubMed.
  2. G. Sedghi, K. Sawada, L. J. Esdaile, M. Hoffmann, H. L. Anderson, D. Bethell, W. Haiss, S. J. Higgins and R. J. Nichols, J. Am. Chem. Soc., 2008, 130, 8582 CrossRef CAS PubMed.
  3. D. Gust and T. A. Moore, Science, 1989, 244, 35 CAS.
  4. B. Meunier, S. P. de Visser and S. Shaik, Chem. Rev., 2004, 104, 3947 CrossRef CAS PubMed.
  5. G. L. Closs and J. R. Miller, Science, 1988, 240, 440 CAS.
  6. S. I. Druzhinin, P. Mayer, D. Stalke, R. V. Bolow, M. Noltemeyer and K. A. Zachariasse, J. Am. Chem. Soc., 2010, 132, 7730 CrossRef CAS PubMed.
  7. C. Hattig, A. Hellweg and A. Kohn, J. Am. Chem. Soc., 2006, 128, 15672 CrossRef PubMed.
  8. O. A. Mohammed, O.-H. Kwon, C. M. Othon and A. H. Zewail, Angew. Chem., Int. Ed., 2009, 48, 6251 CrossRef CAS PubMed.
  9. G.-J. Zhao, R.-K. Chen, M.-T. Sun, J.-Y. Liu, G.-Y. Li, Y.-L. Gao, K.-L. Han, X.-C. Yang and L. Sun, Chem.–Eur. J., 2008, 14, 6935 CrossRef CAS PubMed.
  10. T. Polivka, S. Kaligotla, P. Chabera and H. A. Frank, Phys. Chem. Chem. Phys., 2011, 13, 10787 RSC.
  11. P. B. Coto, L. Serrano-Andres, T. Gustavsson, T. Fujiwara and E. C. Lim, Phys. Chem. Chem. Phys., 2011, 13, 15182 RSC.
  12. X. Y. Liu, D. R. Bai and S. Wang, Angew. Chem., 2006, 118, 5601 CrossRef.
  13. S. Arzhantsev, K. A. Zachariasse and M. Maroncelli, J. Phys. Chem. A, 2006, 110, 3454 CrossRef CAS PubMed.
  14. J. Zyss, I. Ledoux, S. Volkov, V. Chernyak, S. Mukamel, G. P. Bartholomew and G. C. Bazan, J. Am. Chem. Soc., 2000, 122, 11956 CrossRef CAS.
  15. T. Yoshihara, S. I. Druzhinin and K. A. Zachariasse, J. Am. Chem. Soc., 2004, 126, 8535 CrossRef CAS PubMed.
  16. A. Chakraborty, S. Kar, D. N. Nath and N. Guchhait, J. Phys. Chem. A, 2006, 110, 12089 CrossRef CAS PubMed.
  17. C. J. Jodicke and H. P. Luthi, J. Am. Chem. Soc., 2003, 125, 252 CrossRef PubMed.
  18. B. M. Bulheller, A. J. Miles, B. A. Wallace and J. D. Hirst, J. Phys. Chem. B, 2008, 112, 1866 CrossRef CAS PubMed.
  19. A. Felouat, A. D'Aleo, A. Charaf-Addin, D. Jacquemin, B. L. Guennic, E. Kim, K. J. Lee, J. H. Woo, J.-C. Ribierre, J. W. Wu and F. J. Fages, J. Phys. Chem. A, 2015, 119, 6283 CrossRef CAS PubMed.
  20. D. C. Flynn, G. Ramakrishna, H.-B. Yang, B. H. Northrop, P. J. Stang and T. Goodson, J. Am. Chem. Soc., 2010, 132, 1348 CrossRef CAS PubMed.
  21. A. P. Kulkarni, X. Kong and S. A. Jenekhe, Adv. Funct. Mater., 2006, 16, 1057 CrossRef CAS.
  22. H. Wonneberger, C. Q. Ma, M. A. Gatys, C. Li, P. Bauerle and K. Mullen, J. Phys. Chem. B, 2010, 114, 14343 CrossRef CAS PubMed.
  23. Q. T. Zhang and J. M. Tour, J. Am. Chem. Soc., 1998, 120, 5355 CrossRef CAS.
  24. G. L. Eakins, J. S. Alford, B. J. Tiegs, B. E. Breyfogle and C. J. Stearman, J. Phys. Org. Chem., 2011, 24, 1119 CrossRef CAS.
  25. R. Misra, A. Mandal, M. Mukhopadhyay, D. K. Maity and S. P. Bhattacharyya, J. Phys. Chem. B, 2009, 113, 10779 CrossRef CAS PubMed.
  26. H. Kang, A. Facchetti, H. Jiang, E. Cariati, S. Righetto, R. Ugo, C. Zuccaccia, A. Macchioni, C. L. Stern, Z. Liu, S.-T. Ho, E. C. Brown, M. A. Ratner and T. J. Marks, J. Am. Chem. Soc., 2007, 129, 3267 CrossRef CAS PubMed.
  27. D. Frattarelli, M. Schiavo, A. Facchetti, M. A. Ratnet and T. J. Marks, J. Am. Chem. Soc., 2009, 131, 12595 CrossRef CAS PubMed.
  28. G. U. Bublitz, R. Ortiz, C. Runser, A. Fort, M. Barzoukas, S. R. Marder and S. G. Boxer, J. Am. Chem. Soc., 1997, 119, 2311 CrossRef CAS.
  29. S. Barlow, H. E. Bunting, C. Ringham, J. C. Green, G. U. Bublitz, S. G. Boxer, J. W. Perry and S. R. Marder, J. Am. Chem. Soc., 1999, 121, 3715 CrossRef CAS.
  30. R. Misra, S. P. Bhattacharyya and D. K. Maity, Chem. Phys. Lett., 2008, 54, 458 Search PubMed.
  31. A. Z. A. Elassar and A. A. El-Khair, Tetrahedron, 2003, 59, 8463 CrossRef CAS.
  32. H. Ge, M. J. Niphakis and G. I. Georg, J. Am. Chem. Soc., 2008, 130, 3708 CrossRef CAS PubMed.
  33. M. Paira, R. Misra and S. C. Roy, Indian J. Chem., 2008, 47, 966 Search PubMed.
  34. K. Remya and C. H. Suresh, J. Comput. Chem., 2013, 34, 1341 CrossRef CAS PubMed.
  35. M. J. Frisch, et al., Gaussian 09, Revision C.01, Gaussian, Inc, Wallingford CT, 2010 Search PubMed.
  36. R. Dennington, T. Keith and J. Millam, GaussView, Version 5, Semichem Inc, Shawnee Mission KS, 2009 Search PubMed.
  37. A. V. Marenich, C. J. Cramer and D. G. Truhler, J. Phys. Chem. B, 2009, 113, 6378 CrossRef CAS PubMed.
  38. R. Misra, R. Sharma and S. P. Bhattacharyya, J. Comput. Methods Sci. Eng., 2010, 10, 149 CAS.
  39. A. K. Jeewandara and K. M. Nalin de Silva, J. Mol. Struct., 2004, 686, 131 CrossRef CAS.
  40. W. Schuddeboom, J. M. Warman, H. A. M. Biemans and E. W. Meijer, J. Phys. Chem., 1996, 100, 123 CrossRef.
  41. C. Reichardt and T. Welton, Solvents and Solvent Effects in Organic Chemistry, Wiley, 4th edn, 2010 Search PubMed.
  42. B. B. Raju and S. M. B. Costa, Phys. Chem. Chem. Phys., 1999, 1, 3539 RSC.
  43. A. Mandal and R. Misra, J. Lumin., 2014, 150, 25 CrossRef CAS.
  44. R. Misra, A. Mandal and S. P. Bhattacharyya, J. Phys. Chem. B, 2011, 115, 11840 CrossRef CAS PubMed.
  45. R. Misra and S. Kar, Chem. Phys., 2012, 397, 65 CrossRef CAS.
  46. R. Misra, D. K. Maity and S. P. Bhattacharyya, Chem. Phys., 2012, 402, 96 CrossRef CAS.
  47. R. Misra, D. K. Maity and S. P. Bhattacharyya, Chem. Phys., 2013, 425, 148 CrossRef CAS.
  48. R. Misra, P. Chakraborty, S. C. Roy, D. K. Maity and S. P. Bhattacharyya, J. Photochem. Photobiol., A, 2015, 302, 23 CrossRef CAS.
  49. M. J. G. Peach, C. R. L. Sueur, K. Rudd, M. Guillaume and D. J. Tozer, Phys. Chem. Chem. Phys., 2009, 11, 4465 RSC.
  50. A. Drew and M. Head-Gordon, J. Am. Chem. Soc., 2004, 126, 4007 CrossRef PubMed.
  51. G. U. Bublitz and S. G. Boxer, J. Am. Chem. Soc., 1998, 120, 3988 CrossRef CAS.

Footnotes

Electronic supplementary information (ESI) available. See DOI: 10.1039/c6ra00376a
Present address: Department of Organic Chemistry, Weizmann Institute of Science, Rehovot 76100, Israel.

This journal is © The Royal Society of Chemistry 2016
Click here to see how this site uses Cookies. View our privacy policy here.