
ZnS nanowall coated Ni composites: facile preparation and enhanced electromagnetic wave absorption†
Biao Zhaoa,
Gang Shaoa,
Bingbing Fana,
Wanyu Zhaoa,
Yajun Xiea and
Rui Zhang*ab
aSchool of Materials Science and Engineering, Zhengzhou University, Zhengzhou, Henan 450001, P. R. China
bZhengzhou Aeronautical Institute of Industry Management, Zhengzhou, Henan 450046, P. R. China. E-mail: zhangray@zzu.edu.cn; Fax: +86-371-60632600; Tel: +86-371-60632007
First published on 7th November 2014
Abstract
In this work, core–shell composites with Ni cores and ZnS nanowall shells have been successfully prepared by a hydrothermal deposition method. The crystal structures, microstructures and electromagnetic (EM) properties of the samples were investigated by X-ray diffraction, scanning electron microscopy, energy disperse X-ray spectrometry, transmission electron microscopy and a network analyser (2–18 GHz). In comparison with Ni and ZnS particles, the Ni/ZnS composites show the best microwave absorption properties. The optimal reflection loss is −25.78 dB at 14.24 GHz with the thickness of 2.7 mm. The reflection loss below −10 dB (90% microwave absorption) is 4.72 GHz (11.52–16.24 GHz) with only a thickness of 2.7 mm. The enhanced microwave absorption capabilities of Ni/ZnS composites were due to good electromagnetic impedance matching, interfacial relaxation and unique wall-like ZnS shells.
1. Introduction
Nowadays, electromagnetic interference (EMI) has become a more serious problem due to the wide application of electromagnetic waves in the gigahertz (GHz) range for mobile phone, local area networks, radar systems and so on.1–3 EM radiation pollution and EM interference not only impact on the normal utilization of electronic equipment, but also damage human health. To deal with this problem, much interest has been attracted to seek suitable electromagnetic wave absorption materials.4–6 They can absorb microwaves effectively and convert EM energy into thermal energy or dissipated microwaves. Microwave absorbing materials are now required to possess the advantages of wide waveband and strong absorption, be light weight, thin, and simple to use.7–9Among the candidates, core–shell structured materials, have been focused on because of their improved microwave absorption property through cooperation between the components, such as Fe3O4/graphene and carbon nanocoils coated with Fe3O4 or Ni by atomic layer deposition,10,11 porous Fe3O4/Carbon nanorods,12 Ni@Ni2O3 core–shell particles,13 Ni/SnO2 microspheres,14 Fe3O4/ZnO nanorods,15 SiO2@FeNi3,16 Fe3O4/SnO2 nanorods,17 CuO/Cu2O-coated Ni nanocapsules,18 Ni/polyaniline,19 carbon-coated nickel,20 In these kinds of core–shell structures, the excellent microwave absorption performances were attained due to the improved magnetic loss, dielectric loss, reduced eddy current loss and impedance match.21 Therefore, preparation of dielectric–magnetic composite with desired size, composition, and well-defined structures is beneficial for excellent microwave absorption capabilities.
Nickel as a magnetic absorbent has received much attention from many researchers, due to high permeability at GHz frequency ranges, easy preparation, as well as low cost.2,22–24 However, owing to its metallic nature, the eddy current generation seriously limits their applications at high frequency.25 Therefore, in order to optimize microwave absorption performance, an effective way is to cover the magnetic Ni metallic particles by an inorganic and nonmagnetic coating to create a core–shell structure.
ZnS is a wide band-gap semiconductor with a band-gap energy (Eg) of 3.6 eV. It has been used widely in displays, sensors, and lasers for many years.26,27 However, to the best of our knowledge, the microwave absorption properties of ZnS and studies on the synthesis of core–shell structure with Ni cores and ZnS nanowalls shells have not been reported. Herein, we report a facile method to synthesize the core–shell structured composites with Ni cores and ZnS nanowall shells. The microwave absorption performances of Ni, ZnS and Ni@ZnS composites were investigated in the frequency of 2–18 GHz. Compared with pure Ni and ZnS, the ZnS nanowall-coated Ni composites show the best microwave absorption properties.
2. Experimental section
2.1 Preparation of ZnS nanowall coated Ni composite
All the reagents were of analytical grade and utilized without any further purification. ZnS nanowall-coated Ni composites were prepared through a two-stage method. Firstly, Ni microspheres were synthesized according to our previous literature.14 Secondly, Ni microspheres were covered by ZnS nanowalls to form the core–shell structured composites. In a typical experiment, the as-prepared Ni microspheres (0.05 g) and Zn(CH3COO)2·2H2O (0.45 g) were dispersed in a mixture of ethanol (30 mL) and distilled water (30 mL). Afterward, Na2S·9H2O (0.50 g) and ammonia solution (4 mL) were introduced into the above mixture solution with vigorous stirring over 20 min. Then the mixture was transferred into a Teflon-lined stainless steel autoclave, and heated at 100 °C for 15 h. When cooled to room temperature, the obtained precipitates were washed several times with distilled water and absolute ethanol, respectively. In order to investigate the effect of core–shell structure on the microwave absorption properties of the Ni/ZnS composite, the pure ZnS particles were also prepared according to the above procedure without addition of Ni microspheres.2.2 Characterization
The crystal structure of the samples were analyzed by X-ray diffraction (XD-3, Beijing Purkinje General Instrument Co, Ltd.) technique with a Cu Kα radiation of wavelength λ = 1.54056 Å. The morphology of the products was observed using field emission scanning electron microscopy (FE-SEM, JEOL JSM-7001F) and transmission electron microscope (TEM, JEOL 2010). composition was carried out by an energy dispersive X-ray spectroscopy (EDS, Oxford Instruments) associated with FESEM. The obtained products–paraffin composite was prepared by uniformly mixing samples with paraffin, by pressing them into cylinder-shaped compacts. Then the compact is cut into toroidal shape with 7.00 mm outer diameter and 3.04 mm inner diameter. The EM parameters were measured for Ni@ZnS, Ni and ZnS–paraffin composites containing 70 wt% Ni@ZnS, Ni and ZnS, using an Agilent N5244A vector network analyzer. Coaxial method was used to determine the EM parameters of the toroidal samples in a frequency range of 2–18 GHz with a transverse EM mode.3. Results and discussion
Fig. 1 presents the XRD profiles of Ni microspheres, ZnS particles and Ni@ZnS composites. For the Ni microspheres (Fig. 1a), all the diffraction peaks can be well indexed to the face-centered cubic (fcc) structure of nickel (JCPDS no. 04-0850). Fig. 1b shows XRD pattern of ZnS particles, all diffraction peaks can be indexed to a typical zinc blende structured ZnS with the cell constant a = 5.406 Å, which is consistent with the standard value for bulk ZnS (JCPDS Card no. 05-0566). The crystal structure of core–shell structured Ni/ZnS composites is also investigated by XRD measurements. A typical XRD pattern is shown in Fig. 1c, in which the diffraction peaks corresponding to both Ni and ZnS can be clearly seen. From Fig. 1c, we can deduce that the as-synthesized core–shell structured composites are composed of crystalline Ni and ZnS. | ||
| Fig. 1 XRD patterns of (a) Ni microspheres, (b) ZnS particles and (c) Ni/ZnS composites. | ||
Scanning electron microscopy (SEM) image of the Ni microspheres was shown in Fig. 2a. It can be clearly seen that the products have a relatively uniform spherical shape with the diameter of 0.7–1.0 μm. The pure ZnS products appear to have irregular shapes (Fig. 2b). The magnified SEM image (inset in Fig. 2b) of ZnS particles shows that the irregular shapes were comprised of large number of aggregated nanoparticles with the diameter of 15–20 nm. In pure ZnS system, the formation of ZnS is through homogeneous nucleation and growth. The fresh nanoparticles tend to gather up in order to reduce the surface energy. Thus the aggregated irregular ZnS particles are formed. However, in Ni/ZnS composites, ZnS particles were formed through a template method (heterogeneous nucleation) using the as-prepared Ni microspheres as the starting templates. Therefore, the morphology and dimensions of ZnS particles between pure ZnS and Ni/ZnS composites are quite different.
 | ||
| Fig. 2 SEM images of (a) Ni microspheres, (b) ZnS particles and (c and d) the as-prepared Ni/ZnS composites. The inset in (b) is the magnified SEM image of ZnS particles. | ||
Fig. 2c and d show the SEM images of Ni/ZnS composites. Compared with Ni microspheres (Fig. 2a), One significant difference is clearly discerned between the Ni/ZnS microspheres and the naked Ni microspheres. The difference is that the Ni microspheres are entirely enwrapped by the ZnS nanowalls. The typical large-scale SEM image shown in Fig. 2d indicates that the as-prepared Ni/ZnS composites exhibit crinkled and rough textures, which are similar with the reduced graphene oxide sheets.28 The thickness of ZnS nanowall is around 10 nm.
In order to obtain more information about the microstructure of Ni/ZnS composites, the transmission electron microscope (TEM) was performed and the core–shell structures were observed distinctly, as shown in Fig. 3a and b. Notably, the Ni microspheres were wrapped by a crumpled and rippled ZnS nanowall. To confirm the core–shell structure of Ni/ZnS, the enlarged magnification FESEM image and EDS pattern of Ni/ZnS were shown in Fig. 3c and d. EDS analysis of composite microspheres indicates that the obtained composite are composed of Ni, Zn and S elements. The C element signal originates from the carbon conductive tape to support the samples during the test. The O peaks are attributed to the oxygen residual or oxide in the composite. To further investigate Ni/ZnS microstructure, the elemental mappings of Ni/ZnS were performed in Fig. 3e–g. The Ni element can be clearly detected in the core region, while the Zn element and S element can be detected in the shell regions. This further validates the unique core–shell structures with Ni cores and ZnS shells.
 | ||
| Fig. 3 (a and b) TEM images of the Ni/ZnS core–shell composites; (c) The enlarged magnification FESEM image and (d) EDS spectra of the Ni/ZnS composite, and (e–g) corresponding elemental mappings of Ni, Zn and S. | ||
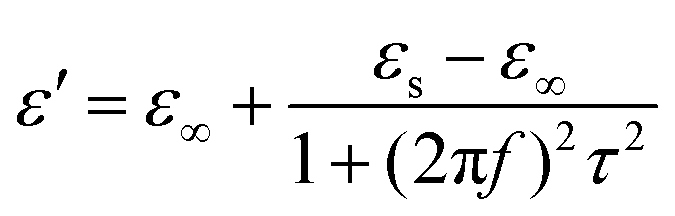
The relative complex permittivity (ε′ and ε′′) and permeability (μ′ and μ′′) of the Ni/paraffin, ZnS/paraffin and Ni@ZnS/paraffin composite samples were measured over a frequency of 2–18 GHz. Fig. 4 shows the real part (ε′) and imaginary part (ε′′) of the complex permittivity as a function of frequency. As shown in Fig. 4a, the ε′′ of Ni/paraffin composite shows a gradual decrease with frequency. However, the ε′ values are relative constant without significant change over the 2–18 GHz.The ε′ and ε′′ of ZnS/paraffin composite present constant value (4.5 and 0.5, respectively) in Fig. 4b. From the Fig. 4c, the ε′ of the Ni/ZnS composite firstly decreases in the frequency of 2–15 GHz and then increase with the increase of frequency. However, the ε′′ shows the opposite trend in the frequency of 2–18 GHz. It is worth noting that the ε′′ values of Ni/ZnS composite exhibits a peak in the 13–15 GHz range, which is attributed to the natural resonance behavior of core–shell structure.18,29 It is can be found that the ε′′ values of Ni/paraffin composite are higher than those of ZnS/paraffin composite and Ni@ZnS/paraffin composite. According to the free electron theory,25,30 ε′′ ≈ 1/πε0ρf, where ρ is the resistivity. The lower ε′′ values of ZnS/paraffin composite and Ni@ZnS/paraffin composite indicate the higher electric resistivity. In general, a high electrical resistivity is favorable for improving the microwave absorption abilities.31
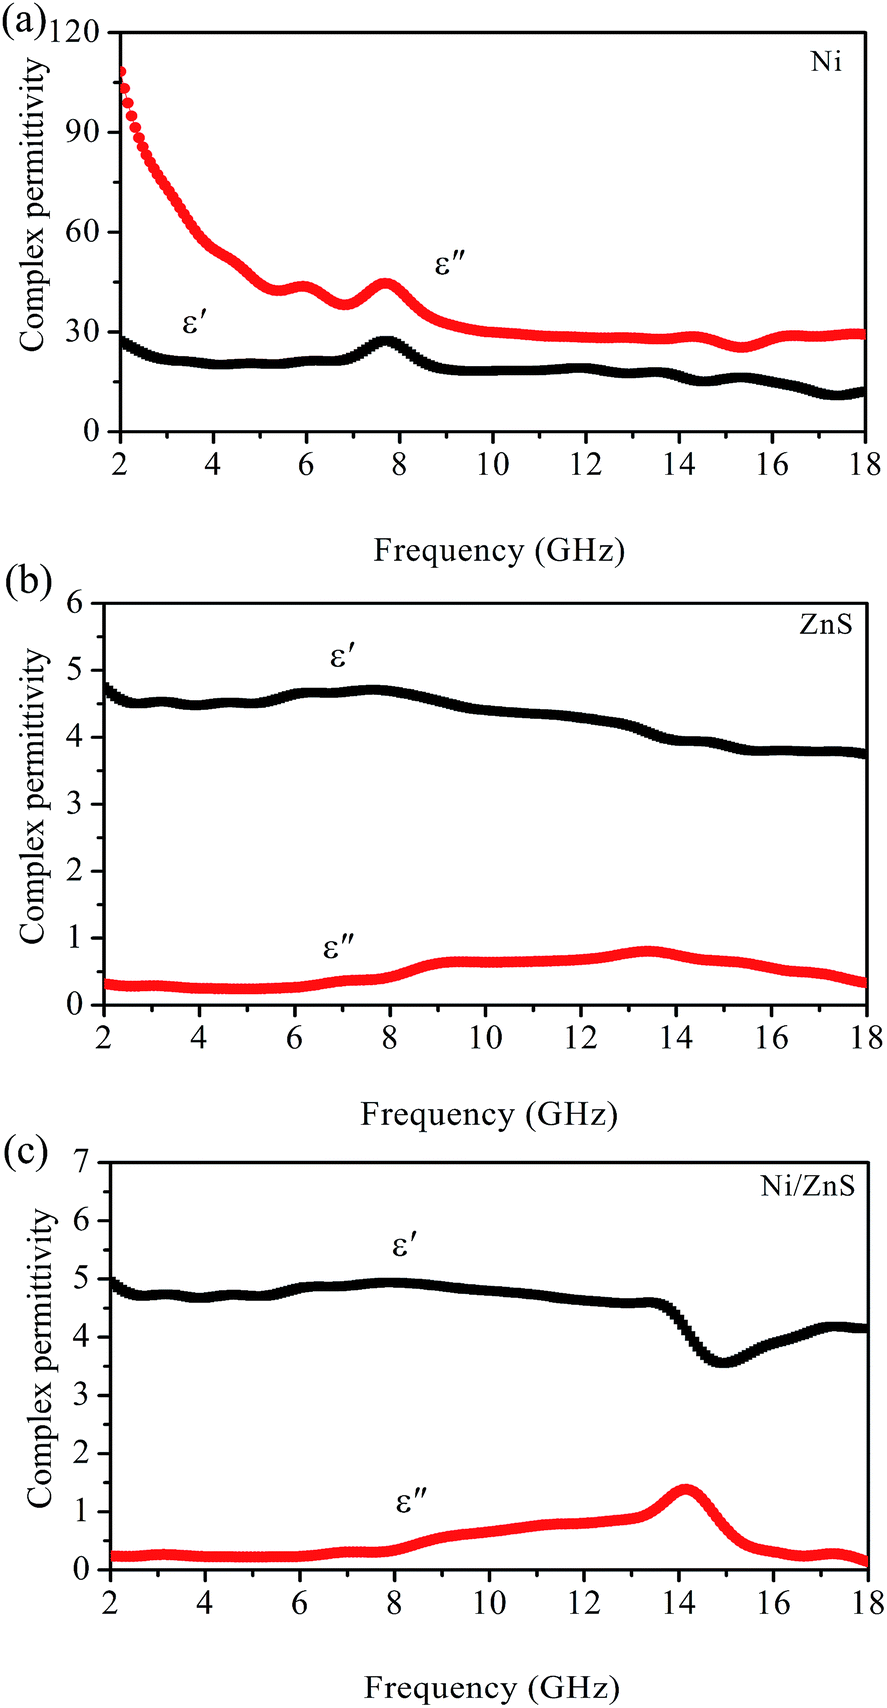 | ||
| Fig. 4 Frequency dependence of the complex permittivity (εr = ε′ − jε′′) of (a) Ni microspheres, (b) ZnS particles and (c) Ni/ZnS composites. | ||
Fig. 5 presents the curves of the real part (μ′) and imaginary part (μ′′) of the complex permeability as a function of frequency for the Ni/paraffin, ZnS/paraffin and Ni@ZnS/paraffin composite. The μ′ and μ′′ of Ni/paraffin composite are 0.81–1.59 and 0.05–0.51, respectively, in the 2–18 GHz range (Fig. 5a). In comparison with the complex permittivity (Fig. 4a), the complex permeability was lower, which result in poor impedance match. The impedance match requires that the relation between permittivity and permeability tends to be close, which can achieve zero-reflection at the front surface of the materials.32 The higher permittivity of the absorber is harmful to the impedance match,33 thus leads to weak microwave absorption. From the Fig. 5b and c, one can see that the complex permeability of ZnS/paraffin and Ni@ZnS/paraffin composite show the same trend with increasing frequency. The μ′ values of ZnS/paraffin and Ni@ZnS/paraffin composites are 0.99–1.38 and 0.84–1.34, respectively. The μ′′ values of ZnS/paraffin and Ni@ZnS/paraffin composites are in the range of 0.02–0.24 and 0.03–0.34, respectively. Combining with the complex permittivity (Fig. 4b and c), it can be found that the relation between permittivity and permeability is prone to be close (good impedance match). The good impedance match is beneficial for the microwave absorption. Based on the above analysis, we can conclude that the ZnS/paraffin and Ni@ZnS/paraffin composites possess better impedance match than that of Ni/paraffin composite. The ZnS/paraffin and Ni@ZnS/paraffin composites may hold better capabilities of microwave attenuation.
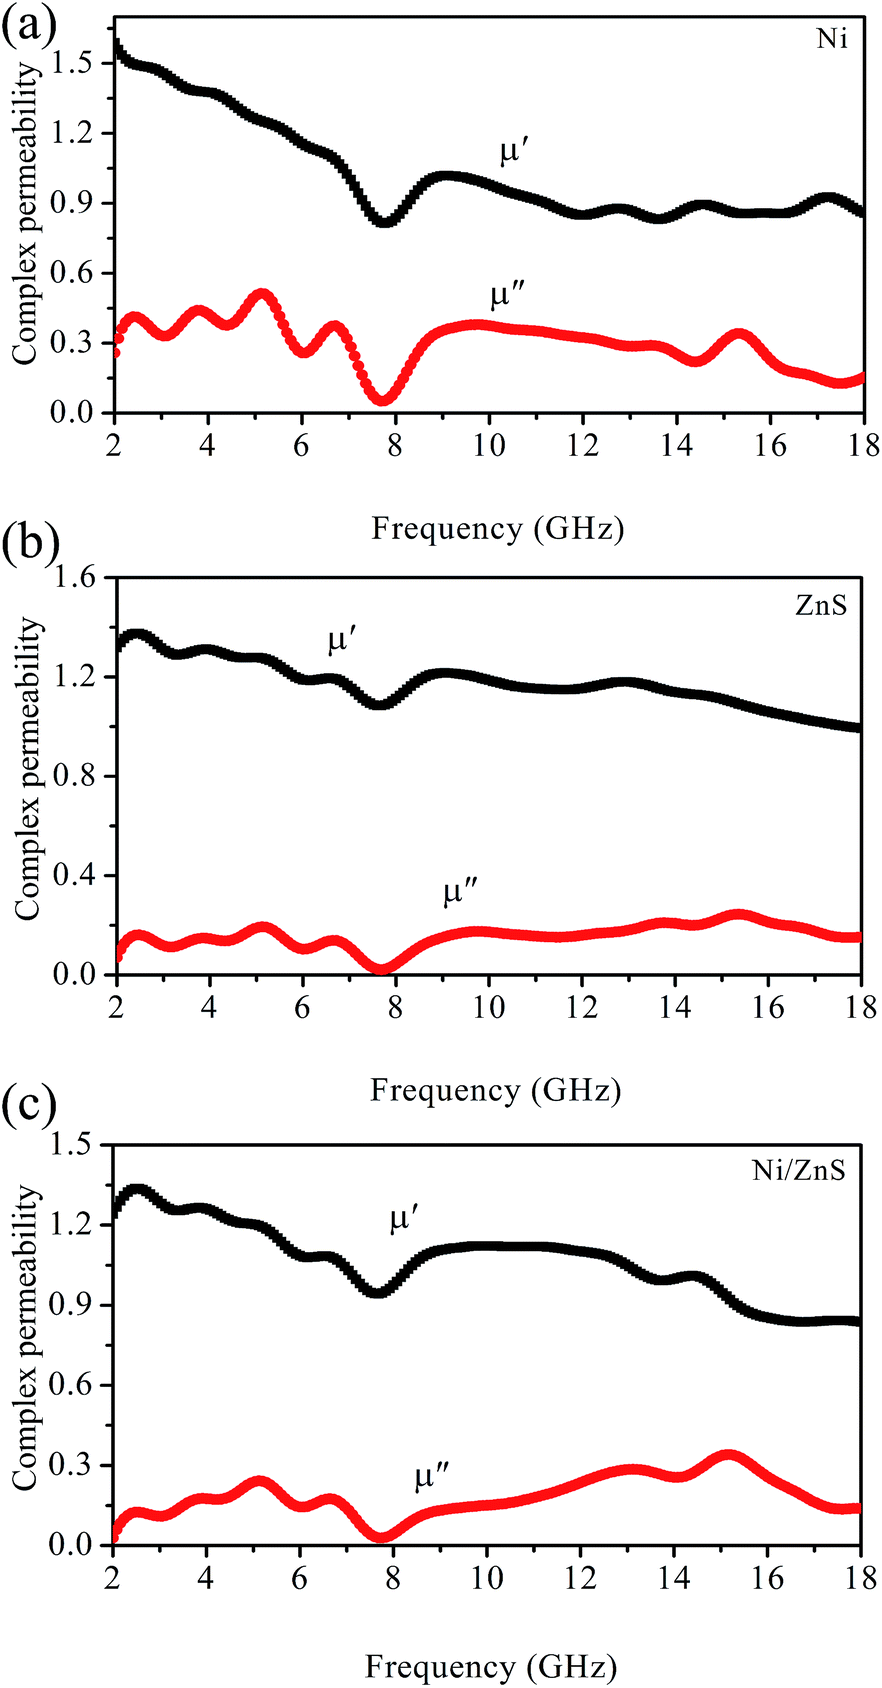 | ||
| Fig. 5 Frequency dependence of the complex permeability (μr = μ′ − jμ′′) of (a) Ni microspheres, (b) ZnS particles and (c) Ni/ZnS composites. | ||
It is well known that the reflection loss (RL) can be used to characterize the microwave absorption properties of EM materials. According to the transmission-line model,21,34 the RL values can be simulated based on the complex permeability and permittivity at a given frequency and layer thickness by means of the following equations:
RL = 20![[thin space (1/6-em)]](https://www.rsc.org/images/entities/char_2009.gif) log|(Zin − Z0)/(Zin + Z0)| log|(Zin − Z0)/(Zin + Z0)|
| (1) |
 | (2) |
 | ||
| Fig. 6 (a) Reflection loss curves of Ni, ZnS and Ni/ZnS paraffin composite with 70 wt% loadings at the thickness of 2.5 mm; (b) reflection loss curves of 70 wt% Ni/ZnS wax-composite at various thicknesses in the frequency of 2–18 GHz. | ||
For the ZnS nanowall-coated Ni composite, the microwave absorption abilities were mainly influenced by the resonance behavior of permittivity. Debye dipolar relaxation is an important mechanism for a dielectric loss material to attenuate microwaves. The relative complex permittivity εr can be expressed by the following equation:37,38
 | (3) |
 | (4) |
 | (5) |
According to eqn (4) and (5), the relationship between ε′ and ε′′ can be deduced.
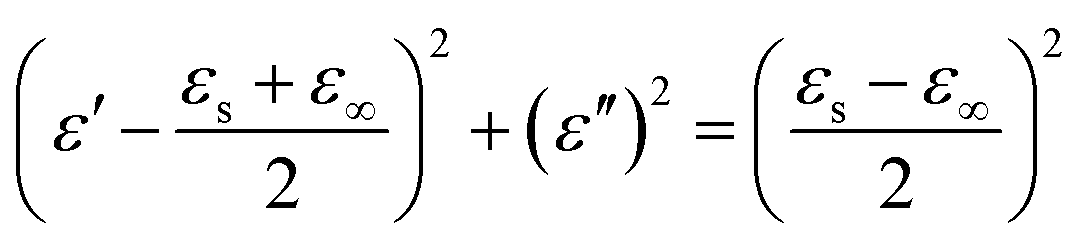 | (6) |
Thus, the plot of ε′ versus ε′′ would be a single semicircle, generally denoted as the Cole–Cole semicircle.39 Each semicircle corresponds to one Debye relaxation process. Fig. 7 shows the ε′–ε′′ curve of Ni@ZnS/paraffin (70%wt Ni/ZnS). It can be found five semicircles were found in the curve of the Ni@ZnS/paraffin composite, which represents the contribution of the Debye relaxation process to the enhanced dielectric properties of the Ni@ZnS/paraffin. However, the Cole–Cole semicircles are distorted, suggesting that besides the dielectric relaxation, other mechanisms such as the Maxwell–Wagner relaxation, electron polarization and dipolar polarization also existed in Ni@ZnS/paraffin.40 In Ni@ZnS composites, the existence of interfaces between Ni and ZnS gives rise to interfacial polarization.41 Interfacial polarization42,43 always occurs in materials comprised of more than one phase composites. This kind of polarization occurring at the interfaces is due to the migration of charge carriers through different phases of the composite material, which results in charge accumulation at the interfaces. When these charges are made to move by the application of an external electric field, the motion will be hampered at various points of the composite material differently, causing space charge to appear. During the activation of an electromagnetic wave, a redistribution process of charges occurs periodically between the Ni cores and ZnS nanowall shells. As a result, an additional interfacial relaxation core–shell interfaces is constructed. Moreover, the unique nanowall structures of ZnS shells also contribute to the microwave attenuation. Firstly, wall-like superstructures randomly distributed in the paraffin-matrix can exhibit multiple scattering and enhance the attenuation of the electromagnetic wave.44 Secondly, links between wall-like particles, which can generate continuous micronetworks and a large-scale vibrating microcurrent. The electromagnetic energy can consume in continuous networks.45
 | ||
| Fig. 7 (a) The ε′–ε′′ curve of the ZnS nanowall-coated Ni composite, (b) the value C0 (μ′′(μ′)−2f−1) of Ni/ZnS composite as a function of frequency. | ||
Generally, the magnetic loss of absorbing materials originates from hysteresis loss, domain wall displacement loss, eddy current loss and natural resonance. However, the hysteresis loss is negligible in weak applied field.46 The domain wall displacement loss takes place only in the MHz range rather than GHz, so the contribution of domain wall resonance can also be excluded.47 The eddy current loss is related to the diameter of particles (d) and the electric conductivity (σ), which can be expressed by48 μ′′ ≈ 2πμ0(μ′)2σd2f/3. In which f is the applied frequency, μ0 is the vacuum permeability. It is known from the above equation that, if magnetic loss only results from eddy current loss, the values of C0(C0 = μ′′(μ′)−2f−1 = 2πμ0σd2/3) should be constant varying frequency. In Ni/ZnS composite, the value of C0 exhibits strong fluctuation with increasing frequency in the whole range of 2–18 GHz (Fig. 7b). The suppression of eddy current loss is attributed to ZnS nanowall coating on the surface of Ni microspheres. Therefore, the magnetic loss in the present samples is caused mainly by the nature resonance and exchange resonance.
4. Conclusion
In summary, the ZnS nanowall-coated Ni composite have been successfully prepared by a hydrothermal method. The as-prepared Ni/ZnS composites exhibit crinkled and rough textures and the thickness of ZnS nanowall is around 10 nm. Compared with pure Ni and ZnS particles, the Ni@ZnS composites exhibit enhanced microwave absorption properties. The lowest reflection loss is −25.78 dB at 14.24 GHz and the effective absorption (below −10 dB) bandwidth reach 4.72 GHz (11.52–16.24 GHz) with the thickness of 2.7 mm. The position of absorption peaks almost remains the same at different thicknesses without shifting to lower frequency, which are attributed to natural resonance in permittivity. Our results demonstrate that the ZnS nanowall-coated Ni core–shell composites obtained in this work with thin thickness and wideband are attractive candidates for the new types of EM wave absorptive materials.Notes and references
- L. Chen, C. Lu, Y. Lu, Z. Fang, Y. Ni and Z. Xu, RSC Adv., 2013, 3, 3967 RSC.
- B. Zhao, B. Fan, G. Shao, B. Wang, X. Pian, W. Li and R. Zhang, Appl. Surf. Sci., 2014, 307, 293 CrossRef CAS PubMed.
- Z. Yu, N. Zhang, Z. Yao, X. Han and Z. Jiang, J. Mater. Chem. A, 2013, 1, 12462 CAS.
- P. Liu and Y. Huang, RSC Adv., 2013, 3, 19033 RSC.
- J. Jiang, D. Li, D. Geng, J. An, J. He, W. Liu and Z. Zhang, Nanoscale, 2014, 6, 3967 RSC.
- Z. Wang, L. Wu, J. Zhou, B. Shen and Z. Jiang, RSC Adv., 2013, 3, 3309 RSC.
- C. He, S. Qiu, X. Wang, J. Liu, L. Luan, W. Liu, M. Itoh and K.-i. Machida, J. Mater. Chem., 2012, 22, 22160 RSC.
- R. Kumar, A. P. Singh, M. Chand, R. P. Pant, R. K. Kotnala, S. K. Dhawan, R. B. Mathur and S. R. Dhakate, RSC Adv., 2014, 4, 23476 RSC.
- D. Sun, Q. Zou, Y. Wang, Y. Wang, W. Jiang and F. Li, Nanoscale, 2014, 6, 6557 RSC.
- G. Wang, Z. Gao, S. Tang, C. Chen, F. Duan, S. Zhao, S. Lin, Y. Feng, L. Zhou and Y. Qin, ACS Nano, 2012, 6, 11009–11017 CAS.
- G. Wang, Z. Gao, G. Wan, S. Lin, P. Yang and Y. Qin, Nano Res., 2014, 7, 704–716 CrossRef CAS PubMed.
- Y.-J. Chen, G. Xiao, T.-S. Wang, Q.-Y. Ouyang, L.-H. Qi, Y. Ma, P. Gao, C.-L. Zhu, M.-S. Cao and H.-B. Jin, J. Phys. Chem. C, 2011, 115, 13603 CAS.
- B. Wang, J. Zhang, T. Wang, L. Qiao and F. Li, J. Alloys Compd., 2013, 567, 21 CrossRef CAS PubMed.
- B. Zhao, G. Shao, B. Fan, W. Li, X. Pian and R. Zhang, Mater. Lett., 2014, 121, 118 CrossRef CAS PubMed.
- Y.-J. Chen, F. Zhang, G.-g. Zhao, X.-y. Fang, H.-B. Jin, P. Gao, C.-L. Zhu, M.-S. Cao and G. Xiao, J. Phys. Chem. C, 2010, 114, 9239 CAS.
- S. Yan, L. Zhen, C. Xu, J. Jiang and W. Shao, J. Phys. D: Appl. Phys., 2010, 43, 245003 CrossRef.
- Y.-J. Chen, P. Gao, R.-X. Wang, C.-L. Zhu, L.-J. Wang, M.-S. Cao and H.-B. Jin, J. Phys. Chem. C, 2009, 113, 10061 CAS.
- X. Liu, C. Feng, S. W. Or, Y. Sun, C. Jin, W. Li and Y. Lv, RSC Adv., 2013, 3, 14590 RSC.
- X. L. Dong, X. F. Zhang, H. Huang and F. Zuo, Appl. Phys. Lett., 2008, 92, 013127 CrossRef PubMed.
- H. Wang, H. Guo, Y. Dai, D. Geng, Z. Han, D. Li, T. Yang, S. Ma, W. Liu and Z. Zhang, Appl. Phys. Lett., 2012, 101, 083116 CrossRef PubMed.
- L. Xi, Z. Wang, Y. Zuo and X. Shi, Nanotechnology, 2011, 22, 045707 CrossRef PubMed.
- G. Tong, Q. Hu, W. Wu, W. Li, H. Qian and Y. Liang, J. Mater. Chem., 2012, 22, 17494 RSC.
- C. Gong, J. Zhang, X. Zhang, L. Yu, P. Zhang, Z. Wu and Z. Zhang, J. Phys. Chem. C, 2010, 114, 10101 CAS.
- T. Liu, P. Zhou, J. Xie and L. Deng, J. Appl. Phys., 2012, 111, 093905 CrossRef PubMed.
- X. G. Liu, J. J. Jiang, D. Y. Geng, B. Q. Li, Z. Han, W. Liu and Z. D. Zhang, Appl. Phys. Lett., 2009, 94, 053119 CrossRef PubMed.
- C. Yan and D. Xue, J. Phys. Chem. B, 2006, 110, 7102 CrossRef CAS PubMed.
- F. Gu, C. Z. Li, S. F. Wang and M. K. Lü, Langmuir, 2005, 22, 1329 CrossRef PubMed.
- G.-S. Wang, Y. Wu, Y.-Z. Wei, X.-J. Zhang, Y. Li, L.-D. Li, B. Wen, P.-G. Yin, L. Guo and M.-S. Cao, ChemPlusChem, 2014, 79, 375 CrossRef CAS.
- Y. Ren, C. Zhu, S. Zhang, C. Li, Y. Chen, P. Gao, P. Yang and Q. Ouyang, Nanoscale, 2013, 5, 12296 RSC.
- X. G. Liu, D. Y. Geng, H. Meng, P. J. Shang and Z. D. Zhang, Appl. Phys. Lett., 2008, 92, 173117 CrossRef PubMed.
- X. G. Liu, D. Y. Geng and Z. D. Zhang, Appl. Phys. Lett., 2008, 92, 243110 CrossRef PubMed.
- Y. Du, T. Liu, B. Yu, H. Gao, P. Xu, J. Wang, X. Wang and X. Han, Mater. Chem. Phys., 2012, 135, 884 CrossRef CAS PubMed.
- S. He, G.-S. Wang, C. Lu, J. Liu, B. Wen, H. Liu, L. Guo and M.-S. Cao, J. Mater. Chem. A, 2013, 1, 4685 CAS.
- J. R. Liu, M. Itoh and K.-i. Machida, Appl. Phys. Lett., 2003, 83, 4017 CrossRef CAS PubMed.
- E. R. Cooper, C. D. Andrews, P. S. Wheatley, P. B. Webb, P. Wormald and R. E. Morris, Nature, 2004, 430, 1012 CrossRef CAS PubMed.
- Z. H. Wang, L. W. Jiang, D. Li, J. J. Jiang, S. Ma, H. Wang, D. Y. Geng, J. An, J. He, W. Liu and Z. D. Zhang, J. Appl. Phys., 2014, 115, 17A527 CrossRef PubMed.
- B. Zhao, G. Shao, B. Fan, B. Sun, K. Guan and R. Zhang, J. Mater. Sci.: Mater. Electron., 2014, 25, 3614 CrossRef CAS PubMed.
- S. He, C. Lu, G.-S. Wang, J.-W. Wang, H.-Y. Guo and L. Guo, ChemPlusChem, 2014, 79, 569 CrossRef CAS.
- P. H. Fang, J. Chem. Phys., 1965, 42, 3411 CrossRef CAS PubMed.
- W. Pan, Q. Liu, R. Han, X. Chi and J. Wang, Appl. Phys. A, 2013, 113, 755 CrossRef CAS PubMed.
- N. Ortega, A. Kumar, R. Katiyar and C. Rinaldi, J. Mater. Sci., 2009, 44, 5127 CrossRef CAS.
- S. Wen, Y. Liu, X. Zhao, J. Cheng and H. Li, J. Magn. Magn. Mater., 2014, 354, 7 CrossRef CAS PubMed.
- Q. Liu, D. Zhang and T. Fan, Appl. Phys. Lett., 2008, 93, 013110 CrossRef PubMed.
- G. Tong, J. Yuan, W. Wu, Q. Hu, H. Qian, L. Li and J. Shen, CrystEngComm, 2012, 14, 2071 RSC.
- R. F. Zhuo, L. Qiao, H. T. Feng, J. T. Chen, D. Yan, Z. G. Wu and P. X. Yan, J. Appl. Phys., 2008, 104, 094101 CrossRef PubMed.
- M. Wu, Y. D. Zhang, S. Hui, T. D. Xiao, S. Ge, W. A. Hines, J. I. Budnick and G. W. Taylor, Appl. Phys. Lett., 2002, 80, 4404–4406 CrossRef CAS PubMed.
- S. Gangopadhyay, G. C. Hadjipanayis, B. Dale, C. M. Sorensen, K. J. Klabunde, V. Papaefthymiou and A. Kostikas, Phys. Rev. B: Condens. Matter Mater. Phys., 1992, 45, 9778–9787 CrossRef CAS.
- J. Guo, X. Wang, P. Miao, X. Liao, W. Zhang and B. Shi, J. Mater. Chem., 2012, 22, 11933–11942 RSC.
Footnote |
| † Electronic supplementary information (ESI) available. See DOI: 10.1039/c4ra08095e |
| This journal is © The Royal Society of Chemistry 2014 |