 Open Access Article
All near-infrared multiparametric luminescence thermometry using Er3+, Yb3+-doped YAG nanoparticles†
Jovana Perišaa,
Zoran Ristića,
Wojciech Piotrowski b,
Željka Antić
 a,
Lukasz Marciniak
 b and
Miroslav D. Dramićanin
 *a
*a
aVinča Institute of Nuclear Sciences – National Institute of the Republic of Serbia, University of Belgrade, P.O. Box 522, Belgrade 11001, Serbia. E-mail: dramican@vinca.rs
bInstitute of Low Temperature and Structure Research, Polish Academy of Sciences, Okólna 2, 50-422 Wroclaw, Poland
First published on 29th April 2021
Abstract
This paper presents four new temperature readout approaches to luminescence nanothermometry in spectral regions of biological transparency demonstrated on Yb3+/Er3+-doped yttrium aluminum garnet nanoparticles. Under the 10![[thin space (1/6-em)]](https://www.rsc.org/images/entities/char_2009.gif) 638 cm−1 excitation, down-shifting near infrared emissions (>10
638 cm−1 excitation, down-shifting near infrared emissions (>10![[thin space (1/6-em)]](https://www.rsc.org/images/entities/char_2009.gif) 000 cm−1) are identified as those originating from Yb3+ ions' 2F5/2 → 2F7/2 (∼9709 cm−1) and Er3+ ions' 4I13/2 → 4I15/2 (∼6494 cm−1) electronic transitions and used for 4 conceptually different luminescence thermometry approaches. Observed variations in luminescence parameters with temperature offered an exceptional base for studying multiparametric temperature readouts. These include the temperature-dependence of: (i) intensity ratio between emissions from Stark components of Er3+ 4I13/2 level; (ii) intensity ratio between emissions of Yb3+ (2F5/2 → 2F7/2 transition) and Er3+ (4I13/2 → 4I15/2 transition); (iii) band shift and bandwidth and (iv) lifetime of the Yb3+ emission (2F5/2 → 2F7/2 transition) with maximal sensitivities of 1% K−1, 0.8% K−1, 0.09 cm−1 K−1, 0.46% K−1 and 0.86% K−1, respectively. The multimodal temperature readout provided by this material enables its application in different luminescence thermometry setups as well as improved the reliability of the temperature sensing by the cross-validation between measurements.
000 cm−1) are identified as those originating from Yb3+ ions' 2F5/2 → 2F7/2 (∼9709 cm−1) and Er3+ ions' 4I13/2 → 4I15/2 (∼6494 cm−1) electronic transitions and used for 4 conceptually different luminescence thermometry approaches. Observed variations in luminescence parameters with temperature offered an exceptional base for studying multiparametric temperature readouts. These include the temperature-dependence of: (i) intensity ratio between emissions from Stark components of Er3+ 4I13/2 level; (ii) intensity ratio between emissions of Yb3+ (2F5/2 → 2F7/2 transition) and Er3+ (4I13/2 → 4I15/2 transition); (iii) band shift and bandwidth and (iv) lifetime of the Yb3+ emission (2F5/2 → 2F7/2 transition) with maximal sensitivities of 1% K−1, 0.8% K−1, 0.09 cm−1 K−1, 0.46% K−1 and 0.86% K−1, respectively. The multimodal temperature readout provided by this material enables its application in different luminescence thermometry setups as well as improved the reliability of the temperature sensing by the cross-validation between measurements.
Introduction
Luminescence thermometry may be exploited in many environments where other thermometry methods fail. It has prospective applications at cryogenic temperatures, in extremely high temperature settings, and even in harsh environments. It can be incredibly useful in the biomedical field since temperature plays a critical role in determining dynamics and properties of any biosystem.1 In medicine, the precise knowledge of tissue temperature is crucial for novel cancer treatments based on the induced heating of malignant cells.Still, in biological systems, it is quite difficult to assess noninvasively inter- or intra-cellular temperature by common thermometers. Temperature measurements based on the changes in luminescent properties of nanomaterials are considered as a promising route to meet these needs. As the temperature of the nanomaterial changes, its luminescence features such as emission intensity, decay and rise time, spectral band positions and bandwidths, spectral shapes, an emission polarization, may change, thus providing many different routes for remote temperature sensing. The readers are referred to several review and research articles for more information on the topic of luminescent nanothermometry2–6 and its biological applications.7–9
Besides the requirement of accurate distinguishing temperature fluctuations with thermal resolution below 1 K over a narrow temperature range (303 K–333 K), there are some additional constraints regarding the material considered for application in the biological systems. The light absorbance and scattering by tissue create limitations that need to be alleviated to ensure accurate and reliable temperature detection.10–13 Thus, the near-infrared (NIR) luminescence within the biological transparency windows (BW I: 15![[thin space (1/6-em)]](https://www.rsc.org/images/entities/char_2009.gif) 385–10
385–10![[thin space (1/6-em)]](https://www.rsc.org/images/entities/char_2009.gif) 526 cm−1; BW II: 10
526 cm−1; BW II: 10![[thin space (1/6-em)]](https://www.rsc.org/images/entities/char_2009.gif) 000–7407 cm−1; BW III: 6667–5405 cm−1), where light has its maximum depth of penetration in the tissue, is highly desirable to ensure the measurement accuracy.14,15
000–7407 cm−1; BW III: 6667–5405 cm−1), where light has its maximum depth of penetration in the tissue, is highly desirable to ensure the measurement accuracy.14,15
The ideal scenario for luminescence nanothermometry in the biological systems is the utilization of the all-NIR nanothermometers that can be excited in BW I and emit in BW II and/or BW III.14,16–22 Compared to traditional ones, these nanothermometers show several benefits that are reflected in the possibility of contactless, fast, and non-invasive temperature measurement, high spatial resolution and sensitivity, and simple luminescence signal detection.23–28
Because of their numerous advantages such as the presence of thermally coupled levels, long emission lifetimes, narrow emission bands and resilience to photodegradation, the lanthanide-doped inorganic materials are the most used type of thermographic phosphors.29–32 Among lanthanide dopants, erbium (Er3+) ion is a promising candidate for in vivo luminescence thermometry due to its intense emission in the spectral range that overlaps within BW I and BW III and absorption band in the BW I. However, the relatively low absorption cross-section of Er3+ in the BW I result in a weak emission efficiency. Therefore, to circumvent this limitation the Yb3+ co-dopant can be used, which is well known for its high absorption cross section at 10![[thin space (1/6-em)]](https://www.rsc.org/images/entities/char_2009.gif) 638 cm−1 as a sensitizer of Er3+ NIR luminescence.25,33–36
638 cm−1 as a sensitizer of Er3+ NIR luminescence.25,33–36
For this study, we have prepared luminescent nanothermometers based on yttrium aluminium garnet (Y3Al5O12, YAG) nanocrystals doped with Yb3+ and Er3+ using the modified Pechini method.37–39 YAG is well-known host material which possess high photo resistance, chemical stability, and ease of emission tuning.40
So far, Er3+ activated materials have been extensively used for the ratiometric luminescence thermometry in the visible spectral region which utilize the green emissions from 2H11/2 → 4I15/2 and 4S3/2 → 4I15/2 transitions25 with several recent attempts to exploit the intensity ratio of the blue 4F7/2 → 4I15/2 and green 4S3/2 → 4I15/2 emissions for higher sensitivity.5 The thermometry uses of the Er3+ emissions from thermally coupled excited levels in the near-infrared has only recently demonstrated by exploiting the ratio of 2H11/2 → 4I13/2 and 4S3/2 → 4I13/2 weak emissions in BW-I.14,41
The aim of this work was to investigate four completely new NIR temperature readouts based on Er3+ and Yb3+ emissions in BW-II excited by 10![[thin space (1/6-em)]](https://www.rsc.org/images/entities/char_2009.gif) 638 cm−1 radiation (BW I) over the wide temperature range (80–600 K). These include approaches to thermometry which exploit temperature-dependence of: (i) emission intensity ratio between Stark components of Er3+ 4I13/2 level (4I13/2 → 4I15/2 transition) in the BW III; (ii) emission intensity ratio between emissions of Yb3+ (2F5/2 → 2F7/2 transition) in the BW II and Er3+ (4I13/2 → 4I15/2 transition) in the BW III; (iii) band shift, (iv) bandwidth and (v) lifetime of the Yb3+ emission (2F5/2 → 2F7/2 transition, BW II).
638 cm−1 radiation (BW I) over the wide temperature range (80–600 K). These include approaches to thermometry which exploit temperature-dependence of: (i) emission intensity ratio between Stark components of Er3+ 4I13/2 level (4I13/2 → 4I15/2 transition) in the BW III; (ii) emission intensity ratio between emissions of Yb3+ (2F5/2 → 2F7/2 transition) in the BW II and Er3+ (4I13/2 → 4I15/2 transition) in the BW III; (iii) band shift, (iv) bandwidth and (v) lifetime of the Yb3+ emission (2F5/2 → 2F7/2 transition, BW II).
Materials and methods
Chemicals and samples synthesis
Herein, three samples with the following formula: Y2.7Yb0.3Al5O12 (YAG:10Yb), Y2.67Yb0.3Er0.03Al5O12 (YAG:10Yb1Er), Y2.64Yb0.3Er0.06Al5O12 (YAG:10Yb2Er) were synthesized via modified Pechini method. Metal nitrates (yttrium(III) nitrate hexahydrate, Y(NO3)3 × 6H2O; ytterbium(III) nitrate pentahydrate, Yb(NO3)3 × 5H2O; erbium(III)-nitrate pentahydrate, Er(NO3)3 × 5H2O; aluminium(III) nitrate nonahydrate, Al(NO3)3 × 9H2O; Alfa Aesar, purity 99.9%, 99.9%, 99.99+, 98+%, respectively); citric acid – CA (HOC(COOH)(CH2COOH)2, Sigma Aldrich, ACS reagent, ≥99.5%) and ethylene glycol – EG (HOCH2CH2OH, Sigma Aldrich, anhydrous, 99.8%) were used as starting materials without further purification.In a typical procedure, calculated amounts of metal nitrate precursors were added to the solution of citric acid in ethylene glycol (M![[thin space (1/6-em)]](https://www.rsc.org/images/entities/char_2009.gif) :
:![[thin space (1/6-em)]](https://www.rsc.org/images/entities/char_2009.gif) CA
CA![[thin space (1/6-em)]](https://www.rsc.org/images/entities/char_2009.gif) :
:![[thin space (1/6-em)]](https://www.rsc.org/images/entities/char_2009.gif) EG = 1
EG = 1![[thin space (1/6-em)]](https://www.rsc.org/images/entities/char_2009.gif) :
:![[thin space (1/6-em)]](https://www.rsc.org/images/entities/char_2009.gif) 5
5![[thin space (1/6-em)]](https://www.rsc.org/images/entities/char_2009.gif) :
:![[thin space (1/6-em)]](https://www.rsc.org/images/entities/char_2009.gif) 25) and stirred at 353 K for 30 minutes. After increasing temperature to 493 K, stirring was continued until the brownish gel was obtained. The obtained gels were transferred into the alumina crucible and placed into the furnace at 873 K for 2 hours, followed by annealing at 1373 K for 2 hours. The powder samples obtained after the annealing were cooled down to room temperature and ground in a mortal.
25) and stirred at 353 K for 30 minutes. After increasing temperature to 493 K, stirring was continued until the brownish gel was obtained. The obtained gels were transferred into the alumina crucible and placed into the furnace at 873 K for 2 hours, followed by annealing at 1373 K for 2 hours. The powder samples obtained after the annealing were cooled down to room temperature and ground in a mortal.
Characterisation methods and instrumentation
Crystal structure of the powder was studied by X-ray diffractometer (XRD) from Rigaku SmartLab (Cu-Kα1, 2 radiation, λ = 0.1540 nm) at room temperature. The measurement was recorded over the 10°–90° 2θ-range, with 0.02° step size and 1° min−1 counting time. Relevant results of the structural analysis were obtained using built-in PDXL2 package software. The morphology of the samples was characterized by a field emission gun TESCAN MIRA3 scanning electron microscope. Before the observation, the samples were coated with a thin layer of Au using a standard sputtering technique (Polaron SC502 – Fison Instruments, UK). Diffuse reflectance spectral measurements were performed on the Thermo Evolution 600 spectrometer equipped with an integrated sphere, using BaSO4 as a blank. Transmission electron microscope images were obtained using a TEM Philips CM-20 SuperTwin operating at 160 kV with an optical resolution of 0.25 nm. The temperature of the sample was controlled using a THMS 600 heating–cooling stage from Linkam (0.1 K temperature stability and 0.1 K set point resolution). The temperature range in which both the temperature-dependent emission spectra and luminescent lifetime were recorded was from 80 K to 600 K. The emission spectra were measured using the 10![[thin space (1/6-em)]](https://www.rsc.org/images/entities/char_2009.gif) 638 cm−1 (940 nm) excitation line from a laser diode (LD) and a FLS1000 Fluorescence Spectrometer from Edinburgh Instruments (0.1 nm spectral resolution). Luminescence decay profiles were recorded using FLS1000 Fluorescence Spectrometer from Edinburgh Instruments with μFlash lamp as an excitation source and the signal was detected using a R928P side window photomultiplier tube from Hamamatsu. Temperature-dependent luminescent lifetime was controlled using the abovementioned heating-cooling stage from Linkam.
638 cm−1 (940 nm) excitation line from a laser diode (LD) and a FLS1000 Fluorescence Spectrometer from Edinburgh Instruments (0.1 nm spectral resolution). Luminescence decay profiles were recorded using FLS1000 Fluorescence Spectrometer from Edinburgh Instruments with μFlash lamp as an excitation source and the signal was detected using a R928P side window photomultiplier tube from Hamamatsu. Temperature-dependent luminescent lifetime was controlled using the abovementioned heating-cooling stage from Linkam.
Luminescence thermometry
Temperature-dependant (80–600 K) photoluminescent emission measurements are performed under 10![[thin space (1/6-em)]](https://www.rsc.org/images/entities/char_2009.gif) 638 cm−1 excitation (BW I) in both steady-state (10
638 cm−1 excitation (BW I) in both steady-state (10![[thin space (1/6-em)]](https://www.rsc.org/images/entities/char_2009.gif) 000–6250 cm−1 spectral range; BW II and III) and time-resolved domain (emission decays recorded around 9709 cm−1, BW II). The observed variations of luminescence with temperature offer an exceptional base for studying the multiple temperature readouts. To describe the quality and potential use of thermometer the important quantities of absolute (SA) and relative sensitivity (SR) are introduced as:
000–6250 cm−1 spectral range; BW II and III) and time-resolved domain (emission decays recorded around 9709 cm−1, BW II). The observed variations of luminescence with temperature offer an exceptional base for studying the multiple temperature readouts. To describe the quality and potential use of thermometer the important quantities of absolute (SA) and relative sensitivity (SR) are introduced as:
 | (1) |
 | (2) |
The luminescence intensity ratio (LIR), the most frequently exploited luminescent thermometry temperature readout method, was tested both by using high and low energy Stark components of Er3+ emission or by using the combination of Yb3+ and Er3+ emissions.
The first temperature indicator LIREr/Er is defined as the ratio of integrated emission intensities from high-energy and low-energy emissions of the Er3+ 4I13/2 → 4I15/2 transition that should obey Boltzmann law:
 | (3) |
 | (4) |
Based on eqn (1)–(3), the values of SA and SR are then calculated.
On the other hand, for the other LIR that utilizes both Yb3+ and Er3+, Boltzmann model emissions is not applicable, thus a semi empirical approach is applied to characterize thermometer performance.
Readouts based on the temperature-induced variations in the band-shift and bandwidth can be described and fitted by integral equations proposed by McCumber and Sturge42 and Yen et al.:43
 | (5) |
 | (6) |
In the equations above, θD represents the Debye temperature of the host material, t = θD/T, α and ![[small alpha, Greek, macron]](https://www.rsc.org/images/entities/char_e0c2.gif) are the electron–phonon coupling coefficients for the line-shift and line-broadening, respectively, and Einh is the value of the inhomogeneous linewidth.
are the electron–phonon coupling coefficients for the line-shift and line-broadening, respectively, and Einh is the value of the inhomogeneous linewidth.
Finally, emission lifetime was used on Yb3+ line as another read out approach to temperature sensing. Since the standard formulas for lifetime quenching with temperature44,45 cannot describe the temperature behaviour in these samples, a semi-empirical approach is proposed to fit the experimental data.
Results and discussion
Structural and morphological characterization
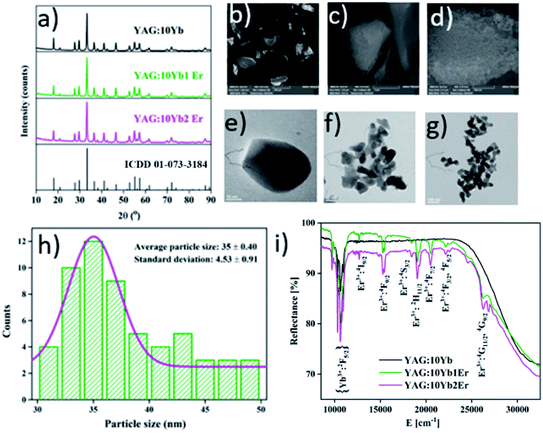
X-ray powder diffraction patterns of the YAG:10Yb, YAG:10Yb1Er and YAG:10Yb2Er samples presented in Fig. 1a correspond to body-centred cubic structure with Ia![[3 with combining macron]](https://www.rsc.org/images/entities/char_0033_0304.gif) d (230) space group (ICDD card no. 01-073-3184). No other phases were detected indicating that the Yb3+ and Er3+ dopant ions have been effectively incorporated into the YAG host lattice due to the equal valence (+3) and similar ionic radii between the Y3+ (0.107 nm) and Yb3+ (0.104 nm) and Er3+ (0.106 nm) ions.46 Additionally, the Rietveld refinement method was used to determine mean crystallite size of powder particles and the relevant structural parameters. The starting parameters for the analysis were taken according to the ref. 47 and the results are summarized in Table S1 in the ESI.†
d (230) space group (ICDD card no. 01-073-3184). No other phases were detected indicating that the Yb3+ and Er3+ dopant ions have been effectively incorporated into the YAG host lattice due to the equal valence (+3) and similar ionic radii between the Y3+ (0.107 nm) and Yb3+ (0.104 nm) and Er3+ (0.106 nm) ions.46 Additionally, the Rietveld refinement method was used to determine mean crystallite size of powder particles and the relevant structural parameters. The starting parameters for the analysis were taken according to the ref. 47 and the results are summarized in Table S1 in the ESI.†
Scanning electron microscopy was performed to investigate surface morphology and micrographs of the representative YAG:10Yb1Er sample taken under different magnifications are shown in Fig. 1b–d. At the micron-level, the morphology of representative sample appears as a combination of different size chunks, while at the nano-level it is clearly visible that the chunks are dense and composed of spherical particles bellow 50 nm in size.
Fig. 1e–g show transmission electron microscopy images of the YAG:10Yb1Er sample recorded under different magnifications, along with the histogram showing particle size distribution (Fig. 1h). The powder consists of a sphere-like shaped nanoparticles of 35 nm in diameter on average.
UV-vis-NIR diffuse reflectance spectra of YAG:10Yb, YAG:10Yb1Er and YAG:10Yb2Er powder samples recorded at room temperature are presented in Fig. 1i. The absorption bands in the short wavelength range correspond to the Er3+ absorptions from the 4I15/2 level to different excited levels: 4G11/2/4G9/2 (26![[thin space (1/6-em)]](https://www.rsc.org/images/entities/char_2009.gif) 525 cm−1), 4F3/2/4F5/2 (22
525 cm−1), 4F3/2/4F5/2 (22![[thin space (1/6-em)]](https://www.rsc.org/images/entities/char_2009.gif) 173 cm−1), 4F7/2 (20
173 cm−1), 4F7/2 (20![[thin space (1/6-em)]](https://www.rsc.org/images/entities/char_2009.gif) 534 cm−1), 2H11/2 (19
534 cm−1), 2H11/2 (19![[thin space (1/6-em)]](https://www.rsc.org/images/entities/char_2009.gif) 048 cm−1), 4S3/2 (18
048 cm−1), 4S3/2 (18![[thin space (1/6-em)]](https://www.rsc.org/images/entities/char_2009.gif) 484 cm−1) 4F9/2 (15
484 cm−1) 4F9/2 (15![[thin space (1/6-em)]](https://www.rsc.org/images/entities/char_2009.gif) 267 cm−1), 4I9/2 (12
267 cm−1), 4I9/2 (12![[thin space (1/6-em)]](https://www.rsc.org/images/entities/char_2009.gif) 690 cm−1). The absorption band visible at the long wavelengths, from 10
690 cm−1). The absorption band visible at the long wavelengths, from 10![[thin space (1/6-em)]](https://www.rsc.org/images/entities/char_2009.gif) 870 to 9524 cm−1 is due to the Yb3+ 2F7/2 → 2F5/2 transition.48–50 Considering that the BW I end at 10
870 to 9524 cm−1 is due to the Yb3+ 2F7/2 → 2F5/2 transition.48–50 Considering that the BW I end at 10![[thin space (1/6-em)]](https://www.rsc.org/images/entities/char_2009.gif) 526 cm−1, YAG
526 cm−1, YAG![[thin space (1/6-em)]](https://www.rsc.org/images/entities/char_2009.gif) :
:![[thin space (1/6-em)]](https://www.rsc.org/images/entities/char_2009.gif) Yb3+, Er3+ can be effectively excited with 10
Yb3+, Er3+ can be effectively excited with 10![[thin space (1/6-em)]](https://www.rsc.org/images/entities/char_2009.gif) 638 cm−1 radiation without heating the biological environment.51
638 cm−1 radiation without heating the biological environment.51
Temperature readout using the intensity ratio of emissions from high and low energy Stark components of Er3+
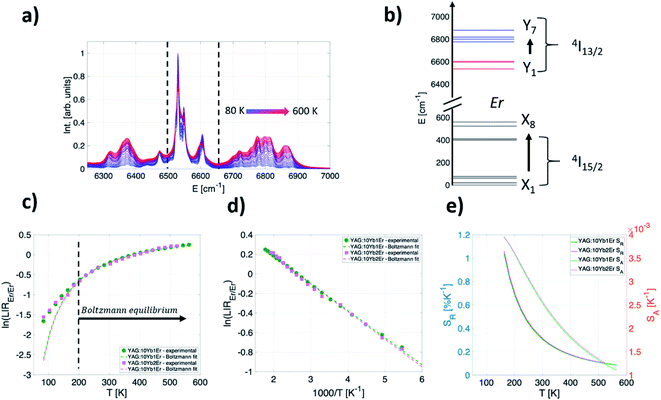
Fig. 2a shows the normalized emission band from Er3+ 4I13/2 → 4I15/2 transition that spans 6200–7000 cm−1 measured over the 80–600 K range under 10![[thin space (1/6-em)]](https://www.rsc.org/images/entities/char_2009.gif) 638 cm−1 excitation (YAG:10Yb1Er sample). This band comprises emissions from multiple transitions between 7 high-energy Stark components of 4I13/2 level and 8 low-energy Stark components of 4I15/2 level, Fig. 2b.
638 cm−1 excitation (YAG:10Yb1Er sample). This band comprises emissions from multiple transitions between 7 high-energy Stark components of 4I13/2 level and 8 low-energy Stark components of 4I15/2 level, Fig. 2b.
Fig. 2c shows experimental results obtained for YAG:10Yb1Er and YAG:10Yb2Er samples while Fig. 2d presents the ln(LIREr/Er) vs. 1/T plot in the temperature range where experimental data follow the Boltzmann distribution relation (T > 160 K). Based on the linear fit to eqn (4) (dashed lines in Fig. 2d), ΔE of 192 cm−1 and 196 cm−1 were obtained for the YAG:10Yb1Er and YAG:10Yb2Er samples, respectively. The obtained ΔE values are in good agreement with the energy separation between low and high energy 4I13/2 Stark levels.52
For the LIREr/Er in the temperature range where the thermalization is a dominant thermally dependent process responsible for the intensity ratio changes, SA and SR can be calculated from eqn (1)–(3). As seen from their graphical representation (Fig. 2e), both absolute and relative sensitivities decrease with temperature with the highest SA and SR values of approximately 4 × 10⁻³ K−1 and 1% K−1 at 160 K for both samples.
Therefore, this temperature readout provides excellent sensitivity for low-temperature measurements. In the physiological relevant temperature range (303–333 K), the readout shows moderate relative sensitivity of around 0.3% K−1 at 310 K.
Temperature readout using the intensity ratio of Yb3+ and Er3+ emissions
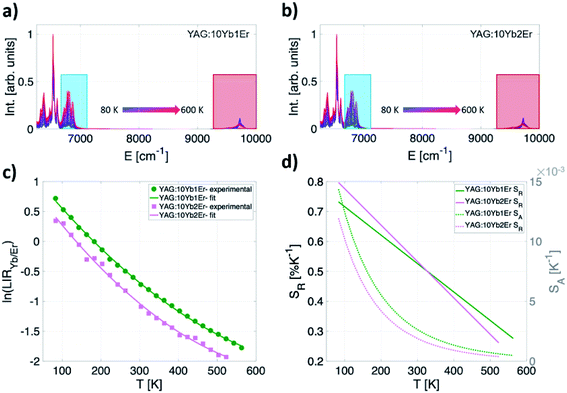
Photoluminescent emission spectra of YAG:10Yb1Er and YAG:10Yb2Er samples recorded in 80–600 K temperature range are presented in Fig. 3a and b. Under the 10![[thin space (1/6-em)]](https://www.rsc.org/images/entities/char_2009.gif) 638 cm−1 excitation (BW I), emissions are identified as those originating from the 2F5/2 → 2F7/2 electronic transition of Yb3+ (around 9710 cm−1, BW II, IYb) and the 4I13/2 → 4I15/2 of Er3+ (around 6494 cm−1, BW III, IEr).
638 cm−1 excitation (BW I), emissions are identified as those originating from the 2F5/2 → 2F7/2 electronic transition of Yb3+ (around 9710 cm−1, BW II, IYb) and the 4I13/2 → 4I15/2 of Er3+ (around 6494 cm−1, BW III, IEr).
The second thermometric parameter considered in this work, LIRYb/Er, utilizes their emission intensities ratio defined as:
 | (7) |
The experimentally obtained LIRYb/Er values for both samples are presented in Fig. 3c while the temperature dependences of the individual emissions are given in the ESI (Fig. S1†). For calibration, a semiempirical quadratic equation is found as the most suitable for the fitting of ln(LIRYb/Er) vs. T dependence (dashed lines on Fig. 3c):
| ln(LIRYb/Er) = a1T2 + a2T + a3, | (8) |
The interesting point to highlight here is that the LIRYb/Er is applicable in the whole investigated temperature range from cryogenic temperatures (80 K) up to remarkably high temperatures (600 K) with both SA and SR reaching the highest values at cryogenic temperatures. The maximum relative sensitivity of 0.8% K−1 at 80 K is obtained for the YAG:10Yb2Er sample. In the physiological relevant temperature range (303–333 K), this readout also shows moderate relative sensitivity of around 0.5% K−1 at 310 K.
One should note that high energy Stark components' emission of the Er3+ 4I13/2 level was used as a representative due to its large temperature sensitivity and, therefore, the highest relative sensitivity that can be obtained. Calculations based on overall Er3+ emission is given in ESI as Fig. S2.†
The Yb3+ ions bandshift and bandwidth change as thermometric parameters
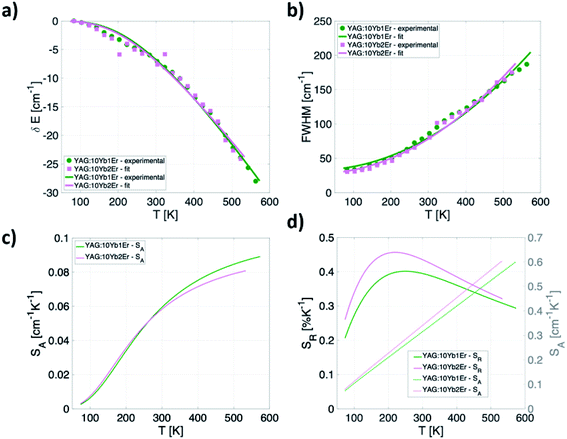
Apart from the two LIR based temperature readout modes, another two thermometric parameters arise by considering only Yb3+ emission band (2F5/2 → 2F7/2 transition): (a) significant temperature-dependant redshift of the band maximum and (b) temperature-dependant band broadening (Fig. 4a). To investigate the thermally induced change of its position and full width half maximum (FWHM) change, the fit of the Yb3+ peak by the Voigt line profile was implemented (Fig. 4b).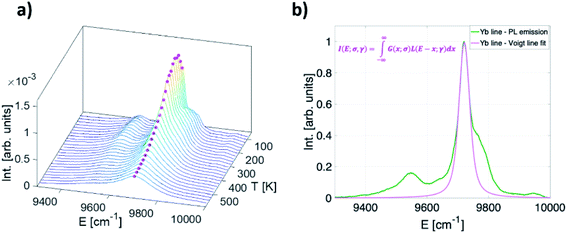 | ||
| Fig. 4 (a) Temperature-dependant (80–600 K) photoluminescence emission spectra of Yb3+ in representative YAG:10Yb1Er (b) a Voigt line profile. | ||
The Voigt line form was chosen since it represents the convolution of Gaussian (G (x; σ)) and Lorentzian (L (x; γ)) line profiles hence being suitable to characterise the PL line shapes both at low and high temperatures:
 | (9) |
The fitting of experimental data to eqn (5) and (6) provided values of θD = 1092 cm−1, α = −347 cm−1, ![[small alpha, Greek, macron]](https://www.rsc.org/images/entities/char_e0c2.gif) = 81 cm−1, Einh = 33 cm−1 and θD = 999 cm−1, α = −287 cm−1,
= 81 cm−1, Einh = 33 cm−1 and θD = 999 cm−1, α = −287 cm−1, ![[small alpha, Greek, macron]](https://www.rsc.org/images/entities/char_e0c2.gif) = 88 cm−1, Einh = 28 cm−1, for YAG:10Yb1Er and YAG:10Yb2Er samples, respectively.
= 88 cm−1, Einh = 28 cm−1, for YAG:10Yb1Er and YAG:10Yb2Er samples, respectively.
Based on these fits, absolute sensitivities can be calculated for both samples for the bandshift (Fig. 5c) as well as for the FWHM (Fig. 5d). Relative sensitivity is also calculated and presented for the FWHM approach showing relatively high values for this type of measurements over the entire investigated temperature range having maximum of 0.46% K−1 at 210 K obtained for the YAG:10Yb2Er sample (Fig. 5d). The SR values for the band-shift readout are not presented since that can be a deceptive result, and it is in fact the SA with maximum of 0.09 cm−1 K−1 at 575 K for the YAG:10Yb1Er sample represents more important figure of merit that limits temperature resolution. In the physiological relevant temperature range (303–333 K), this readout shows sensitivity of around 0.06 cm−1 K−1 at 310 K that may be considered as a good value when compared to the bandshift of other Ln3+ activated phosphors used for luminescence thermometry, Table 1.
Readout based on the kinetics of the 2F5/2 state of Yb3+ ions
Finally, the methodology for the last temperature readout mode is based on the measurements of the Yb3+ emission lifetime. Here, the temperature dependence of the lifetime for both Yb3+/Er3+ co-doped samples (YAG:10Yb1Er and YAG:10Yb2Er) as well as for the sample singly doped with Yb3+ (YAG:10Yb) are presented in the Fig. 6a.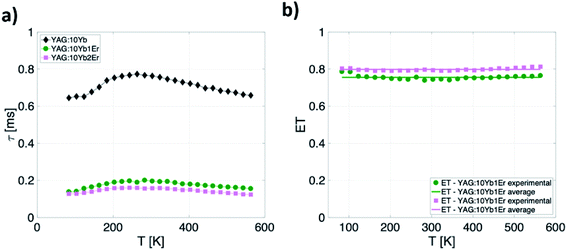 | ||
| Fig. 6 (a) Temperature dependence of the 2F5/2 lifetime for YAG:10Yb1Er, YAG:10Yb2Er and YAG:10Yb samples and (b) temperature-dependence of Yb3+ → Er3+ energy transfer. | ||
As can be seen, when co-doped with Er3+ ions, Yb3+ 2F5/2 → 2F7/2 emission lifetimes are significantly suppressed. The suppression of the lifetime indicates well known energy transfer (ET) process between Yb3+ and Er3+ ions. As a measure of the transfer, a value of relative change in the lifetime of Yb3+/Er3+ doped samples compared to only Yb3+ doped one can be used and energy transfer is calculated in accordance with:
 | (10) |
Considering the temperature independence of energy transfer process, the thermal evolution of the 2F5/2 lifetime for both YAG:10Yb1Er and YAG:10Yb2Er samples was measured and the results are presented in Fig. 7a. Observed unusual rise followed by the drop in the lifetime values can be contributed to the self-trapping mechanism known to exist in YAG: Yb3+.56 Semi-empirical formula was proposed to fit the experimental data (full lines on the Fig. 7a):
 | (11) |
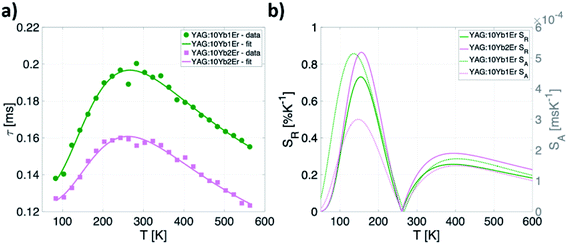 | ||
| Fig. 7 (a) Temperature dependence of emission lifetime values and (b) calculated absolute and relative sensitivities for YAG:10Yb1Er and YAG:10Yb2Er samples. | ||
This semiempirical model (eqn (11)) provided the fitting parameters for YAG:10Yb1Er and YAG:10Yb2Er of τ0 = 131 μs, C1 = 6.202, ΔE1 = 604 cm−1, C2 = 3.381, ΔE2 = 253 cm−1 and τ0 = 124 μs, C1 = 7.330, ΔE1 = 648 cm−1, C2 = 3091, ΔE2 = 309 cm−1, respectively, Fig. 7b represents calculated SA and SR for both samples.
Due to the nonmonotonic dependence of the lifetime on temperature, two separate, non-overlapping temperature ranges of application are possible. The first application window covers temperatures from 80 K to 260 K with maximum relative sensitivity of 0.86% K−1 at 160 K for YAG:10Yb2Er sample.
Second window covers the temperatures above 260 K showing the maximum relative sensitivity around 390 K with value of 0.32% K−1 and around 0.23% K−1 in the physiological temperature range for the YAG:10Yb2Er sample.
The values of maximal relative sensitivities and sensitivities in the physiological temperature range obtained by investigated all NIR temperature readouts are summarized in Table 2.
| Readout | SRmax (% K−1) | SR (% K−1)@310 K | ||
|---|---|---|---|---|
| YAG10Yb1Er | YAG10Yb2Er | YAG10Yb1Er | YAG10Yb2Er | |
| LIREr/Er | 1@163 K | 1@163 K | 0.3 | 0.3 |
| LIRYb/Er | 0.73@83 K | 0.80@83 K | 0.5 | 0.5 |
| FWHM | 0.40@249 K | 0.46@201 K | 0.39 | 0.43 |
| LT | 0.73@154 K | 0.86@156 K | 0.19 | 0.23 |
The reproducibility of temperature:
 | (12) |
Conclusion
Beside conventional Er3+-based LIR methods that utilize visible emissions, the Er3+ activator emissions can be exploited for the luminescence thermometry in biological transparency windows alone or in combination with Yb3+ emission. The small energy difference between Stark components of the Er 4I13/2 levels is reflected in moderate but sufficient values of the readout sensitivities in the physiological temperature range. On the other hand, the small energy difference is beneficial for LIR thermometry since it ensures thermalization between energy levels over the wide temperature range. The good sensitivities at low temperatures open possibilities for the sensitive thermometry especially in environments compromised by visible background absorption, scattering and luminescence. Since temperature can be measured by four different approaches, all utilizing NIR excitation and emissions, it is possible to employ any existing temperature readout scheme, and to exploit the multi-readout approach with two or more combined readouts to improve precision and reliability of measurements. When compared to intensities of up-conversion emissions that are most used for the Er3+ luminescence thermometry, the downshifting emissions exploited here in all 4 readout approaches are of considerably higher intensities which presents an additional benefit to thermometry.Author contributions
Conceptualization, M. D. Dramićanin; data curation, J. Periša, W. Piotrowski.; formal analysis, J. Periša, Z. Ristić, W. Piotrowski, Ž. Antić, L. Marciniak, M. D. Dramićanin; visualization, J. Periša, Z. Ristić, L. Marciniak; methodology, M. D. Dramićanin, L. Marciniak, Ž. Antić; writing-original draft, J. Periša, Z. Ristić, Ž. Antić; writing-review and editing, M. D. Dramićanin, L. Marciniak.Conflicts of interest
There are no conflicts to declare.Acknowledgements
This research was funded by the European Union's Horizon 2020 FET-Open project NanoTBtech (grant agreement No.: 801305). Authors from Serbia would like to acknowledge the funding from the Ministry of Education, Science and Technological Development of the Republic of Serbia.References
- M. Dramićanin, Luminescence Thermometry, Elsevier Science, Cambridge, United Kingdom, 1st edn, 2018, pp. 113–157 Search PubMed.
- D. Jaque and F. Vetrone, Nanoscale, 2012, 4, 4301 RSC.
- C. D. S. Brites, S. Balabhadra and L. D. Carlos, Adv. Opt. Mater., 2019, 7, 1801239 CrossRef.
- M. Dramićanin, J. Appl. Phys., 2020, 128, 040902 CrossRef.
- X. Lin, M. Kong, N. Wu, Y. Gu, X. Qiu, X. Chen, Z. Li, W. Feng and F. Li, ACS Appl. Mater. Interfaces, 2020, 12, 52393–52401 CrossRef CAS PubMed.
- M. Quintanilla and L. M. Liz-Marzán, Nano Today, 2018, 19, 126–145 CrossRef CAS.
- M. Tan, F. Li, N. Cao, H. Li, X. Wang, C. Zhang, D. Jaque and G. Chen, Small, 2020, 2004118 CrossRef CAS PubMed.
- J. Zhou, B. del Rosal and D. Jaque, Nat. Methods, 2020, 17, 967–980 CrossRef CAS PubMed.
- B. del Rosal, E. Ximendes, U. Rocha and D. Jaque, Adv. Opt. Mater., 2016, 5, 1600508 CrossRef.
- M. Suta, Ž. Antić, V. Ðorđević, S. Kuzman, M. D. Dramićanin and A. Meijerink, Nanomaterials, 2020, 10, 543 CrossRef CAS PubMed.
- X. Xu, Z. Wang, P. Lei, Y. Yu, S. Yao, S. Song, X. Liu, Y. Su, L. Dong, J. Feng and H. Zhang, ACS Appl. Mater. Interfaces, 2015, 7, 20813–20819 CrossRef CAS PubMed.
- A. M. Smith, M. C. Mancini and S. Nie, Nat. Nanotechnol., 2009, 4, 710 CrossRef CAS PubMed.
- E. Hemmer, A. Benayas, F. Légaré and F. Vetrone, Nanoscale Horiz., 2016, 1, 168 RSC.
- A. M. Kaczmarek, M. Suta, H. Rijckaert, A. Abalymov, I. Van Driessche, A. G. Skirtach, A. Meijerink and P. Van Der Voort, Adv. Funct. Mater., 2020, 30, 2003101 CrossRef CAS.
- S. He, J. Song, J. Qu and Z. Cheng, Chem. Soc. Rev., 2018, 47, 4258 RSC.
- E. Hemmer, N. Venkatachalam, H. Hyodo, A. Hattori, Y. Ebina, H. Kishimoto and K. Soga, Nanoscale, 2013, 5, 11339–11361 RSC.
- I. E. Kolesnikov, A. A. Kalinichev, M. A. Kurochkin, E. V. Golyeva, E. Yu Kolesnikov, A. V. Kurochkin, E. Lahderanta and M. D. Mikhailov, Sci. Rep., 2017, 7, 18002 CrossRef CAS PubMed.
- M. Kamimura, T. Matsumoto, S. Suyari, M. Umezawa and K. Soga, J. Mater. Chem. B, 2017, 5, 1917–1925 RSC.
- I. Porosnicu, C. Colbea, F. Baiasu, M. Lungu, M. Cosmin Istrate, D. Avram and C. Tiseanu, Methods Appl. Fluoresc., 2020, 8, 035005 CrossRef CAS PubMed.
- M. Ji, Z. Fu, G. Liu, Z. Sun, P. Li, A. Zhang, F. Lin, B. Hou and G. Chen, Adv. Opt. Mater., 2020, 1901173 CrossRef.
- W. Xu, Y. Hu, L. Zheng, Z. Zhang, W. Cao, H. Liu and X. Wu, J. Lumin., 2019, 208, 415–423 CrossRef CAS.
- L. Marciniak, A. Bednarkiewicz and K. Elzbieciak, J. Mater. Chem. C, 2018, 6, 7568–7575 RSC.
- L. Marciniak, K. Prorok, A. Bednarkiewicz, A. Kowalczyk, D. Hreniak and W. Strek, J. Lumin., 2016, 176, 144–148 CrossRef CAS.
- C. Hazra, A. Skripka, S. J. L. Ribeiro and F. Vetrone, Adv. Opt. Mater., 2020, 8, 2001178 CrossRef CAS.
- M. D. Dramićanin, Methods Appl. Fluoresc., 2016, 4, 042001 CrossRef PubMed.
- W. Piotrowski, K. Trejgis, K. Maciejewska, K. Ledwa, B. Fond and L. Marciniak, ACS Appl. Mater. Interfaces, 2020, 12, 44039–44048 CrossRef CAS PubMed.
- A. Bednarkiewicz, L. Marciniak, L. D. Carlos and D. Jaque, Nanoscale, 2020, 12, 14405–14421 RSC.
- P. Cortelletti, A. Skripka, C. Facciottia, M. Pedroni, G. Caputo, N. Pinna, M. Quintanilla, A. Benayas, F. Vetrone and A. Speghini, Nanoscale, 2018, 10, 2568–2576 RSC.
- S. Goderski, M. Runowski, P. Woźny, V. Lavín and S. Lis, ACS Appl. Mater. Interfaces, 2020, 12, 40475–40485 CrossRef CAS PubMed.
- M. Runowski, N. Stopikowska, D. Szeremeta, S. Goderski, M. Skwierczyńska and S. Lis, ACS Appl. Mater. Interfaces, 2019, 11, 13389–13396 CrossRef CAS PubMed.
- C. D. S. Brites, A. Millán and L. D. Carlos, Chapter 281-Lanthanides in Luminescent Thermometry, in Handbook on the Physics and Chemistry of Rare Earths, ed. B. Jean-Claude and K. Pecharsky Vitalij, Elsevier, 2016, vol. 49, pp. 339–427 Search PubMed.
- M. Runowski, A. Shyichuk, A. Tymiński, T. Grzyb, V. Lavín and S. Lis, ACS Appl. Mater. Interfaces, 2018, 10, 17269–17279 CrossRef CAS PubMed.
- M. Runowski, S. Goderski, D. Przybylska, T. Grzyb, S. Lis and I. R. Martín, ACS Appl. Nano Mater., 2020, 3, 6406–6415 CrossRef CAS.
- E. C. Ximendes, U. Rocha, T. O. Sales, N. Fernández, F. Sanz-Rodríguez, I. R. Martín, C. Jacinto and D. Jaque, Adv. Funct. Mater., 2017, 27, 1702249 CrossRef.
- D. Avram, I. Tiseanu, B. S. Vasile and C. Tiseanu, Sci. Rep., 2018, 8, 18033 CrossRef PubMed.
- M. Haase and H. Schafer, Angew. Chem., Int. Ed., 2011, 50, 5808–5829 CrossRef CAS PubMed.
- D. Hreniak and W. Strk, J. Alloys Compd., 2002, 341, 183–186 CrossRef CAS.
- M. P. Pechini, US Pat. 3330697, 1967.
- A. V. Belyakov and N. A. Kulikov, Refract. Ind. Ceram., 2011, 52, 61–62 CrossRef CAS.
- A. Jain, P. Sengar and G. A. Hirata, J. Phys. D: Appl. Phys., 2018, 51, 303002 CrossRef.
- A. Ćirić, J. Aleksić, T. Barudžija, Ž. Antić, V. Đorđević, M. Medić, J. Periša, I. Zeković, M. Mitrić and M. D. Dramićanin, Nanomaterials, 2020, 10, 627 CrossRef PubMed.
- D. E. McCumber and M. D. Sturge, J. Appl. Phys., 1963, 34, 1682–1684 CrossRef CAS.
- W. M. Yen and W. C. Scott, Phys. Rev. [Sect.] A, 1964, 136, A271–A283 CrossRef.
- C. C. Klick and J. H. Schulman, Luminescence in Solids, in Solid State Physics, ed. F. Seitz and D. Turnbull, Academic Press, 1957, vol. 5, pp. 97–172 Search PubMed.
- T. Senden, R. J. A. van Dijk-Moes and A. Meijerink, Light: Sci. Appl., 2018, 7, 8 CrossRef PubMed.
- R. D. Shannon, Acta Crystallogr., Sect. A: Cryst. Phys., Diffr., Theor. Gen. Crystallogr., 1976, A32, 751–767 CrossRef CAS.
- D. Rodic, M. Mitric, R. Tellgren and H. J. Rundlof, J. Magn. Magn. Mater., 2001, 232, 1 CrossRef CAS.
- J. Periša, J. Papan, S. D. Dolić, D. J. Jovanović and M. D. Dramićanin, Dyes Pigm., 2018, 155, 233–240 CrossRef.
- I. O. Vorona, R. P. Yavetskiy, A. G. Doroshenko, S. V. Parkhomenko, V. N. Baumer, A. V. Tolmachev, D. Yu Kosyanov, V. I. Vovna, V. G. Kuryavyi, M. Greculeasa, L. Gheorghe, S. Hau, C. Gheorghe and G. Croitoru, J. Eur. Ceram. Soc., 2017, 37, 4115–4122 CrossRef CAS.
- F. Tang, Y. Cao, W. Guo, Y. Chen, J. Huang, Z. Deng, Z. Liu and Z. Huang, Opt. Mater., 2011, 33, 1278–1282 CrossRef CAS.
- Q. Zhan, J. Qian, H. Liang, G. Somesfalean, D. Wang, S. He and Z. Zhang, ACS Nano, 2011, 5, 3744–3757 CrossRef CAS PubMed.
- H. Fritsche, O. Lux, C. Schuett, S. W. Heinemann, M. Dziedzina, W. Gries and H. J. Eichler, Proc. SPIE 8959, Solid State Lasers XXIII: Technology and Devices, 2014, p. 895907 Search PubMed.
- A. Ćirić, S. Stojadinović and M. D. Dramićanin, Sens. Actuators, A, 2019, 295, 450 CrossRef.
- H. Kusama, O. J. Sovers and T. Yoshioka, Jpn. J. Appl. Phys., 1967, 15, 2349 CrossRef.
- M. Lüders and K. F. Renk, Solid State Commun., 1969, 7, 575 CrossRef.
- G. Boulon, L. Laversenne, C. Goutaudier, Y. Guyot and M. T. Cohen-Adad, J. Lumin., 2003, 102–103, 417–425 CrossRef CAS.
Footnote |
| † Electronic supplementary information (ESI) available. See DOI: 10.1039/d1ra01647d |
| This journal is © The Royal Society of Chemistry 2021 |

