 Open Access Article
Co-delivery of berberine and gold nanoparticles on liposomes for photodynamic therapy against 3D lung cancer cells
Kave
Moloudi
 ,
Heidi
Abrahamse
 and
Blassan P.
George
 *
*
Laser Research Centre, Faculty of Health Sciences, University of Johannesburg, P.O. Box 17011, Doornfontein 2028, South Africa. E-mail: blassang@uj.ac.za
First published on 27th June 2024
Abstract
Lung cancer is the second most common cancer diagnosed and is the leading cause of cancer-related deaths globally. Even though there are established lung cancer treatment options including radiotherapy, chemotherapy, and surgery, it remains a great challenge globally. Hence, it is important to explore new procedures such as photodynamic therapy (PDT) to improve the therapeutic outcomes and/or modify established protocol with conventional approaches. PDT is a non-invasive treatment with considerable outcomes in cancer therapy. During PDT, photosensitizer (PS) agents absorb a certain wavelength of laser light and produce reactive oxygen species (ROS), which kill cancer cells. PS agent is one of the critical elements besides the tissue oxygen level and physical parameters of the laser to acheive high treatment efficiency in PDT. Berberine (BBR) has potential as a PS but its free form has some limitations such as limited tumor targeting, poor water solubility and systemic toxicity. However, the objective of this study is the co-delivery of berberine (BBR) and citrate gold nanoparticles (AuNPs) on liposomes (Lipo@AuNPs@BBR) as a new PS compound for PDT on A549 lung cancer spheroid cells. Our hypothesis was that AuNPs can have a synergistic effect on BBR in the Lipo@AuNPs@BBR complex, resulting in more photodamage in PDT on A549 cells. Moreover, liposmes provide a platform for the co-delivery of BBR and AuNPs to cells. Hence, the Lipo@AuNPs@BBR complex was synthesized via the thin-film hydration method, and TEM characterization results showed that the size of the Lipo@AuNPs@BBR complex was 100 nm. Moreover, energy-dispersive X-ray spectroscopy (EDS) confirmed that BBR and AuNPs were co-loaded on liposomes while UV-vis spectroscopy showed that the maximum loading was at concentrations of 14 μM (14%) and 11 μg mL−1 (18.33%) for BBR and AuNPs, respectively. Furthermore, the IC50 (80 μg mL−1) concentration of the Lipo@AuNPs@BBR complex combined with a 405 nm laser at 15 J cm−2 fluency induced cytotoxicity on A549 spheroid cells and resulted in decreasing spheroid cell viability to 34.12%. Finally, the Lipo@AuNPs@BBR complex is not only a potent PS drug in PDT at a safe dose but also considered as a nanotheranositc agent in tumor diagnosis and therapy in vivo studies.
1. Introduction
Lung cancer is the second most commonly diagnosed cancer and is the leading cause of cancer-related deaths globally.1 There are two main types of lung cancer: non-small cell lung cancer (NSCLC) and small cell lung cancer (SCLC).2,3 The risk factors for lung cancer include smoking, exposure to second hand smoke, exposure to radon gas, exposure to asbestos and other carcinogens, and a family history of lung cancer.4,5 Treatment for lung cancer depends on the type and stage of the cancer as well as the patient's overall health. Although some treatment options such as surgery, radiation therapy, chemotherapy, targeted therapy, and immunotherapy can be used for lung cancer therapy, the remedy remains a great challenge and the survival rate is low.6 However, the search for new modalities and strategies continues.Photodynamic therapy (PDT) is a non-invasive treatment option for lung cancer that uses a photosensitizing agent and a specific wavelength of light to destroy cancer cells.7,8 In PDT, reactive oxygen species (ROS) play a crucial role in the destruction of cancer cells. When photosensitizer (PS) agents are exposed to specific wavelengths of light, the PS becomes activated and transitions to a higher energy state. Then, the activated PS interacts with molecular oxygen (O2) present in the surrounding tissue, leading to the formation of singlet oxygen (1O2). Singlet oxygen is a highly reactive ROS that can cause damage to cellular components. The generated singlet oxygen and other ROS, such as superoxide and hydroxyl radicals, induce oxidative stress within the cancer cells. This oxidative stress disrupts cellular functions and damages cellular structures, ultimately leading to cell death.9,10 PDT is typically used for early-stage lung cancer or for palliative care in advanced cases. Additionally, it may be used in combination with other treatments such as surgery, radiation therapy, or chemotherapy.11,12 However, it may be a good option for patients who cannot undergo surgery or radiation therapy or who want to avoid these more invasive treatments. Even though PDT has been approved by World Health Organization (WHO) for the treatment of some cancers such as head and neck cancer and skin diseases, it has some challenges such as light penetration, hypoxia, the cytotoxicity of PS and lack of efficient uptake photosensitizing agents in cancer cells, inflammation.13–15 However, researchers have attempted to find new PS drugs with suitable pharmacokinetics properties, stability as well as low toxicity.
Berberine (BBR) is a natural compound found in several plants, such as goldenseal, barberry, and Oregon grape. It has been traditionally used in Chinese medicine to treat various ailments, including bacterial infections, gastrointestinal disorders, and diabetes.16,17 Recent studies have also shown its potential as an anticancer agent due to its ability to induce apoptosis in cancer cells. Moreover, several studies have shown that BBR has excellent potential in PDT with high absorption light at 344–420 nm wavelength.18,19 Hence, there are some limitations of using BBR such as low solubility, high toxicity, low bioavailability and low uptake by cancer cells that may limit its use in combination with PDT for cancer treatment.20,21 Additionally, more research is needed to fully understand the safety and effectiveness of using BBR in cancer PDT. While some studies have shown promising results,21,22 more clinical trials are needed to determine its efficacy and potential risks. However, the optimal concentration and duration of treatment for BBR in cancer therapy are still being studied. One strategy to compensate the BBR is using other agent in co-delivery. So, some studies have reported that gold nanoparticles (AuNPs) have potential in photo-thermal therapy. AuNPs can absorb light and produce ROS, leading to cancer cell death via apoptosis and autophagy pathways.23,24 To overcome BBR limitations, researchers have developed a nanoformulation of BBR using a combination of polyethylene glycol (PEG) and chitosan.20,25,26 Polymeric and lipid-based nanoparticles are used for the co-delivery of anticancer co-drugs in delivery and cancer therapy.27 In order to increase the BBR efficiency and the synergistic effects of citrate AuNPs in PDT, we designed and synthesized a new nanoformulation of BBR and citrate AuNPs (Lipo@AuNPs@BBR) against A549 spheroid cells.
2. Materials and methods
2.1. Materials
BBR chloride (10006427, powder, purity >95%), dimethyl sulfoxide (DMSO), 3-(4,5-dimethylthiazol-2-yl)-2,5-diphenyltetrazolium bromide (MTT) (11465007001), cholesterol (Chol) (C8667), 1,2-distearoyl-sn-glycero-3-phosphocholine (DSPC) (P1138-1G), citrate gold nanoparticles (AuNPs) (741957), Gibco Dulbecco's Modified Eagle Medium (DMEM) (D5796), chloroform (C2432), methanol (439193), fetal bovine serum (FBS), phosphate buffered saline (PBS), live-dead cell viability kit (CBA415), 96-well ultra-low attachment plates (174929), and the CellTiter-GloTM 3D luminescence (G968A) Kit were purchased from Sigma (USA) and Thermo Fisher in Johannesburg, South Africa.2.2. Synthesis of the Lipo@AuNPs@BBR complex
Lipo@AuNPs@BBR were synthesized by the thin-film hydration as well as using the active method.28,29 Briefly, a mixture of DSPC (80 mg mL−1), Chol (40 mg mL−1) at 2![[thin space (1/6-em)]](https://www.rsc.org/images/entities/char_2009.gif) :
:![[thin space (1/6-em)]](https://www.rsc.org/images/entities/char_2009.gif) 1 ratio, BBR (100 μM or 3.36 mg) were dissolved in organic solvents chloroform and methanol (8
1 ratio, BBR (100 μM or 3.36 mg) were dissolved in organic solvents chloroform and methanol (8![[thin space (1/6-em)]](https://www.rsc.org/images/entities/char_2009.gif) :
:![[thin space (1/6-em)]](https://www.rsc.org/images/entities/char_2009.gif) 2, v/v), then evaporated in a rotary evaporator (60 rpm at temperature 75 °C for 1 h) to form a thin lipid layer; afterward, 1 mL citrate AuNPs (60 μg mL−1) was added for film hydration. Then, the obtained nanoparticles were stored at 8 °C for characterization.
2, v/v), then evaporated in a rotary evaporator (60 rpm at temperature 75 °C for 1 h) to form a thin lipid layer; afterward, 1 mL citrate AuNPs (60 μg mL−1) was added for film hydration. Then, the obtained nanoparticles were stored at 8 °C for characterization.
2.3. Characterization of the Lipo@AuNPs@BBR complex
![[thin space (1/6-em)]](https://www.rsc.org/images/entities/char_2009.gif) 000 rpm for 1 h) and the supernatant was discarded. Then, the UV-vis study was repeated until the sample reported an almost zero absorption on the measured spectrum. For EE, the following formula was used.
000 rpm for 1 h) and the supernatant was discarded. Then, the UV-vis study was repeated until the sample reported an almost zero absorption on the measured spectrum. For EE, the following formula was used.| EE = (the drug loaded in Lip/total drug added to the system) × 100% |
![[thin space (1/6-em)]](https://www.rsc.org/images/entities/char_2009.gif) 000 rpm for 10 min. The supernatants were collected and BBR and AuNPs concentrations were determined by UV-Vis spectrophotometry at various time intervals (0, 4, 8, 12, 16, 20 and 24 h).
000 rpm for 10 min. The supernatants were collected and BBR and AuNPs concentrations were determined by UV-Vis spectrophotometry at various time intervals (0, 4, 8, 12, 16, 20 and 24 h).
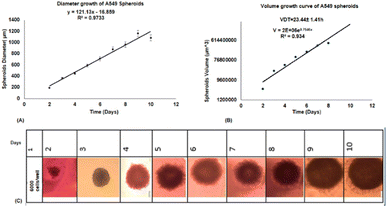
2.3.7.1. Cell culture. A549 human lung cancer cells were seeded in 25-flask, including DMEM medium with 10% FBS and 1% penicillin–streptomycin (P4458). After the third passage, the cells were harvested and counted. To best evaluate spheroid formation and growth, the cells were plated at a density of 2 × 10³, 4 × 10³, 6 × 10³ and 1× 10⁴ cells in 200 μL of growth media per well using 96-well spheroid microplates (Corning Cat. No. 4520). Spheroid cultures were analyzed at 0–10 days using an inverted Olympus microscope (USA).
2.3.7.2. Volume doubling time (VDT) for treatment. About 6 × 10³ cells per well were seeded in 96-MW. Every day for 10 days, the diameter of the spheroids was measured and the volume was calculated with the formula: V = 4/3πr3, where π = 3.14 and r is radius. Then, the growth curve was calculated with the formula V = V0 × ekt, where V is secondary volume, V0 is primary volume after duration (t), e is Napier's constant (2.71828) and k is gradient of logarithmic phase of curve.
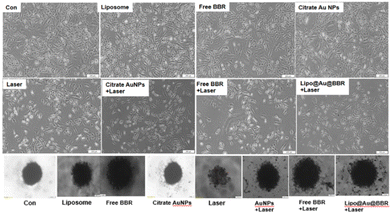
2.3.7.3. Morphology of 2D and spheroid (3D) cells. Post treatment, 2D and 3D cells (spheroids) with free form of BBR (14 μM), citrate AuNPs (11 μg mL−1), Lipo@AuNPs@BBR (80 μg mL−1), and liposome (80 μg mL−1) were subjected to single (dark toxicity) and combination treatment with 405 nm laser at 15 J cm−2 (60 mW cm−2 for 8 min). Then, the morphology of the monolayer cells (2D) and spheroids (3D) were examined using an inverted light microscope light (Olympus).
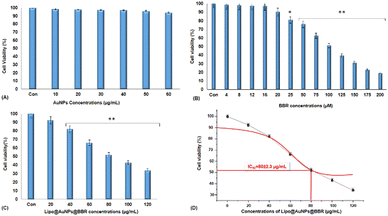
2.3.7.4. Cytotoxicity of free form of BBR and citrate AuNPs and co-loaded on liposome in single (dark toxicity) and combination treatment with 405 nm laser irradiation. MTT assay was used to measure the spheroid cells viability treated with the free form of BBR at concentrations of 0–200 μM, citrate AuNPs (0–60 μg mL−1), and Lipo@AuNPs@BBR (0–120 μg mL−1) for one VDT (23.44 ± 1.41 h). In order to prepare single cells, spheroids were disassociated with 300 μL trypsin/EDTA (0.25%) for 5 min, then the medium was discarded, and the cells were washed with PBS and 2 × 10⁴ cells per mL seeded in 96-well polystyrene tissue culture plates. The cells were then placed in a humidified 5% CO2 incubator at 37 °C for 24 h. After incubation, the medium was removed, and 20 μL aliquots of MTT solution (5 mg mL−1 in PBS, Sigma, USA) were added to each well and re-incubated at 37 °C for 4 h. Next, 100 μL of the supernatant culture medium was carefully aspirated, and 100 μL aliquots of DMSO were added to each well to dissolve the formazan crystals, followed by 15 min incubation to dissolve the air bubbles. The culture plate was placed on a microplate reader (PerkinElmer, HH35940080 EN, Madrand, South Africa) and shaken for 15 min, and the absorbance was then measured at 540 nm. Afterward, this process was repeated for the combination treatment of BBR (14 μM), citrate AuNPs (11 μg mL−1), IC50 of Lipo@AuNPs@BBR (80 μg mL−1) with 405 nm laser at 15 J cm−2 (60 mW cm−2 for 8 min). Then, the spheroids were incubated for 24 h and the MTT assay protocol was performed to evaluate the phototoxicity. The amount of color produced is directly proportional to the number of the viable cells. All assays were performed in three replicates for each concentration, and each assay was repeated at least two times. The cell viability rate was calculated as the percentage of MTT absorption as per the equation
| % survival = (mean experimental absorbance)/(mean control absorbance) × 100. |
2.3.7.5. Lactate dehydrogenase (LDH) assay. For the LDH assay in A549 spheroid cells by ELISA, after three passages of the culture, 6 × 10³ cells per well were seeded in 96-well ultra-low attachment plates (174929). When spheroids reached 300–400 μm diameters, then all groups including the control (cells in dark and cells under laser irradiation), citrate AuNPs (11 μg mL−1), free BBR (14 μM) and 80 μg mL−1 (IC50) of Lipo@AuNPs@BBR (contain 11 μg mL−1 of citrate AuNPs and 14 μM of BBR) were treated with and without (dark toxicity) laser for VDT. Each treatment was in triplicate and three different experiments were performed. Then, 50 μL of media was transferred to the 96-well plate and 50 μL of lactate substrate was added and incubated for 30 min in a dark place. Finally, the absorbance measurement was done using a Victor Nivo® multimode plate reader (PerkinElmer, Midrand, South Africa) at 490 nm wavelength.
2.3.7.6. Adenosine triphosphate (ATP) luminescence assay. The CellTiter-GloTM 3D luminescence (Promega, G968A, Madison, WI, USA) Kit was used to determine the intracellular ATP content of the A549 spheroids. Briefly, the spheroids were transferred into microcentrifuge tubes and disintegrated with 300 μL of trypsin/EDTA (0.25%) and pipetted. Thereafter, the cells were centrifuged at 3000 rpm for 5 min and washed with 200 μL of HBSS. Then, the supernatant was discarded and the cells were resuspended in HBSS. In total, 50 μL of the cell suspension for each sample was transferred to an opaque 96-well plate, an equal volume of the ATP substrate was added, and the contents were agitated for 5 min to facilitate reagent penetration, lysis, and ATP recovery. The samples were incubated at 37 °C for half an hour, and the intracellular ATP luminescence was recorded using a Victor Nivo® multimode plate reader (PerkinElmer, Midrand, South Africa).
2.3.7.7. Live/dead assay. A live/dead kit from Sigma (Catalog number: CBA415) was used to visualize the A549 spheroid cells under a fluorescence microscope. According to the kit protocol, the control (cells in dark and cells under laser irradiation only) and treated groups were washed three times with PBS and then stained with 1 μg mL−1 of ethidium bromide (EtBr) in conjunction with the same concentration of acridine orange (AO) for 10 min in PBS. Consequently, the spheroid cells were rinsed three times with PBS and the visualized images were taken for various groups using Alexa fluor 488 and EtBr channels under a Carl Zeiss fluorescent microscope using the Zen Pro (3.7) Carl Zeiss software.
3. Results
3.1. Characterization of the Lipo@AuNPs@BBR complex
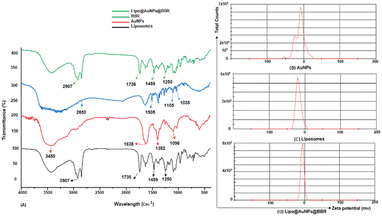 | ||
| Fig. 2 (A) FTIR spectra of BBR, empty liposomes, citrate AuNPs and Lipo@AuNPs@BBR complex. Zeta potential distribution for citrate AuNPs (B), liposome (C) and Lipo@AuNPs@BBR (D). | ||
3.2. Cellular response
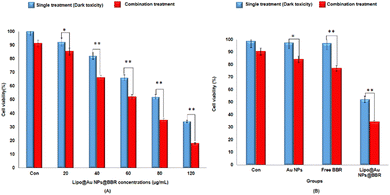
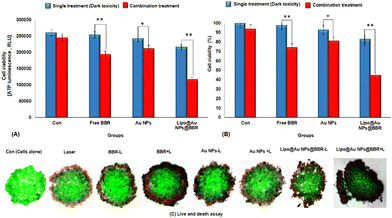
In addition, Fig. 9 shows the photo-toxicity of the free form of BBR (14 μM), citrate AuNPs (11 μg mL−1) and Lipo@AuNPs@BBR (80 μg mL−1) in single (dark toxicity) and combination treatment with 405 nm laser at an energy of 15 J cm−2. Consequently, the viability of different groups compared with the control was determined. The viability for various groups including the control (cells in dark and cells under laser irradiated only) and single (dark toxicity) treated with BBR (14 μM), single doses of citrate AuNPs (11 μg mL−1) and IC50 of Lipo@AuNPs@BBR (80 μg mL−1) contain 14 μM BBR and 11 μg mL−1 citrate AuNPs, which was 100%, 98.01%, 97.27% and 52.12%, respectively (Fig. 9A). Moreover, the viability for different groups in combination with the 405 nm laser, including the control, free BBR, citrate Au NPs and Lipo@AuNPs@BBR (80 μg mL−1) was 100%, 90.12%, 77.08%, 84.27% and 34.12%, respectively (Fig. 9B).
![[thin space (1/6-em)]](https://www.rsc.org/images/entities/char_2009.gif) :
:![[thin space (1/6-em)]](https://www.rsc.org/images/entities/char_2009.gif) 0.4), 1.67 (0.67
0.4), 1.67 (0.67![[thin space (1/6-em)]](https://www.rsc.org/images/entities/char_2009.gif) :
:![[thin space (1/6-em)]](https://www.rsc.org/images/entities/char_2009.gif) 0.4) and 2.92 times (1.17
0.4) and 2.92 times (1.17![[thin space (1/6-em)]](https://www.rsc.org/images/entities/char_2009.gif) :
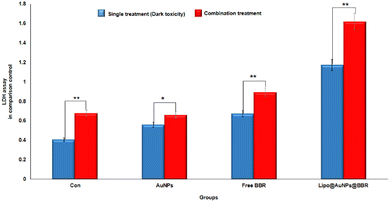
:![[thin space (1/6-em)]](https://www.rsc.org/images/entities/char_2009.gif) 0.4), respectively. On the other hand, in combination treatment with laser, the LDH rate for various groups including laser alone, citrate Au NPs, BBR and IC50 of Lipo@AuNPs@BBR reached 1.67 (0.67
0.4), respectively. On the other hand, in combination treatment with laser, the LDH rate for various groups including laser alone, citrate Au NPs, BBR and IC50 of Lipo@AuNPs@BBR reached 1.67 (0.67![[thin space (1/6-em)]](https://www.rsc.org/images/entities/char_2009.gif) :
:![[thin space (1/6-em)]](https://www.rsc.org/images/entities/char_2009.gif) 0.4), 1.17 (0.66
0.4), 1.17 (0.66![[thin space (1/6-em)]](https://www.rsc.org/images/entities/char_2009.gif) :
:![[thin space (1/6-em)]](https://www.rsc.org/images/entities/char_2009.gif) 0.56), 1.32 (0.89
0.56), 1.32 (0.89![[thin space (1/6-em)]](https://www.rsc.org/images/entities/char_2009.gif) :
:![[thin space (1/6-em)]](https://www.rsc.org/images/entities/char_2009.gif) 0.67) and 1.42 (1.67
0.67) and 1.42 (1.67![[thin space (1/6-em)]](https://www.rsc.org/images/entities/char_2009.gif) :
:![[thin space (1/6-em)]](https://www.rsc.org/images/entities/char_2009.gif) 1.17), respectively, in comparison with the single (dark toxicity) treatment, as shown in Fig. 10.
1.17), respectively, in comparison with the single (dark toxicity) treatment, as shown in Fig. 10.
4. Discussion
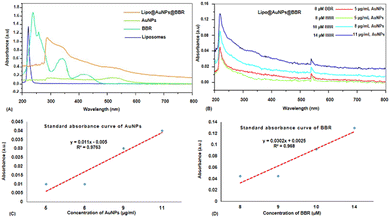
Even though PDT is a non-invasive and highly effective cancer therapy adjuvant to other modalities like chemotherapy, radiation, and target therapy, there are still certain obstacles and limits that need to be overcome, like the PS agent's low solubility, the tumor's hypoxia, and light penetration.10,33,34 In order to address these problems, a variety of nanoparticles, including AuNPs, have been widely employed in PDT to boost PS delivery in cancer cells, hence encouraging more potent inhibitory effects and better clinical results.10,35 Furthermore, spheroid cell culture can better predict the in vivo responses compared to the monolayer cultures due to the gap-junction of cell–cell interactions and cell–matrix interactions and more physiologically relevant results.36,37 This study was aimed at investigating the safe co-delivery concentrations of BBR and citrate AuNPs on liposome (Lipo@AuNPs@BBR complex) as the nano-photosensitizer in PDT on A549 spheroid cells. Although BBR has excellent potential as a PS agent in PDT, it has low cancer therapeutic efficiency due to some limitations such as low water solubility and biodegradation.21,38,39 To overcome these problems, we synthesized the nanoformulation complex from BBR co-loaded with citrate AuNPs on liposome. However, for this purpose, the Lipo@AuNPs@BBR complex was designed and synthesized by the thin-film layer method as well as the active procedure due to the hydrophobic features of the BBR drug.28,40 UV visible spectroscopy confirmed that liposome presented a peak at 210–220 nm,41,42 BBR showed three peaks at 250, 350 and 430 nm43,44 and citrate AuNPs showed a peak at 525–530 nm.45,46 UV-vis showed that 14 μM (14%) of BBR and 11 μg mL−1 (18.33%) of citrate AuNPs had been loaded into the liposome during co-loading, respectively. The free forms of these concentrations of BBR and citrate AuNPs indicated the safe toxicity towards 3D A549 cells. Both BBR and AuNPs had EE% of 14% and 18.33%, respectively, which is lower than those found in the published literature.47–49 The possible reasons for this could be the poor water solubility and positive charge of cholesterol in liposome, which in turn reduced the amount of BBR that was transmembrane with the same positive charge.50 FTIR results, on comparing with other studies, showed all specific peaks for free BBR, citrate AuNPs, liposome and Lipo@AuNPs@BBR.51,52 However, for BBR, the absorption peaks was detected near 1035 (corresponds to C11H, C12H, C13H oop bend), 1105 (corresponds to C–O), 1505 (furyl group) and 2850 cm−1 (corresponds to the methoxyl group).26,51 Also, citrate AuNPs showed four peaks at 1098 (corresponds to C–O stretching), 1382 (corresponds to the symmetric and anti-symmetric of COO−), 1638 (C![[double bond, length as m-dash]](https://www.rsc.org/images/entities/char_e001.gif) O stretching) and 3450 cm−1 (corresponds to O–H and N–H stretching).53 Additionally, liposome and Lipo@AuNPs@BBR illustrated four same peaks at 1250 (C–O of ester groups), 1459 (CH2 of alkyl groups), 1736 (C
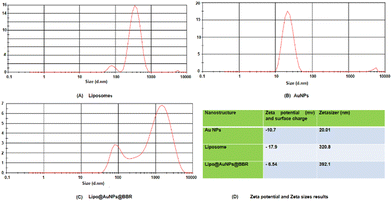
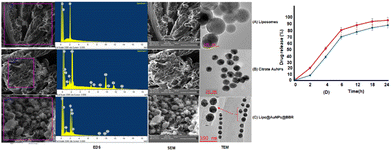
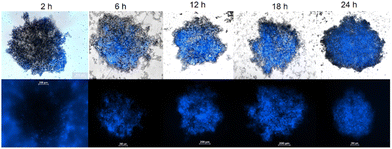
O stretching) and 3450 cm−1 (corresponds to O–H and N–H stretching).53 Additionally, liposome and Lipo@AuNPs@BBR illustrated four same peaks at 1250 (C–O of ester groups), 1459 (CH2 of alkyl groups), 1736 (C![[double bond, length as m-dash]](https://www.rsc.org/images/entities/char_e001.gif) O of ester groups) and 2907 cm−1 (symmetric CH2 stretching of the alkyl groups).51,52,54,55 Furthermore, DLS data revealed that all samples of nanoparticles have a negative surface charge and were confirmed with other studies.35,56 PDI and zeta potential (mV) of all the samples are in the acceptable range referencing to other studies.57 In addition, the EDS analysis of SEM confirmed that BBR and citrate AuNPs were loaded into the liposome and have a wavy crest and spherical shape in the Lipo@AuNPs@BBR complex.35,58In vitro drug release test from Lipo@AuNPs@BBR was performed with UV-Vis spectroscopy and showed that AuNPs burst release is faster than BBR, which is due to the hydrophilic feature and samples size of AuNPs.59,60 Finally, the quality penetration of the Lipo@AuNPs@BBR complex in the spheroids was confirmed by Hoechst dye after 24 h, similar to the reports of Durand et al. and Tchoryk and co-workers.30,31 Additionally, the surface charge of nanoparticles is a sign of the stability of the NPs distribution, which reveals the strength of the particles' electrostatic repulsion. This means that because of the strong electric repulsion forces between the molecules, the highly charged particles have a high zeta potential value and are regarded as stable.61 It's interesting to note that the average hydrodynamic diameter of Lipo@AuNPs@BBR (392.1 ± 0.8 nm, hydrated form) was comparatively larger than their TEM diameter (100 nm, dry form). In contrast to the TEM studies, the Lipo@AuNPs@BBR complex diameter rose when water was present surrounding them during the DLS tests.62
O of ester groups) and 2907 cm−1 (symmetric CH2 stretching of the alkyl groups).51,52,54,55 Furthermore, DLS data revealed that all samples of nanoparticles have a negative surface charge and were confirmed with other studies.35,56 PDI and zeta potential (mV) of all the samples are in the acceptable range referencing to other studies.57 In addition, the EDS analysis of SEM confirmed that BBR and citrate AuNPs were loaded into the liposome and have a wavy crest and spherical shape in the Lipo@AuNPs@BBR complex.35,58In vitro drug release test from Lipo@AuNPs@BBR was performed with UV-Vis spectroscopy and showed that AuNPs burst release is faster than BBR, which is due to the hydrophilic feature and samples size of AuNPs.59,60 Finally, the quality penetration of the Lipo@AuNPs@BBR complex in the spheroids was confirmed by Hoechst dye after 24 h, similar to the reports of Durand et al. and Tchoryk and co-workers.30,31 Additionally, the surface charge of nanoparticles is a sign of the stability of the NPs distribution, which reveals the strength of the particles' electrostatic repulsion. This means that because of the strong electric repulsion forces between the molecules, the highly charged particles have a high zeta potential value and are regarded as stable.61 It's interesting to note that the average hydrodynamic diameter of Lipo@AuNPs@BBR (392.1 ± 0.8 nm, hydrated form) was comparatively larger than their TEM diameter (100 nm, dry form). In contrast to the TEM studies, the Lipo@AuNPs@BBR complex diameter rose when water was present surrounding them during the DLS tests.62
The cytotoxicity assay was evaluated by various techniques such as MTT assay, LDH release, ATP assay and live/dead cells following VDT (23.44 ± 1.41 h) for free forms of BBR, citrate AuNPs and Lipo@AuNPs@BBR in single treatment (dark toxicity) and combination with 405 nm laser irradiation. However, first VDT of A549 spheroid cells was calculated from the volume growth curve. VDT helps to present the dynamic behaviors of A549 spheroid cells and allows the spheroid cells to have enough time for the uptake of drugs.63–65 In agreement, several previous reports, BBR and AuNPs have not shown cytotoxicity in low doses.48,66 However, according to the MTT results, BBR at a concentration of 0–16 μM and citrate AuNPs at a concentration of 0–60 μg mL−1 did not present significant cytotoxicity in comparison with the control group after a VDT. Furthermore, the IC50 of Lipo@AuNPs@BBR was about 80 μg mL−1 while in combination with the laser, it was 60 μg mL−1. Hence, in comparison with the control groups, free BBR (14 μM) and citrate AuNPs (0–60 μg mL−1) did not present cytotoxicity while the Lipo@AuNPs@BBR group at 80 μg mL−1 (IC50) caused cell death, and the cell viability reduced to 52.12%. In addition, the IC50 of Lipo@AuNPs@BBR in combination with laser induced a reduction in cell viability to 34.12%. According to the LDH assay results, the IC50 of Lipo@AuNPs@BBR in both single (dark toxicity) and combination laser treatment led to a considerable increase in the LDH release compared to the control, BBR, and citrate AuNPs. Also, referring to Fig. 11C, the untreated spheroids exhibited a notable amount of luminous signal, which was positively connected with higher ATP synthesis and metabolic activity.67 However, the spheroids that were exposed to laser irradiation alone or in combination with free BBR, AuNPs, and the IC50 of Lipo@AuNPs@BBR showed less luminescence signal in comparison with the control groups. These findings suggested that laser irradiation alone and or combined with the IC50 of the Lipo@AuNPs@BBR complex exerted inhibitory effects on the spheroids. Finally, cell death and photo-damages of the Lipo@AuNPs@BBR complex in PDT was confirmed by live/dead cell assay with a fluorescence microscope. We concluded that the cytotoxicity of Lipo@AuNPs@BBR on A549 spheroid cells in compared to the control, free BBR and citrate AuNPs groups resulted in more uptake and synergistic effects of BBR and Au NPs. All the mentioned experiments above (MTT assay, LDH assay, ATP assay and live/dead assay) confirmed that the Lipo@AuNPs@BBR complex with 405 nm laser (15 J cm−2) induced mitochondrial damage, cells and nucleus membrane damage in A549 cells. Hence, as several articles have reported, the BBR compound has been shown to possess cytotoxic effects when used in PDT. During PTD, BBR is activated by light at a specific wavelength, resulting in ROS generation, which can induce cell death via mitochondrial dysfunction, apoptosis and cell cycle arrest.18,68,69 In contrast, literature reports show that BBR did not show dark toxicity at a low concentration.68,70
Compared to free medications, the encapsulation of drugs in liposomes has a number of benefits. Liposomes are easily absorbed by cells because of their colloidal form, which makes them recognizable as foreign particles. Furthermore, liposome physicochemical characteristics, such as membrane charge and particle size, are important factors to target specific tissues and have an impact on the pharmacokinetics and antileishmanial efficacy of medications encapsulated in liposomes.71,72 In contrast, even though Lipo@AuNPs@BBR demonstrated anti-cancer efficacy and increased the drug concentration in A549 cells when compared to the free drug, it is interesting to mention that the co-loaded drug concentrations on liposomes were significantly lower than the single loading values. In our study, similar to other studies, AuNPs did not show significant cytotoxicity without laser treatment (dark toxicity). In this regard, Keshavarz et al. used alginate hydrogel co-loaded with cisplatin and AuNPs (abbreviated as ACA) on the CT 25 cell line, and they reported that the free form of AuNPs does not show significant cytotoxicity in low doses but illustrated significant synergistic effect with cisplatin in cancer therapy.48 In addition, in a recent study by Vijayakumar, AuNPs were utilized for thermal therapy on MCF-7 cancer cells in vitro and in vivo. The results showed that AuNPs did not show cytotoxicity at doses less than 20 μg mL−1 but in combination with laser, it was effective and induced tumor suppression.73 Moreover, several studies reported that BBR in single and co-loading with other drugs such as curcumin (Cur) has been used for cancer therapy.26,74 For instance, Wu. J, et al. synthesized the Lipo@Cur@BBR nanocomplex, and their findings showed that EE% was 93.66 ± 3.08 (CUR) and 92.59 ± 5.45 (BBR), while the IC50 was 10 μg mL−1.74 But Sergio et al. illustrated that EE% was 17–30% in the single loading of BBR on liposomes (Lipo@BBR) and the IC50 was 100 μg mL−1.26 In the present study, the co-loading of AuNPs and BBR was 18.33% and 14%, respectively. However, IC50 was 80 μg mL−1, which is more than that of other studies, and the cytotoxicity of the whole complex depends on the amount of drug loading. Overall, we found that Lipo@AuNPs@BBR complex at 80 μg mL−1 concentration could be effective in PDT on A549 lung cancer.
5. Conclusion
The co-loading of BBR and citrate AuNPs on liposome (Lipo@AuNPs@BBR complex) presented low cytotoxicity in single (dark toxicity) treatment on A549 cells, but its synergistic effect in combination PDT is considerable in cancer therapy. Additionally, this single nano-complex (Lipo@AuNPs@BBR complex) well-controlled the optimal dual-drug ratio to dual medications separately, and the single NP showed a greater antitumor activity. Overall, our research solves the challenges associated with designing hydrophobic drug classes, such as berberine, for ratiometric combination therapy. As a result, we have identified this single nanoparticulate delivery platform as an effective and generally safe option for the treatment of human lung cancer. To sum up, this complex due to the exiting AuNPs not only has synergistic effect with BBR in PDT but it can also be employed as a nanotheranostic agent in tumor diagnosis. Finally, it is important to mention that the authors faced a few challenges such the low co-loading of BBR and AuNPs on the liposomes as well as the large size of the nanomaterials in the Zetasizer test in comparison with the TEM results. These limitations should be considered for future in vivo studies for more investigations.Author contributions
K. M. Conceptualization, writing – original draft preparation; B. P. G. and H. A.; writing – review and editing, supervision, funding acquisition. All authors have read and agreed to the published version of the manuscript.Conflicts of interest
The authors do not have conflicts of interest to disclose.Acknowledgements
This work is based on the research funded by the South African Research Chairs initiative of the Department of Science and Technology and National Research Foundation (NRF) of South Africa (Grant No. 98337), South African Medical Research Council (Grant No. SAMRC EIP007/2021), as well as grants received from the NRF Research Development Grants for Y-Rated Researchers (Grant No.: 137788), University Research Committee (URC), University of Johannesburg, and the Council for Scientific Industrial Research (CSIR)-National Laser Centre (NLC). The authors sincerely thank the South African Research Chairs initiative of the Department of Science and Technology and the National Research Foundation (NRF) of South Africa, South African Medical Research Council (SAMRC). The research reported in this original article was supported by the South African Medical Research Council (SAMRC) through its Division of Research Capacity Development under the Research Capacity Development Initiative from funding received from the South African National Treasury. The content and findings reported/illustrated are the sole deduction, view, and responsibility of the researchers and do not reflect the official position and sentiments of the SAMRC.References
- K. Robien and L. DiPietro, Chest, 2024, 165, 14–15 CrossRef PubMed.
- B. Zhou, R. Zang, M. Zhang, P. Song, L. Liu, F. Bie, Y. Peng, G. Bai and S. Gao, EBioMedicine, 2022, 78, 103951 CrossRef PubMed.
- J. Subramanian, T. Regenbogen, G. Nagaraj, A. Lane, S. Devarakonda, G. Zhou and R. Govindan, J. Thorac. Oncol., 2013, 8, 860–865 CrossRef PubMed.
- A. M. Saad, M. J. Al-Husseini, H. H. Mohamed, M. A. Alkhayat, M. B. Sonbol and O. Abdel-Rahman, Porto Biomed. J., 2017, 2, 212 CrossRef PubMed.
- F. Wang, X. Xu, J. Yang, L. Min, S. Liang and Y. Chen, PLoS One, 2017, 12, e0185316 CrossRef PubMed.
- G. S. Jones and D. R. Baldwin, Clin. Med., 2018, 18, s41 CrossRef PubMed.
- K. Moloudi, H. Abrahamse and B. P. George, Front. Oncol., 2023, 13, 1225694 CrossRef CAS PubMed.
- K. Moloudi, P. Sarbadhikary, H. Abrahamse and B. P. George, Antioxidants, 2023, 12, 1434 CrossRef CAS PubMed.
- K. Moloudi, H. Abrahamse and B. P. George, Front. Oncol., 2023, 13, 1225694 CrossRef CAS PubMed.
- K. Moloudi, H. Abrahamse and B. P. George, Wiley Interdiscip. Rev.: Nanomed. Nanobiotechnol., 2024, 16, e1937 CAS.
- R. Allison, K. Moghissi, G. Downie and K. Dixon, Photodiagnosis Photodyn. Ther., 2011, 8, 231–239 CrossRef PubMed.
- C. B. Simone II and K. A. Cengel, Semin. Oncol., 2014, 41, 820–830 CrossRef PubMed.
- M. J. Garland, C. M. Cassidy, D. Woolfson and R. F. Donnelly, Future Med. Chem., 2009, 1, 667–691 CrossRef CAS PubMed.
- M. M. Kim and A. Darafsheh, Photochem. Photobiol., 2020, 96, 280–294 CrossRef CAS PubMed.
- D. Van Straten, V. Mashayekhi, H. S. De Bruijn, S. Oliveira and D. J. Robinson, Cancers, 2017, 9, 19 CrossRef PubMed.
- A. Amin, T. Subbaiah and K. Abbasi, Can. J. Microbiol., 1969, 15, 1067–1076 CrossRef CAS PubMed.
- B. Philogene, J. Arnason, G. Towers, Z. Abramowski, F. Campos, D. Champagne and D. McLachlan, J. Chem. Ecol., 1984, 10, 115–123 CrossRef CAS PubMed.
- H.-Q. Liu, Y.-W. An, A.-Z. Hu, M.-H. Li and G.-H. Cui, Open Chem., 2019, 17, 413–421 CAS.
- H. Liu, T. Zheng, Z. Zhou, A. Hu, M. Li, Z. Zhang, G. Yu, H. Feng, Y. An and J. Peng, RSC Adv., 2019, 9, 10528–10535 RSC.
- Y.-W. An, H.-T. Jin, B. Yuan, J.-C. Wang, C. Wang and H.-Q. Liu, Oncol. Lett., 2021, 21, 1–10 Search PubMed.
- A. Och, R. Podgórski and R. Nowak, Toxins, 2020, 12, 713 CrossRef CAS PubMed.
- N. L. Andreazza, C. Vevert-Bizet, G. Bourg-Heckly, F. Sureau, M. J. Salvador and S. Bonneau, Int. J. Pharm., 2016, 510, 240–249 CrossRef PubMed.
- J. Beik, M. Khateri, Z. Khosravi, S. K. Kamrava, S. Kooranifar, H. Ghaznavi and A. Shakeri-Zadeh, Coord. Chem. Rev., 2019, 387, 299–324 CrossRef CAS.
- Z. Abed, J. Beik, S. Laurent, N. Eslahi, T. Khani, E. S. Davani, H. Ghaznavi and A. Shakeri-Zadeh, J. Cancer Res. Clin. Oncol., 2019, 145, 1213–1219 CrossRef CAS PubMed.
- B. F. Floriano, T. Carvalho, T. Z. Lopes, L. A. U. Takahashi, P. Rahal, A. C. Tedesco and M. F. Calmon, Photodiagnosis Photodyn. Ther., 2021, 33, 102174 CrossRef CAS PubMed.
- S. Comincini, F. Manai, M. Sorrenti, S. Perteghella, C. D’Amato, D. Miele, L. Catenacci and M. C. Bonferoni, Pharmaceutics, 2023, 15, 1078 CrossRef CAS PubMed.
- A. Narmani, R. Jahedi, E. Bakhshian-Dehkordi, S. Ganji, M. Nemati, R. Ghahramani-Asl, K. Moloudi, S. M. Hosseini, H. Bagheri and P. Kesharwani, Expert Opin. Drug Delivery, 2023, 20, 937–954 CrossRef CAS PubMed.
- H. Zhang, Liposomes: Methods and Protocols, Springer, 2023, pp. 57–63 Search PubMed.
- H. Zhang, Liposomes: Methods and protocols, 2017, 17–22 Search PubMed.
- R. E. Durand, J. Histochem. Cytochem., 1982, 30, 117–122 CrossRef CAS PubMed.
- A. Tchoryk, V. Taresco, R. H. Argent, M. Ashford, P. R. Gellert, S. Stolnik, A. Grabowska and M. C. Garnett, Bioconjugate Chem., 2019, 30, 1371–1384 CrossRef CAS PubMed.
- F. Salehi, H. Behboudi, G. Kavoosi and S. K. Ardestani, Sci. Rep., 2017, 7, 2553 CrossRef PubMed.
- D. Bhattacharya, M. Mukhopadhyay, K. Shivam, S. Tripathy, R. Patra and A. Pramanik, Biomed. Mater., 2023, 8, 062005 CrossRef PubMed.
- G. Gunaydin, M. E. Gedik and S. Ayan, Front. Chem., 2021, 9, 691697 CrossRef CAS PubMed.
- K. Moloudi, A. Khani, M. Najafi, R. Azmoonfar, M. Azizi, H. Nekounam, M. Sobhani, S. Laurent and H. Samadian, Wiley Interdiscip. Rev.: Nanomed. Nanobiotechnol., 2023, e1886 CAS.
- K. Moloudi, A. Neshasteriz, A. Hosseini, N. Eyvazzadeh, M. Shomali, S. Eynali, E. Mirzaei and A. Azarnezhad, Iranian Biomed. J., 2017, 21, 330 CrossRef PubMed.
- M. Ravi, V. Paramesh, S. Kaviya, E. Anuradha and F. P. Solomon, J. Cell. Physiol., 2015, 230, 16–26 CrossRef CAS PubMed.
- Q. Lu, Y. Fu and H. Li, Pharmacol. Rep., 2022, 74, 297–309 CrossRef CAS PubMed.
- J. Wang, Q. Qi, Z. Feng, X. Zhang, B. Huang, A. Chen, L. Prestegarden, X. Li and J. Wang, Oncotarget, 2016, 7, 66944 CrossRef PubMed.
- S. K. Sahoo, Liposomal Encapsulation in Food Science and Technology, Elsevier, 2023, pp. 39–63 Search PubMed.
- T. A. Nguyen, Q. D. Tang, D. C. T. Doan and M. C. Dang, Adv. Nat. Sci.: Nanosci. Nanotechnol., 2016, 7, 035003 Search PubMed.
- S. M. El Faramawy and R. A. Rizk, J. Am. Soc. Sci., 2011, 7, 363–369 Search PubMed.
- Y. Kamal, M. Singh, E. Tamboli, R. Parveen and S. Ahmad, Acta Chromatogr., 2011, 23, 157–168 CrossRef CAS.
- L. Yu-Chung, L. Zhe-Rui, T. Lin-Wei, P. Elena, K. Artashes and C. Chia-Liang, J. Biomed. Photonics Eng., 2017, 3, 10305 CrossRef.
- S. Makumire, N. Revaprasadu and A. Shonhai, PLoS One, 2015, 10, e0121243 CrossRef PubMed.
- J. C. Mohan, G. Praveen, K. Chennazhi, R. Jayakumar and S. Nair, J. Exp. Nanosci., 2013, 8, 32–45 CrossRef CAS.
- X. Ma, X. Sui, C. Liu, H. Li, C. Han, T. Xu, H. Zhang, Y. Zhang, D. Cai and Y. Li, Colloids Surf., A, 2023, 673, 131773 CrossRef CAS.
- M. Keshavarz, K. Moloudi, R. Paydar, Z. Abed, J. Beik, H. Ghaznavi and A. Shakeri-Zadeh, J. Biomater. Appl., 2018, 33, 161–169 CrossRef CAS PubMed.
- P. Liu, G. Chen and J. Zhang, Molecules, 2022, 27, 1372 CrossRef CAS PubMed.
- A. Magarkar, V. Dhawan, P. Kallinteri, T. Viitala, M. Elmowafy, T. Róg and A. Bunker, Sci. Rep., 2014, 4, 5005 CrossRef CAS PubMed.
- F. A. Younis, S. R. Saleh, S. S. A. El-Rahman, A.-S. A. Newairy, M. A. El-Demellawy and D. A. Ghareeb, Sci. Rep., 2022, 12, 17431 CrossRef CAS PubMed.
- A. Musa, A. H. Elmaidomy, A. M. Sayed, S. I. Alzarea, M. M. Al-Sanea, E. M. Mostafa, O. M. Hendawy, M. A. Abdelgawad, K. A. Youssif and H. Refaat, Int. J. Nanomed., 2021, 3861–3874 CrossRef PubMed.
- P. Wulandari, X. Li, K. Tamada and M. Hara, J. Nonlinear Opt. Phys. Mater., 2008, 17, 185–192 CrossRef CAS.
- M. Leona and J. R. Lombardi, J. Raman Spectrosc., 2007, 38, 853–858 CrossRef CAS.
- Z. Wang, Y. Tian, H. Zhang, Y. Qin, D. Li, L. Gan and F. Wu, Int. J. Nanomed., 2016, 6485–6497 CrossRef CAS PubMed.
- D. H. Jo, J. H. Kim, T. G. Lee and J. H. Kim, Nanomedicine, 2015, 11, 1603–1611 CrossRef CAS PubMed.
- M. Danaei, M. Dehghankhold, S. Ataei, F. Hasanzadeh Davarani, R. Javanmard, A. Dokhani, S. Khorasani and M. Mozafari, Pharmaceutics, 2018, 10, 57 CrossRef PubMed.
- J. Jia, K. Zhang, X. Zhou, D. Zhou and F. Ge, Polymers, 2018, 10, 1198 CrossRef PubMed.
- L. L. David, A. Daniels, S. Habib and M. Singh, J. Drug Delivery Sci. Technol., 2023, 90, 105168 CrossRef CAS.
- A. K. Jain and S. Thareja, Artif. Cells, Nanomed., Biotechnol., 2019, 47, 524–539 CrossRef CAS PubMed.
- S. S. Imam, S. Alshehri, M. M. Ghoneim, A. Zafar, O. A. Alsaidan, N. K. Alruwaili, S. J. Gilani and M. Rizwanullah, Polymers, 2021, 13, 4036 CrossRef CAS PubMed.
- S.-J. Wu, T.-M. Don, C.-W. Lin and F.-L. Mi, Mar. Drugs, 2014, 12, 5677–5697 CrossRef CAS PubMed.
- H. J. G. Lindström and R. Friedman, BMC Bioinf., 2020, 21, 1–13 CrossRef PubMed.
- S. Park, S. M. Lee, S. Kim, J.-G. Lee, S. Choi, K.-H. Do and J. B. Seo, Radiology, 2020, 295, 703–712 CrossRef PubMed.
- Y. Wang, M. M. Kheir, Y. Chai, J. Hu, D. Xing, F. Lei and L. Du, PLoS One, 2011, 6, e23495 CrossRef CAS PubMed.
- A. Rauf, T. Abu-Izneid, A. A. Khalil, M. Imran, Z. A. Shah, T. B. Emran, S. Mitra, Z. Khan, F. A. Alhumaydhi and A. S. Aljohani, Molecules, 2021, 26, 7368 CrossRef CAS PubMed.
- N. W. Nkune and H. Abrahamse, Pharmaceutics, 2023, 15, 2264 CrossRef CAS PubMed.
- P. Oliveira, T. Lopes, A. C. Tedesco, P. Rahal and M. Calmon, Photodiagnosis Photodyn. Ther., 2020, 32, 102045 CrossRef CAS PubMed.
- X. Wang, Q. Gong, C. Song, J. Fang, Y. Yang, X. Liang, X. Huang and J. Liu, Toxicol. Appl. Pharmacol., 2021, 418, 115484 CrossRef CAS PubMed.
- T. Z. Lopes, F. R. de Moraes, A. C. Tedesco, R. K. Arni, P. Rahal and M. F. Calmon, Biomed. Pharmacother., 2020, 123, 109794 CrossRef CAS PubMed.
- A. de Souza, D. S. S. Marins, S. L. Mathias, L. M. Monteiro, M. N. Yukuyama, C. B. Scarim, R. Löbenberg and N. A. Bou-Chacra, Int. J. Pharm., 2018, 547, 421–431 CrossRef CAS PubMed.
- N. Bertrand and J.-C. Leroux, J. Controlled Release, 2012, 161, 152–163 CrossRef CAS PubMed.
- S. Vijayakumar, Appl. Phys. A, 2023, 129, 462 CrossRef CAS.
- J. Wu, C. Qi, H. Wang, Q. Wang, J. Sun, J. Dong, G. Yu, Z. Gao, B. Zhang and G. Tian, Front. Pharmacol., 2022, 13, 961788 CrossRef CAS PubMed.
| This journal is © The Royal Society of Chemistry 2024 |

