 Open Access Article
Adsorption, activation, and conversion of carbon dioxide on small copper–tin nanoclusters†
Akshayini
Muthuperiyanayagam
a,
Azeem Ghulam
Nabi
abc,
Qi
Zhao
 a,
Aman-ur-Rehman
bde and
Devis
Di Tommaso
 *a
*a
aDepartment of Chemistry, School of Physical and Chemical Sciences, Queen Mary University of London, Mile End Road, London, E1 4NS, UK. E-mail: d.ditommaso@qmul.ac.uk
bDepartment of Physics and Applied Mathematics, Pakistan Institute of Engineering & Applied Sciences, P.O. Nilore, Islamabad, 45650, Pakistan
cDepartment of Physics, University of Gujrat, Jalalpur Jattan Road, Gujrat, Pakistan
dDepartment of Nuclear Engineering, Pakistan Institute of Engineering & Applied Sciences, Nilore, Islamabad 45650, Pakistan
eCenter for Mathematical Sciences, Pakistan Institute of Engineering & Applied Sciences, Nilore, Islamabad 45650, Pakistan
First published on 19th April 2023
Abstract
Carbon dioxide (CO2) conversion to value-added chemicals is an attractive solution to reduce globally accelerating CO2 emissions. Among the non-precious and abundant metals tested so far, copper (Cu) is one of the best electrocatalysts to convert CO2 into more than thirty different hydrocarbons and alcohols. However, the selectivity for desired products is often too low. We present a computational investigation of the effects of nanostructuring, doping, and support on the activity and selectivity of Cu–Sn catalysts. Density functional theory calculations were conducted to explore the possibility of using small Cu–Sn clusters, Cu4−nSnn (n = 0–4), isolated or supported on graphene and γ-Al2O3, to activate CO2 and convert it to carbon monoxide (CO) and formic acid (HCOOH). First, a detailed analysis of the structure, stability, and electronic properties of Cu4−nSnn clusters and their ability to absorb and activate CO2 was considered. Then, the kinetics of the gas phase CO2 direct dissociation on Cu4−nSnn to generate CO was determined. Finally, the mechanism of electrocatalytic CO2 reduction to CO and HCOOH on Cu4−nSnn, Cu4−nSnn/graphene and Cu4−nSnn/γ-Al2O3 was computed. The selectivity towards the competitive electrochemical hydrogen evolution reaction on these catalysts was also considered. The Cu2Sn2 cluster suppresses the hydrogen evolution reaction and is highly selective towards CO, if unsupported, or HCOOH if supported on graphene. This study demonstrates that the Cu2Sn2 cluster is a potential candidate for the electrocatalytic conversion of the CO2 molecule. Moreover, it identifies insightful structure–property relationships in Cu-based nanocatalysts, highlighting the influence of composition and catalyst support on CO2 activation.
1. Introduction
The increasing carbon dioxide (CO2) level in the environment is the main contributor to global warming.1 The global temperature has increased by 1 °C compared to the pre-industrial era and will increase by a further 1.5 °C within the next two decades.2 One of the solutions is CO2 utilization, that is, the conversion of captured CO2 to value-added materials and chemicals.3 CO2 conversion is a flourishing area of research as it could use CO2 as a virtually illimited source of carbon feedstock material. One of the most promising approaches is the electrochemical CO2 reduction (eCO2R) to other C1 products such as formic acid (HCOOH) and carbon monoxide (CO), and C2+ substances such as ethylene, ethanol, and others.2,3 The main challenge in eCO2R research lies in the activation of CO2 minimizing competitive pathways such as the hydrogen evolution reaction (HER, H+ + e− → 1/2H2). Thus, catalysts are indispensable for accelerating the eCO2R process to recycle CO2 to value-added chemicals with high faradaic efficiency (FE).Copper (Cu) is the only metal surface that reduces CO2 to more than thirty different hydrocarbons and oxygenates.4 For this reason, Cu is considered the best candidate for eCO2R but lacks the required selectivity. For example, the FE achieved for ethylene, the simplest of the C2 products, is no more than 40% at 200 mA cm−2,5 still too low for practical application.6 However, the synthesis of small nanoclusters, Cun (n = 3, 4, 8, 20), supported on alumina (Al2O3) exhibited high turnover for the CO2 conversion to methanol.7,8 Larger Cu nanoclusters (1.24 nm) also showed a high FE of 93.5% at −0.50 V (RHE) for CO2 reduction to CO.9 A complementary approach to nano-structuring is the incorporation of a second metal10 to alter the electronic structure (ligand and strain effects)11 of the host material and the atomic arrangement (geometric ensemble effects) of the active sites. Metal doping can result in the introduction of new actives sites in the bimetallic catalyst that are not present in its mono-metallic counterparts. Experimental results also showed that the activity and selectivity of eCO2R to HCOOH and CO can be enhanced by incorporating metals such as gold (Au), indium (In), palladium (Pd), cobalt (Co), tungsten (W), and tin (Sn).12 Au, In and Pd are expensive and/or scarce, whereas Co and W are toxic. Earth-abundant and non-toxic metals such as Sn would be the preferred option for a long-term Cu-based sustainable catalyst solution to eCO2R. The use of Sn is also attractive because of its high selectivity toward C1 products.13 Cu–Sn catalysts suppress the HER by weakening the binding strength of H and show selectivity for formate (HCOO−) or CO depending on the Cu/Sn ratio.14 In this regard, a techno-economic evaluation of low-temperature CO2 electrolysis showed that achieving high yields of C1 products such as HCOOH and CO is competitive to conventional processes compared to achieving C2 products, whose production has substantially higher costs.15 Consequently, significant progress in the electrochemical CO2 reduction to C1 products could be achieved using Cu-based alloy clusters doped with earth-abundant metals such as Sn.
The use of small four-atom Cu clusters, Cu4, as catalysts for the conversion of CO2, to not only methanol but also other several chemicals, has been reported in several experimental and theoretical studies.7,8,16–18 Previous computational work focused on tetrahedral non-supported bimetallic Cu–Pt,19 Cu–Pd and Cu–Ni,20 and Cu–Zr.21 But there is still a lack of understanding regarding the effect of the inclusion of Sn atoms in small copper clusters. Moreover, in the realistic electrocatalytic reaction, a cluster is supported by oxides and other substrates. Lee et al. studied CO2 conversion on Fe–Cu–K catalysts supported on various oxides, such as Al2O3, SiO2, and TiO2, and found that alumina enhances CO2 chemisorption and, therefore, its activation.9 Another study found stable Cu nanoclusters (n = 3, 4, 8, 20 and so forth) synthesized on alumina (Al2O3) to be active towards CO2 conversion to methanol.7 Similarly, Cu4 deposited on Al2O3 exhibited a high turnover for catalytic CO2 hydrogenation.8 A density functional theory (DFT) study of CO2 adsorption on Cu–Co clusters supported on partially hydroxylated Al2O3 showed that CO2 interacts not only with the catalysts but also with the support via hydrogen bond with the hydroxyl group or direct bonding of the O atoms of the alumina surface.22 This process stabilizes and activates the adsorbed CO2 species (elongated C–O bonds and reduced O–C–O angle). Apart from metal oxides, graphene, a 2D material, has been used to disperse Cu clusters for the eCO2R to C1 products.23 Anchoring Cu atoms over defective diamond graphene showed high catalytic activity for the selective conversion of acetylene to ethylene.24 Nitrogen-doped (ND) graphene-supported gold clusters catalyse the CO2 electroreduction to CO.25 Experimental work showed the efficient formation of two-carbon (C2) products on small Cu clusters embedded in mesoporous carbon spheres,26 metal-organic frameworks or Cu-coordinated polymers.27,28 Li et al. studied the catalytic activity of small copper clusters anchored over defective nanodiamond graphene for CO2 reduction and found Cu3/ND@graphene and Cu4/ND@graphene to convert CO2 to C1 compounds.29
On this basis, we present a systematic computational investigation, based on DFT calculations, of the structure, stability, and electronic properties of the Cu–Sn clusters Cu4−nSnn (n = 1–4) and compare their results to monometallic Cu4 and Sn4 systems. We considered a detailed characterization of the adsorption and activation (geometry changes, charge transfer) of CO2 on the most stable structure of the monometallic and bimetallic Cu–Sn clusters and their efficacy towards the direct gas-phase dissociation of CO2 to CO and O fragments. We then compare the free energy profiles for the eCO2R to HCOOH and CO on isolated Cu4−nSnn (n = 1–4) clusters as well as on clusters supported on graphene (Cu4−nSnn/graphene) and on the partially hydroxylated (110) surface of γ-Al2O3 (Cu4−nSnn/γ-Al2O3). Finally, the free energies of the competitive HER on Cu4−nSnn, Cu4−nSnn/graphene and Cu4−nSnn/γ-Al2O3 were also computed, from which we could conclude on the effect of composition and support on the selectivity towards CO or HCOOH.
2. Computational details
2.1 Computational methods
All DFT calculations were conducted with the “Vienna ab initio simulation package” (VASP, version 6.3.0)30 together with the Perdew–Burke–Ernzerhof (PBE) exchange correlation functional31 and the dispersion correction (Grimme's-D3).32,33 A single (1 × 1 × 1) k-point and a (3 × 3 × 1) mesh were used for the nanoclusters and surface models, respectively, to sample the Brillouin zone of the simulation supercell. A plane-wave basis set within the framework of the projector augmented wave method33 was used with a kinetic energy cutoff set to 450 eV. The transition state structures connecting adsorbed CO2* and CO* + O* were determined using the climbing image nudged elastic band (cNEB) as implemented in VASP.33,34 The eCO2R to HCOOH and CO includes two concerted proton–electron transfer (CPET) steps. For example, the CPET steps leading to CO formation are (i) CO2* + (H+ + e−) → COOH* and (ii) COOH* + (H+ + e−) → CO + H2O.35 The competitive HER to generate H2 involves a single CPET step: H+ + e− → 1/2 H2. The reaction free energies of these CPET steps were calculated using the computational hydrogen electrode (CHE) approach:36| ΔG = ΔEDFT + ΔEZPE − TΔS + ΔGpH + ΔGU | (1) |
2.2 Computational models
The structures of Cu–Sn nanocluster models were identified using the ab initio random structure searching (AIRSS) code,40 an unbiased approach that has been used extensively to predict the structure of a variety of materials, including clusters.41,42 The starting point for each calculation is a set of atoms corresponding to the monometallic, (Cu4) and (Sn4), and bimetallic, Cu4−nSnn (n = 1–3), clusters placed randomly within the central volume of a large cube of edge length 20 Å to minimize the interactions between the periodic images. For each system, we generated fifty random structures. The efficiency of the searches was improved by employing constraints on the minimum interatomic separations of the initial structure: d(Cu–Cu) = 2.1 Å and d(Sn–Sn) = 2.6 Å.42 The energies of the atomic structures generated by AIRSS were determined with VASP. From the DFT energies of the random structure, the Boltzmann factor fi corresponding to each ith isomer was evaluated according to the expression | (2) |
3. Results and discussion
3.1 Structure, stability, and electronic properties of Cu–Sn clusters
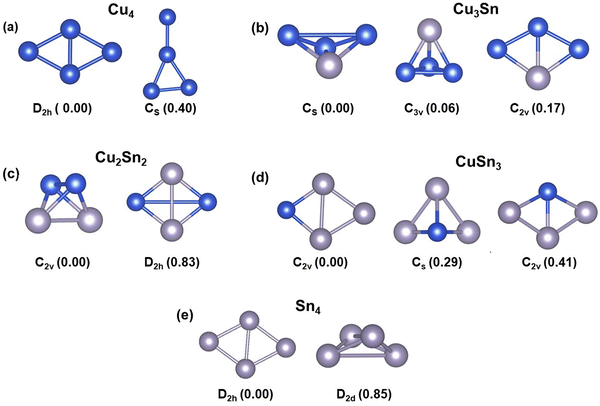
The structures and relative energies of the low energy isomers of the tetrahedral Cu4−nSnn (n = 0–4) clusters are reported in Fig. 1. Since the thermal energy is kBT = 0.025 eV at T = 298.15 K, where kB is the Boltzmann constant, we expect that for each cluster more than one isomer may coexist at room temperature if their energies are within the 0.25 eV energy range. According to Fig. 1, except for Cu3Sn, the other bimetallic Cu–Sn clusters and pure Cu4 and Sn4 exist as one isomer at room temperature because the energy difference between the most stable isomer and its next higher energy isomer is more than 0.25 eV. The ground state of Cu4 is a two-dimensional structure with D2h symmetry, in agreement with previous studies (Fig. 1a).7,20,46 The next higher energy isomer of Cu4 is also a 2D structure with a planar-triangular geometry and Cs symmetry, which is 0.4 eV higher in energy than the lowest energy isomer. The bimetallic Cu3Sn cluster has three isomers with similar energy: the most stable is a distorted three-dimensional (3D) structure with Cs symmetry, followed by an isomer of tetrahedral geometry (0.06 eV), and an isomer where the planarity of the Cu4 cluster is preserved (C2v symmetry, 0.17 eV) (Fig. 1b). For Cu2Sn2, the distorted 3D (C2v) and tetrahedral (D2h) structures were found to be the most stable isomers but in this bimetallic cluster the energy difference between them is large (0.83 eV) (Fig. 1c). For CuSn3, the ground-state 2D structure with the Sn atoms forms trigonal geometry with the Cu atom at the lateral position, the second most stable isomer is a 3D pyramidal structure, and the least stable one has a 2D rhombus-like geometry (Fig. 1d). Like Cu4, the most stable isomer of the Sn4 cluster has a two-dimensional structure with D2h symmetry (Fig. 1e). Overall, the four atom clusters of the ground-states of monometallic Cu4 and Sn4 have a 2D planar rhombus-like geometry, whereas the mixed Cu–Sn clusters tend to form distorted 3D, tetrahedral, and quasi-planar geometries.To gain insights into the relative stabilities of pure and bimetallic four-atom systems, we computed the binding energy per atom (EB), here defined as
 | (3) |
| Δ2E(CunSnm) = E(Cun+1Snm−1) + E(Cun−1Snm+1) − 2(CunSnm) | (4) |
| System | Symmetry | E B (eV) | Δ2E (eV) | ΔH–L (eV) | Q B(Cu) (e) | Q B(Sn) (e) | d Cu–Cu (Å) | d Cu–Sn (Å) | d Sn–Sn (Å) |
|---|---|---|---|---|---|---|---|---|---|
| Cu4 | D 2h | 1.42 | — | 0.94 | — | — | 2.34 | — | — |
| C s | 1.32 | — | 0.96 | — | — | 2.32 | — | — | |
| Cu3Sn1 | C s | 1.68 | 0.08 | 1.33 | −0.67 | 2.01 | 2.8 | 2.53 | — |
| C 3v | 1.66 | — | 1.71 | −0.64 | 1.91 | 2.43 | 2.53 | — | |
| C 2v | 1.64 | — | 1.67 | −0.61 | 1.84 | 2.33 | 2.54 | — | |
| Cu2Sn2 | C 2v | 1.92 | 1.01 | 0.97 | −0.92 | 0.92 | 2.49 | 2.6 | 2.88 |
| D 2h | 1.71 | — | 0.91 | −1.68 | 1.68 | 3.94 | 2.52 | 3.14 | |
| Cu1Sn3 | C s | 1.91 | −0.97 | 1.94 | −1.81 | 0.60 | — | 2.53 | 2.84 |
| C s | 1.84 | — | 1.29 | −1.38 | 0.46 | — | 2.63 | 3.04 | |
| C 2v | 1.81 | — | 1.33 | −0.69 | 0.23 | — | 2.62 | 2.78 | |
| Sn4 | D 2h | 2.14 | — | 1.03 | — | — | — | — | 2.92 |
| D 2d | 1.93 | — | 1.62 | — | — | — | — | 3.27 |
From Table 1, the stability correlates with the average interatomic distances in the cluster. The average Cu–Cu distance of the lowest energy isomer is 2.34 Å, in good agreement with other DFT plane wave studies of Cu clusters (2.36 Å).47 This average interatomic distance increases to 2.92 Å in Sn4 because of the different atomic radii of Cu (1.28 Å) and Sn (1.41 Å). In the bimetallic clusters, the trend is an increase of Cu–Cu and a decrease of Sn–Sn, while Cu–Sn distances lie between the Cu–Cu and Sn–Sn distances. We also conducted a Bader charge (QB) analysis to determine the charge distribution in the Cu–Sn clusters.48–50 In Cu3Sn, Cu2Sn2 and CuSn3, the copper and tin atoms have negative and positive Bader charges, respectively (see Table 1). Consequently, during the reduction reaction, the electron transfer process will occur from the electron-rich Cu atoms to the C atom of CO2, which is in its highest oxidation state. A descriptor to analyze the global reactivity is the gap energy, ΔH–L. This property relates to the energy cost for an electron to jump from the HOMO to the LUMO orbital and, therefore, characterizes the chemical stability of the system, with a higher value of ΔH–L corresponding to a more chemically stable (less reactive) cluster. If we compare the values of ΔH–L of the most stable isomers of each monometallic and bimetallic cluster, Cu4 has the lowest HOMO–LUMO gap (0.94 eV). This value increases substantially for Cu3Sn (1.33 eV) and CuSn3 (1.94 eV) but is similar in Cu2Sn2 (0.97 eV). In summary, from the energy descriptors EB and Δ2E and the electronic descriptor ΔH–L, Cu2Sn2 is the most stable cluster and maintains the reactivity of the pure copper cluster.
3.2 The adsorption and activation of CO2
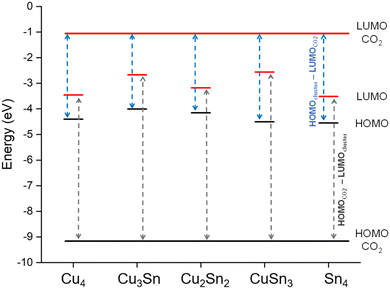
The activation of CO2 is a result of the electronic charge transfer from the HOMO of the cluster to the LUMO of the CO2 molecule.51 To investigate the direction of charge migration between the clusters and CO2, we have compared in Fig. 2 the energies of the HOMO and LUMO of the most stable isomers of Cu–Sn with those of gas-phase CO2. For all clusters, the energy difference between the HOMO of CO2 and the LUMO of the clusters (dark gray dashed line) is higher than the energy difference between the HOMO of the clusters and the LUMO of CO2 (blue dashed line). For example, the energy difference between the HOMO of Cu4 and the LUMO of CO2 is 3.38 eV, while the energy difference between the HOMO of CO2 and the LUMO of Cu4 is 5.68 eV. Similarly, the energy difference between the HOMO of monometallic Sn4 and the LUMO of CO2 is 3.52 eV, while the energy difference between the HOMO of CO2 and the LUMO of monometallic Sn4 is 5.62 eV. The charge migration from clusters to the CO2 molecule is favorable, which results in radical anion CO2−δ formation upon CO2 adsorption.The first step in the catalytic conversion of CO2 is the adsorption process, in which the molecule can physisorb or chemisorb to the catalyst. In the physisorbed state, the CO2 molecule maintains the C–O bond length (1.18 Å) and the O–C–O bond angle (180°) of the gas phase molecule. In contrast, in the chemisorbed state, the CO2 molecule shows elongated C–O bonds and a decreased O![[double bond, length as m-dash]](https://www.rsc.org/images/entities/char_e001.gif) C
C![[double bond, length as m-dash]](https://www.rsc.org/images/entities/char_e001.gif) O bond angle (linear to bent mode), which corresponds to the activation of CO2 because of the charge transferred from the metal catalyst to the π* molecular orbitals of the CO2 molecule.52Fig. 3 displays the physisorption and chemisorption of CO2 on monometallic and bimetallic four-atom Cu4−nSnn (n = 0–4) clusters. When physisorbed, CO2 prefers “top” coordination with the O interacting with the Cu atom. When chemisorbed, CO2 coordinates at the bridge site between the electron-rich Cu and the electron-deficient Sn (Table 1) leading to the formation of Cu–C and Sn–O bonds. From Fig. 3, we also note that on the pure tin cluster, Sn4, we could only locate a weakly physisorbed CO2 state. We have further characterised in Table 2 the interaction and activation of CO2 on the Cu4−nSnn (n = 0–4) clusters relative to the properties of the CO2 molecule in gas phase using the following energetic, structural, and electronic indicators: adsorption energy (ΔECO2); C–O elongation (dC–O); O–C–O angle bending (θOCO); and charge transfer from the cluster to CO2 (ΔQ). The adsorption energy (ΔECO2) was computed according to the following expression:
O bond angle (linear to bent mode), which corresponds to the activation of CO2 because of the charge transferred from the metal catalyst to the π* molecular orbitals of the CO2 molecule.52Fig. 3 displays the physisorption and chemisorption of CO2 on monometallic and bimetallic four-atom Cu4−nSnn (n = 0–4) clusters. When physisorbed, CO2 prefers “top” coordination with the O interacting with the Cu atom. When chemisorbed, CO2 coordinates at the bridge site between the electron-rich Cu and the electron-deficient Sn (Table 1) leading to the formation of Cu–C and Sn–O bonds. From Fig. 3, we also note that on the pure tin cluster, Sn4, we could only locate a weakly physisorbed CO2 state. We have further characterised in Table 2 the interaction and activation of CO2 on the Cu4−nSnn (n = 0–4) clusters relative to the properties of the CO2 molecule in gas phase using the following energetic, structural, and electronic indicators: adsorption energy (ΔECO2); C–O elongation (dC–O); O–C–O angle bending (θOCO); and charge transfer from the cluster to CO2 (ΔQ). The adsorption energy (ΔECO2) was computed according to the following expression:
| ΔECO2 = E[(Cu4−nSnn)⋯CO2] − E(CO2) − E(Cu4−nSnn) | (5) |
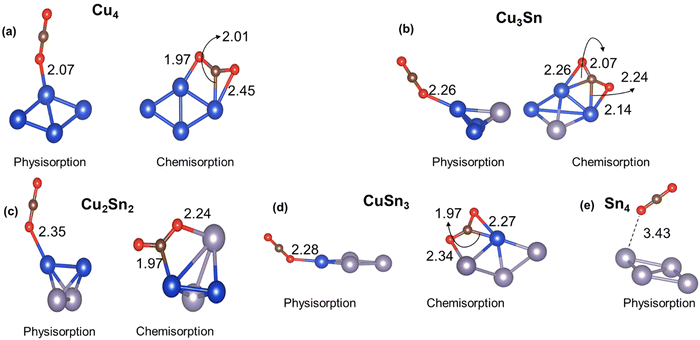 | ||
| Fig. 3 Lowest energy structures of CO2 physisorbed and chemisorbed on monometallic and bimetallic Cu–Sn clusters. Blue, grey, brown, and red balls represent Cu, Sn, C and O atoms, respectively. | ||
| System | Physisorption | Chemisorption | ||||||
|---|---|---|---|---|---|---|---|---|
| ΔECO2 (eV) | d C–O (Å) | θ OCO (°) | ΔQ (e) | ΔECO2 (eV) | d C–O (Å) | θ OCO (°) | ΔQ (e) | |
| Cu4 | −0.32 | 1.18, 1.17 | 179.7 | −0.01 | −0.53 | 1.26, 1.22 | 140 | −0.51 |
| Cu3Sn | −0.32 | 1.18,1.17 | 179.5 | −0.03 | −0.21 | 1.23,1.24 | 142.6 | −0.52 |
| Cu2Sn2 | −0.14 | 1.18, 1.17 | 179.3 | −0.02 | 0.50 | 1.28, 1.22 | 132.7 | −0.64 |
| CuSn3 | −0.18 | 1.19, 1.17 | 179.6 | −0.01 | 0.40 | 1.24, 1.27 | 136.9 | −0.70 |
| Sn4 | −0.16 | 1.18, 1.80 | 179.9 | 0.00 | — | — | — | — |
The results in Table 2 confirm that when CO2 chemisorbs to the cluster, there is a significant elongation of the C–O bond, loss of linearity of CO2, and charge transfer, which does not occur when CO2 is physisorbed. For the chemisorbed state, the inclusion of Sn leads to a more pronounced bending of the CO2 molecule (140.0° for Cu, 142.6° for Cu3Sn, 132.7° for Cu2Sn2, and 136.9° for Cu3Sn) and charge transfer compared to pure Cu (−0.51e for Cu4, −0.52 for Cu3Sn, −0.64e for Cu2Sn2, and −0.70e for CuSn3). However, there is a counterintuitive behaviour in the inverse relationship between the charge transferred to CO2 and the adsorption energy: a higher charge transfer from the Cu–Sn cluster to CO2 does not correspond to a favourable adsorption energy. As shown in Table 2, the interaction of CO2 on Cu4 and Cu3Sn is favourable for both chemisorption and physisorption (ΔECO2 < 0 in Table 2). On the other hand, for the other Cu–Sn clusters, the CO2 chemisorption (ΔECO2 > 0) is less stable than physisorption (ΔECO2 < 0). The higher activation of CO2 in Sn-bearing clusters (charge transfer and bending) does not correspond to a favourable interaction between the CO2 and the catalyst, as previously shown in tetrahedral Cu–Pd, Cu–Ni, and Cu–Zr clusters.20,21 For the Cu3Sn system, we have considered the CO2 adsorption on the three low-energy isomers in Fig. 1(b) because their energy difference is less than 0.2 eV but, upon optimization, the C2v and C3v isomers of Cu3Sn rearranged to the Cs isomer (see Fig. S5 in the ESI†). The structures of the Cu3Sn···CO2 complex in Fig. 2(b) and the values in Table 2 refer to the lowest energy adsorption site of CO2. In comparison, previous DFT calculations of CO2 adsorption on other four-atom Cu clusters doped with Pd, Ni, Pt and Zr reported values of ΔECO2 (up to −1 eV) corresponding to more favorable adsorption and Bader charge transfer (up to 1e) compared to the Cu–Sn clusters (Table S3 of the ESI†).18–20 CO2 is adsorbed weakly on the Cu–Sn clusters compared to Cu–Pd, Cu–Ni, Cu–Pt and Cu–Zr. However, the values of θOCO and dCO are close to those found for Cu–Pd, Cu–Ni, Cu–Pt and Cu–Zr (Table S3, ESI†). Therefore, adsorption energy is not always a good indicator of CO2 activation.
The adsorption energy, bond length, bond angle, and the overall charge of the CO2 molecule physisorbed on graphene and γ-Al2O3 supported Cu4−nSnn (n = 0–4) clusters are reported in Table S4 of the ESI.† For most clusters on graphene and γ-Al2O3, the physisorption of CO2 has favourable adsorption energy with a small charge transfer, between −0.01e and −0.03e, to the CO2 molecule. However, for CuSn3/graphene and Cu3Sn/γ-Al2O3, CO2 is in the chemisorbed state, as shown by the significant bending of CO2 and elongation of C–O (Fig. S3 and S4 of the ESI†). The Bader charge transfer for the chemisorbed CO2 is between −1.0 and −1.6e, much higher than that for the unsupported clusters reported in Table 2 (−0.5 to −0.7e). However, the chemisorption of CO2 is not favorable in CuSn3/graphene, as evidenced by the positive adsorption energy of 0.34 eV. Similarly, for Cu3Sn/γ-Al2O3, the chemisorption of CO2 seems to be favorable with a high Bader charge transferred to CO2.
3.3 CO2 direct dissociation over Cu4−nSnn clusters
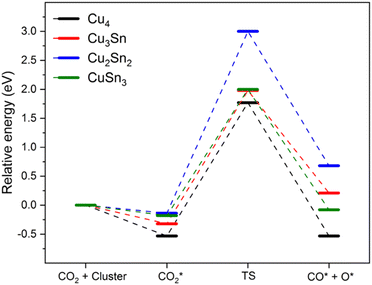
The favorable chemisorption on monometallic Cu4 compared to Cu–Sn clusters motivated us to determine if the activation of CO2 (chemisorption) affects the kinetic barrier for breaking the C–O bond. To model the gas-phase CO2 dissociation on the Cu4−nSnn (n = 0–4) clusters we used the following reaction: CO2* → CO* + O*. To this end, we performed transition state search calculations to find the energy barrier to break one of the C–O bonds of the CO2 molecule. The starting point was the most stable structure of adsorbed CO2. The final product was modelled by choosing the most elongated C–O bond of the adsorbed CO2, systematically increasing the bond distance to nearly 3.0 Å and optimizing the resulting structure.21 The relative energies of the reactant complexes (CO2*), transition state (TS) and product complexes (CO* + O*) are reported in Fig. 4 together with the structures of these intermediates for Cu4. The optimized structures of the initial state, transition state, and final state involved in CO2 direct dissociation to CO over the other clusters are reported in Fig. S1 of the ESI.† Activation barriers of forward (Ea,f) and backward (Ea,b) reactions, the reaction energy (ΔE) measuring the energy difference between the reactant (CO2*) and the product (CO* + O*), and the C–O bond distance of the adsorbed CO fragment in the final dissociated product (dCO) are summarized in Table 3. The energy barrier to dissociate adsorbed CO2 and form the CO* and O* products is between 2.2 and 3.1 eV. Specifically, the activation energy for the dissociation of CO2 on Cu4 is 2.3 eV, which is close to the value of 2.4 eV obtained by Mondal and co-workers using the B3LYP functional with the Stuttgart pseudopotential basis set (SDD) for Cu and the triple-zeta basis set for C and O.21 However, another DFT study using the PBE0 functional with the SDD basis set for all atoms gave a much lower barrier of 1.8 eV.20 The double zeta basis set in these calculations could cause such discrepancy, not observed in our case because of the use in this study of delocalized plane waves to describe all atoms. As the reaction energy over Cu4 is close to zero, the direct gas-phase CO2 dissociation could thermodynamically occur on this cluster, but the process is kinetically limited. The results in Table 3 also suggest that except for Cu2Sn2, the energetics of the CO2 direct dissociation reaction are not significantly affected by the incorporation of Sn. The activation barrier for Cu3Sn is similar to that of monometallic Cu4 (see Fig. 4). It is the highest for Cu2Sn2 (3.1 eV), and the lowest for CuSn3 (2.18 eV). The formation of Cu–Sn bonds does not lower the activation energy compared to the monometallic clusters, leading to values for the kinetic barriers close to that found for Cu4, suggesting a lack of synergy between copper and tin atoms to modulate activation barriers of the gas-phase CO2 direct dissociation. In comparison, other reports of four-atom copper-based clusters showed modulation of the activation barriers (higher or lower values of ΔE and Ea,f) depending on the cluster composition. For Cu–Zr, the activation barrier was found to be between 0.13 and 0.52 eV, with Cu3Zr having the lowest activation energy but also strong adsorption (−3.1 eV) of the final product (*CO and O*), which could lead to poisoning of the catalyst surface.21 The CO2 direct dissociation on Cu–Pd clusters had an activation barrier of 1.1 to 2.8 eV, values which are generally lower than those for Cu–Sn (Table 3). The activation barriers of the direct CO2 dissociation on the Cu–Sn clusters are also higher than those reported for four-atom Pt–Ni clusters.53| System | E A (eV) | E a,f (eV) | E a,b (eV) | ΔE (eV) | d CO (Å) |
|---|---|---|---|---|---|
| Cu4 | −0.53 | 2.30 | 2.30 | 0.00 | 1.16 |
| Cu3Sn1 | −0.32 | 2.30 | 2.09 | 0.21 | 1.16 |
| Cu2Sn2 | −0.14 | 3.14 | 2.32 | 0.82 | 1.15 |
| Cu1Sn3 | −0.18 | 2.18 | 2.10 | 0.08 | 1.15 |
The adsorption energy of CO2 on these clusters is significantly lower than the dissociation barrier for the cleavage of the C–O bond, suggesting that the adsorption of CO2 will be more favorable than the direct dissociation of CO2. The positive values of the reaction energy ΔE, which is the energy difference between the reaction and the final products, suggest that for Cu2Sn2 and Cu3Sn, the dissociation of CO2 to CO + O is endothermic. The highly positive ΔE of 0.82 for Cu2Sn2 compared to other clusters indicates that this would have an unstable final product. In summary, the gas-phase CO2 direct dissociation, CO2* → CO* + O*, is kinetically and thermodynamically unfavourable on Cu–Sn clusters and unlikely to occur.
3.4 Mechanisms of reduction reactions on Cu–Sn clusters
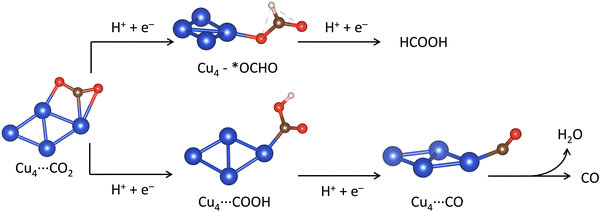
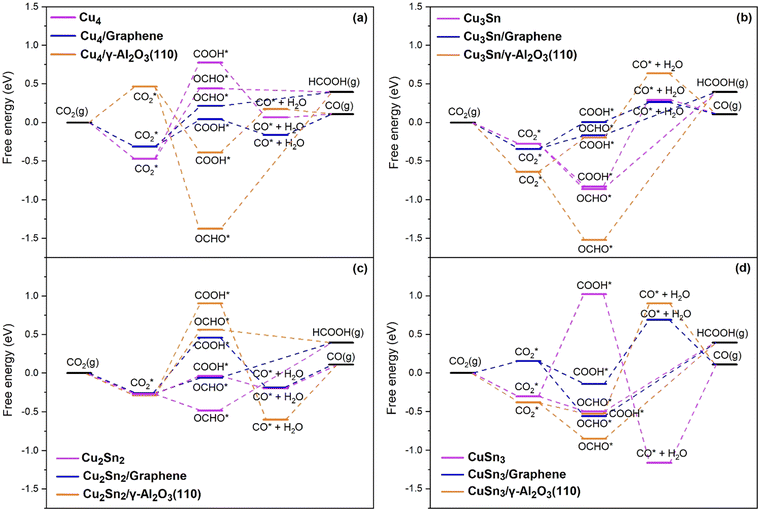
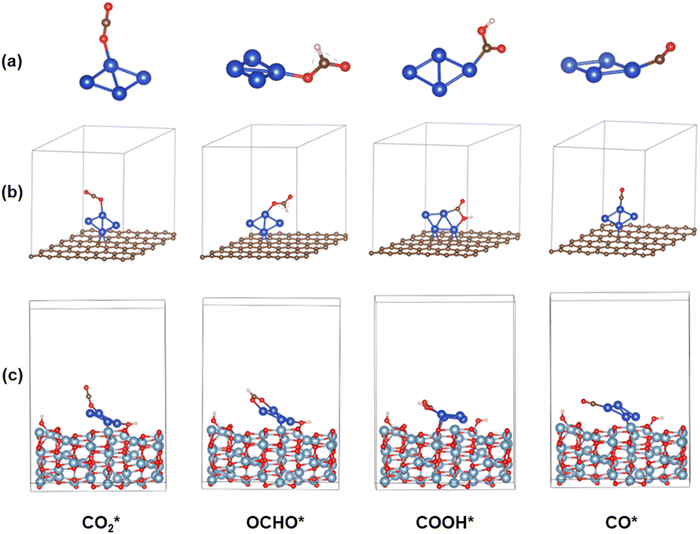
The Gibbs free energy diagrams of the eCO2R reaction on the Cu4−nSnn (n = 0–4) clusters in Fig. 6(a–d) show that the CPET steps controlling the distribution of the HCOOH and CO products are significantly affected by the cluster composition and the type of support. Graphene-supported Cu–Sn clusters give lower energetic pathways for CO and HCOOH compared to γ-Al2O3. The optimized structures of the intermediates involved in the eCO2R on the isolated and supported Cu4 clusters are shown in Fig. 7. The Gibbs free energy diagram for the eCO2R pathways to HCOOH and CO on each Cu–Sn cluster is discussed in detail below. The optimized structures of the intermediates CO2*, OCHO*, COOH*, and CO* adsorbed on Cu4, Cu4/graphene, and Cu4/γ-Al2O3 are shown in Fig. 7. The intermediates over the other Cu–Sn clusters are reported in Fig. S2 and S4 of the ESI.†
Cu4. According to Fig. 6(a), the adsorption of CO2 is favorable on Cu4 and Cu4/graphene but not on Cu4/γ-Al2O3 (ΔGCO2* = 0.6 eV). On Cu4, the eCO2R is selective towards HCOOH because of the lower free energy of the *OCHO intermediate (ΔGOCHO* = 0.7 eV) compared to *COOH (ΔGCOOH* = 1.0 eV). On Cu4/γ-Al2O3, the intermediate OCHO* binds strongly to the catalyst (ΔGOCHO* = −1.8 eV) compared to COOH* (ΔGCOOH* = −0.9 eV). Consequently, the subsequent CPET step favors CO formation as it is easier to release CO as a product from the catalyst than HCOOH. For Cu4/graphene, the selectivity is towards CO formation as it is easier to form *COOH (ΔGCOOH* = −0.4 eV) than *OCHO (ΔGOCHO* = 0.5 eV). In addition, the next CPET step from *COOH to *CO is also favorable (ΔGCO* = −0.2 eV). In summary, while the isolated Cu4 is selective towards HCOOH, the effect of both graphene and γ-Al2O3 (110) is to drive the reaction towards CO formation. However, the strong binding of OCHO* on Cu4/γ-Al2O3 could poison the eCO2R on this catalyst.
Cu3Sn. In Fig. 6(b), the CPET steps leading to the formation of *OCHO (ΔGOCHO* = −0.9 eV) and *COOH (ΔGCOOH* = −0.9 eV) on the most stable isomer of Cu3Sn (Cs) are both exergonic and the subsequent steps to generate HCOOH (ΔGHCOOH = 1.4 eV) and CO (ΔGCO* = 1.1 eV) are highly endothermic. The Gibbs free energy diagrams for the other two isomers of Cu3Sn are given in Fig. S6 (ESI†). On Cu3Sn/γ-Al2O3, the strong binding of the *OCHO intermediate makes the formation of HCOOH (ΔGHCOOH = 1.9 eV) highly unfavourable compared to *CO (ΔGCO* = 0.8 eV). The subsequent step to release CO is exergonic (ΔGCO(g) = −0.5 eV). Unlike Cu3Sn and Cu3Sn/γ-Al2O3, on graphene the energetics for the reaction steps leading to HCOOH and CO are similar. The formation of *OCHO (ΔGOCHO* = 0.2 eV) is slightly favored compared to *COOH (ΔGCOOH* = 0.3 eV). However, the next step from *OCHO to HCOOH(g) has higher positive free energy (ΔGHCOOH(g) = 0.6 eV) relative to the formation of CO* (ΔGCO* = 0.3 eV), whose desorption energy from the surface (ΔGCO(g)) is −0.2 eV.
Cu2Sn2. For the Cu2Sn2 system, the *OCHO intermediate (ΔGOCHO* = −0.2 eV) is more stable than *COOH (ΔGCOOH* = 0.3 eV), but, overall, the energy pathway of CO formation (ΔGCO* = −0.2 eV) is lower than that of HCOOH(g) formation (ΔGHCOOH(g) = 0.8 eV). This Cu–Sn cluster is, therefore, selective towards CO. The support effect is destabilizing both *OCHO and *COOH intermediates. On Cu2Sn2/graphene, the *OCHO formation (ΔGOCHO* = 0.2 eV) is more favorable than *COOH formation (ΔGCOOH* = 0.7 eV) and the overall selectivity is towards HCOOH compared to CO as it has the lowest energetic pathway. On the Cu2Sn2/γ-Al2O3 system, the first CPET steps to form COOH* (ΔGCOOH* = 1.2 eV) and OCHO* (ΔGOCHO* = 0.8 eV) are both highly unfavorable. The overall product selectivity is towards HCOOH relative to CO, as evidenced by the overpotential for HCOOH (0.44 eV) being less than that for CO (1.07 eV) formation.
CuSn3. For gas-phase CuSn3, the electrochemical CO2-to-CO conversion is highly unfavourable because of the strong CO* adsorption (ΔGCO* = 2.2 eV). In comparison, the highest free energy of the reaction step for the HCOOH pathway is ΔGHCOOH(g) = 0.9 eV. The CuSn3 cluster is, therefore, selective towards the formation of HCOOH. In the Cu3Sn/γ-Al2O3 system, the *OCHO formation (ΔGOCHO* = −0.5 eV) is more favourable than COOH* formation (ΔGCOOH* = −0.1 eV). The subsequent steps from *COOH to *CO (ΔGCO* = 1.4 eV) and from *OCHO to HCOOH (ΔGHCOOH = 1.2 eV) are unfavourable. The HCOOH reaction pathway is lower compared to CO in this system. For the CuSn3/graphene system, the *OCHO intermediate (ΔGOCHO* = −0.7 eV) is more favourable than *COOH (ΔGCOOH* = −0.3 eV). The subsequent steps for both initial intermediates have a positive Gibbs free energy (ΔGCO* = 0.8 eV and ΔGHCOOH(g) = 1.0 eV). Moreover, the limiting potential for the electrochemical pathways shows CO (0.83 V) to be slightly lower than HCOOH (0.95 V).
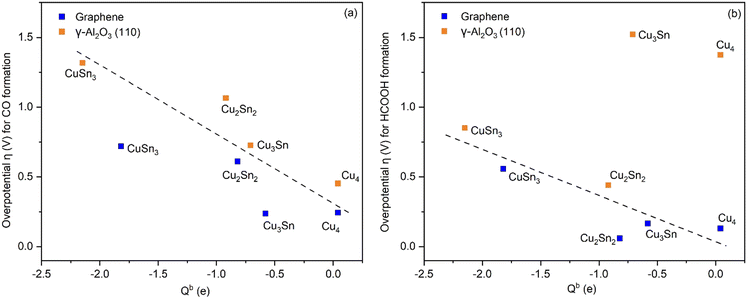
The correlation of the Bader charge of Cu of supported clusters with the overpotential for the eCO2R reactions to HCOOH and CO is reported in Fig. 8. For both reaction pathways, the greater the negative charge on Cu, the higher the overpotential. The only exceptions are Cu4 and Cu3Sn on γ-Al2O3. Since the site for CO2 adsorption on the clusters is always the Cu atom (see Fig. S4, ESI†), a higher charge transferred to the Cu atoms will lead to stronger binding of the intermediates. However, there is a difference in the charge distribution on the catalyst depending on the support. For the Cu–Sn clusters on γ-Al2O3, the Bader charge of Cu is higher compared to the case when the support is graphene. This behavior correlates with a higher overpotential for the reactions on Cu–Sn/γ-Al2O3 (vide infra). Overall, the cluster composition and support influence the reaction energetics and hence the final product selectivity. This shows the importance of tuning the properties of the active sites to tune the binding of the intermediates to control the selective formation of a specific product.
| UL = −ΔGmax/ne | (6) |
| η = Ueq − UL | (7) |
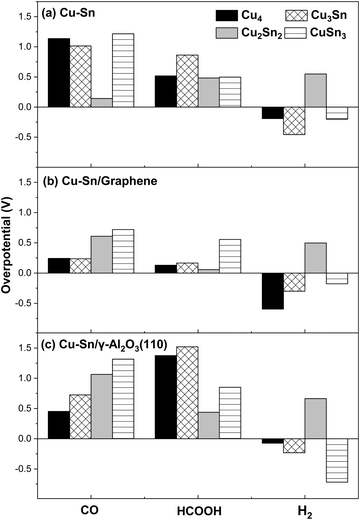 | ||
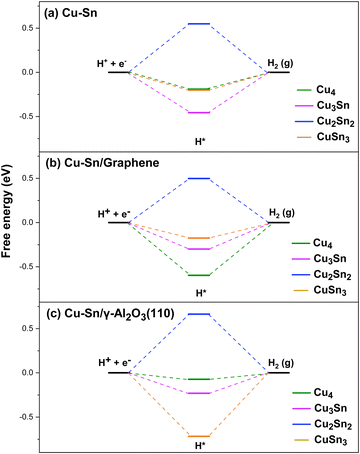
| Fig. 10 Overpotential for the electrocatalytic formation of CO, HCOOH and H2 on (b) isolated CunSn2-n, (b) CunSn2-n/graphene, and (c) γ-Al2O3. | ||
The eCO2R on the isolated Cu2Sn2 cluster displays high selectivity towards CO since it has low overpotential (high catalytic activity) for CO formation (0.14 V) and high overpotential for H2 (0.55 V) and HCOOH (0.48 V) formation (low catalytic activity). The Cu2Sn2 catalyst could significantly enhance carbon monoxide selectivity because it is both less selective to formic acid and suppresses HER. CO is the key intermediate in the mechanism of eCO2R on copper-based catalysts for the generation of C1 and C2+ value-added chemicals such as methane, methanol, ethanol, ethylene, and others.3 On graphene, however, Cu2Sn2 has the lowest overpotential for HCOOH (0.06 V) compared to the relatively high overpotential for CO (0.61 V) and H2 (0.50 V) formation and, consequently, Cu2Sn2 is selective towards formic acid. Of the γ-Al2O3 supported clusters, Cu2Sn2 has the lowest overpotential for HCOOH (0.44 V). However, it is more susceptible to the HER, as the overpotential for H2 formation is only slightly higher (0.66 V). The other clusters show negative overpotentials for the HER and therefore are unlikely to be selective towards the eCO2R reaction. Overall, these results show the combined effects of the composition of the cluster and its supporting material on the selectivity towards CO, HCOOH or H2.
4. Conclusions
In this work, we conducted density functional theory calculations to characterize the properties of pristine Cu4−nSnn (n = 0–4) clusters and their ability to absorb, activate, and convert CO2 to carbon monoxide (CO) and formic acid (HCOOH). We have divided the discussion of the calculations into four sections: (a) structure, stability, and electronic properties of Cu4−nSnn clusters; (b) CO2 binding and activation over the most stable systems; (c) kinetics of the gas phase CO2 direct dissociation on Cu4−nSnn clusters to generate CO; and (d) liquid-phase electrochemical CO2 reduction reactions to CO and HCOOH on Cu4−nSnn clusters and graphene and γ-Al2O3 supported Cu–Sn clusters and their competition with the hydrogen evolution reaction. The energy descriptors, binding energy per atom and the second-order difference in energy, identify Cu2Sn2 as the most stable cluster. The electronic energy descriptor HOMO–LUMO gap also suggests that the reactivity of the pure copper cluster, Cu4, is maintained for Cu2Sn2 compared to the other Cu–Sn systems. Moreover, Cu2Sn2 activates CO2 as shown by pronounced bending of the linear O![[double bond, length as m-dash]](https://www.rsc.org/images/entities/char_e001.gif) C
C![[double bond, length as m-dash]](https://www.rsc.org/images/entities/char_e001.gif) O molecule. Calculations of the free energies for CO2 reduction pathways to HCOOH and CO show that the isolated Cu2Sn2 system has the highest potential as a stable and selective catalyst for the electrochemical CO2 conversion to CO. But when supported on γ-Al2O3 and graphene, the electrochemical CO2 reduction on Cu2Sn2 favors HCOOH formation, particularly over the Cu2Sn2/graphene catalyst. In addition, Cu2Sn2 suppresses hydrogen evolution reaction. We can conclude that the isolated Cu2Sn2 system has the highest potential as a stable and selective catalyst for the electrochemical CO2 conversion to CO. When supported on graphene and γ-Al2O3 (110) surfaces, Cu2Sn2 can selectively generate HCOOH.
O molecule. Calculations of the free energies for CO2 reduction pathways to HCOOH and CO show that the isolated Cu2Sn2 system has the highest potential as a stable and selective catalyst for the electrochemical CO2 conversion to CO. But when supported on γ-Al2O3 and graphene, the electrochemical CO2 reduction on Cu2Sn2 favors HCOOH formation, particularly over the Cu2Sn2/graphene catalyst. In addition, Cu2Sn2 suppresses hydrogen evolution reaction. We can conclude that the isolated Cu2Sn2 system has the highest potential as a stable and selective catalyst for the electrochemical CO2 conversion to CO. When supported on graphene and γ-Al2O3 (110) surfaces, Cu2Sn2 can selectively generate HCOOH.
Author contributions
Conceptualisation of work: AM, AGN and DDT; conduction of computations: AM and QZ; data analyses: AM and AGN, AR; data dissemination & graphics: AM and DDT; writing of the manuscript: AM, AGN and DDT; project support: AR, DDT.Data availability
Raw data were generated at Queen Mary's Apocrita HPC facility. Derived data supporting the findings of this study are available from the corresponding author (DDT) on request.Conflicts of interest
The authors declare that the research was conducted in the absence of any commercial or financial relationships that could be construed as a potential conflict of interest.Acknowledgements
A.G.N acknowledges the Pakistan HEC-QMUL PhD Scholarships for funding. Q.Z. thanks the China Scholarship Council for financial support. D.D.T acknowledges the ACT programme (Accelerating CCS Technologies, Horizon2020 Project no. 294766), which funded the FUNMIN project. Financial contributions from the Department for Business, Energy & Industrial Strategy (BEIS) together with extra funding from NERC and EPSRC research councils, United Kingdom, ADEME (FR), and MINECO-AEI (ES) are acknowledged. We are grateful to the UK Materials and Molecular Modelling Hub for computational resources, which is partially funded by EPSRC (EP/T022213/1, EP/W032260/1 and EP/P020194/1). Via our membership of the UK's HEC Materials Chemistry Consortium, which is funded by EPSRC (EP/L000202), this work used the ARCHER UK National Supercomputing Service (https://www.archer.ac.uk). This research utilized Queen Mary's Apocrita HPC facility, supported by QMUL Research-IT, https://doi.org/10.5281/zenodo.438045.References
- Y.-X. Duan, F.-L. Meng, K.-H. Liu, S.-S. Yi, S.-J. Li, J.-M. Yan and Q. Jiang, Adv. Mater., 2018, 30, 1706194 CrossRef PubMed.
- J. Houghton, Rep. Prog. Phys., 2005, 68, 1343–1403 CrossRef.
- S. Nitopi, E. Bertheussen, S. B. Scott, X. Liu, A. K. Engstfeld, S. Horch, B. Seger, I. E. L. Stephens, K. Chan, C. Hahn, J. K. Nørskov, T. F. Jaramillo and I. Chorkendorff, Chem. Rev., 2019, 119, 7610–7672 CrossRef CAS PubMed.
- R. Kortlever, J. Shen, K. J. P. Schouten, F. Calle-Vallejo and M. T. M. Koper, J. Phys. Chem. Lett., 2015, 6, 4073–4082 CrossRef CAS PubMed.
- X. Chen, J. Chen, N. M. Alghoraibi, D. A. Henckel, R. Zhang, U. O. Nwabara, K. E. Madsen, P. J. A. Kenis, S. C. Zimmerman and A. A. Gewirth, Nat. Catal., 2021, 4, 20–27 CrossRef CAS.
- Q. Lu and F. Jiao, Nano Energy, 2016, 29, 439–456 CrossRef CAS.
- B. Yang, C. Liu, A. Halder, E. C. Tyo, A. B. F. Martinson, S. Seifert, P. Zapol, L. A. Curtiss and S. Vajda, J. Phys. Chem. C, 2017, 121, 10406–10412 CrossRef CAS.
- C. Liu, B. Yang, E. Tyo, S. Seifert, J. DeBartolo, B. von Issendorff, P. Zapol, S. Vajda and L. A. Curtiss, J. Am. Chem. Soc., 2015, 137, 8676–8679 CrossRef CAS PubMed.
- P. S. Sai Prasad, J. W. Bae, K.-W. Jun and K.-W. Lee, Catal. Surv. Asia, 2008, 12, 170–183 CrossRef.
- G. M. Tomboc, S. Choi, T. Kwon, Y. J. Hwang and K. Lee, Adv. Mater., 2020, 32, 1908398 CrossRef CAS PubMed.
- C. Liu, T. R. Cundari and A. K. Wilson, J. Phys. Chem. C, 2012, 116, 5681–5688 CrossRef CAS.
- M. Zhang, Z. Zhang, Z. Zhao, H. Huang, D. H. Anjum, D. Wang, J. He and K.-W. Huang, ACS Catal., 2021, 11, 11103–11108 CrossRef CAS.
- Q. Li, X. Rao, J. Sheng, J. Xu, J. Yi, Y. Liu and J. Zhang, J. CO2 Util., 2018, 27, 48–59 CrossRef CAS.
- M. Morimoto, Y. Takatsuji, R. Yamasaki, H. Hashimoto, I. Nakata, T. Sakakura and T. Haruyama, Electrocatalysis, 2018, 9, 323–332 CrossRef CAS.
- H. Shin, K. U. Hansen and F. Jiao, Nat. Sustain., 2021, 4, 911–919 CrossRef.
- H. Tao, Y. Li, X. Cai, H. Zhou, Y. Li, W. Lin, S. Huang, K. Ding, W. Chen and Y. Zhang, J. Phys. Chem. C, 2019, 123, 24118–24132 CrossRef CAS.
- J. A. Rodriguez, J. Evans, L. Feria, A. B. Vidal, P. Liu, K. Nakamura and F. Illas, J. Catal., 2013, 307, 162–169 CrossRef CAS.
- A. Halder, L. A. Curtiss, A. Fortunelli and S. Vajda, J. Chem. Phys., 2018, 148, 110901 CrossRef PubMed.
- L. E. Gálvez-González, J. O. Juárez-Sánchez, R. Pacheco-Contreras, I. L. Garzón, L. O. Paz-Borbón and A. Posada-Amarillas, Phys. Chem. Chem. Phys., 2018, 20, 17071–17080 RSC.
- A. Alvarez-Garcia, E. Flórez, A. Moreno and C. Jimenez-Orozco, Mol. Catal., 2020, 484, 110733 CrossRef CAS.
- Megha, K. Mondal, T. K. Ghanty and A. Banerjee, J. Phys. Chem. A, 2021, 125, 2558–2572 CrossRef CAS PubMed.
- S. Yin, T. Swift and Q. Ge, Catal. Today, 2011, 165, 10–18 CrossRef CAS.
- C. Liu, H. He, P. Zapol and L. A. Curtiss, Phys. Chem. Chem. Phys., 2014, 16, 26584–26599 RSC.
- F. Huang, Y. Deng, Y. Chen, X. Cai, M. Peng, Z. Jia, J. Xie, D. Xiao, X. Wen, N. Wang, Z. Jiang, H. Liu and D. Ma, Nat. Commun., 2019, 10, 4431 CrossRef PubMed.
- L. Jin, B. Liu, P. Wang, H. Yao, L. A. Achola, P. Kerns, A. Lopes, Y. Yang, J. Ho, A. Moewes, Y. Pei and J. He, Nanoscale, 2018, 10, 14678–14686 RSC.
- J.-C. Liu, H. Xiao, X.-K. Zhao, N.-N. Zhang, Y. Liu, D.-H. Xing, X. Yu, H.-S. Hu and J. Li, CCS Chem., 2022, 5, 152–163 CrossRef.
- D. Yang, S. Zuo, H. Yang, Y. Zhou, Q. Lu and X. Wang, Adv. Mater., 2022, 34, 2107293 CrossRef CAS PubMed.
- N. Sakamoto, Y. F. Nishimura, T. Nonaka, M. Ohashi, N. Ishida, K. Kitazumi, Y. Kato, K. Sekizawa, T. Morikawa and T. Arai, ACS Catal., 2020, 10, 10412–10419 CrossRef CAS.
- D. Du, H. Zhu, Y. Guo, X. Hong, Q. Zhang, B. Suo, W. Zou and Y. Li, J. Phys. Chem. C, 2022, 126, 11611–11618 CrossRef CAS.
- G. Kresse and J. Furthmüller, Comput. Mater. Sci., 1996, 6, 15–50 CrossRef CAS.
- J. P. Perdew, K. Burke and M. Ernzerhof, Phys. Rev. Lett., 1996, 77, 3865–3868 CrossRef CAS PubMed.
- S. Grimme, J. Antony, S. Ehrlich and H. Krieg, J. Chem. Phys., 2010, 132, 154104 CrossRef PubMed.
- G. Kresse and D. Joubert, Phys. Rev. B: Condens. Matter Mater. Phys., 1999, 59, 1758–1775 CrossRef CAS.
- G. Henkelman, B. P. Uberuaga and H. Jónsson, J. Chem. Phys., 2000, 113, 9901–9904 CrossRef CAS.
- A. J. Göttle and M. T. M. Koper, Chem. Sci., 2017, 8, 458–465 RSC.
- J. Rossmeisl, Z. W. Qu, H. Zhu, G. J. Kroes and J. K. Nørskov, J. Electroanal. Chem., 2007, 607, 83–89 CrossRef CAS.
- K. Mathew, R. Sundararaman, K. Letchworth-Weaver, T. A. Arias and R. G. Hennig, J. Chem. Phys., 2014, 140, 84106 CrossRef PubMed.
- Q. Zhang and A. Asthagiri, Catal. Today, 2019, 323, 35–43 CrossRef CAS.
- H. A. Hansen, J. B. Varley, A. A. Peterson and J. K. Nørskov, J. Phys. Chem. Lett., 2013, 4, 388–392 CrossRef CAS PubMed.
- C. J. Pickard and R. J. Needs, J. Phys.: Condens. Matter, 2011, 23, 53201 CrossRef PubMed.
- V. V. Albert, S. A. Ivanov, S. Tretiak and S. V. Kilina, J. Phys. Chem. C, 2011, 115, 15793–15800 CrossRef CAS.
- L. Tan, C. J. Pickard, K. Yu, A. Sapelkin, A. J. Misquitta and M. T. Dove, J. Phys. Chem. C, 2019, 123, 29370–29378 CrossRef CAS.
- J. Gu, J. Wang and J. Leszczynski, ACS Omega, 2018, 3, 1881–1888 CrossRef CAS PubMed.
- G. Paglia, C. E. Buckley, A. L. Rohl, R. D. Hart, K. Winter, A. J. Studer, B. A. Hunter and J. V. Hanna, Chem. Mater., 2004, 16, 220–236 CrossRef CAS.
- M. Yamamoto, Q. Zhao, S. Goto, Y. Gu, T. Toriyama, T. Yamamoto, H. Nishihara, A. Aziz, R. Crespo-Otero, D. D. Tommaso, M. Tamura, K. Tomishige, T. Kyotani and K. Yamazaki, Chem. Sci., 2022, 13, 3140–3146 RSC.
- J. Gross, J. Chem. Phys., 2009, 131, 204705 CrossRef.
- K. Jug, B. Zimmermann, P. Calaminici and A. M. Köster, J. Chem. Phys., 2002, 116, 4497–4507 CrossRef CAS.
- W. Tang, E. Sanville and G. Henkelman, J. Phys.: Condens. Matter, 2009, 21, 084204 CrossRef CAS PubMed.
- G. Henkelman, A. Arnaldsson and H. Jónsson, Comput. Mater. Sci., 2006, 36, 354–360 CrossRef.
- E. Sanville, S. D. Kenny, R. Smith and G. Henkelman, J. Comput. Chem., 2007, 28, 899–908 CrossRef CAS PubMed.
- S.-G. Wang, X.-Y. Liao, D.-B. Cao, C.-F. Huo, Y.-W. Li, J. Wang and H. Jiao, J. Phys. Chem. C, 2007, 111, 16934–16940 CrossRef CAS.
- M. Xing, L. Guo and Z. Hao, Dalton Trans., 2019, 48, 1504–1515 RSC.
- J. Niu, J. Ran, Z. Ou, X. Du, R. Wang, W. Qi and P. Zhang, J. CO2 Util., 2016, 16, 431–441 CrossRef CAS.
- A. G. Nabi, A. ur-Rehman, A. Hussain and D. D. Tommaso, Mol. Catal., 2022, 527, 112406 CrossRef CAS.
- J.-H. Liu, L.-M. Yang and E. Ganz, J. Mater. Chem. A, 2019, 7, 11944–11952 RSC.
Footnote |
| † Electronic supplementary information (ESI) available: (i) Energies, zero-point energies, and entropies of H2(g), CO2(g), and CO(g). (ii) Configurations of the initial state, transition state, and final state involved in CO2 direct dissociation to CO (CO2* → CO* + O*) over Cu4, Cu3Sn, Cu2Sn2, and CuSn3. (iii) Configurations of the intermediates OCHO*, COOH*, and *CO involved in the CO2 reduction reactions over Cu4, Cu3Sn, Cu2Sn2, and CuSn3. (iv) CO2 adsorption, activation and reduction reaction on the isomers of Cu3Sn. See DOI: https://doi.org/10.1039/d3cp00477e |
| This journal is © the Owner Societies 2023 |

