 Open Access Article
Creative Commons Attribution 3.0 Unported Licence
Photoluminescence properties of a novel red fluoride K2LiGaF6:Mn4+ nanophosphor†
Yiwen Zhua,
Jinbo Yua,
Yong Liua,
Mikhail G. Brikbcd,
Lin Huanga,
Tongtong Xuan a and
Jing Wang
 *a
*a
aSchool of Chemistry, Sun Yat-sen University, No. 135, Xingang Xi Road, Guangzhou, 510275, P. R. China. E-mail: ceswj@mail.sysu.edu.cn
bCollege of Mathematics and Physics, Chongqing University of Posts and Telecommunications, 2 Chongwen Road, Nan'an District, Chongqing 400065, P. R. China
cInstitute of Physics, University of Tartu, W. Ostwald Str. 1, Tartu 50411, Estonia
dInstitute of Physics, Jan Dlugosz University, Armii Krajowej 13/15, PL-42-201, Czestochowa, Poland
First published on 14th June 2017
Abstract
Red K2LiGaF6:Mn4+ phosphors have been synthesized by the facile cation-exchange method. To optimize the optical properties, the phosphors were synthesized by using different reaction conditions. The highest luminescence intensity was increased 3.6 times for the Mn concentration of 1%, reaction temperature of 20 °C, and reaction time of 1 h. Replacement of the trivalent Al by Ga resulted in K2LiGaF6:Mn4+ having better photoluminescence properties than K2LiAlF6:Mn4+. Furthermore, the studies of the temperature-dependent emission intensity of the phosphors confirmed their good thermal stability, making them promising red phosphor candidates for white light-emitting diodes.
1. Introduction
White light-emitting diodes (LEDs) have attracted considerable attention as an energy-saving light source for a long time.1–6 Commercial white LEDs fabricated by a blue LED chip with a yellow YAG:Ce3+ phosphor still suffer from some drawbacks such as low color rendering index (Ra < 80) and high correlated color temperature (CCT > 6000 K) because of the lack of a red light component.7–9 So, great efforts have been made to make appropriate red phosphors. Currently most of the available red phosphors still have certain problems.10,11 For example, oxide phosphors12–16 cannot absorb blue light efficiently and sulfide phosphors17–19 are unstable because of their high sensitivity to hydrolysis reactions. As for the nitride phosphors,20–23 they have overlapping re-absorption with the yellow phosphor and the synthesis conditions are rigid. Hence, it is very urgent to find a new red phosphor that can efficiently absorb blue light and has small overlap with the emission of the YAG:Ce3+ phosphor. The Mn4+ doped fluoride red phosphors24–30 have been widely investigated in recent years. Their main advantage is that they can absorb near ultraviolet and blue light to produce narrow-band red emission with broad prospects to be used for white LEDs.Recently, the Mn4+-doped fluoride phosphors A2MF6:Mn4+ (A = Na, K, Rb, Cs, (NH4), M = Si, Ti, Ge, Sn, Zr)31–38 and BMF6:Mn4+ (B = Ba, Zn, M = Si, Ti, Ge)39–45 were reported. Some of them show high quantum efficiency, thermal stability against quenching and so on.46 Recently, we had reported a red phosphor K2LiAlF6:Mn4+,47 which belongs to the elpasolite group of materials with a double perovskite structure. Though it has excellent thermal quenching behavior, the luminescence intensity is still not high enough. Therefore, it is an urgent task to improve its emission intensity to meet the requirements for various applications.
There are many reports48,49 confirming that the Al3+ ions can be substituted by the Mn4+ ions as luminescent center because of similar effective ionic radius (r = 0.53 Å) when coordination number (CN) is six. Since both Al and Ga belong to the same IIIA group in the periodic table, it is believed that Al can be substituted by Ga to adjust the luminescence properties. Since the effective ionic radius of Ga3+ (r = 0.62 Å) is a little bigger than Mn4+ (r = 0.53 Å) at CN = 6, it is strongly expected that the Mn4+ ions substitute for the Ga3+ ions sites easier, compared to Al3+ ions. Moreover, there is no research on this material up to date, and this also prompts us to study it.
In this work, we successfully synthesized a K2LiGaF6:Mn4+ phosphor via a facile cation exchange method. By optimizing the synthesis conditions, we obtain the best sample. The structure, morphology, composition and temperature-dependent photoluminescence (PL) properties were investigated in details. The PL spectra of both K2LiAlF6:Mn4+ and K2LiGaF6:Mn4+ phosphor were compared together to verify the effect on PL properties by changing luminescent center ions. Finally, we fabricated a white LED using a blue LED chip combined with a yellow phosphor and K2LiGaF6:Mn4+ red phosphor.
2. Experimental
2.1 Preparation of K2LiGaF6
0.3447 g LiNO3 and 1.0110 g KNO3 were weighted and dissolved in 5 ml 1 mol L−1 Ga(NO3)3 solution. After stirring for 30 minutes, a transparent solution was obtained. HF (48%) solution was dropped slowly to the solution under stirring. A white precipitate K2LiGaF6 was obtained and washed with deionized water for several times and dried at 70 °C for 12 h.2.2 Preparation of K2LiGaF6:Mn4+
0.1344 g prepared K2LiGaF6 were weighted and added into 2 ml HF (48%) solution contained 0.0012 g K2MnF6. After stirring for 30 minutes, the suspension was centrifuged and washed with acetone for several times. The K2LiGaF6:Mn4+ phosphor was prepared after dried at 70 °C for 12 h.2.3 Fabrication of WLEDs
WLEDs were fabricated by combining a blue LED chip (450–460 nm, 3.0–3.4 V, 350 mA), yellow phosphor YAG:Ce3+ and K2LiGaF6:Mn4+ red phosphor. The phosphors were mixed with silicone thoroughly and coated on the surface of the chip to produce WLEDs.2.4 Characterization
XRD patterns were recorded using powder X-ray diffraction (XRD, Rigaku D/MAX 2200 VPC) with Cu Kα1 radiation (λ = 1.5405 Å) at a scanning rate of 10° min−1 over a 2θ range from 10° to 80°. The morphology of the as-prepared products was measured by SEM (FEI Quanta 400). Transmission electron microscopy (TEM), selected area electron diffraction (SAED) and elemental composition were obtained from an FEI Tecnai G2 Spirit. Photoluminescence excitation (PLE) and photoluminescence (PL) spectra were determined on an FSP920-combined time resolved and steady-state fluorescence spectrometer (Edinburgh Instruments) with a 450 W xenon lamp as the excitation source. Electron paramagnetic resonance (EPR) analyses were measured on spectrometer (BRÜCKNER A300-10-12) with frequency of 9.8 GHz and attenuator of 30 dB. The photoelectric properties of the white LED devices were measured by Labsphere LPS-100-0260 and Labsphere CDS2100.3. Results and discussion
3.1 Phase, structure and spectroscopic studies
Fig. 1(a) shows the XRD patterns of K2LiGaF6 and K2LiGaF6:Mn4+. The diffraction peaks of K2LiGaF6:Mn4+ can be indexed to the standard pattern of cubic phase K2LiGaF6 (PDF no. 22-1225) with a unit cell a = b = c = 7.97 Å, α = β = γ = 90° and the volume V = 506.3 Å3. The main peaks located at 19.3°, 31.8° and 45.5°, corresponding to the (111), (220) and (400) reflections, respectively. The reaction can be expressed as follows:| LiNO3 (aq.) + 2KNO3 (aq.) + Ga(NO3)3 (aq.) + 6HF (aq.) == K2LiGaF6 (s) + 6HNO3 (aq.) |
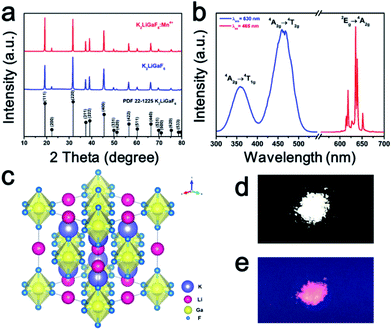 | ||
| Fig. 1 (a) XRD patterns of K2LiGaF6 and K2LiGaF6:Mn4+, (b) PLE and PL spectra of K2LiGaF6:Mn4+, (c) structure diagram, (d) phosphor under natural light and (e) phosphor under UV-light. | ||
When the nitrates are dissolved in the solution, the F− anions bond the cations to form the K2LiGaF6 because of their strong ability of coordination. After the pure matrix phase is obtained, Mn4+ can be doped into it in the HF solution to form K2LiGaF6:Mn4+. Fig. 1(b) exhibits the photoluminescence excitations (PLE) and PL spectra of K2NaGaF6:1% Mn4+. The PLE spectra contain two bands from 300 nm to 500 nm, centered at ∼360 nm and ∼465 nm when monitored at 630 nm. These two excitation bands are due to the 4A2g → 4T1g and 4A2g → 4T2g spin-allowed transitions of Mn4+. The phosphor emits a series of narrow band emission lines located at 610 nm, 614 nm, 623 nm, 632 nm, 636 nm and 649 nm, which are attributed to the spin-forbidden 2Eg → 4A2g transitions of Mn4+ and its vibronic sidebands, under 465 nm excitation. According to the group theory, the octahedral symmetry Oh has six fundamental internal vibronic modes, namely, v1 (A1g), v2 (Eg), v3 (T1u), v4 (T1u), v5 (T2g) and v6 (T2u).46 The three peaks at longer than 623 nm wavelengths are ascribed to the Stokes v6, v4 and v3 peaks, and the two other peaks at shorter than 623 nm are the anti-Stokes v6 and v4 peaks. The peak at 623 nm is the zero phonon line (ZPL), which is the electric dipole forbidden in the octahedral [MnF6]2−.50 It has been reported that the ZPL emission intensity depends on the local symmetry of the Mn4+ ion. The higher the distortion of the octahedron, the stronger the ZPL emission intensity.51 The structure scheme and coordination environment of K2LiGaF6 are shown in Fig. 1(c). The Ga3+ ions and Li+ ions are surrounded by six F− ions to form two types of octahedrons. The K+ ions are at the center of a polyhedron formed by 12 neighbouring F−. The [GaF6]3− and [LiF6]3− octahedrons share corners in a network. The Ga–F bond length is 1.8419 Å, and the Li–F bond length is 2.1431 Å, with bond angles ∠FGaF = ∠FLiF = 90°. Since the effective ionic radius of Mn4+ (r = 0.53 Å) at CN = 6 is close to Ga3+ (r = 0.62 Å), the Mn4+ ions substitute for the Ga3+ ions sites. Because of the ionic radii and valence state mismatch, the octahedrons distort to some extent. The body color of phosphor is white under natural light and it emits red light under 365 nm UV-light, as shown in Fig. 1(d) and (e), respectively.
3.2 Morphology and composition analysis
Fig. 2(a) and (b) exhibit the SEM and TEM images of K2LiGaF6:Mn4+. The SEM image shows that the as-synthesized sample consists of irregular aggregated particles with the size of about 100–200 nm. The particle mean diameter is 67 nm. This is different from other reported microscale Mn4+-doped fluoride phosphors.52–54 As shown in the inset of Fig. 2(b), the selected area electron diffraction (SAED) suggests that the samples are single crystals, of which the distinct diffraction dots can be indexed to the cubic phase K2LiGaF6. Fig. 2(c) shows the elemental composition analysis of K2LiGaF6:Mn4+ sample, which were quantitatively carried out by using energy dispersive spectrometer (EDS) to further prove the purity of the as-synthesized sample. Li element is too light to be detected. It is clearly seen that K, Ga, F and Mn elements are included and for the reason of low Mn concentration, the Mn peaks are very weak. The atom percentages of K, Ga and F are about 21.5%, 11.6% and 52.8%, respectively, which is almost close to 2![[thin space (1/6-em)]](https://www.rsc.org/images/entities/char_2009.gif) :
:![[thin space (1/6-em)]](https://www.rsc.org/images/entities/char_2009.gif) 1
1![[thin space (1/6-em)]](https://www.rsc.org/images/entities/char_2009.gif) :
:![[thin space (1/6-em)]](https://www.rsc.org/images/entities/char_2009.gif) 6 ratio, i.e., the stoichiometric atom ratio of K2LiGaF6. These results further indicate that the as-obtained phosphor is in a pure phase.
6 ratio, i.e., the stoichiometric atom ratio of K2LiGaF6. These results further indicate that the as-obtained phosphor is in a pure phase.
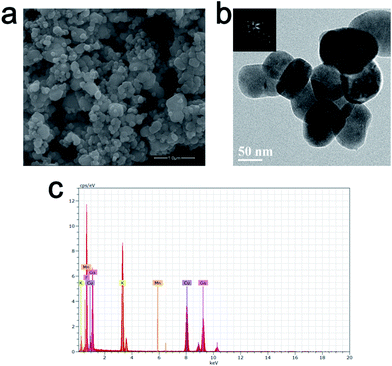 | ||
| Fig. 2 (a) SEM and (b) TEM (the inset is SAED patterns of one particle) images and (c) quantitative elemental composition data of K2LiGaF6:Mn4+. | ||
3.3 Room temperature PL properties
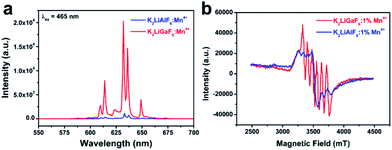
To optimize the luminescence performance of K2LiGaF6:Mn4+, the effects of the nominal molar concentration of doped Mn4+, reaction time and reaction temperature were systematically investigated, as shown in Fig. S1–S3 in ESI.† By adjusting the reaction conditions, the best sample K2LiGaF6:1% Mn4+ was obtained under 20 °C for 1 h. In this way, the PL intensity can be increased 3.5 times.The optimized phosphor shows much higher emission intensity than K2LiAlF6:Mn4+ (Fig. 3). We attribute this result to the considerable ionic radii difference between Ga3+ and Al3+. Since Ga3+ (r = 0.62 Å) is a little bigger than Al3+ (r = 0.535 Å), there is more space to be occupied by Mn4+ (r = 0.53 Å) at the Ga position. Such a large cavity – especially taken together with the difference of electric charges of Mn4+ and Ga3+ – would favour the off-center displacement of the Mn4+ ions. Such a displacement will lower the symmetry of the MnF6 octahedra by eliminating the inversion center. As a result, the PL intensity of K2LiGaF6:Mn4+ is much higher than that one of K2LiAlF6:Mn4+. To further prove the concentration of Mn4+ is higher in K2LiGaF6, we measure the EPR spectra of two phosphors with the same doping concentration in Fig. 3(b). The signal of Mn4+ ions in K2LiGaF6 host is six featured peaks,55 while it is much lower in K2LiAlF6. This indicates the concentration of Mn4+ ions is truly higher in K2LiGaF6 so that leads to higher emission intensity.
3.4 Temperature-dependent PL properties
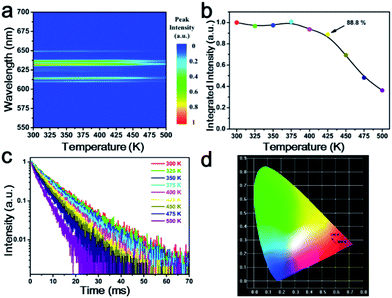
The temperature-dependent emission spectra of K2LiGaF6:Mn4+ in the 300–500 K temperature range under 465 nm excitation are presented in Fig. 4(a). Apparently, there is no shift or broadening of the emission peaks but the intensity decreases gradually with the increasing temperature. Fig. 4(b) reveals this trend clearly. It can be seen that the emission intensity is almost the same in the temperature range from 300 K to 375 K and then drops sharply with the temperature above 400 K. At 425 K (150 °C), it remains 88.8% of the initial intensity at 300 K. Similar thermal quenching behavior of Mn4+ ion in fluoride phosphors had been reported for several times.49,56,57 We determine the activation energy (Ea) of K2LiGaF6:Mn4+ for thermal quenching using eqn (1).58
 | (1) |
 | (2) |
3.5 LED application
Fig. 5(a) shows the current-dependent LED performance fabricated with a blue LED chip combined with the YAG:Ce3+ and K2LiGaF6:Mn4+ phosphors. The sharp peak located at about 450 nm belongs to blue LED chip and the broad band centered at 560 nm is attributed to YAG:Ce3+. Narrow peaks around 630 nm are the emission lines of K2LiGaF6:Mn4+. The intensity grows with the increasing drive current. The band shapes and positions of emission peaks exhibit no remarkable change, revealing good stabilities both in color and CCT of this LED. Fig. 5(b) shows the CIE coordinate diagram of the white LED with the color point lying on the black body locus under various drive currents. The chromaticity coordinates of them are marked in CIE 1931 color spaces and they are almost laid on the black body locus. All important photoelectric parameters for clarity are presented in Table S2.† Slight variations of the color rendering index (Ra) and chromaticity coordinates are observed during the drive current range. With increasing drive current from 20 to 350 mA, the luminous efficacy (LE) gradually decreases from 53.3 to 40.7 lm W−1, due to the monotonously decreased external quantum efficiency of the blue InGaN chip and the low quantum efficiency of K2LiGaF6:Mn4+. Commercial white LEDs only using a single YAG:Ce3+ phosphor has a low CRI,61 typically, Ra < 70. By adding K2LiGaF6:Mn4+ red phosphors, CRI is improved to 80.8. Specifically, all the R9 values are positive, which suggests good rendition of the red component.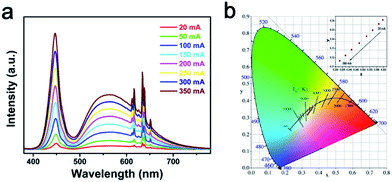 | ||
| Fig. 5 (a) Electroluminescence spectra and (b) CIE chromaticity diagram of fabricated white LED under various drive currents. | ||
4. Conclusions
In summary, a novel red emitting K2LiGaF6:Mn4+ phosphor was synthesized by a facile cation exchange method. It exhibits a broadband excitation extending from 300 to 500 nm and an ideal narrow band emission centered at 632 nm, which matches well with the UV and blue LED chips. The PL properties of the phosphors were optimized by varying the Mn4+ concentration, reaction times, and reaction temperature. For changing the luminescent center ions, the emission intensity of K2LiGaF6:Mn4+ is much higher than K2LiAlF6:Mn4+. It is a good way to adjust PL properties of luminescent materials. Moreover, K2LiGaF6:Mn4+ exhibits an excellent thermal quenching behavior and color stability over the temperature range of 300–500 K. The Ra, CCT and luminous efficiency of fabricated WLED are 79.5, 4363 K and 53.3 lm W−1, respectively. All these results imply that the K2LiGaF6:Mn4+ red emitting phosphor has potential applications in white LEDs.Acknowledgements
This study was financially supported by the “973” programs (2014CB643801), the NSFC (51572302 and 21271191), the Joint Funds of the National Natural Science Foundation of China and Guangdong Province (U1301242), Teamwork Projects of Guangdong Natural Science Foundation (S2013030012842), Guangdong Science & Technology Project (2015B090926011) and the Natural Science Foundation of Guangdong Province (2014A030313114). M. G. Brik thanks the supports from National Recruitment Program of High-end Foreign Experts (Grant No. GDW20145200225), Programme for the Foreign Experts offered by Chongqing University of Posts and Telecommunications, European Regional Development Fund (TK141), and Ministry of Education and Research of Estonia, Project PUT430.References
- E. F. Schubert, T. Gessmann and J. K. Kim, Light emitting diodes, Wiley Online Library, 2005 Search PubMed.
- S. Pimputkar, J. S. Speck, S. P. DenBaars and S. Nakamura, Nat. Photonics, 2009, 3, 180–182 CrossRef CAS.
- H. A. Höppe, Angew. Chem., Int. Ed., 2009, 48, 3572–3582 CrossRef PubMed.
- C. Feldmann, T. Jüstel, C. R. Ronda and P. J. Schmidt, Adv. Funct. Mater., 2003, 13, 511–516 CrossRef CAS.
- J. He, Y. He, Y. Chen, B. Lei, H. Zhang, J. Zhuang, M. Zheng and Y. Liu, RSC Adv., 2016, 6, 104724–104730 RSC.
- C. Zhao, Z. Xia and M. Li, RSC Adv., 2014, 4, 33114–33119 RSC.
- S. Ye, F. Xiao, Y. X. Pan, Y. Y. Ma and Q. Y. Zhang, Mater. Sci. Eng., R, 2010, 71, 1–34 CrossRef.
- E. F. Schubert and J. K. Kim, Science, 2005, 308, 1274–1278 CrossRef CAS PubMed.
- C. C. Lin and R.-S. Liu, J. Phys. Chem. Lett., 2011, 2, 1268–1277 CrossRef CAS PubMed.
- C. C. Lin, A. Meijerink and R. S. Liu, J. Phys. Chem. Lett., 2016, 7, 495–503 CrossRef CAS PubMed.
- T. Wang and H. Li, Chem.–Eur. J., 2016, 22, 12400–12405 CrossRef CAS PubMed.
- J. Liu, B. Xu, C. Song, H. Luo, X. Zou, L. Han and X. Yu, CrystEngComm, 2012, 14, 2936–2943 RSC.
- Y. Chen, J. Wang, C. Liu, X. Kuang and Q. Su, Appl. Phys. Lett., 2011, 98, 081917 CrossRef.
- O. Milosevic, L. Mancic, M. E. Rabanal, J. M. Torralba, B. Yang and P. Townsend, J. Electrochem. Soc., 2005, 152, G707–G713 CrossRef CAS.
- J.-G. Li, X. Li, X. Sun and I. Takamasa, J. Phys. Chem. C, 2008, 112, 11707–11716 CAS.
- M. Peng, X. Yin, P. A. Tanner, M. G. Brik and P. Li, Chem. Mater., 2015, 27, 2938–2945 CrossRef CAS.
- Y. Li, D. Dai and S. Cai, J. Chin. Rare Earth Soc., 1996, 14, 16–19 CAS.
- G. A. Kumar, D. X. Liu, Y. Tian, M. G. Brik and D. K. Sardar, Opt. Mater., 2015, 50, 199–203 CrossRef CAS.
- C. Guo, D. Huang and Q. Su, Mater. Sci. Eng., B, 2006, 130, 189–193 CrossRef CAS.
- R.-J. Xie, N. Hirosaki, K. Sakuma, Y. Yamamoto and M. Mitomo, Appl. Phys. Lett., 2004, 84, 5404–5406 CrossRef CAS.
- X. Piao, K.-i. Machida, T. Horikawa, H. Hanzawa, Y. Shimomura and N. Kijima, Chem. Mater., 2007, 19, 4592–4599 CrossRef CAS.
- T.-C. Liu, B.-M. Cheng, S.-F. Hu and R.-S. Liu, Chem. Mater., 2011, 23, 3698–3705 CrossRef CAS.
- Y. Q. Li, N. Hirosaki, R. J. Xie, T. Takeda and M. Mitomo, Chem. Mater., 2008, 20, 6704–6714 CrossRef CAS.
- M.-H. Du, J. Mater. Chem. C, 2014, 2, 2475–2481 RSC.
- M. Brik, S. Camardello and A. Srivastava, ECS J. Solid State Sci. Technol., 2015, 4, R39–R43 CrossRef CAS.
- M. H. Du, J. Lumin., 2015, 157, 69–73 CrossRef CAS.
- H.-D. Nguyen and R.-S. Liu, J. Mater. Chem. C, 2016, 4, 10759–10775 RSC.
- M. G. Brik and A. M. Srivastava, J. Lumin., 2013, 133, 69–72 CrossRef CAS.
- Z. Zhou, N. Zhou, M. Xia, M. Yokoyama and H. T. Hintzen, J. Mater. Chem. C, 2016, 4, 9143–9161 RSC.
- D. Chen, Y. Zhou and J. Zhong, RSC Adv., 2016, 6, 86285–86296 RSC.
- S. Adachi and T. Takahashi, J. Appl. Phys., 2008, 104, 023512 CrossRef.
- T. Takahashi and S. Adachi, J. Electrochem. Soc., 2008, 155, E183–E188 CrossRef CAS.
- Y. Arai and S. Adachi, J. Lumin., 2011, 131, 2652–2660 CrossRef CAS.
- Z. Wang, Y. Liu, Y. Zhou, Q. Zhou, H. Tan, Q. Zhang and J. Peng, RSC Adv., 2015, 5, 58136–58140 RSC.
- Z. Wang, Y. Zhou, Y. Liu, Q. Zhou, L. Luo, H. Tan, Q. Zhang, G. Chen and J. Peng, RSC Adv., 2015, 5, 82409–82414 RSC.
- M. Takarkhede, R. R. Patil and S. V. Moharil, Study of photoluminescence in ABSiF6:Mn4+ (A=K, B=Na, Cs) phosphor, AIP Publishing, 2016, vol. 1728, p. 020441 Search PubMed.
- L. Xi, Y. Pan, S. Huang and G. Liu, RSC Adv., 2016, 6, 76251–76258 RSC.
- W.-L. Wu, M.-H. Fang, W. Zhou, T. Lesniewski, S. Mahlik, M. Grinberg, M. G. Brik, H.-S. Sheu, B.-M. Cheng, J. Wang and R.-S. Liu, Chem. Mater., 2017, 29, 935–939 CrossRef CAS.
- X. Jiang, Z. Chen, S. Huang, J. Wang and Y. Pan, Dalton Trans., 2014, 43, 9414–9418 RSC.
- Q. Zhou, Y. Zhou, Y. Liu, L. Luo, Z. Wang, J. Peng, J. Yan and M. Wu, J. Mater. Chem. C, 2015, 3, 3055–3059 RSC.
- X. Gao, Y. Song, G. Liu, X. Dong, J. Wang and W. Yu, Dalton Trans., 2016, 45, 17886–17895 RSC.
- R. Hoshino, T. Nakamura and S. Adachi, ECS J. Solid State Sci. Technol., 2016, 5, R37–R43 CrossRef CAS.
- Y. Pan, Z. Chen, X. Jiang, S. Huang, M. Wu and A. Srivastava, J. Am. Ceram. Soc., 2016, 99, 3008–3014 CrossRef CAS.
- Y. Zhou, Q. Zhou, Y. Liu, Z. Wang, H. Yang and Q. Wang, Mater. Res. Bull., 2016, 73, 14–20 CrossRef CAS.
- G. Mo, W. Wang, K. Wang, G. Wen, M. Zhu and J. Wang, J. Mater. Sci., 2017, 28, 8155–8159 CAS.
- H. Zhu, C. C. Lin, W. Luo, S. Shu, Z. Liu, Y. Liu, J. Kong, E. Ma, Y. Cao, R. S. Liu and X. Chen, Nat. Commun., 2014, 5, 4312 CAS.
- Y. Zhu, L. Huang, R. Zou, J. Zhang, J. Yu, M. Wu, J. Wang and Q. Su, J. Mater. Chem. C, 2016, 4, 5690–5695 RSC.
- L. Chen, X. Deng, E. Zhao, X. Chen, S. Xue, W. Zhang, S. Chen, Z. Zhao, W. Zhang and T.-S. Chan, J. Alloys Compd., 2014, 613, 312–316 CrossRef CAS.
- E. Song, J. Wang, J. Shi, T. Deng, S. Ye, M. Peng, J. Wang, L. Wondraczek and Q. Zhang, ACS Appl. Mater. Interfaces, 2017, 9, 8805–8812 CAS.
- Y. Jin, M. H. Fang, M. Grinberg, S. Mahlik, T. Lesniewski, M. G. Brik, G. Y. Luo, J. G. Lin and R. S. Liu, ACS Appl. Mater. Interfaces, 2016, 8, 11194–11203 CAS.
- L. L. Wei, C. C. Lin, Y. Y. Wang, M. H. Fang, H. Jiao and R. S. Liu, ACS Appl. Mater. Interfaces, 2015, 7, 10656–10659 CAS.
- Y. K. Xu and S. Adachi, J. Appl. Phys., 2009, 105, 013525 CrossRef.
- Y. K. Xu and S. Adachi, J. Electrochem. Soc., 2011, 159, E11–E17 CrossRef.
- C. Liao, R. Cao, Z. Ma, Y. Li, G. Dong, K. N. Sharafudeen, J. Qiu and J. Heo, J. Am. Ceram. Soc., 2013, 96, 3552–3556 CrossRef CAS.
- Y. Li, Y.-Y. Li, K. Sharafudeen, G.-P. Dong, S.-F. Zhou, Z.-J. Ma, M.-Y. Peng and J.-R. Qiu, J. Mater. Chem. C, 2014, 2, 2019–2027 RSC.
- L. Huang, Y. Zhu, X. Zhang, R. Zou, F. Pan, J. Wang and M. Wu, Chem. Mater., 2016, 28, 1495–1502 CrossRef CAS.
- T. T. Deng, E. H. Song, J. Sun, L. Y. Wang, Y. Deng, S. Ye, J. Wang and Q. Y. Zhang, J. Mater. Chem. C, 2017, 5, 2910–2918 RSC.
- X. Zhang, J. Wang, L. Huang, F. Pan, Y. Chen, B. Lei, M. Peng and M. Wu, ACS Appl. Mater. Interfaces, 2015, 7, 10044–10054 CAS.
- R. Shi, J. Xu, G. Liu, X. Zhang, W. Zhou, F. Pan, Y. Huang, Y. Tao and H. Liang, J. Phys. Chem. C, 2016, 120, 4529–4537 CAS.
- X. Zhang, Y. T. Tsai, S. M. Wu, Y. C. Lin, J. F. Lee, H. S. Sheu, B. M. Cheng and R. S. Liu, ACS Appl. Mater. Interfaces, 2016, 8, 19612–19617 CAS.
- A. Birkel, K. A. Denault, N. C. George, C. E. Doll, B. Héry, A. A. Mikhailovsky, C. S. Birkel, B.-C. Hong and R. Seshadri, Chem. Mater., 2012, 24, 1198–1204 CrossRef CAS.
Footnote |
| † Electronic supplementary information (ESI) available. See DOI: 10.1039/c7ra05635d |
| This journal is © The Royal Society of Chemistry 2017 |

