
 Open Access Article
 This Open Access Article is licensed under a
 Creative Commons Attribution 3.0 Unported Licence
Bright, near infrared emitting PLGA–PEG dye-doped CN-PPV nanoparticles for imaging applications
Evren Kemala,
Thais Fedatto Abelha b,
Laura Urbanob,
Ruby Petersa,
Dylan M. Owena,
P. Howesa,
Mark Green*a and
Lea Ann Dailey*b
b,
Laura Urbanob,
Ruby Petersa,
Dylan M. Owena,
P. Howesa,
Mark Green*a and
Lea Ann Dailey*b
aKing's College London, Department of Physics, Strand Campus, WC2R 2LS, London, UK. E-mail: mark.a.green@kcl.ac.uk
bKing's College London, Institute of Pharmaceutical Science, Waterloo Campus, SE1 9NH, London, UK
First published on 7th March 2017
Abstract
Conjugated polymers are of interest as optical imaging probes for clinical diagnostic applications. However, clinical translation requires not only an excellent optical performance, but also an established safety profile and scalable manufacturability. Taking these factors into account, a self-assembling nanoparticle system was designed utilising the amphiphilic diblock copolymer, PLGA–PEG, to encapsulate the red-emitting conjugated polymer, CN-PPV. Encapsulation of decreasing amounts of CN-PPV (50% to 5% w/w) resulted in a decrease in nanoparticle size and an increase in optical performance (quantum yield% ∼40%). All systems were colloidally and optically stable over 60 days at 37 °C. Optimized systems were then used to encapsulate small amounts (0.5–0.8% w/w) of small molecule near-infrared dyes, NIR680 and NIR720, generating systems with shifted emission peaks >700 nm. Optimised PLGA–PEG micelles containing 5% CN-PPV and 0.5% NIR720 showed enhanced characteristics, such as a high product yield (>90%), a narrow emission peak at 720 nm, a high quantum yield of 45%, a small hydrodynamic diameter (∼104 nm), and an enhanced cytocompatibility profile compared to other systems tested in this study, i.e. no reduction in cell viability and negligible impairment of mitochondrial acitivity at higher concentrations.
Introduction
In recent years, conjugated polymer nanoparticles (CPNs), also known as semiconducting polymer nanoparticles and polymer dots (P-dots), have emerged as a novel class of extraordinarily bright photoluminescent probes with many applications in bioimaging and diagnostics.1–10 Near-infrared (NIR) fluorescence imaging in the 700–800 nm wavelength range is very attractive for real time in vitro and in vivo applications as tissue penetration is at its deepest with minimal auto-fluorescence.2,9 Small molecule NIR dyes, such as the FDA-approved indocyanine green11 are currently used in fluorescence imaging and assays; however, the majority of these agents suffer from limitations such as low brightness, insufficient photostability, and a small Stokes shift.1–5Inorganic semiconductor nanocrystal quantum dots (Qdots) have been developed as NIR probes as they offer a significantly higher photostability and brightness compared to small molecule NIR dyes. However, toxicity and the disruption of shielding surface modification are critical concerns for their biological applications.2,3,12 NIR-emitting CPNs, in contrast, offer a high brightness, good photostability, and minimal toxicity to biological cells and tissues.1–5 To achieve emission in the NIR region, CPNs have been manufactured according to multiple strategies, which all aim to produce nanoparticles with enhanced optical performance.1–11 For example, low molecular weight, hydrophobic NIR dyes have been encapsulated within a CPN core resulting in quenching of visible emission of the conjugated polymer with distinct NIR emission2 or multiple cascading light emitting polymers have been produced, which transfer the energy more efficiently to the dopant dye.4 Disadvantages of such systems, however, include low CPN yields, dye leakage from the construct,7 poor stability in various environments and broader emission spectra compared with Qdots or NIR dyes.4,5 Development of narrow, bright NIR CPNs remains an important target for a variety of biological applications.
As biomaterials, nanodiagnostics require functionality in various physiological environments and tissues.13–18 To promote translation of NIR-emitting CPNs towards clinical applications, this work focussed on self-assembling systems utilising the amphiphilic, biodegradable diblock copolymer, poly(lactic-co-glycolic acid)polyethylene glycol (PLGA–PEG),19 as a matrix for encapsulation of the red-emitting conjugated polymer, poly(2,5-di(hexyloxy) cyanoterephthalylidene) (CN-PPV). The advantages of embedding CN-PPV within self-assembling PLGA–PEG polymer micelles include an increase in CPN yield during manufacture and provision of a stable PEGylated surface, which will increase CPN circulation times, reduce undesired protein corona formation or liver accumulation due to in vivo clearance by the mononuclear phagocytic system.19–22 Furthermore, the biodegradable nature of the system20,21 may present a potential mechanism for in vivo clearance and elimination of systemically administered nanodiagnostics.
In addition to the basic system comprised of PLGA–PEG![[thin space (1/6-em)]](https://www.rsc.org/images/entities/char_2009.gif) :CN-PPV (Fig. 1), two low molecular weight NIR dyes, NIR680 and NIR720, were incorporated into the nanoparticle core to exploit Förster resonance energy transfer (FRET) and shift emission profiles towards longer wavelengths. The resulting systems were characterised in-depth with regard to physicochemical and optical properties prior to use in cell-based assays to assess their performance as cellular imaging agents and biocompatibility.
:CN-PPV (Fig. 1), two low molecular weight NIR dyes, NIR680 and NIR720, were incorporated into the nanoparticle core to exploit Förster resonance energy transfer (FRET) and shift emission profiles towards longer wavelengths. The resulting systems were characterised in-depth with regard to physicochemical and optical properties prior to use in cell-based assays to assess their performance as cellular imaging agents and biocompatibility.
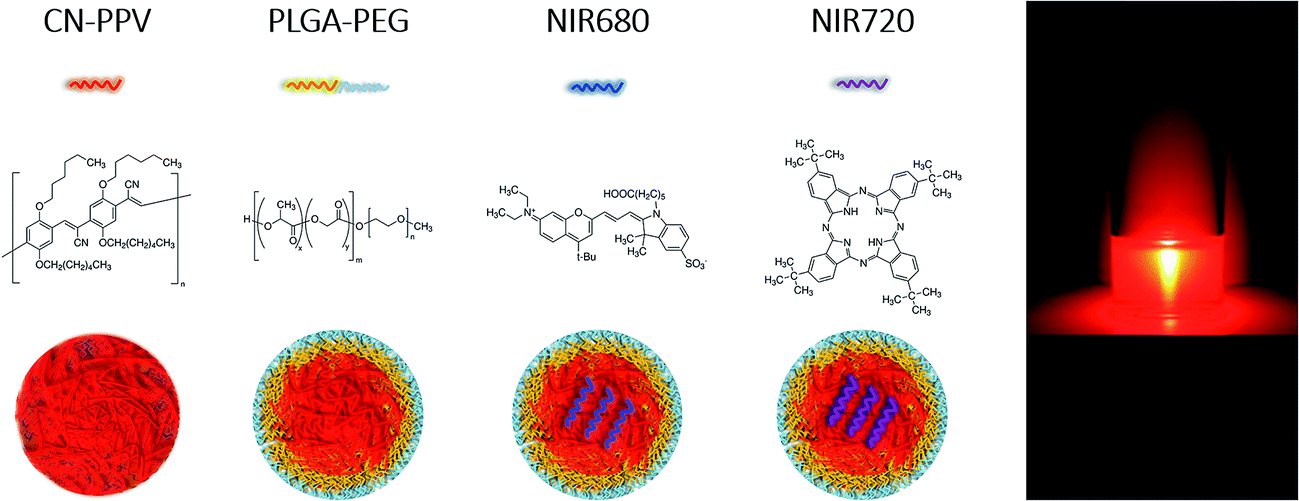 | ||
| Fig. 1 The proposed structure of the self-assembling CPN comprised of either 100% CN-PPV, 95% PLGA–PEG with 5% CN-PPV or 95% PLGA–PEG with 5% CN-PPV and small amounts of encapsulated NIR680 and NIR720 (left to right respectively). The image on far right shows the red emission of PLGA–PEG:CN-PPV nanoparticles under excitation from a 405 nm laser. | ||
Experimental
Materials
Poly(2,5-di(hexyloxy)cyanoterephthalylidene) (CN-PPV), NIR680, NIR720, poly(ethylene glycol) methylether-block-poly(lactide-co-glycolide) copolymer with 50:50 ratio of lactide/glycolide (PEG5 kDa–PLGA55 kDa), ultrapure water and tetrahydrofuran (THF ReagentPlus®, ≥99.9%) were purchased from Sigma-Aldrich and used as received.
CPN manufacture
In a typical example synthesis, 5 mg CN-PPV was dissolved in 10 mL THF (0.5 mg mL−1) followed by sonication for 10 minutes. 1 mL of this stock solution was added to 10 mg of PLGA–PEG (60 K). In a separate flask, 1 mg of NIR720 was dissolved in 10 mL THF, 25 microlitres of which were then added to the CN-PPV/polymer stock solution. The final stock solution was then added to 5 mL ultrapure water, which was sonicated for 15 minutes and left stirring for 24 hours to facilitate complete evaporation of THF. Loss of water was compensated by readjustment to 5 mL. The resultant CPN suspensions had a final concentration of ca. 100 μg mL−1 CN-PPV with different total solids concentrations (Table 1).| PLGA–PEG:CN-PPV ratio (system abbreviation) |
PLGA–PEG (% m m−1) | CN-PPV (% m m−1) | Total solids (μg mL−1) |
|---|---|---|---|
| 0:1 |
0 | 100 | 100 |
| 1:63 |
1.6 | 98.4 | 101.6 |
| 1:6 |
16.6 | 83.4 | 116.6 |
| 1:3 |
33.3 | 66.7 | 133.3 |
| 1:1 |
50 | 50 | 200 |
| 20:1 |
95 | 5 | 2100 |
| 1:0 |
100 | 0 | 2100 |
Particle size and zeta potential
Particle hydrodynamic diameter was assessed by nanoparticle tracking analysis (NTA; NanoSight® LM10, Malvern Instruments, UK) fitted with a blue laser (60 mW at 405 nm). CPN suspensions (100 μL) were diluted in 5 mL deionised water and 0.3 mL of the dilute sample was passed through the flow chamber of the NanoSight® unit. The C11440-5B camera was set to ×20 capture magnification with a 250 gain (a.u.). NTA 2.3 analysis software was used to generate three 30 second scripts, which provided the average and modal hydrodynamic diameter, standard deviation and total concentration of the suspension. For selected systems, CPNs were stored at 37 °C in a dark incubator and the particle size measured at regular intervals over a time period up to 60 days. The zeta potential was measured using a Nanosizer (Nanosizer, Malvern Instruments, UK) in 10 mM NaCl at 25 °C.A range of CPNs containing NIR680 or NIR720 were prepared using either a 1:1 or 20:1 ratio of PLGA–PEG:CN-PPV. NIR720 was dissolved in THF (0.1 mg mL−1) and the appropriate volumes were added to the PLGA–PEG:CN-PPV solution in THF so that final dye concentrations ranging from 0.25, 0.5 or 0.75% (mass dye per mass CN-PPV) were achieved. The CPN manufacture proceeded as described above. NIR680, which is insoluble in THF, was dissolved in ethanol (0.1 mg mL−1) and different volumes were added to the 5 mL aqueous phase to achieve concentrations ranging between 0.4, 0.8 or 1.2% (mass dye per mass CN-PPV). Subsequently, the polymer solution in THF was injected into the aqueous phase and CPN preparation proceeded as described above.
Optical characterisation
Photoluminescence (PL) emission scans were measured on a luminescence spectrometer (LS50B, Perkin-Elmer Inc., USA using the following settings: 470 nm excitation wavelength, emission slit width of 5 nm, excitation slit width of 4 nm and emission scan from 500 to 800 nm. For selected systems, CPNs were stored 37 °C in a dark incubator and the PL emission scan measured at regular intervals over a time period up to 60 days. Absorption spectroscopy was performed on a Perkin-Elmer Lambda 800 UV/vis spectrophotometer. An absolute quantum yield measurement system (C9920-02G; Hamamatsu) was used to record the QY of samples. An integrating sphere capable of nitrogen gas flow and a CCD spectrometer for detecting the whole spectral range simultaneously. The following setting where used with an excitation light source at 480 nm, with a bandwidth of 5–7 nm. The spectra were averaged from 20 repeat recordings.Transmission electron microscopy
Transmission electron microscopy (TEM) was performed on an FEI Tecnai 20 at 200 kV for high resolution imaging. Samples were drop cast and dried on carbon film copper grids. Particle size analysis was conducted using Image J software.CPN interactions with HeLa cells
HeLa cells (American Type Culture Collection-ATCC CCL-2, cat. no. CCL-2) were cultured as adherent monolayers in Dulbecco's Modified Eagle Medium (DMEM, cat. no. D5796, Sigma) supplemented with 10% heat inactivated foetal calf serum (FCS, cat. no. F2442, Sigma), on a sterile 8 square well microplate. Cells were cultured at 37 °C, 5% CO2 in a humidified incubator at 0.3 × 10⁶ cells per well. Four CPN suspensions were studied: (1) CN-PPV alone (0:1) as a control, (2) PLGA–PEG:CN-PPV (1:1), (3) PLGA–PEG:CN-PPV with NIR680 (1:1 (680)) and (4) PLGA–PEG:CN-PPV with NIR720 (1:1 (720)). CPN suspensions (150 μL; equivalent to 30 μg total solids and 15 μg CN-PPV per well) were added to 150 μL cell culture media and incubated for 1 h with cells. Following incubation, cells were washed six times with warm phosphate-buffered saline (pH 7.0) and imaged live every 5 seconds for 5 min with a Nikon A1R + confocal using a ×20 objective lens of numerical aperture 0.75 combined with a Nikon Ti-E inverted microscope system. A 488 nm argon ion laser was used for excitation and emission was collected in two channels: 570–620 nm (visible red) and 663–738 nm (NIR). Corrected Total Cell Fluorescence was calculated using Image J software.
CPN biocompatibility with THP-1 cells
A second cell line, the human monocyte-derived macrophage cell line, THP-1 (American Type Culture Collection-ATCC TIB202 monocytic leukaemia cells), were used to assess dose-dependent biocompatibility profiles of selected CPN systems. THP-1 cells were cultured and differentiated with 10% foetal bovine serum (FBS, obtained from Sigma, product number F7524, batch number BCBR1178V), in 96 well plates. Five suspensions were studied: (1) CN-PPV alone (0:1) as a control; (2) PLGA–PEG nanoparticles without CN-PPV (1:0) as a control; (3) PLGA–PEG:CN-PPV (20:1); (4) PLGA–PEG:CN-PPV with NIR680 (20:1 (680)) and (5) PLGA–PEG:CN-PPV with NIR720 (20:1 (720)). To assess a representative CPN dose range (0.03–300 μg mL−1 total solids) CPN suspensions had to be concentrated to 1.5 mg mL−1 using centrifugal filtration (MWCO: 100 kDa; Amicon® Ultracel-100). It was noted that 1:1 systems aggregated during the concentration process, therefore all systems were produced at a PLGA–PEG:CN-PPV ratio of 20:1.
CPN suspensions (60 μL; 1.5 mg mL−1) were added to 240 μL cell culture media and eight serial dilutions decreasing in increments of 0.33× concentration were produced. Negative controls consisted of 100% medium and medium diluted with 16 and 6% deionized water. Cells were incubated for 24 h with 200 μL of CPN suspensions in media and negative controls. After 24 h, carbonyl cyanide 4-(trifluoromethoxy)phenylhydrazone (FCCP; 200 nM), a mitochondrial decoupler and positive control, was incubated in selected wells for 15 min. All wells were then incubated at 37 °C for 30 min with a dye cocktail (100 μL) containing Mitotracker Red, Hoechst 33342 and ImageItDead dyes (600 nM, 32 μM and 50 nM, final concentration), followed by a two-fold wash step with warm phosphate buffered saline (PBS) and fixation with PBS containing 4% paraformaldehyde and 5% sucrose. Finally, CellMask Deep Red (2 μg mL−1 final concentration) was added to the cells and incubated for 120 min at room temperature followed by storage at 4 °C until imaging. Immediately prior to imaging, cells were washed twice in PBS and 100 μL fresh PBS was added to each well.
Plates were imaged on the IN Cell Analyzer 6000 (INCA6000; GE Healthcare) using a 40×/60 magnifying objective acquiring 12 random fields per well. Images were acquired in the UV channel at 405 nm excitation and 455/50 nm and 682/60 emission filters, in the FITC channel at 488 nm excitation and 524/48 nm emission filters, in the dsRed channel at 561 nm excitation and 605/52 nm emission filters and in the Cy5 channel at 642 nm excitation and 682/60 nm emission filters. Automated image analysis was conducted with the IN Cell Developer 1.9 software (GE Healthcare) using custom-developed analysis protocols.
Statistical analysis
Statistical comparisons were conducted using ANOVA via Graph Pad Prism (San Diego, CA). Values were considered significant when *p < 0.05 **p < 0.01, ***p < 0.001.Results
CPNs manufactured with increasing PLGA–PEG content exhibited hydrodynamic diameters ranging from 110–140 nm (Fig. 2A). Inclusion of PLGA–PEG led to a significant increase in hydrodynamic diameter compared to nanoparticles comprised of 100% CN-PPV (0:1). The differences in hydrodynamic diameters measured between CN-PPV with and without PLGA–PEG were attributed primarily to presence of the 5 kDa PEG layer on the particle surface. Electron microscopy (TEM) was used to further characterise differences between CPNs consisting of CN-PPV alone (0:1) and PLGA–PEG:CN-PPV (1:1) (Fig. 2B). TEM images of CN-PPV 0:1 control samples generally showed smaller and less polydisperse particle sizes compared with PLGA–PEG systems, supporting the trends observed with NTA analysis. Both systems were also stable in size over 60 days (Fig. 2D).
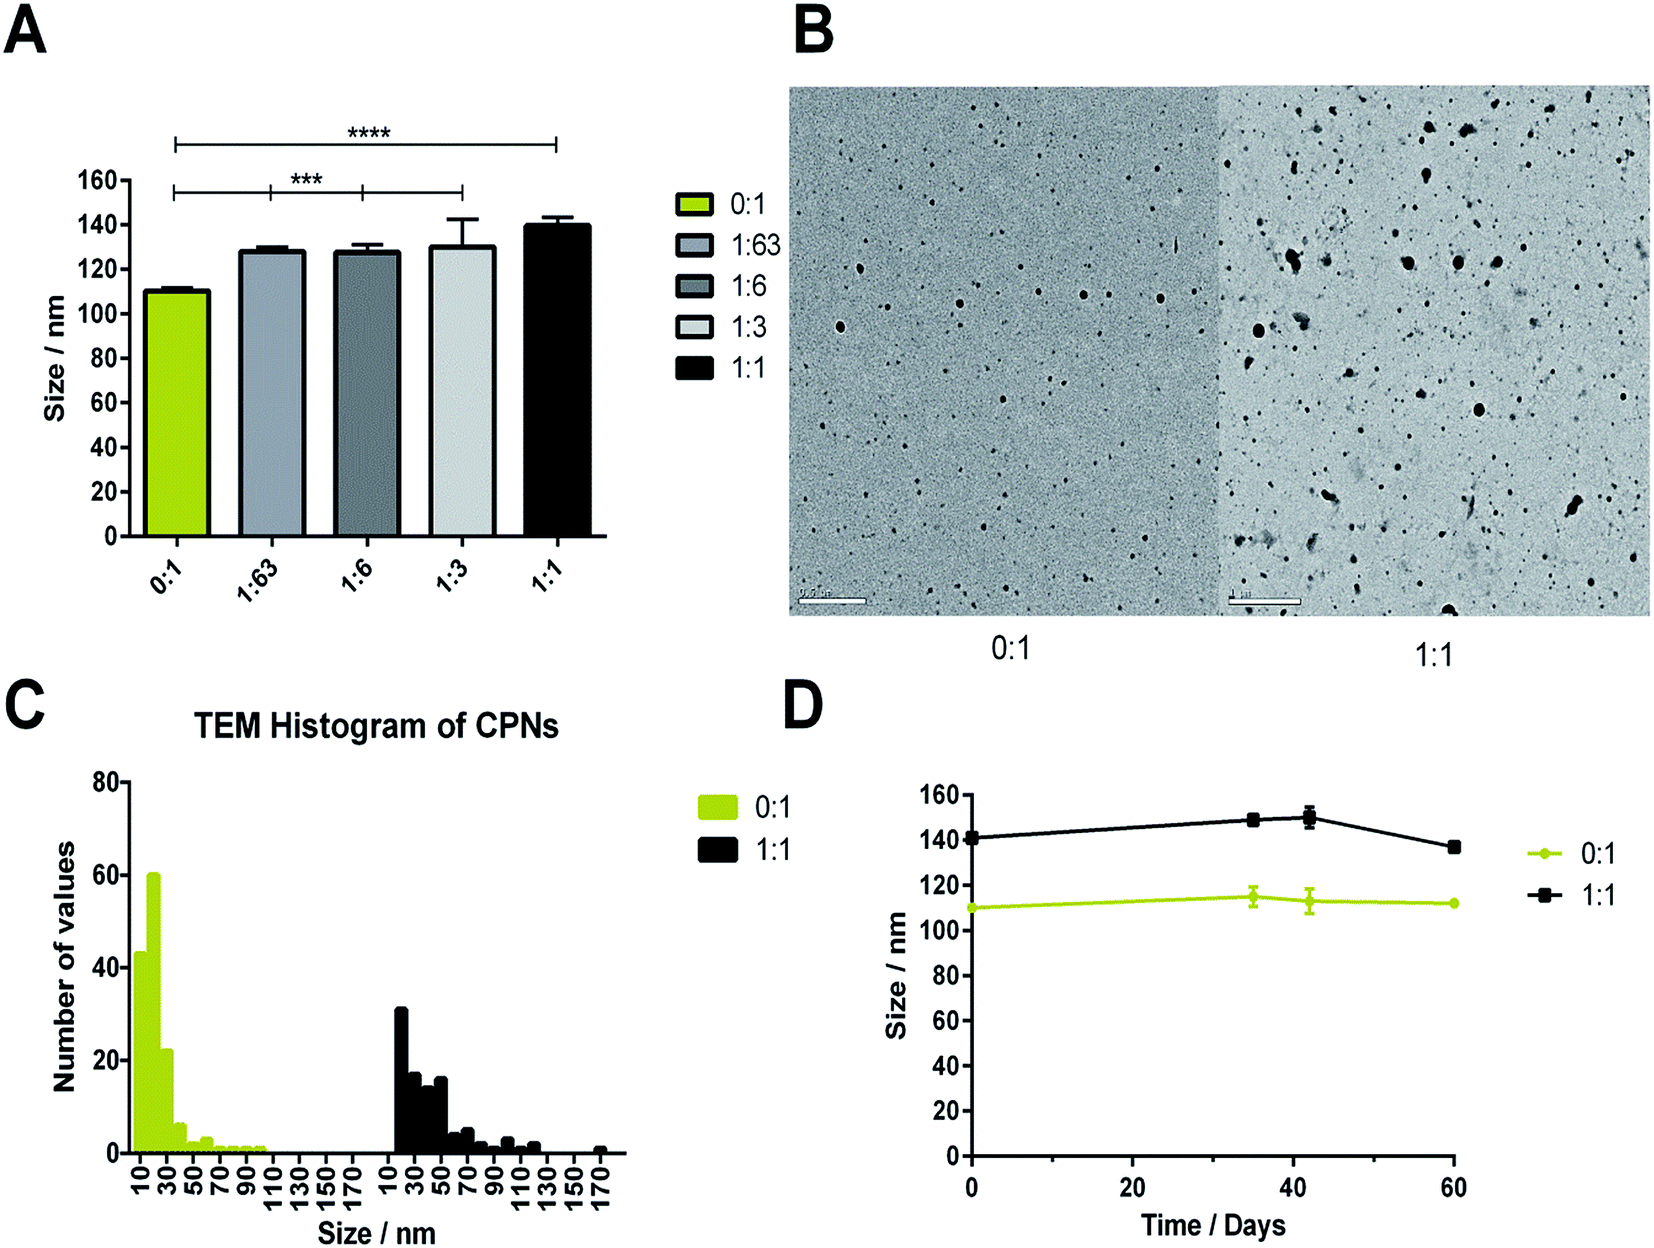 | ||
| Fig. 2 (A) Mean hydrodynamic diameters (NTA) as a function of PLGA–PEG content. Values represent the mean ± standard deviation of n = 3 CPN batches. (B) Representative TEM images of CN-PPV (0:1) and PLGA–PEG:CN-PPV (1:1); scale bar 500 nm. (C) TEM particle size distribution of CN-PPV (0:1) and PLGA–PEG:CN-PPV (1:1). (D) Colloidal stability of aqueous 0:1 and 1:1 systems stored in the dark at 37 °C over 60 days. Values represent the mean ± standard deviation of n = 3 batches (NTA). | ||
The optical properties of CN-PPV CPNs with and without PLGA–PEG were also characterised (Fig. 3). Fig. 3A shows the emission intensity of 0:1, 1:3 and 1:1 systems as a function of CN-PPV concentration. It can be seen that increasing the PLGA–PEG in the system increased the emission intensity and reduced quenching at higher concentrations. Normalised absorption and emission spectra of 0:1 and 1:1 showed that the inclusion of PLGA–PEG had no effect on the CN-PPV emission profiles (Fig. 3B). Further, the PL emission profiles of CPN suspensions with equivalent CN-PPV content displayed a remarkable similarity over a 60 day time period when incubated in aqueous media at 37 °C (Fig. 3C and D).
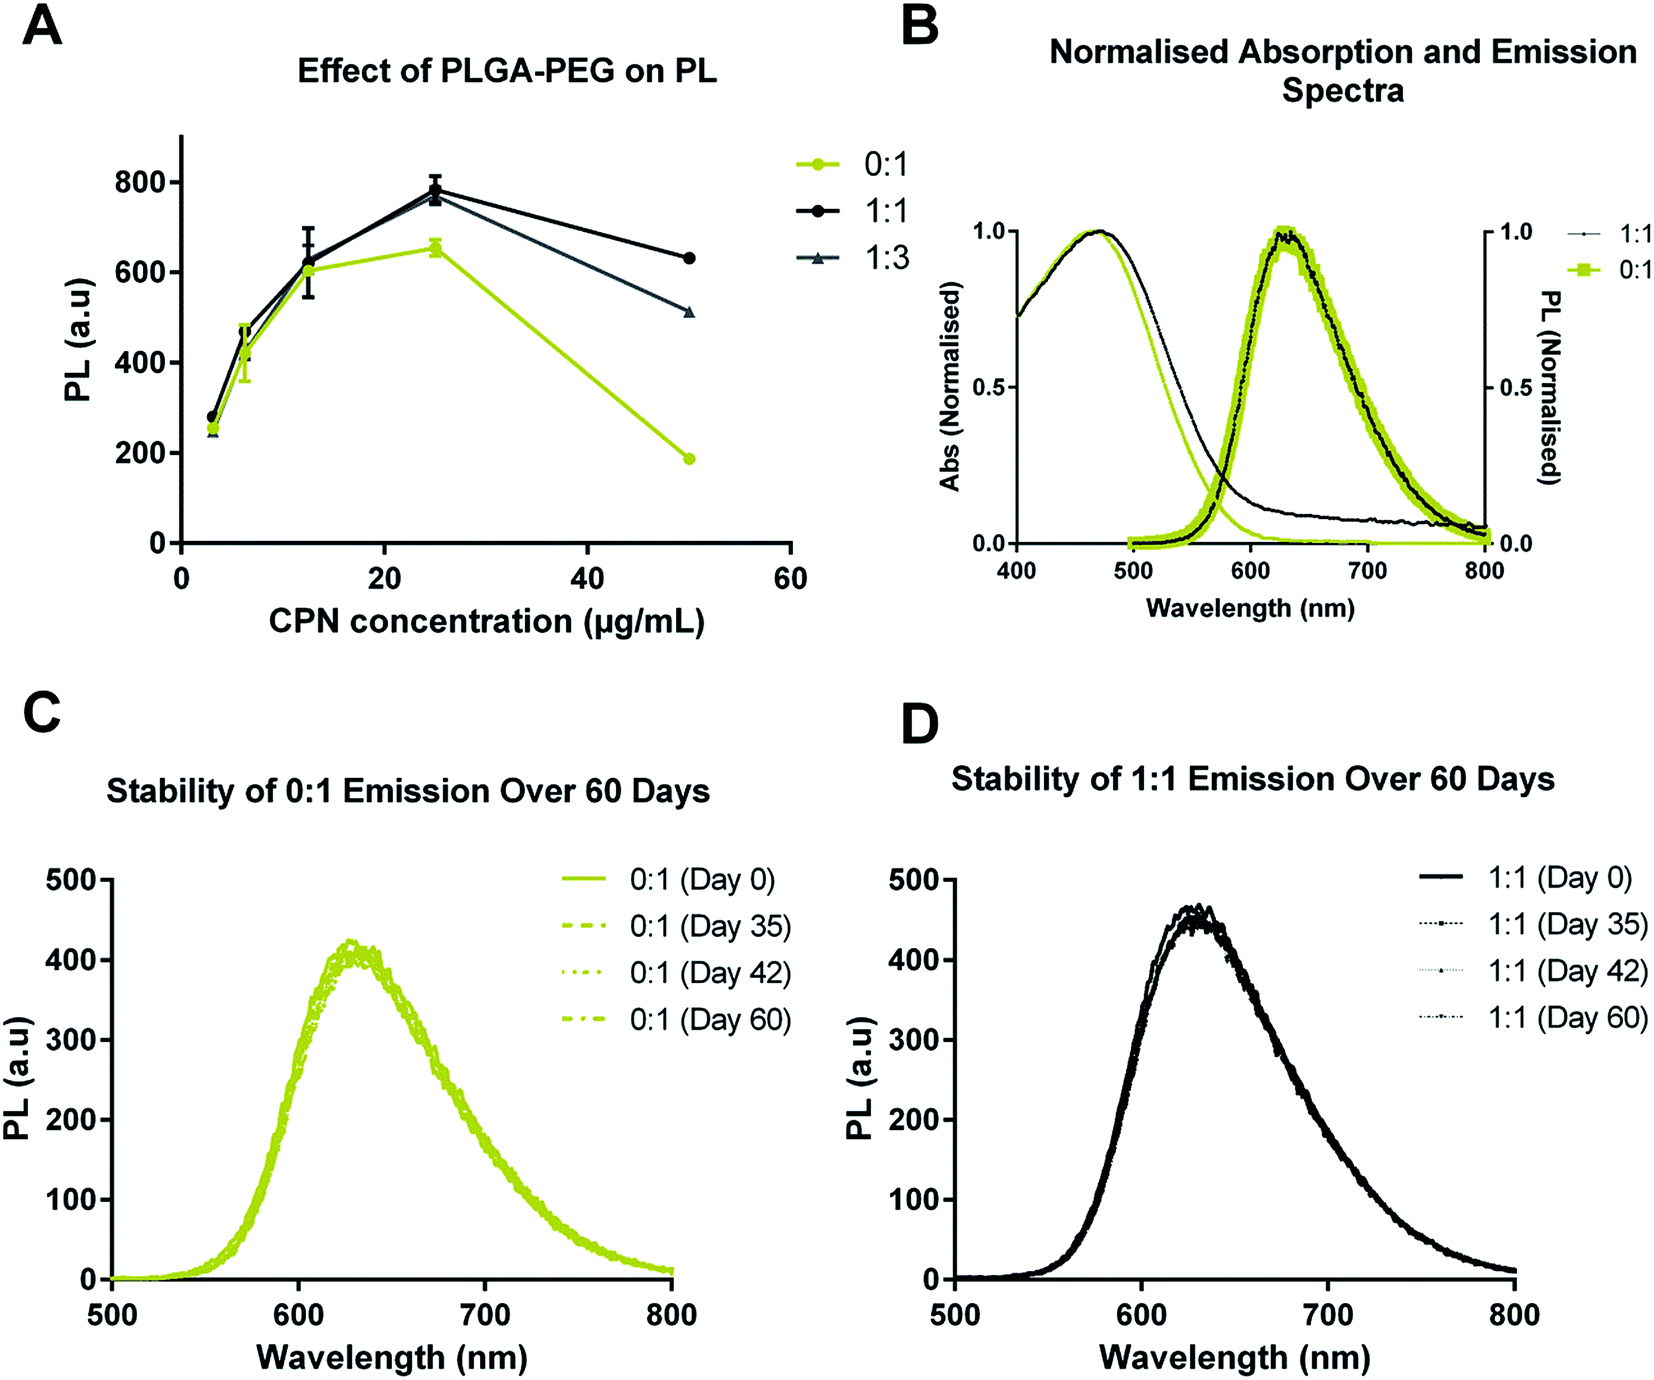 | ||
| Fig. 3 (A) PL of 0:1, 1:3 and 1:1 as a function of CN-PPV concentration following excitation at 470 nm. (B) Normalised absorption and emission profiles of 0:1 and 1:1 CPNs. PL emission spectra of CN-PPV (0:1) CPNs (C) and PLGA–PEG: CN-PPV (1:1) CPNs (D) as a function of time (t = 0, 35, 42, 60 days) when incubated at 37 °C. For stability studies, CPN suspensions were measured at an equivalent CN-PPV concentration 6.25 μg mL−1. | ||
Incorporation of NIR680 and NIR720 into PLGA–PEG![[thin space (1/6-em)]](https://www.rsc.org/images/entities/h3_char_2009.gif) :CN-PPV CPNs
:CN-PPV CPNs
NIR680 and NIR720 absorb at 680 and 700 nm with emission maxima at 707 and 720 nm, respectively. It was thus hypothesized that inclusion of these dyes within the PLGA–PEG:CN-PPV systems would generate CPNs with bright, narrow emission peaks >700 nm. Three different concentrations of each NIR dye were incorporated into PLGA–PEG:CN-PPV (1:1) systems to determine the optimal amount of NIR dye (Fig. 4A and B). From this data, it was concluded that 0.8% NIR680 and 0.5% NIR720 (% m m−1 with regard to CNPPV) was optimal and would be used for all further studies. Normalised absorption and PL emission spectra comparing PLGA–PEG:CN-PPV (1:1) with 1:1 systems containing NIR680 and NIR720 (Fig. 4C) revealed that inclusion of the dyes shifted emission maxima to higher wavelengths as hypothesized, albeit with different levels of energy transfer (FRET). Systems incorporating NIR680 exhibited bimodal spectra with one peak at 630 nm characteristic of CN-PPV emission and a second peak at 707 nm characteristic of the NIR680 emission profile, thus indicating that incomplete energy transfer was occurring between the conjugated polymer and the NIR dye. This profile might also be indicative of an incomplete encapsulation of the more hydrophilic NIR680 compound. In contrast, 1:1 (720) showed a near complete energy transfer the polymer and dye, as shown by the disappearance of the CN-PPV peak and the emergence of narrow peak (23 nm width) with a maximum at 720 nm. The optical stability was also characterised over a 14 day period of incubation in the dark at 37 °C (Fig. 4D) revealing that the 1:1 (720) system was extremely stable, while the 1:1 (680) system showed slightly more variability, although no indication of significant quenching over time.
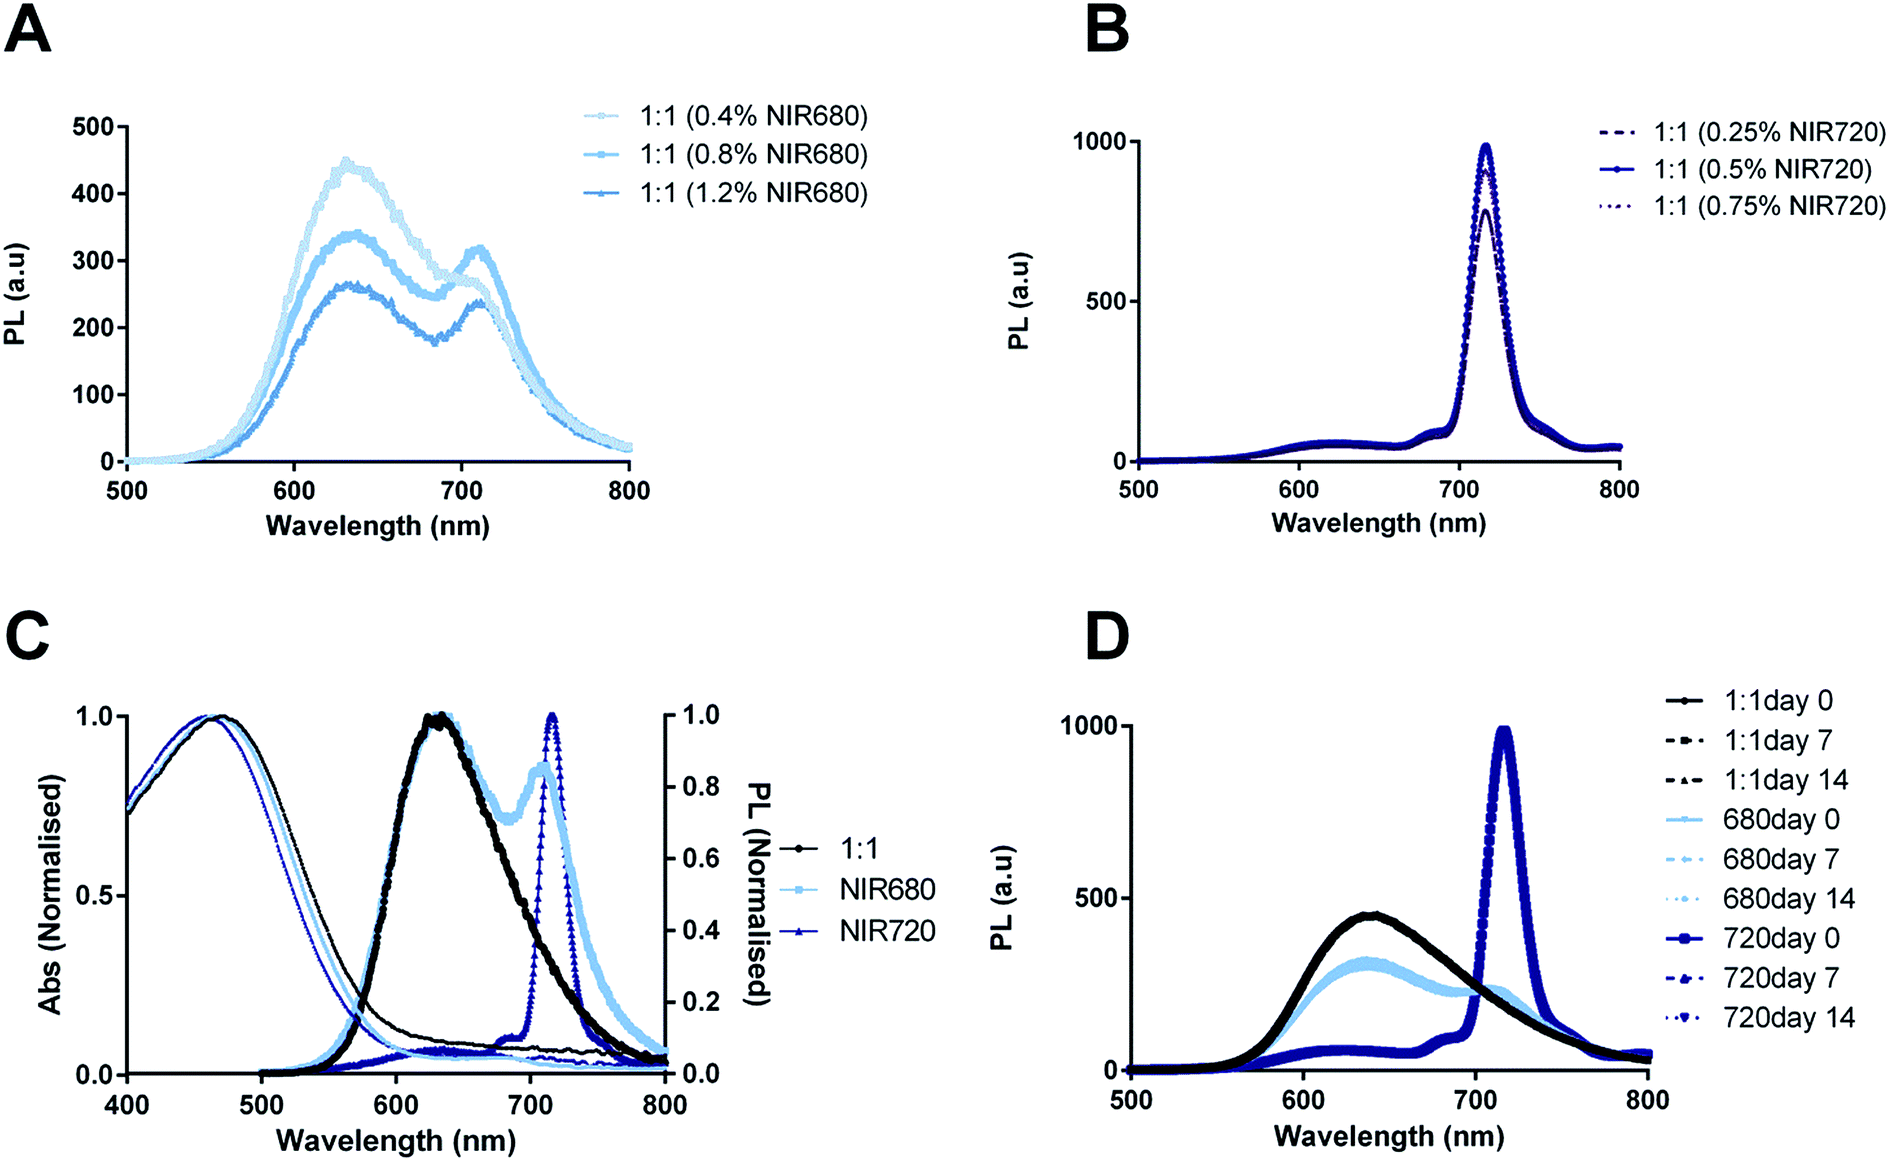 | ||
| Fig. 4 PL spectra of (A) PLGA–PEG:CN-PPV 1:1 systems containing 0.4–1.2% NIR680 and (B) PLGA–PEG:CN-PPV 1:1 systems containing 0.25–0.75% NIR720. (C) Normalised absorbance and emission spectra of 1:1, 1:1 (680) and 1:1 (720). (D) Optical stability of 1:1, 1:1 (680) and 1:1 (720) over 14 days at a constant CN-PPV concentration of 6.25 μg mL−1. | ||
The hydrodynamic diameters derived from NTA (Fig. 5A) show that incorporation of both NIR dyes resulted in significantly smaller particles sizes compared to 1:1 systems without dye encapsulation (p < 0.001). Furthermore 1:1 (680) was significantly smaller the 1:1 (720) (p < 0.001). The analysis of particle size distributions from the TEM images (Fig. 5B and C) confirmed this trend. Colloidal stability studies showed that all systems were stable over 14 days when incubated at 37 °C in the dark (Fig. 5D).
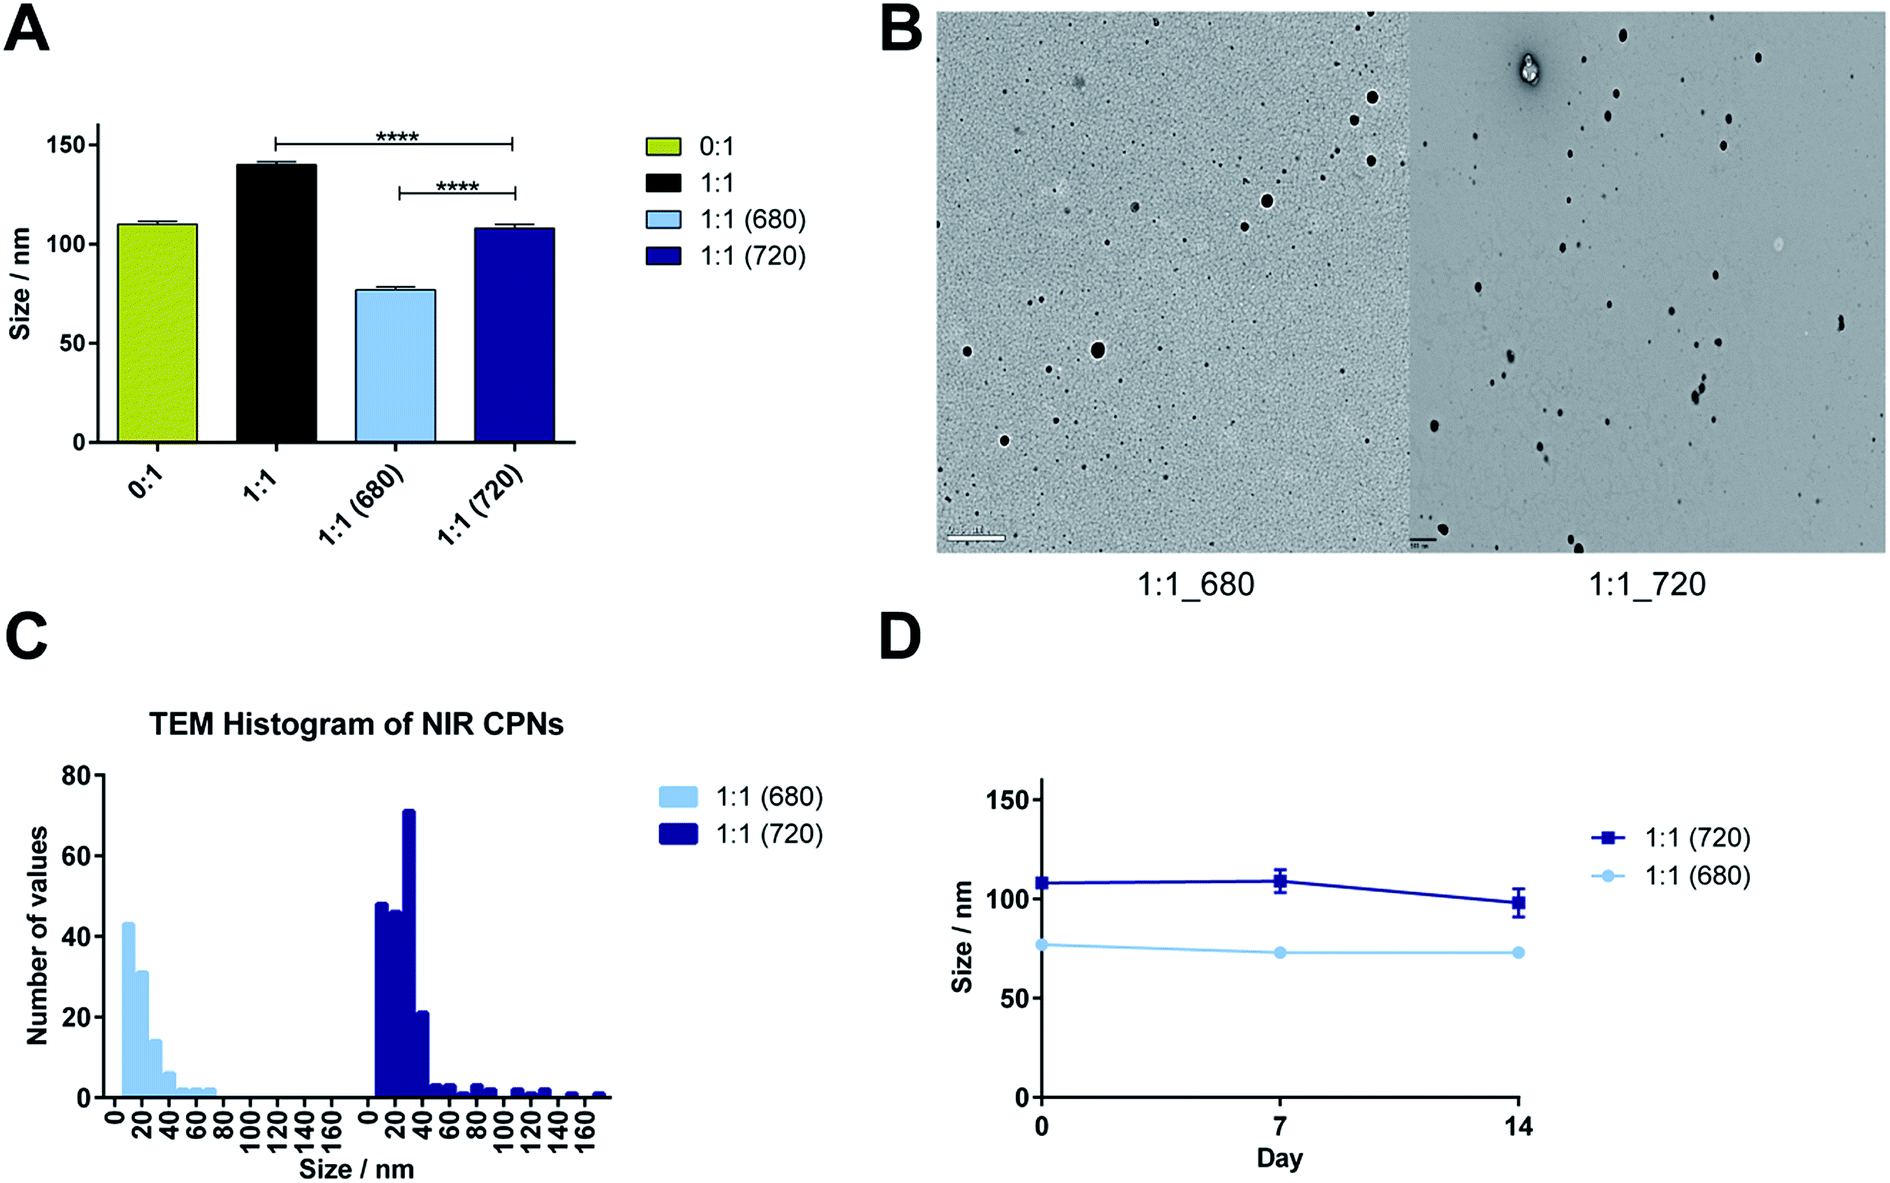 | ||
| Fig. 5 (A) Hydrodynamic diameters of 0:1, 1:1, 1:1 (680) and 1:1 (720). (B) TEM images of 1:1 (680) and 1:1 (720), scale bar = 500 nm. (C) TEM size distribution profiles of 1:1 (680) and 1:1 (720). (D) Size stability over 14 days of 1:1 (680) and 1:1 (720) as measured by NTA. Values represent the mean ± standard deviation of n = 3 nanoparticle batches. | ||
Performance as cell imaging agents and biocompatibility
To assess the brightness of selected systems within a biological environment, HeLa cells were incubated for 1 h with low concentrations (equivalent to 15 μg mL−1 CN-PPV diluted in cell culture medium) of 0:1, 1:1, 1:1 (680) and 1:1 (720) CPNs. Confocal microscopy images were acquired (Fig. 6A) using a visible red filter (570–620 nm) and an NIR band filter (663–738 nm). Based on the optical and physicochemical characteristics of the systems, it was hypothesized that the highly electronegative CN-PPV nanoparticles (0:1; zeta potential ∼ −70 mV) would show both a high cell internalisation rate23 and strong PL in the visible red channel, but not the NIR channel. In contrast, the peglylated surface coating of the three remaining systems was hypothesized to reduce particle internalisation23 resulting in a lower cell association and lower PL in both channels. Based on the emission profiles in Fig. 5, it was postulated that the 1:1 (680) would be visible in both channels, while the 1:1 (720) CPNs should be detected primarily in the NIR channel.
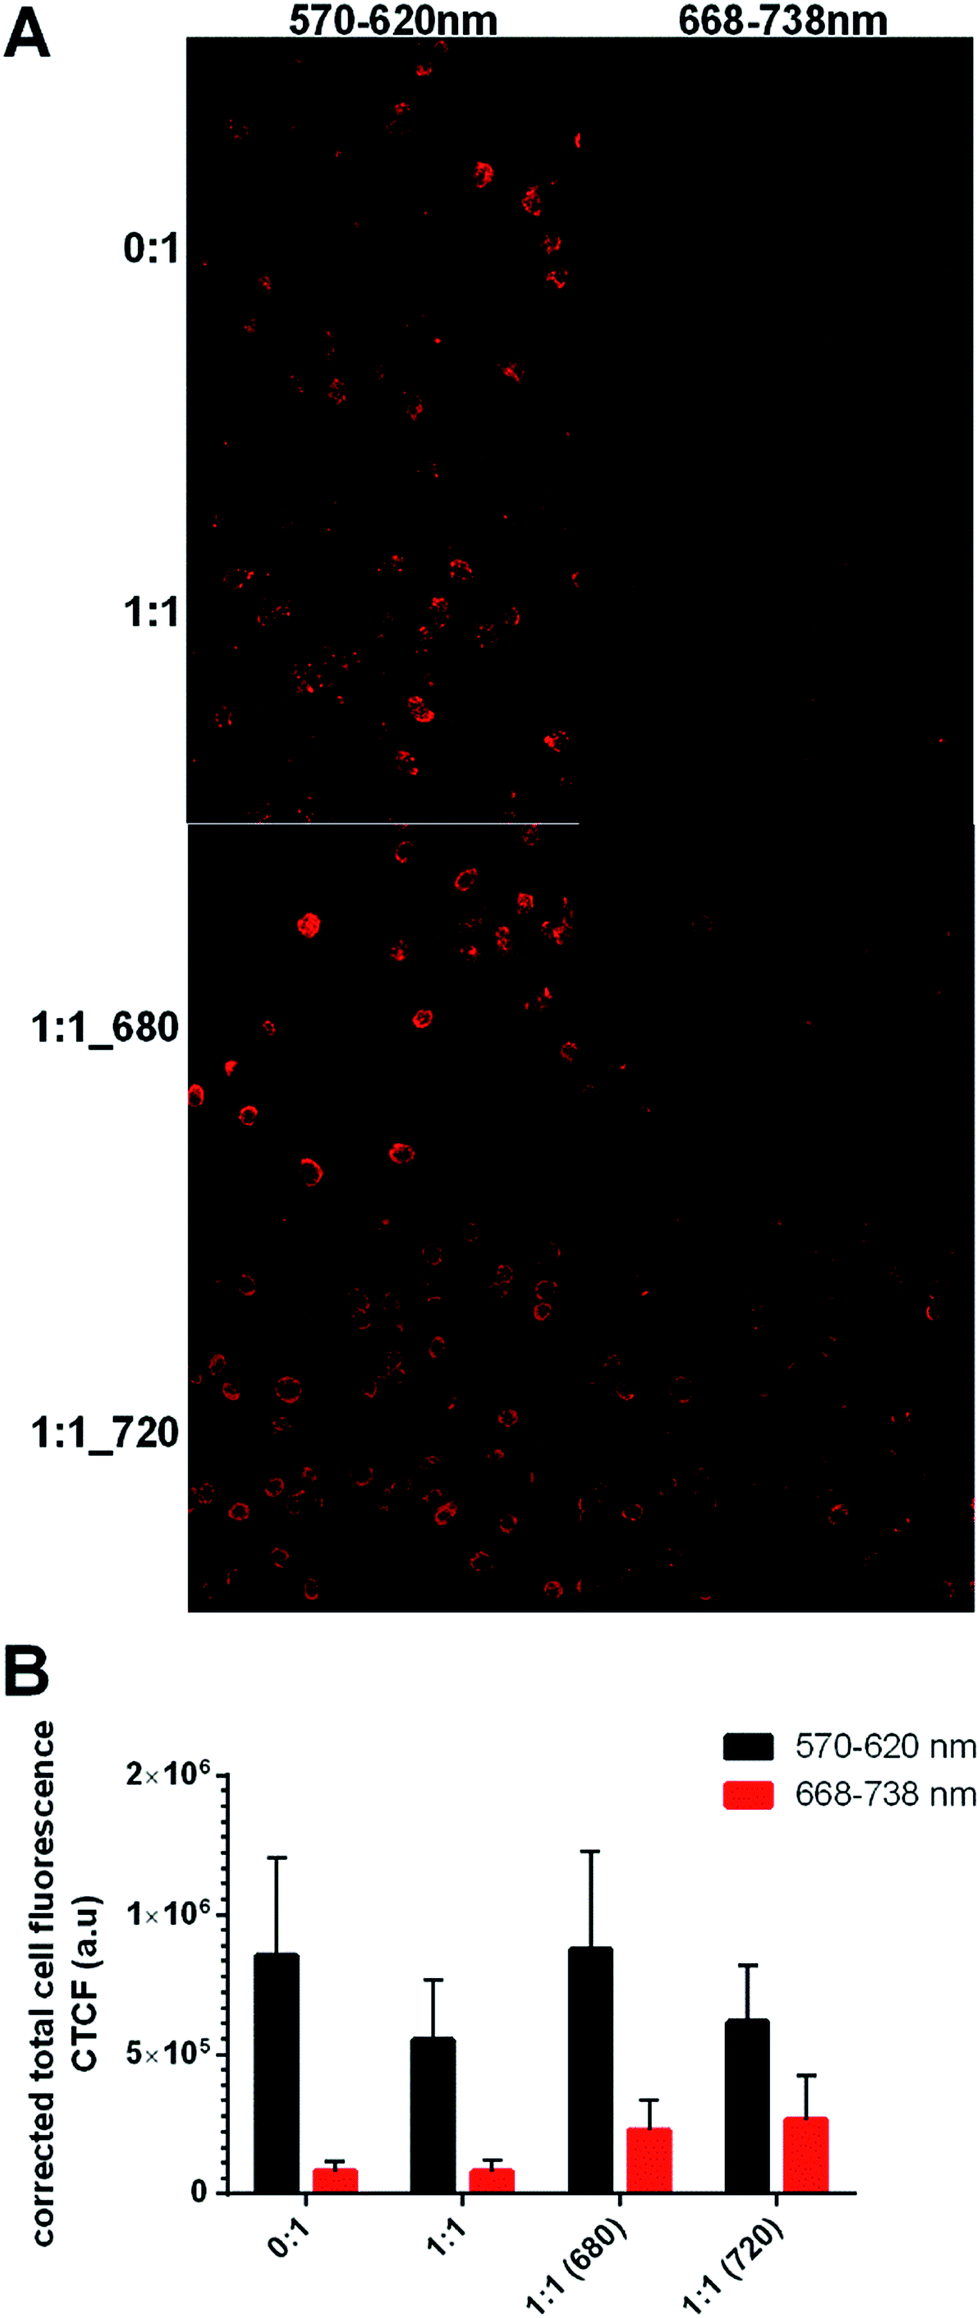 | ||
| Fig. 6 CPN association with HeLa cells. (A) Representative confocal images of HeLa cells following 1 h incubation with 0:1, 1:1, 1:1 (680) and 1:1 (720) systems (15 μg mL−1 CN-PPV). Cells are visualised using a visual red band filter (570–620 nm, left panel) and a NIR band filter (668–730 nm, right panel). (B) The corrected total cell fluorescence (CTCF) was calculated using ImageJ software from n = 3 different images. | ||
Images from the visible red channel (Fig. 6A left panel) show that nearly all HeLa cells depicted were associated with CPNs, either through particle internalisation or surface adsorption. As expected both the 1:1 (680) and 1:1 (720) systems, but not the 0:1 or 1:1 systems could be visualised in the NIR channel (Fig. 6B, right panel). It was interesting to observe that the presence of PEG on the surface of the 1:1 systems did not appear to reduce particle association with HeLa cells (Fig. 6C). This could indicate that the stealth surface coating is not sufficiently dense in order to prevent particle interactions with cells. The other unexpected observation was the relatively strong signal of the 1:1 (720) in the visible red channel compared with the NIR channel. As all microscope settings were adjusted to reduce cell autofluorescence to a minimum, the signal is most likely to be derived from the residual CN-PPV signal in the 1:1 (720) system (Fig. 4B).
In vitro biocompatibility studies were also performed in order to assess cytotoxicity over a wide range of total solids concentrations (0.01–300 μg mL−1). To dilute the systems at the requisite final concentration, stocks of 1 mg mL−1 were prepared using centrifugation filtration. Despite the application of relatively low centrifugal forces, 0:1 and all 1:1 systems aggregated irreversibly during centrifugation. Further optimisation studies confirmed that the use of a 20:1 PLGA–PEG:CN-PPV ratio produced systems which were stable under centrifugal force and at high concentrations, therefore, all further cell studies were performed with 20:1 systems.
Table 2 lists important physicochemical and optical properties of three 20:1 systems produced for this phase of the study. Increasing the PLGA–PEG:CN-PPV ratio to 20:1 showed a significant decrease in size (∼20 nm) compared to 1:1 ratio (p < 0.001). Zeta potential measurements confirmed that the surface of the 20:1 systems was more consistently covered with a non-ionic PEG layer, as denoted by the substantial decrease in zeta potential compared to CN-PPV nanoparticles without PLGA–PEG (0:1), as well as compared to 1:1 systems (−43–55 mV). Interestingly, the 20:1 PLGA–PEG:CN-PPV systems had a higher absolute quantum yield compared with CN-PPV alone. The 20:1 system incorporating the NIR720 had the highest quantum yield of 45% and a very narrow emission peak. Most organic small molecule NIR dyes typically have a quantum below 1%.24
| CPN system | HD (nm) | ZP (mV) | QY (%) | FWHM (nm) |
|---|---|---|---|---|
| 0:1 |
110 ± 1.53 | −77.1 ± 0.6 | 37 | 154 |
| 20:1 |
122.7 ± 3.5 | −29.2 ± 0.4 | 40 | 149 |
| 20:1 (680) |
96.5 ± 2.1 | −30.5 ± 0.4 | 38 | 152 |
| 20:1 (720) |
103.5 ± 2.1 | −28.5 ± 0.4 | 45 | 23 |
The cell line, THP-1 monocytes differentiated with PMB into a macrophage phenotype, were used in conjugation with a high content analysis assay to assess cell viability, mitochondrial activity and CPN-cell association (Fig. 7). Negative controls consisted of untreated cells, medium diluted with 16 or 6% distilled water and PLGA–PEG micelles without CN-PPV (1:0), while FCCP, a mitochondrial uncoupler, was used as a positive control.
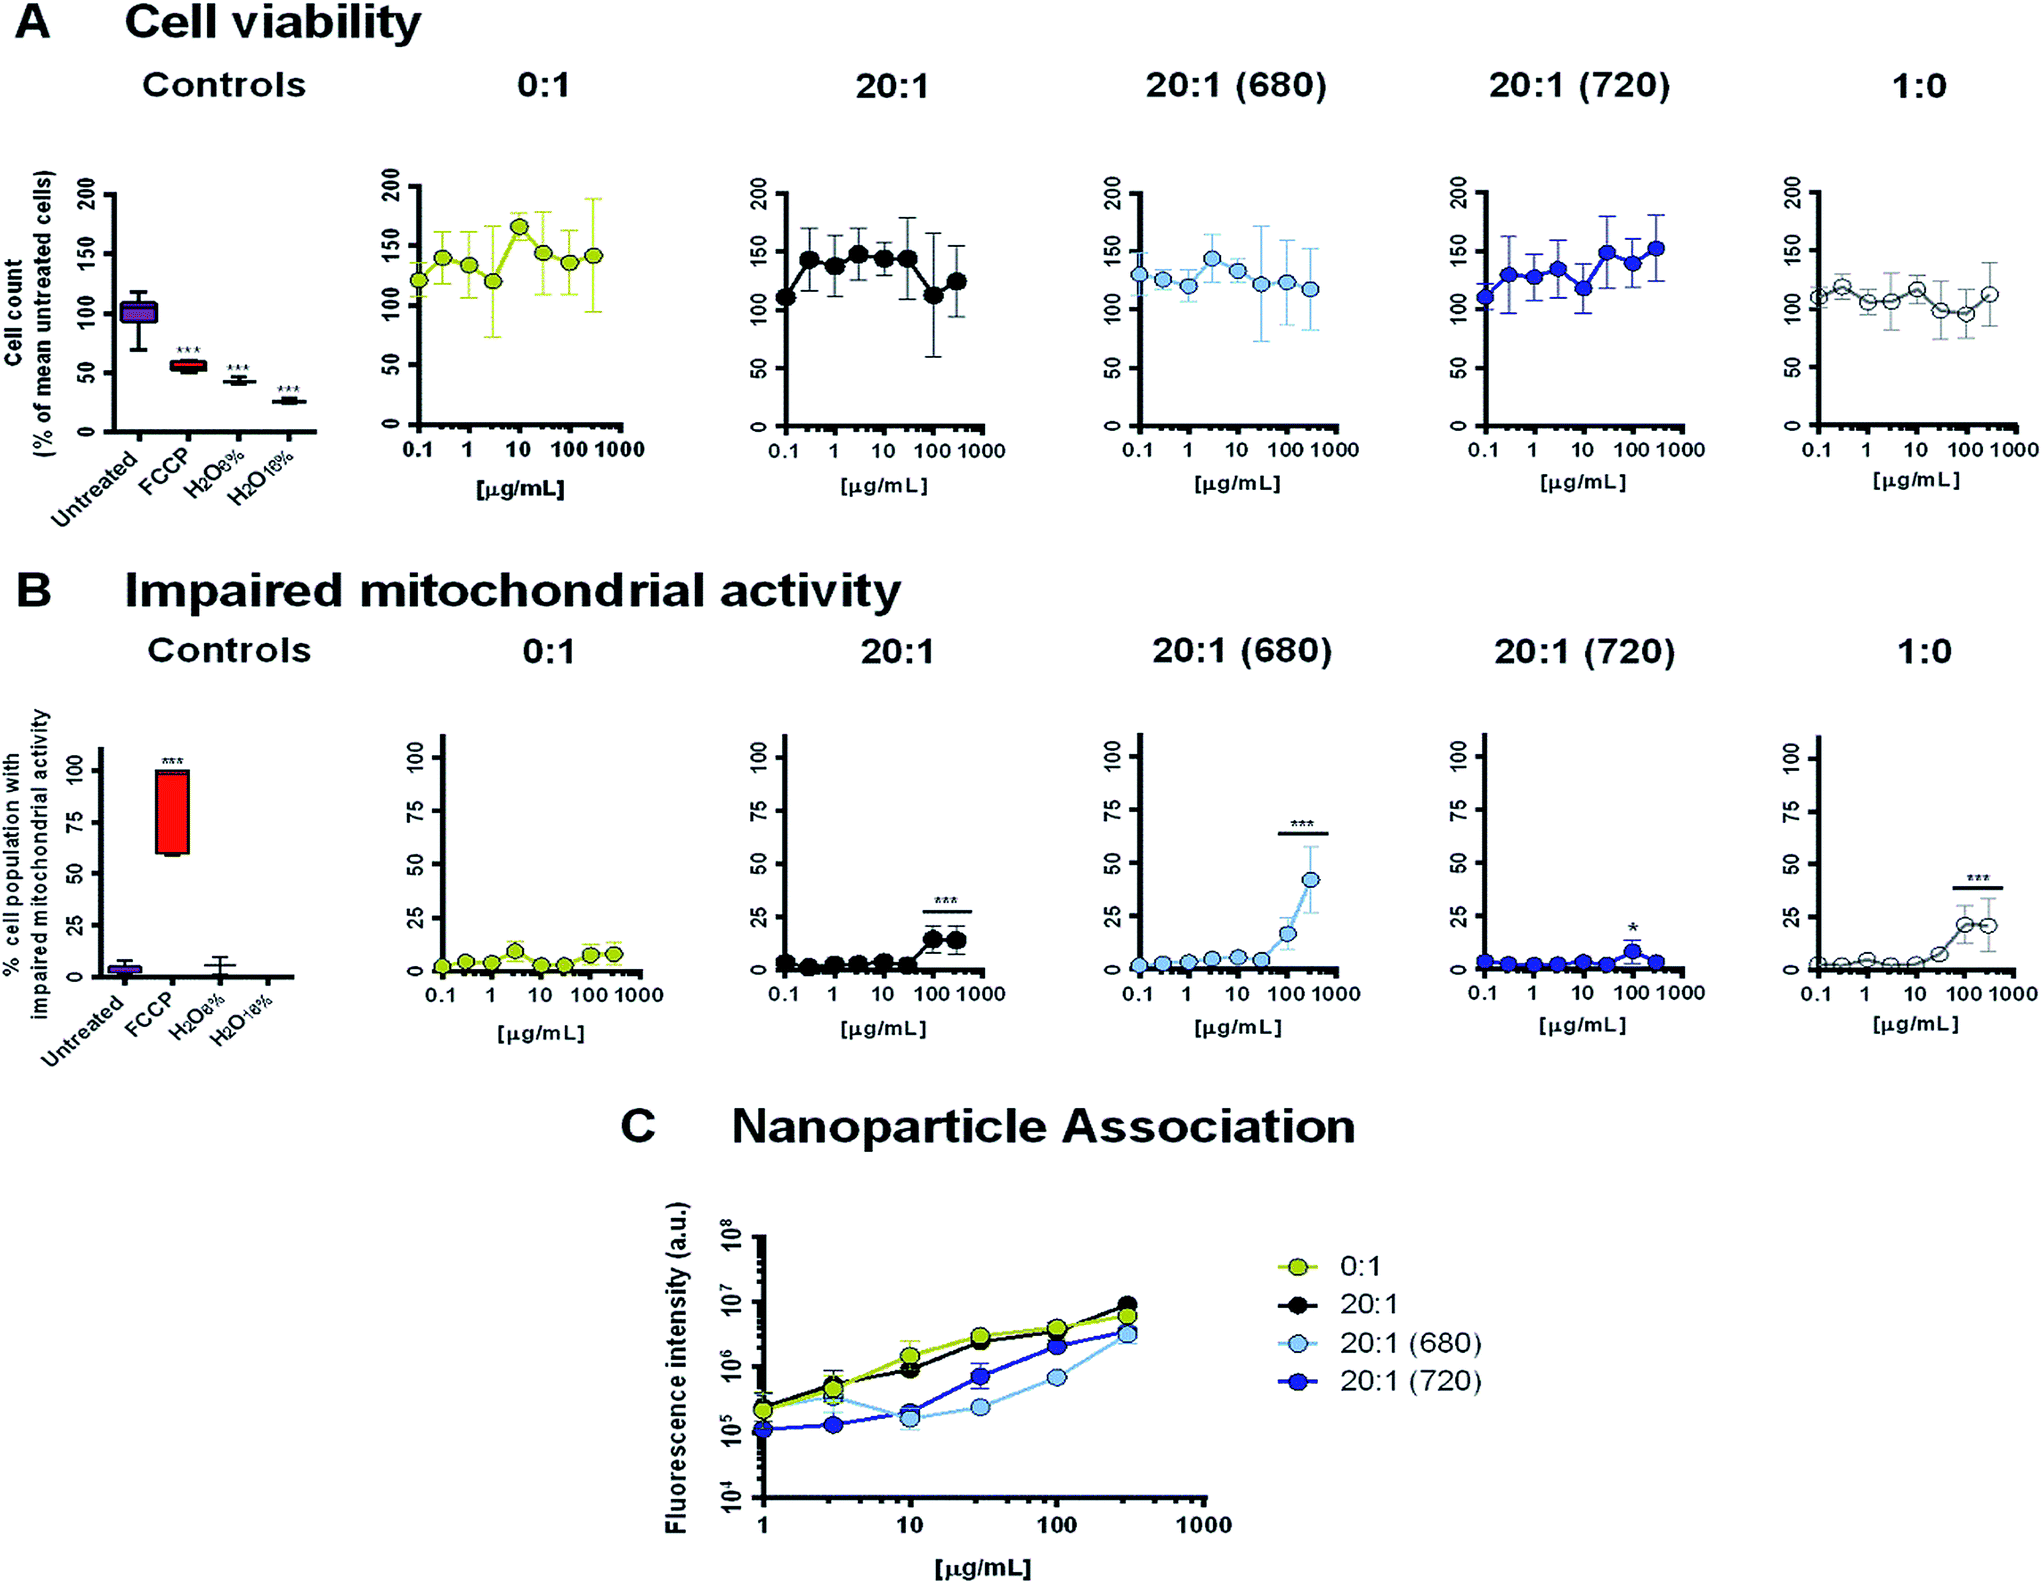 | ||
| Fig. 7 (A) THP-1 cell count per well following incubation for 24 h with various treatments. (B) Percentage THP-1 cell population with impaired mitochondrial activity (defined as a MitoTracker Red fluorescence intensity <2000 a.u.). (C) PL intensity per well following incubation with various treatments containing CN-PPV. Values represent the mean ± standard deviation from n = 3 experiments with different THP-1 passage numbers. | ||
Incubation of the cells for 24 h with five micellar systems (0:1, 20:1, 20:1 (680), 20:1 (720) and 1:0) showed no significant decrease in cell numbers caused by nanoparticle-induced necrosis (Fig. 7A). However, at concentrations of 100 μg mL−1 and above, systems containing PLGA–PEG showed significant increases in the percentage of the cell population with impaired mitochondrial activity (Fig. 7B). This behaviour appeared to be independent of the CN-PPV content and was most prominent in the 20:1 (680) system. Interestingly, the 20:1 (720) system appeared to have very little impact on mitochondrial health. The decrease in mitochondrial activity in the presence of the 20:1 (680) system might be explained by two factors. First, ethanol was used in the preparation of this system and traces may have remained in the structure after evaporation of the majority of the solvent, causing cytotoxicity. Secondly, the PL emission profiles of systems containing NIR680 suggest that the dye was not fully encapsulated in the polymer micelle core (in contrast to the more hydrophobic NIR720 dye). Thus, unencapsulated NIR680 may have a deleterious impact on mitochondrial activity, independent of the polymer micelles. As the performance of the CPN systems containing NIR720 was superior to the systems containing NIR680, further studies investigating the encapsulation efficiency of NIR680 and the residual ethanol content were not pursued.
Following excitation at 488 nm and image capture using a red emission filter a red emission filter (682/60), the association of systems containing CN-PPV with the THP-1 cells was analysed. Similar to the observations made with the HeLa cell line, the pegylated 20:1 systems appeared to have the same cell association rate as the nanoparticles consisting of 100% CN-PPV, indicating that the stealth coating did not substantially reduce particle–cell interactions. At concentrations above 1 μg mL−1, both the 20:1 (680) and the 20:1 (720) systems had a significantly lower fluorescence intensity per well (P < 0.05). However, without quantification of the CN-PPV content within the cell layer, which was not performed due to interference from the other fluorescent dyes used in the high content analysis, it cannot be ascertained whether the two systems had a lower cellular uptake or the PL was impacted by the intracellular environment. Further studies using the 20:1 (720) are currently ongoing to assess this in greater detail.
Discussion
Fluorescent nanoparticles have potential applications in many biological and medical fields. The main types of fluorescent nanomaterials can be classed as fluorescent dye nanoparticles, inorganic nanocrystals also known as quantum dots (Qdots) or conjugated polymer nanoparticles (CPNs), also known as fluorescent polymer nanoparticles (Pdots).25 Although all these nanoparticle types have their own constraints, both Qdots and CPNs offer significant increases in brightness and stability compared to dyes.1–5 Qdots can be synthesized in many different colours by tuning the particle size, and characterized by large absorption cross-sections (some 100 fold that of fluorescent dyes), large Stokes' shifts, narrow emission bands (FWHM ∼20–40 nm) and minimal photobleaching.25 Qdots serve as the imaging ‘gold standard’ at which all other probes can be measured; however, their toxicity is a major drawback in terms of their applications. Many groups are exploring new synthesis methods to address this major drawback by replacing highly toxic heavy metal cadmium with less toxic zinc or indium or by surrounding the quantum dots in polymers that are biocompatible.26 Another property of Qdots which set them aside is their chemical stability and fabrication into nearly any desired monodisperse size, which other nanoparticle imaging systems have yet to match. CPNs on the other hand have even higher absorption cross sections and brighter emission profiles than Qdots of similar size, whilst being easy to fabricate and modify for a variety of applications.1–5CPNs that possess strong, stable optical properties in the NIR window, that are produced by methods easy to scale up for industrial manufacturing, and that exhibit positive biocompatibility attributes, such as low toxicity, long circulation times and biodegradability, will be more suitable for clinical translation.27 These design features have driven the current study investigating the performance and biocompatibility of PLGA–PEG:CN-PPV CPNs both with and without incorporation of low molecular weight NIR dyes.
A moderately high molecular weight PEG5 kDa–PLGA55 kDa with a 50:50 blend of lactic and glycolic acid was chosen because it was hypothesized that a higher percentage of the relatively more hydrophobic PLGA component would achieve a higher encapsulation efficiency of the CN-PPV and NIR dyes.28 Further, it was hypothesized that the longer PLGA chains would stabilise an elongated, rather than coiled, conformation of the CN-PPV, thus resulting in an improved optical performance.29,30 The high surface density of the 5 kDa PEG chain will also provide a protective corona around the self-assembled polymer shell.31 Detailed studies are currently underway to investigate the mechanism and rate of biodegradation under biologically relevant conditions.
The use of CN-PPV was inspired by a recent report from Ye et al.3 who described a CPN system comprised of CN-PPV, highlighting the excellent optical properties of a related system when processed into nanoparticle form due to its intrinsic chain stability through polymer chain aggregation rather than single chain emission.3,32–34 The electronegativity of the cyano-moieties also results in a certain amphiphilicity of the polymer chain, which enables CN-PPV to self-assemble into moderately stable colloidal structures upon injection into aqueous media. These differences help explain the enhanced luminescence quantum yield, photostability, and colloidal stability for CN-PPV versus other conjugated polymers.
An important outcome of this study was the observation that encapsulation of very small amounts of CN-PPV as low as 5% (m m−1) in PLGA–PEG polymeric micelles enhances the optical performance and stability of the systems over long time frames. The QY of CN-PPV alone (0:1) was found to be high at 37%, but was 3–8% higher in the 20:1 systems. The QY values obtained for the PLGA–PEG:CN-PPV nanoparticles are slightly lower than CN-PPV in solvent (50%) but higher than most films (30%).32–34 Incorporation of a small molecule NIR-emitting dye resulted in even higher QY values with 38% and 45% for 20:1 (680) and 20:1 (720), respectively. These values can be considered high when compared against the FDA approved dye indocyanine green with a QY of <1%.24 Of further note, the extremely efficient FRET transfer in 20:1 (720) system produced an extremely narrow FWHM at 23 nm. This is of particular interest for diagnostic applications and is more than twice as narrow as the commercially available NIR quantum dots, such as Qdot®705 (ref. 35) (∼70 nm) and other promising experimental NIR emitting polymer nanoparticles.1–11
Following optical performance, the manufacturability and in vivo safety of novel nanodiagnostics will be two major hurdles in the path towards clinical translation. The utilisation of PLGA–PEG to form a self-assembling vehicle for the conjugated polymer serves to address some requirements of clinical translation.27,28 The closely related, PEG-PLA (poly ethylene-glycol-co-poly lactic acid) block copolymers have been used in clinical trials (Genexol-PM® or Cynviloq™).28 These copolymers are highly biocompatible and semi-biodegradable, providing a mechanism for elimination of the nanodiagnostic from the body over time.
Currently, there are no known biodegradation mechanisms for conjugated polymer nanoparticles, although encapsulation of these inert polymers within a matrix of biodegradable copolymer can greatly reduce the mass of conjugated polymer in the CPN system, while enhancing the optical performance. This lower burden of conjugated polymer may improve in vivo safety profiles of such systems. It should be noted that a number of studies have already shown an excellent cyto-compatibility profile across a range of CPNs.23,36–38 However, long term studies investigating in vivo safety are still outstanding.
Finally, the simple self-assembly of PLGA–PEG into polymer micelles following injection of the polymer solution into an aqueous phase, combined with the efficient encapsulation of CN-PPV within the micelle core, result in a manufacturing process with a high yield (>90%) and very reproducible product characteristics. Furthermore, the manufacture of self-assembling CPNs lends itself to semi-continuous manufacturing practices and the potential for easy scale up from lab to commercial batch sizes even with the stringent quality requirements for injectable diagnostic products.
Conclusions
Clinical translation of novel optical nanodiagnostics requires not only optimisation of optical performance, but also the design of systems with suitable safety and manufacturability characteristics. This study demonstrated that the encapsulation of the red-emitting conjugated polymer, CN-PPV, within polymer micelles comprised of the biodegradable diblock copolymer, PLGA–PEG, resulted in a system with excellent optical properties and the possibility of further translation towards clinical applications. Concurrent encapsulation of the hydrophobic small molecular weight NIR dye, NIR720, produced an optimised system with a small hydrodynamic diameter, narrow emission peak at 720 nm, a very high quantum yield of 45% and an excellent biocompatibility compared with related systems. Further studies will focus on assessment of the targeting capabilities of the optimised systems, as well as in vivo safety and performance.Acknowledgements
The authors would like to acknowledge Abhinav Kumar, Ewelina Hoffman and Val Miller for their assistance with the design and analysis of the high content imaging analysis. We also acknowledge EPSRC for funding (EP/K018876/1).References
- I. C. Wu, J. Yu, F. Ye, Y. Rong, M. E. Gallina, B. S. Fujimoto, Y. Zhang, Y. H. Chan, W. Sun, X. H. Zhou, C. Wu and D. T. Chiu, J. Am. Chem. Soc., 2015, 137, 173 CrossRef CAS PubMed.
- J. Yu, X. Zhang, X. H. X. Zhang, M. Zhou, C. S. Lee and X. Chen, Biomaterials, 2014, 35, 3356 CrossRef CAS PubMed.
- F. Ye, C. Wu, Y. Jin, M. Wang, Y. H. Chan, J. Yu, W. Sun, S. Hayden and D. T. Chiu, Chem. Commun., 2012, 48, 1778 RSC.
- X. Zhang, J. Yu, Y. Rong, F. Ye, D. T. Chiu and K. Uvdal, Chem. Sci., 2013, 4, 2143 RSC.
- Q. Q. Dou, H. C. Guo and E. Y. Ye, Mater. Sci. Eng. C, 2014, 45, 635 CrossRef CAS PubMed.
- K. Sun, H. Chen, L. Wang, S. Yin, H. Wang, G. Xu, D. Chen, X. Zhang, C. Wu and W. Qin, ACS Appl. Mater. Interfaces, 2014, 6, 10802 CAS.
- P. J. Wu, S. Y. Kuo, Y. C. Huang, C. P. Chen and Y. H. Chan, Anal. Chem., 2014, 86, 4831 CrossRef CAS PubMed.
- C. P. Chen, Y. C. Huang, S. Y. Liou, P. J. Wu, S. Y. Kuo and Y. H. Chan, ACS Appl. Mater. Interfaces, 2014, 6, 21585 CAS.
- L. Xiong, A. J. Shuhendler and J. Rao, Nat. Commun., 2012, 3, 1193 CrossRef PubMed.
- J. Pennakalathil, A. Ozgun, I. Durmaz, R. Cetin-Atalay and D. Tuncel, J. Polym. Sci., Part A: Polym. Chem., 2015, 53, 114 CrossRef CAS.
- T. J. Russin, E. I. Altınoğlu, J. H. Adair and P. C. Eklund, J. Phys.: Condens. Matter, 2010, 22, 334217 CrossRef CAS PubMed.
- K. T. Yong and M. T. Swihart, Nanomedicine, 2012, 7, 1641 CrossRef CAS PubMed.
- E. V. Rosca, M. Wright, R. Gonitel, W. Gedroyc, A. D. Miller and M. Thanou, Mol. Pharm., 2015, 12, 1335 CrossRef CAS PubMed.
- S. Rahimian, J. W. Kleinovink, M. F. Fransen, L. Mezzanotte, H. Gold, P. Wisse, H. Overkleeft, M. Amidi, W. Jiskoot, C. W. Lowik, F. Ossendorp and W. E. Hennink, Biomaterials, 2015, 37, 469 CrossRef CAS PubMed.
- L. Xiong, F. Cao, X. Cao, Y. Guo, Y. Zhang and X. Cai, Bioconjugate Chem., 2015, 26, 817 CrossRef CAS PubMed.
- L. Chu, S. Wang, K. Li, W. Xi, X. Zhao and J. Qian, Biomed. Opt. Express, 2014, 5, 4076 CrossRef CAS PubMed.
- Y. Zhong, C. Wang, R. Cheng, L. Cheng, F. Meng, Z. Liu and Z. Zhong, J. Controlled Release, 2014, 195, 63 CrossRef CAS PubMed.
- S. A. Hilderbrand and R. Weissleder, Curr. Opin. Chem. Biol., 2010, 14, 71 CrossRef CAS PubMed.
- E. Locatelli and M. J. Comes Franchini, J. Nanopart. Res., 2012, 14, 1316 CrossRef.
- M. L. T. Zweers, G. H. M. Engbers, D. W. Grijpma and J. Feijen, J. Controlled Release, 2004, 100, 347 CrossRef CAS PubMed.
- K. Avgoustaks, A. Beletsi, Z. Panagi, P. Kepetsanis, A. G. Karydes and P. S. Thakissios, J. Controlled Release, 2002, 79, 123 CrossRef.
- J. Cheng, B. A. Teply, I. Sherifi, J. Sung, G. Luther, F. X. Gu, E. Levy-Nissenbaum, A. F. Radovic-Moreno, R. Langer and O. C. Farokhza, Biomaterials, 2007, 28, 869 CrossRef CAS PubMed.
- R. Ahmad Khanbeigi, T. F. Abelha, A. Woods, O. Rastoin, R. D. Harvey, M. C. Jones, B. Forbes, M. A. Green, H. Collins and L. A. Dailey, Biomacromolecules, 2015, 16, 733 CrossRef CAS PubMed.
- J. O. Escobedo, O. Rusin, S. Lim and R. M. Strongin, Curr. Opin. Chem. Biol., 2010, 14, 64 CrossRef CAS PubMed.
- A. Burns, H. Ow and U. Wiesner, Chem. Soc. Rev., 2006, 35, 1028–1042 RSC.
- A. Das and P. T. Snee, ChemPhysChem, 2016 Mar 3, 17(5), 598–617 Search PubMed.
- Frontiers in Nanobiomedical Research, in Handbook of Immunological Properties of Engineered Nanomaterials, ed. M. A. Dobrovolskaia and S. E. McNeil, World Scientific, Singapore, 2013, vol. 1–3 Search PubMed.
- H. Cho, J. Gao and G. S. Kwon, J. Controlled Release, 2016, 240, 191 CrossRef CAS PubMed.
- C. L. Gettinger, A. J. Heeger, J. M. Drake and D. J. Pine, J. Chem. Phys., 1994, 101, 1673 CrossRef CAS.
- U. Mitschke and P. Bäuerle, J. Mater. Chem., 2000, 10, 1471 RSC.
- J. V. Jokerst, T. Lobovkina, R. N. Zare and S. S. Gambhir, Nanomedicine, 2011, 6, 715 CrossRef CAS PubMed.
- J. H. Hsu, W. Fann, H. F. Meng, E. S. Chen, E. C. Chang, S. A. Chen and K. W. To, Chem. Phys., 2001, 269, 367 CrossRef CAS.
- B. G. Sumpter, M. L. Drummond, W. A. Shelton, E. F. Valeev and M. D. Barnes, Comput. Sci. Discovery, 2008, 1, 015006 CrossRef.
- N. T. Harrison, D. R. Baigent, I. D. W. Samuel, R. H. Friend, A. C. Grimsdale, S. C. Moratti and A. B. Holmes, Phys. Rev. B: Condens. Matter Mater. Phys., 1996, 53, 15815 CrossRef CAS.
- E. Z. Chong, D. R. Matthews, H. D. Summers, K. L. Njoh, R. J. Errington and P. J. Smith, J. Biomed. Biotechnol., 2007, 2007, 54169 CAS.
- L. P. Fernando, P. K. Kandel, J. Yu, J. McNeill, P. C. Ackroyd and K. A. Christensen, Biomacromolecules, 2010, 11, 2675 CrossRef CAS PubMed.
- F. Ye, C. C. White, Y. Jin, X. Hu, S. Hayden, X. Zhang, X. Gao, T. J. Kavanagh and D. T. Chiu, Nanoscale, 2015, 7, 10085 RSC.
- R. Ahmad Khanbeigi, Z. Hashim, T. F. Abelha, S. Pitchford, H. Collins, M. A. Green and L. A. Dailey, J. Mater. Chem. B, 2015, 3, 2463 RSC.
| This journal is © The Royal Society of Chemistry 2017 |