
 Open Access Article
 This Open Access Article is licensed under a Creative Commons Attribution-Non Commercial 3.0 Unported Licence
Ammonia-free synthesis of lithium manganese iron phosphate cathodes via a co-precipitation reaction†
Panawan
Vanaphuti
 ,
Kevin
Scanlan
and
Arumugam
Manthiram
*
,
Kevin
Scanlan
and
Arumugam
Manthiram
*
Materials Science and Engineering Program & Texas Materials Institute, The University of Texas at Austin, Austin, TX 78712, USA. E-mail: manth@austin.utexas.edu
First published on 13th June 2024
Abstract
LiMnxFe1−xPO4 (LMFP) has emerged as a promising cathode material for Li-ion batteries due to its lower cost, better sustainability, and improved thermal and cycling stabilities compared to layered oxide cathodes. The incorporation of Mn in LMFP increases the operating voltage, and therefore the theoretical energy density, compared to LiFePO4. However, with high Mn content, it is difficult to fully utilize the Mn2+/3+ redox due to sluggish kinetics, resulting in a lower practical capacity. Atomic-scale mixing of Mn and Fe is crucial for the optimal electrochemical performance of LMFP, yet the practical scalability and the ease of synthesizing precursor compositions with different Mn contents through co-precipitation reaction remains underexplored. We present here for LMFP manufacturing a novel, scalable precursor (Mn, Fe)5(PO4)2(HPO4)2·4H2O, which is air-stable and is synthesized without the use of ammonia, for the first time. The role of the reactants, pH, and temperature in controlling the phase purity and morphology of the precursor are explored. Particularly, it is found that phase purity is highly sensitive to the Mn![[thin space (1/6-em)]](https://www.rsc.org/images/entities/char_2009.gif) :Fe ratio and temperature during co-precipitation. The LMFP cathodes synthesized with the precursor exhibit excellent cycling stability, retaining over 95% capacity after 150 cycles at a C/3 rate. However, while higher Mn content (>60%) increases the average voltage, the specific capacity decreases due to sluggish kinetics, limiting the benefit to energy density. This work presents an industrially scalable method to synthesize mixed precursors for LMFP cathodes with a wide range of Mn contents providing a pathway to fine-tune the Mn content and particle morphology for optimal electrochemical performance.
:Fe ratio and temperature during co-precipitation. The LMFP cathodes synthesized with the precursor exhibit excellent cycling stability, retaining over 95% capacity after 150 cycles at a C/3 rate. However, while higher Mn content (>60%) increases the average voltage, the specific capacity decreases due to sluggish kinetics, limiting the benefit to energy density. This work presents an industrially scalable method to synthesize mixed precursors for LMFP cathodes with a wide range of Mn contents providing a pathway to fine-tune the Mn content and particle morphology for optimal electrochemical performance.
Sustainability spotlightThe importance of scarcity, cost, and environmental impact of battery materials urge us to reconsider the synthesis procedure and cathode compositions to enhance sustainability. In this regard, LiMnxFe1−xPO4 (LMFP) cathode is emphasized in this work due to its sustainable and low-cost raw materials as well as excellent capacity retention and thermal safety. LMFP cathode utilizes Mn and Fe as a major component, which are inexpensive and earth-abundant compared to the heavily used Ni and Co in commercial lithium-ion batteries. In addition, our synthesis procedure offers a scalable, ammonia-free approach, which can promote an environmentally benign manufacturing of LMFP. Overall, the work is well-aligned with the goal of UN's Sustainable Development Goals (https://sdgs.un.org/goals) in terms of affordability and a cleaner environment. |
1 Introduction
Lithium-ion batteries (LIBs) have improved our life quality since their first commercialization in 1991.1,2 They are widely utilized in portable electronics, electronic vehicles (EV), and stationary energy storage. Among the different components in LIBs, cathode materials are an important factor in determining the overall cost and energy density of the battery.3–9 The increasing demand for high-energy and low-cost LIBs for EV applications necessitates the development of improved cathode materials. Although layered oxide cathodes such as LiNi1–x-yMnxCoyO2 can provide high specific capacity, they suffer from bulk and surface instabilities, which lead to poor cycle life and thermal stability.10–13 Moreover, these layered oxide cathodes usually contain large amounts of Ni and/or Co, which increases their cost and environmental impact.14–16In this regard, LiFePO4 (LFP) is being recently revisited due to its excellent capacity retention, sustainable and low-cost raw materials, and high thermal stability.17–20 However, the low energy density of LFP compared to layered oxide cathodes makes it challenging to fulfill the demanding performance requirements of EVs.18,21–23 By partially substituting Mn2+ for the Fe2+ to form LiMnxFe1−xPO4 (LMFP), the energy density can be enhanced due to the higher operating voltage of Mn2+/3+ redox (∼4.0 V) compared to Fe2+/3+ redox (∼3.4 V).24–26 While LMFP can theoretically provide a 10–20% improvement in energy density compared to LFP, such improvement is difficult to achieve in practice due to the kinetic limitations of Mn2+/3+ redox, which results in low practical capacity with high Mn contents (>50%). These kinetic limitations arise from the Jahn–Teller distortion of the Mn3+ ion, which leads to increased lattice strain and worsened Li+ diffusion kinetics.
Multiple approaches have been pursued to overcome the kinetic limitations of Mn2+/3+ redox in LMFP, including cation doping, surface coating, and morphology engineering.27–33 Doping with electrochemically inactive elements, such as Mg and Co, has been shown to reduce the lattice strain arising from the Jahn–Teller distortion of Mn3+ and increase the solid-solution behavior, which improves the diffusion kinetics.34–36 Surface coating with higher valence ions, such as V3+, is also a common method to improve the performance of LMFP; this forms an amorphous layer with three-dimensional diffusion channels, which promotes a rapid diffusion of Li+ ions across the LMFP surface.37–39 Controlling the particle morphology and ensuring a uniform mixing of Mn and Fe at the atomic level are also critical for mitigating the kinetic limitations of Mn2+/3+ redox.29,40–42
The primary particle size and morphology both impact the Li+ diffusion path length in LMFP since diffusion occurs primarily along the b-axis of the crystal lattice.18,23,24 While reducing the primary particle size of LMFP to <100 nm can greatly improve the diffusion kinetics, this generally results in a low tap density of the LMFP powder, which translates to a low press density of the electrode, thus reducing the cell-level energy density. Ensuring uniform mixing of Mn and Fe is also critical, as a non-uniform distribution would form Mn-rich regions that experience more severe kinetic limitations.29,41,43,44 Overall, the synthesis process plays a critical role in determining the performance of LMFP cathodes.
In particular, the industrial scalability and ease of synthesizing different compositions make the co-precipitation reaction stand out among other methods for LMFP synthesis. Based on previous studies, one of the most common precursors for LMFP is the (Mn1−xFex)3(PO4)2·xH2O phase, which forms by reacting MnSO4·H2O, FeSO4·7H2O, and H3PO4 or NH4H2PO4 at pH 7 in NH4OH solution. Different Mn:Fe ratios such as 50:50, 60:40, and 80:20 have been examined.30,38,45,46 While the electrochemical performance of LMFP synthesized from this precursor is promising, the tap density is typically low (≤0.8 g mL−1) and the co-precipitation reaction generates large amounts of ammonia-containing wastewater. Another precursor that has been reported is Mn0.7Fe0.3C2O4·2H2O, which yields even lower tap density than (Mn1−xFex)3(PO4)2·xH2O phase.47 Additionally, this precursor typically requires the use of NH4H2PO4, which generates large amounts of ammonia gas during heat treatment and impacts the environment.
Herein, we introduce a scalable, ammonia-free co-precipitation process for the synthesis of LMFP with a novel precursor phase: (Mn, Fe)5(PO4)2(HPO4)2·4H2O (MFP). We investigate the impact of reaction parameters, including the type of base solution, pH, temperature, and Mn:Fe ratio, on the morphology and phase purity of the resulting precursor. The crystal structure and morphology of the precursors are analyzed with X-ray powder diffraction (XRD) and scanning electron microscopy (SEM), while the phase purity is quantitatively determined with thermogravimetric analysis (TGA). The LMFP cathodes are synthesized with the MFP precursors by a simple process of ball milling, spray drying, and heat treatment. The electrochemical performances of the LMFP cathodes with different Mn:Fe ratios are examined by rate capability testing, cycle life testing, electrochemical impedance spectroscopy (EIS), and galvanostatic intermittent titration technique (GITT). Altogether, the work introduces an industrially scalable and ammonia-free method to synthesize air-stable precursors for LMFP cathodes with uniform mixing and adjustable Mn:Fe ratio. The optimal amount of Mn is also suggested to achieve optimal performances.
2 Experimental
2.1 Materials preparation
All precursors were prepared based on a conventional co-precipitation reaction. Initially, the precursor phase was targeted as (Mn, Fe)3(PO4)2. Three solutions were prepared as follows: (1) a transition-metal solution consisting of 0.15 mol MnSO4·H2O (Thermo Scientific), 0.10 mol FeSO4·7H2O (Thermo Scientific), and 0.167 mol H3PO4 (Sigma-Aldrich, ≥85 wt% in H2O) in 250 mL aqueous solution, (2) a concentrated base solution of 0.5 mol in 100 mL of either NH4OH or KOH or NaOH, and (3) a precipitation solution of 0.0167 mol NH4OH or KOH or NaOH in 350 mL aqueous solution. The transition-metal solution was slowly dropped into the precipitation solution with a peristaltic pump at a constant feed rate of 5 rpm under an N2 atmosphere. The pH was precisely controlled by the addition of the base solution at a constant feed rate of 2 rpm. The reaction condition was maintained at a temperature of 60 °C and a pH of ∼6–8 with a stirring speed of 450 rpm where the pH was measured with a pH meter (Pinnacle series 313P pH/Temp.). Since a pure (Mn, Fe)3(PO4)2 phase could not be obtained based on the XRD data, the synthesis parameters were modified accordingly to aim for (Mn, Fe)5(PO4)2(HPO4)2·4H2O phase. Similar to the aforementioned procedure, the transition metal solution with a stoichiometric ratio of 0.10 mol or 0.15 mol or 0.20 mol MnSO4·H2O, 0.15 mol or 0.10 mol or 0.05 mol FeSO4·7H2O, and 0.20 mol H3PO4 in 250 mL aqueous solution were dropped into the precipitated solution composed of 0.02 mol H3PO4 and 0.02 mol NaOH in 350 mL aqueous solution at a constant feed rate of 5 rpm. Here, a small amount of ascorbic acid (0.001 mol) was added to the transition metal solution to prevent the oxidation of Fe2+ to Fe3+. The pH was controlled by adding the base solution of 0.5 mol NaOH in 100 mL aqueous solution at a constant feed rate of 1.5 rpm. The reaction condition was maintained at a temperature of 60–75 °C and a pH of ∼4–5 with a stirring speed of 450 rpm. The obtained precipitate was filtered and washed thoroughly with deionized water before being dried in an oven in air at 100 °C overnight.The precursor was then homogenously mixed with carbon sources (lactose (ChemCenter):maltodextrin (Sigma-Aldrich):vapor grown carbon fiber (VGCF) in a ratio of 0.65:0.10:0.25 wt% carbon where the total carbon content is 3.5 wt%), Li source (Li2CO3, MP Biomedicals, 6 mol% excess), and P and Li sources (Li3PO4, Thermo Scientific) stoichiometrically to obtain LiMnxFe1−xPO4 (x = 0.4, 0.6, and 0.8). Carboxymethyl cellulose (CMC) (1.5 wt% in water) was employed as a dispersant. 3 mol% V, 1 mol% Co, 2 mol% Mg were added as dopants with, respectively, NH4VO3 (Acros Organics), Co(C2O4)2·2H2O (Acros Organics), and MgC2O4·2H2O (Alfa Aesar). To be specific, a mixture of 0.84 g lactose, 0.21 g maltodextrin, 0.11 g VGCF, 0.40 g 1.5 wt% CMC, 0.61 g Li2CO3, 2.74 g Li3PO4, ∼10 g MFP precursor, 0.25 g NH4VO3, 0.11 g Co(C2O4)2·2H2O, and 0.22 g MgC2O4·2H2O were prepared in 26 g deionized water. All reactants were milled together at 500 rpm for 2 h in a planetary ball mill (FRITSCH Pulverisette 6) with a media size of 5 mm. The solid loading of slurry before the spray-drying process (LABFREEZ SD-501) was maintained to 35 wt%. The as-prepared slurry was then pumped into the gun at a pumping rate of 2 rpm during the spray-drying process. The inlet temperature, outlet temperature, air flow rate, and nozzle pressure were, respectively, kept at 130 °C, 102 °C, 18 cfm, and 0.16 MPa. The nozzle size is 0.7 mm. The collected powder was sintered at 350 °C for 1 h and followed by 650 °C for 2 h under an argon atmosphere with a ramping rate of 10 °C min−1 to obtain the LMFP cathode. Then, the LMFP cathode was passivated for 30 min in 10% air at room temperature (RT) to slowly expose the carbon coating to air, helping create a thin uniform oxidation product on the outermost carbon coating.
2.2 Materials characterization
XRD (Rigaku Miniflex 600, Cu Kα target, λ = 1.54 Å) and SEM (Tescan Vega3) coupled with energy-dispersive X-ray spectroscopy (EDS, Bruker XFlash Detector 630M) were conducted to observe the structural and morphological information of the as-prepared precursors and LMFP cathodes. The XRD patterns were collected at 2θ = 5–80° with a step size of 0.02° and scan rate of 1.5° min−1. FullProf Suite software was employed to determine the structural information of the LMFP cathodes with respect to the reference pattern of COD# 2300354. The phase purity of the precursors was confirmed by TGA (Netzsch STA 449 F3) under argon atmosphere with a temperature range of 40 °C to 700 °C and ramping rate of 5 °C min−1 in an alumina crucible. Meanwhile, the carbon content was determined by carrying out TGA over a temperature range of 30 to 700 °C under an air atmosphere, with a ramping rate of 5 °C min−1 in an alumina crucible. The decomposition of LMFP at high temperatures yields Fe2O3, Mn3(PO4)2, and Li2O byproducts. Depending on the Fe content, the resulting weight gained from the decomposition byproducts are ∼3.0, ∼2.0, and ∼1.0 wt%, respectively, for the 40:60, 60:40, and 80:20 samples. Hence, the carbon content was calculated from the weight gained minus the mass change measured from TGA (%). The elemental ratio was confirmed with inductively coupled plasma optical emission spectroscopy (ICP-OES Agilent 5800). The ICP-OES samples were prepared by dissolving the precursors in a mixture of nitric acid and hydrochloric acid in a 1:1 ratio. Then, the solutions were diluted to appropriate concentrations for ICP-OES measurement in the parts-per-million (ppm) range.
2.3 Electrochemical measurement
The LMFP electrodes with different ratios of Mn and Fe were composed of the active material, Super P:VGCF (weight ratio of 3:1), and 10 wt% polyvinylidene fluoride (PVDF) dissolved in N-methyl-2-pyrrolidone (NMP) in a weight ratio of 94:3:3. The slurry mixing was carried out with a Thinky mixer and then cast onto a carbon-coated Al foil current collector with a slurry solid loading of 40 wt%. After drying at 120 °C overnight under a vacuum atmosphere to remove excess NMP and moisture, the electrodes were calendared to ∼1.8 g cm−3 and punched into 12.7 mm diameter disks with an areal active material loading of ∼1.8 mA h cm−2. All 2032-type coin-cell assemblies were performed inside an argon-filled glove box with the LMFP cathode, Celgard 2325 separator, Li-metal anode (∼500 μm in thickness), and 60 μL electrolyte. The electrolyte was composed of 1.0 M LiPF6 dissolved in a 3:7 weight ratio of ethylene carbonate (EC)/ethyl methyl carbonate (EMC) with 2 wt% vinylene carbonate (VC). The cells were tested with a Land Battery Testing System (CT2001A) at room temperature (∼25 °C) after a 5 h rest. For the cycle performance, three formation cycles were collected at C/10 rate with the subsequent charge–discharge cycles at C/3 rate with a nominal capacity at 1C rate of 155 mA h g−1. The voltage range was 2.0–4.4 V and there was a constant voltage hold at 4.4 V at each charge cycle until the current dropped below C/50 rate. EIS data of the LMFP‖LMFP symmetric cells were collected with a Biologic VMP3 potentiostat in the frequency range of 100 mHz–500 kHz and an amplitude of 10 mV. The test was performed at the OCV state (∼0.00 V). For testing the contact resistance of these symmetric cells, 1.0 M tetraethylammonium tetrafluoroborate (Et4NBF4) in acetonitrile was employed as the electrolyte to prevent ionic diffusion and to only measure electronic conductivity. To examine the ionic conductivity, GITT was conducted after running three formation cycles at C/10 rate between 2.0 and 4.4 V with a current pulse time of 10 min followed by a rest period of 3 h. DLi+ values were calculated based on the equation below (eqn (1)) where r is the average radius of the LMFP particle (7.5 μm based on this work), τ is the current pulse time, ΔEt is the total transient voltage change during the current pulse period, and ΔEs is the change in the steady-state voltage of the electrode for the corresponding step. This equation assumes that the electrode is homogenous, the current is small with a short duration time, and the cell voltage should be linear with (duration time)1/2.48,49 | (1) |
3 Results and discussion
3.1 Synthesis of precursors with different base solutions
Initially, the (Mn, Fe)3(PO4)2 phase was targeted during the co-precipitation reaction with various base solutions including NH4OH, KOH, and NaOH in order to down-select the most suitable reaction conditions. According to previous research, an appropriate pH to form this phase is ∼7.46,50 Therefore, all three reactions were controlled at a pH of 6–7, 60 °C, and a stirring rate of 450 rpm with a target Mn:Fe ratio of 60:40. A high temperature of 60 °C was selected to facilitate the co-precipitation of Mn and Fe, since if the reaction was run at room temperature and a pH of ∼6, the pure Fe3(PO4)2 was kinetically more favored.51,52 The SEM images of the precursors precipitated with each base solution (Fig. S1a–c†) show significant differences in particle morphology. While NH4OH solution gives plate-like particles, KOH and NaOH solutions, respectively, form very fine spherical particles and block-like particles. However, with the corresponding reaction parameters, pure (Mn, Fe)3(PO4)2 phase could not be obtained as indicated by the XRD (Fig. S1d and e†). Although it may be possible to optimize the synthesis parameters to achieve a pure (Mn, Fe)3(PO4)2 phase, approaches to obtain alternative precursor phases is also attractive; this is because the (Mn, Fe)3(PO4)2 phase is prone to oxidize in air and form a thin platelet particle morphology, which can reduce the tap density of the resulting LMFP cathode. Additionally, residual potassium impurities (from KOH) were found to be difficult to wash from the precursor after co-precipitation; also, NH4OH is unattractive for large-scale manufacturing due to its toxicity. Thus, a NaOH base solution was selected for further investigation to form the MFP phase for LMFP synthesis.
3.2 MFP precursors in NaOH with different synthesis conditions
Co-precipitation reactions involve various parameters to control the particle morphology, structure, and uniformity of the final product, such as pH, temperature, reaction time, stirring speed, concentration of the reactants, and an addition of a chelating agent.41,43,44,46 To gain insight into the impact of synthesis conditions on the formation of MFP precursors, the pH, temperature, and addition of chelating agent were explored during the co-precipitation reaction. First, the reactions were conducted at different pH from 4 to 7 at a constant reaction temperature of 60 °C and a stirring speed of 450 rpm. The findings suggest the particle morphology and uniformity of Mn and Fe atomic-scale mixing are heavily dependent on the pH of the reaction. In Fig. 1a, c, S2–S5,† samples prepared at pH = 4 and 5 show a pure MFP phase with a homogenous distribution of all elements based on the EDS mapping. However, Fe tends not to be entirely involved in the final product for the pH = 4 sample as the Fe ratio is slightly off by ∼7% according to ICP-OES analysis (Table S1†). Meanwhile, pH > 5 displays the formation of Fe3(PO4)2·8H2O phase and segregated Fe region across the samples under EDS mapping (red dotted circles). The Fe3(PO4)2·8H2O phase seems to have a distinct morphology compared to the MFP phase, which consists of plate-like particles. In contrast to a pH of 6, a pH of 7 shows no MFP phase and contains more platelets with lower crystallinity than the other pH values. Here, it can be deduced that the MFP phase prefers an acidic reaction condition. Therefore, pH of 5 was selected to study further the effects of chelating agents. Citric acid (CA) can act as a chelating agent in this case since it tends to coordinate with Fe.53,54 Although the particle morphology is more spherical with CA (Fig. 1b), there is not much difference when compared to a pH of 5 without CA. This may relate to the block-like and dense morphology of MFP particles that are difficult to aggregate together. Although the addition of CA does not impact the formation of the MFP phase (Fig. 1d), CA forms Fe complexes and reduces the amount of Fe ratio in the final product (∼10% lower) as verified by ICP-OES (Table S1†).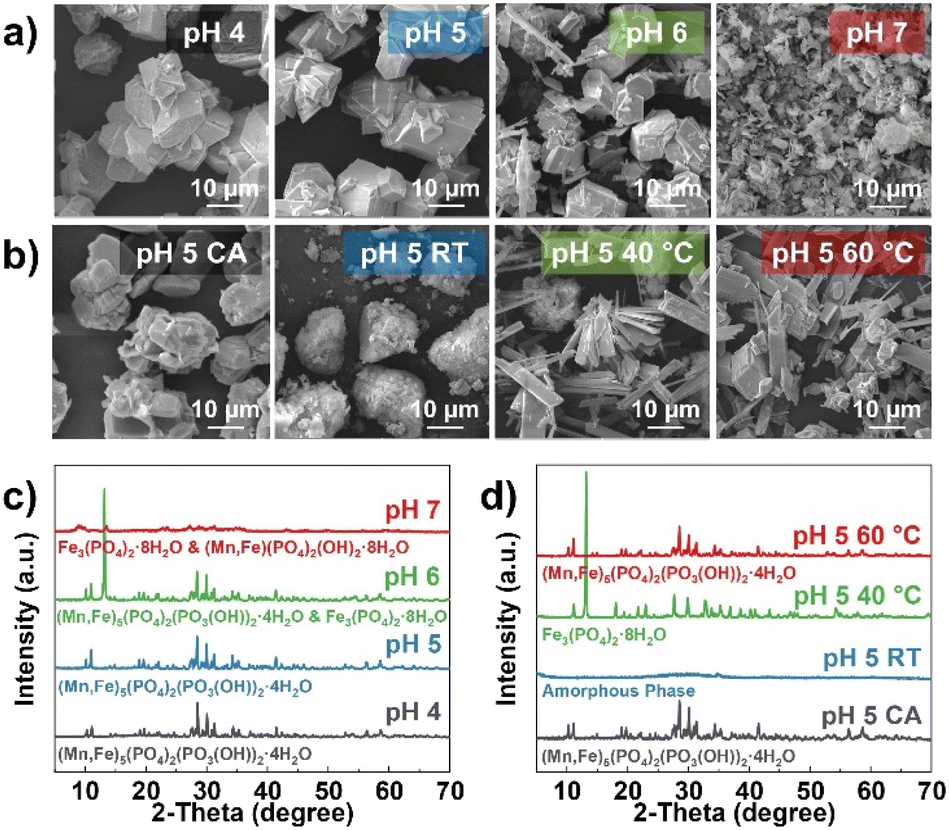 | ||
| Fig. 1 Morphological and structural analysis of the MFP precursors obtained with the co-precipitation reaction with an Mn to Fe ratio of 60:40. SEM images of the MFP precursors with (a) different pH values and (b) citric acid and different temperatures. XRD patterns of the MFP precursors with (c) different pH values and (d) citric acid and different temperatures. | ||
Different reaction temperatures and solution-feeding rates were investigated. By doubling the feeding rate of the reactants from 5 to 10 rpm, the morphology changes from all block-like particles to a mixture of some flake-like particles at 60 °C. When the temperature decreases to room temperature and 40 °C, pure MFP phase could not be obtained as indicated by XRD. This implies that a slow feeding rate and high temperature are necessary for the formation of the MFP phase, completion of the co-precipitation reaction between Mn and Fe, and a homogenous particle distribution. Based on this, it implies that Fe3(PO4)2 is preferable to precipitate rather than MFP at this condition. The SEM-EDS mapping (Fig. S6–S8†) of these samples shows a homogenous mixing of all elements except for at 40 °C.
TGA was conducted to confirm the phase purity of the as-prepared precursors, based on the mass change during thermal decomposition. Fig. 2a–f shows the TGA profiles of the precursors synthesized at different conditions. By comparing the XRD patterns (Fig. 1c and d), each phase has a distinct TGA profile, where the onset temperature is also different depending on the phase presented. Regarding this, TGA can also be applied as a simple and useful tool to verify the phase purity of precursors. For the MFP phase, two characteristic temperatures can be observed at ∼260 °C and ∼324 °C with a mass change of ∼13%. This corresponds to the following decomposition reactions due to the removal of a total of five water molecules where reaction (1) happens at a lower onset temperature than reaction (2).
| (Mn, Fe)5(PO4)2(HPO4)2(H2O)4 (728.73 g mol−1) → (Mn, Fe)5(PO4)2(HPO4)2 + 4H2O | (1) |
| (Mn, Fe)5(PO4)2(HPO4)2 (656.73 g mol−1) → (Mn, Fe)5(PO4)2 (P2O7) (638.73 g mol−1) + H2O | (2) |
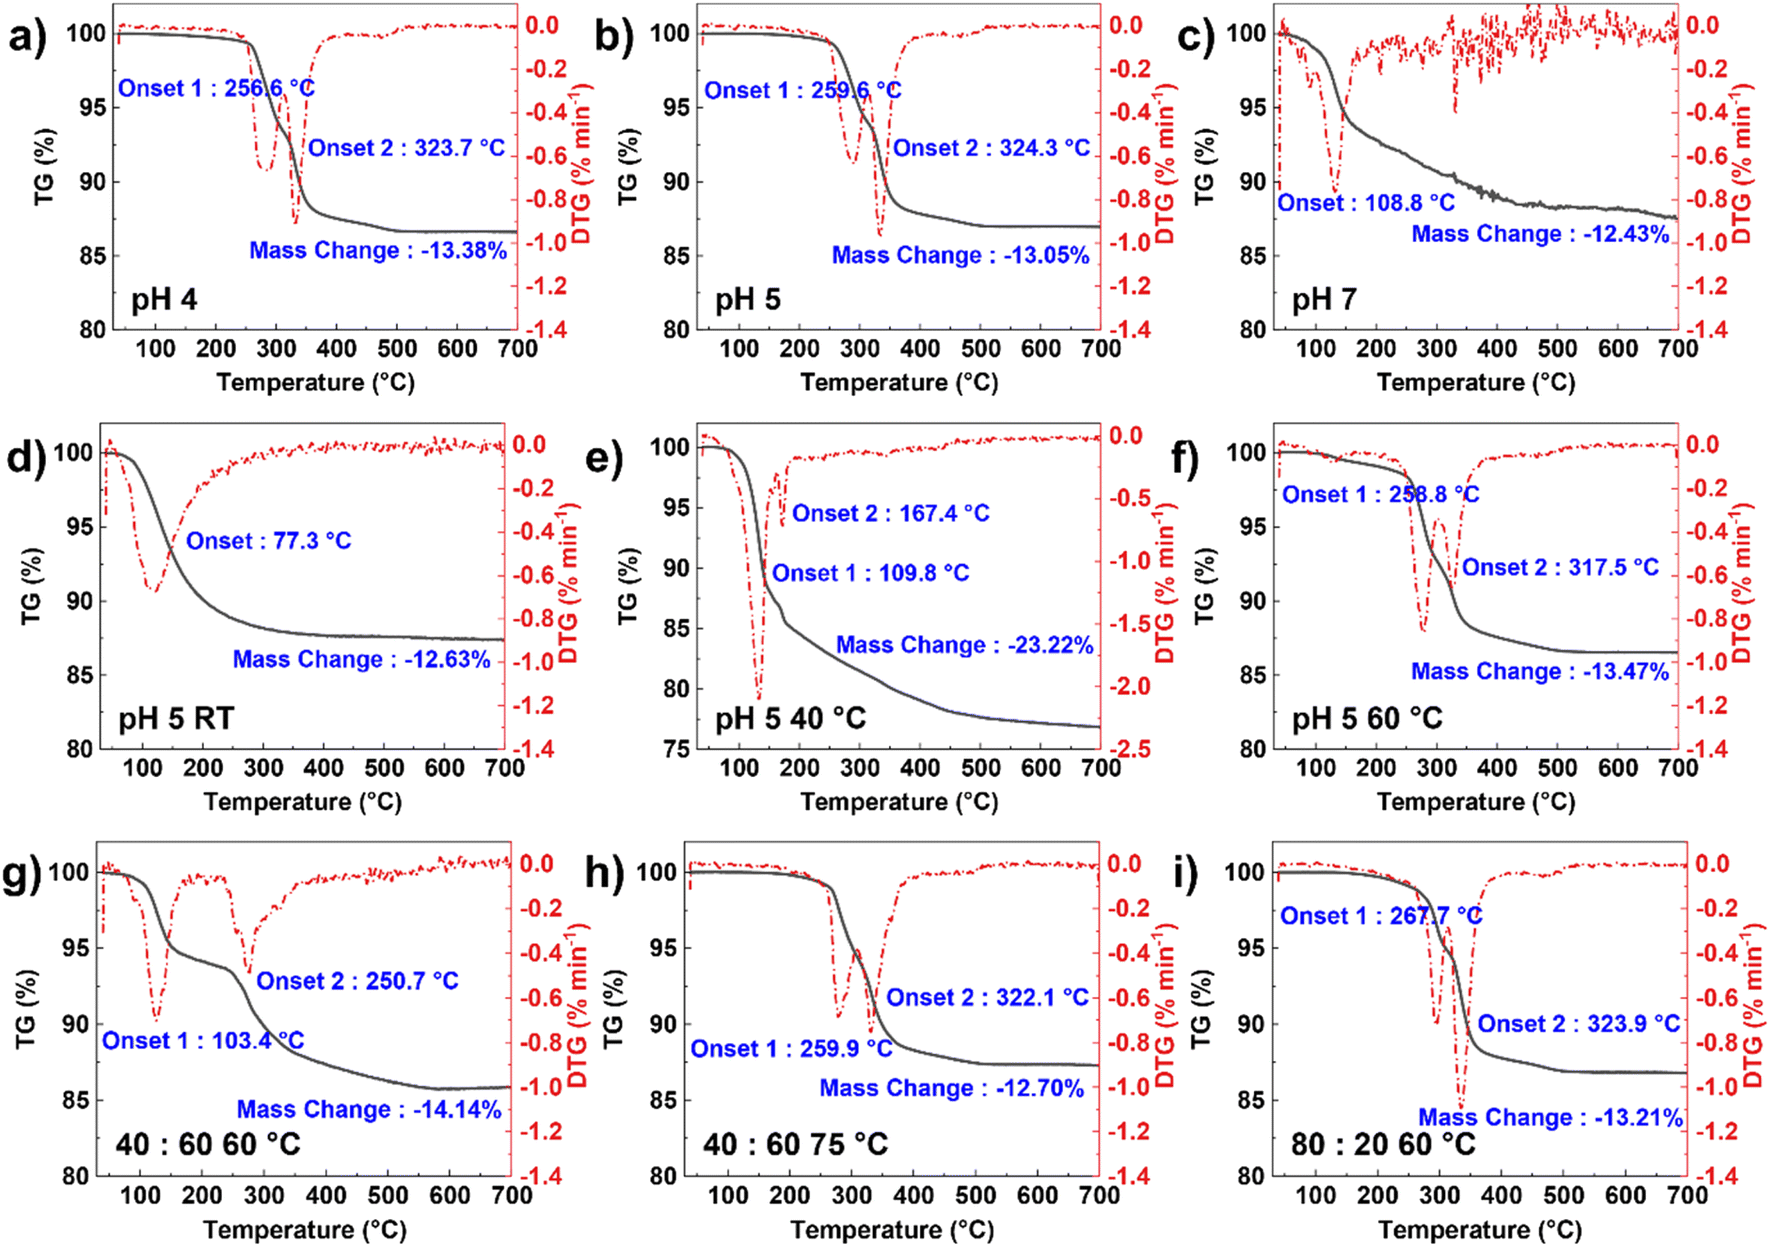 | ||
| Fig. 2 DSC profiles of the MFP precursors synthesized at different reaction conditions, indicating the onset decomposition temperature and the mass change for (a–c) different pH values, (d–f) different reaction temperatures, and (g–i) different Mn to Fe ratios. | ||
Both the pH of 4 and 5 samples show a consistent result of mass change, confirming the formation of pure MFP phase. Meanwhile, the other reaction conditions have much different thermal decomposition reactions and onset temperatures, indicating the presence of other phases, such as Fe3(PO4)2.
3.3 MFP precursors and LMFP cathodes with different transition metal ratios
To observe the performance of the as-prepared MFP precursor, LMFP cathodes were synthesized via a spray-drying process followed by a solid-state reaction. The synthesis process is outlined in Fig. 3a. The precursors with different Mn:Fe ratios were successfully prepared by the co-precipitation reaction at a pH of 5 in NaOH solution, including an Mn:Fe ratio of 40:60, 60:40, and 80:20. Fig. 3b shows the morphology of the as-prepared precursors with block-like particles where a greater amount of Mn has a smaller primary particle size where the particle size is between 5 and 12 μm. Results suggest that Mn content can impact the particle nucleation and growth, where increasing the Mn amount favors the nucleation of new crystalline facets or planes rather than growing from the same particle or direction (high surface energy).55–57 Both the 60:40 and 80:20 samples were synthesized at 60 °C while the temperature for the 40:60 sample was adjusted to 75 °C. At 60 °C, not all Mn reacts to form the precipitates and the higher amount of Fe ratio makes the Fe3(PO4)2 formation even more favorable as shown in Fig. S9a.† The distribution between Mn and Fe across the particles is also nonuniform (Fig. S9b†). This suggests that the reaction temperature needs to increase to promote co-precipitation with higher Fe contents. All the precursors with different ratios could be indexed to the pure MFP phase with a uniform distribution of Mn and Fe (Fig. 3e and S10†). The TGA profiles in Fig. 2g–i also further verify the formation of pure MFP phase according to the decomposition reactions described in reactions (1) and (2), except for Mn:Fe = 40:60 sample at 60 °C.
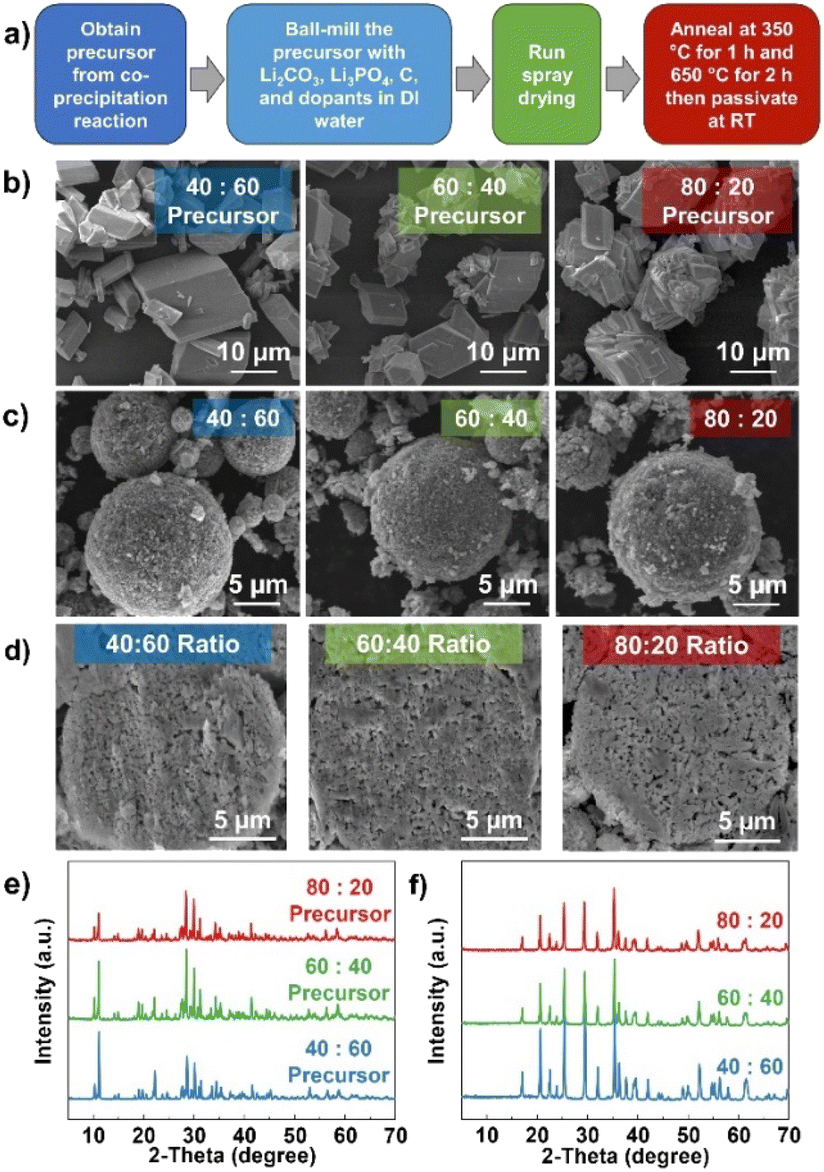 | ||
| Fig. 3 Morphological and structural analysis of the MFP precursors and LMFP cathodes obtained with the co-precipitation reaction with different Mn to Fe ratios: (a) Overview of the synthesis process of MFP precursors to LMFP cathodes, SEM images of (b) the precursors and (c) the LMFP cathodes, and (d) cross-sectional view of LMFP particles. The XRD patterns of (e) the MFP precursors and (f) LMFP cathodes. | ||
After ball-milling the MFP precursors to nm-size particles, spherical particles were formed with a spray-drying process.58 During this process, the injected slurry was sprayed through a small nozzle to form small droplets. Then, these droplets were rapidly dried with heated air into solid powder under specific temperature and pressure, as described in the experimental section. It is worth noting that the synthesis parameters during spray drying, such as slurry viscosity, temperature, and pressure, play an important role in determining the characteristics of the final product. The morphologies of the LMFP cathodes after the spray drying and calcination processes are shown in Fig. 3c. The average secondary particle size is ∼6–10 μm with a homogenous distribution of all expected elements (Fig. S11–S13†). All the samples also display some amount of carbon coating on the particle surface. The ball-milling process reduces the MFP precursor (regardless of its initial particle size and morphology) to nanoparticles with a size of ∼100 nm. From the cross-sectional images (Fig. 3d), the 80:20 sample reveals slightly higher voids within the secondary particle due to the larger particle size of the 80:20 precursor. This can lead to a greater variation in particle size after the ball-milling process. It is worth noting that the tap density of all samples is ∼1.0 g mL−1, which is considered to be higher than other phases synthesized via co-precipitation route. From the TGA profile in Fig. S14,† the amounts of carbon content are 2.89, 2.80, and 2.19%, respectively, for the 40:60, 60:40, and 80:20 samples. These comparable amounts of carbon content allow for a fair comparison of the electrochemical performance. Although 3.5 wt% carbon was targeted for all samples, there might exist a small variation in carbon content in the final product depending on the particle morphology and reproducibility of the spray-drying process in each run.
The XRD patterns of all the samples (Fig. 3f) confirm the phase purity of the LMFP cathodes. To see the impact of different Mn:Fe ratios on the lattice parameters of LMFP cathodes, the Rietveld refinement was performed and the refined results are presented in Table 2. The corresponding refinement profiles and crystallographic information are shown in Fig. S15, Tables S2 and S3.† With the increasing amount of Mn content, the lattice parameters and volume increase due to the larger ionic radius of Mn2+ (81 pm) compared to Fe2+ (76 pm). Furthermore, the elemental ratios in all the synthesized MFP precursors and LMFP cathodes are close to the targeted values as shown in Table 1.
| Sample | Li | Mn | Fe | P |
|---|---|---|---|---|
| Target ratio | 1.00 | 0.40–0.80 | 0.20–0.60 | 0.80 for MFP precursors |
| 1.00 for LMFP cathodes | ||||
| FePO4 (reference) | — | 0.001 | 0.999 | 1.055 |
| MFP-40:60 |
— | 0.434 | 0.566 | 0.825 |
| MFP-60:40 |
— | 0.620 | 0.380 | 0.828 |
| MFP-80:20 |
— | 0.836 | 0.164 | 0.797 |
| LMFP-40:60 |
1.080 | 0.432 | 0.568 | 1.163 |
| LMFP-60:40 |
1.060 | 0.621 | 0.379 | 1.098 |
| LMFP-80:20 |
1.055 | 0.827 | 0.173 | 1.097 |
| Sample | a (Å) | b (Å) | c (Å) | Cell volume (Å3) | χ 2 | R wp (%) |
|---|---|---|---|---|---|---|
| 40:60 |
10.371 | 6.041 | 4.716 | 295.449 | 1.94 | 10.1 |
| 60:40 |
10.390 | 6.058 | 4.724 | 297.330 | 1.88 | 10.2 |
| 80:20 |
10.411 | 6.075 | 4.732 | 299.244 | 1.43 | 13.5 |
3.4 Electrochemical performance of as-prepared LMFP cathodes with different transition metal ratios
Prior to the electrochemical testing of LMFP electrodes, LMFP‖LMFP symmetric cells were assembled to examine the efficiency of carbon coating. With tetraethylammonium tetrafluoroborate (Et4NBF4) in acetonitrile as an electrolyte, this allows a direct measurement of electronic conductivity by preventing Li-ion diffusion in and out of the electrode.59 All samples display a low contact resistance and good electronic conductivity as can be confirmed, respectively, with a small semicircle at the high-frequency region and a steep, constant-phase element at the low-frequency region (Fig. 4a). In addition, three different packing densities of 60:40 electrodes were initially examined to find the optimal parameter. From Fig. S16,† a packing density below 1.8 g cm−3 is preferable since over-calendaring of the electrodes can hinder the Li-ion diffusion pathway in these porous secondary particles. The first charge–discharge profile in Fig. 4b shows two distinct voltage plateaus, respectively, corresponding to Fe2+/Fe3+redox couple at ∼3.5 V and Mn2+/Mn3+ redox couple at ∼4.1 V. The ratio between these two plateaus occurs with respect to the amount of Mn and Fe presented in the samples.
 | ||
| Fig. 4 Electrochemical performances of the LMFP cathodes with different Mn to Fe ratios: (a) EIS data of the LMFP‖LMFP symmetric cells to examine the electronic conductivity, (b) charge–discharge profiles of the first cycle at C/10, and (c) rate performances from C/10 to 5C rate, (d) cycle performances at C/3 rate for 200 cycles, and (e) their corresponding coulombic efficiencies. For all the above experiments, the potential range is between 2.0 and 4.4 V with a nominal capacity at a 1C rate of 155 mA h g−1. | ||
It is worth noting that Mn contents of ≥60 wt% have a downside on the specific capacity. This can relate to the Jahn–Teller effect of Mn3+ and sluggish redox kinetics of Mn that makes the full utilization of Mn redox challenging.60,61 In particular, the sluggish Mn2+/3+ redox kinetics of LMFP with high Mn content is caused primarily by the Jahn–Teller distortion of Mn3+, which results in a large anisotropic lattice strain between the LixMnxFe1−xPO4 and MnxFe1−xPO4 phases.34,62 In contrast, Fe3+ does not experience Jahn–Teller distortion, so the Fe2+/3+ redox kinetics in LMFP is rapid. Moreover, Mn2+/3+ redox occurs through a two-phase reaction in LMFP with Mn ≥ 40%.63 This two-phase reaction limits Li+ diffusion during Mn2+/3+ redox to the phase boundary between LixMnxFe1−xPO4 and MnxFe1−xPO4, whereas Li+ diffusion occurs throughout the bulk of the olivine phase during Fe2+/3+ redox. The large lattice strain along the phase boundary during the two-phase reaction thereby impedes Li+ diffusion during Mn2+/3+ redox.
As a result, the rate performance of 80:20 sample (Fig. 4c) is the lowest when compared to 40:60 and 60:40 samples. Based on the data, the volumetric capacity of the LMFP samples in this study is 265, 234, and 221 mA h cm−3, respectively, for the 40:60, 60:40, and 80:20 samples. In contrast, the value for commercial LFP is ∼320–360 mA h cm−3, depending on the synthesis and preparation processes.27,64 This is because LFP usually has a higher press density than LMFP. As the particle morphologies of the LMFP cathodes reported in most studies have a high porosity and surface area, this results in a low tap density. Hence, the low press density remains a challenge for LMFP and an optimal synthesis procedure is still needed in future studies. Meanwhile, if the specific energy density is being considered, LMFP can outperform LFP as Mn has a higher operating voltage (∼4.0 V) than Fe (∼3.4 V).
The cycle performances for different Mn ratios were analyzed in a half-cell configuration. From Fig. 4d and e, both the 40:60 and 60:40 samples show a decent cycle performance even after 150 cycles with a capacity retention of ∼100% compared to 80:20 sample (95%). The charge–discharge profiles (Fig. 5a–c) and dQ/dV plots (Fig. 5d–f) after the 4th, 50th, 100th, and 150th cycles provide a clearer comparison in terms of the decrease in discharge voltage and specific capacity as the Mn content increases, indicating a greater cell polarization. The polarization growth is further confirmed by the large change in the charge and discharge voltages as the number of cycles increases (Fig. 5g) and thus, reduces the energy efficiency.
 | ||
| Fig. 5 Degradation profiles of the LMFP cathodes with different Mn to Fe ratios: (a) charge–discharge profiles at 4th, 100th, and 200th cycles for (b) 40:60, (d) 60:40, and (c) 80:20 samples. dQ/dV plots at the 4th, 50th, 100th, and 150th cycles for (d) 40:60, (e) 60:40, and (f) 80:20 samples, (g) the voltage plot during the charge (circle) and discharge cycle (triangle), and (h) comparison of the specific energy density among samples. For all the above experiments, the potential range is between 2.0 and 4.4 V with a nominal capacity at a 1C rate of 155 mA h g−1. | ||
Although Mn can increase the operating voltage window compared to the LFP cathode, too high Mn content does not make a valuable improvement on the overall LMFP performance, which can be supported by the energy density plot in Fig. 5h. Furthermore, the GITT technique was applied to examine the effect of Mn content on Li-ion diffusion as shown in Fig. 6. With a current pulse time of 10 min, followed by a rest period of 3 h, the GITT profiles in Fig. 6a–c prove that a high Mn content leads to a more sluggish kinetics of Li-ion diffusion compared to low Mn content, especially towards the end of the charging step. This can be seen from the extent of voltage drop during the rest period. Due to the nature of the LFP and LMFP cathodes that can undergo two-phase reaction rather than solid-solution behavior like in layered oxide cathodes, it is difficult to see abrupt changes and obtain quantitative results from the GITT analysis. Thus, the Li-ion diffusion coefficient is not reported in this work.
 | ||
| Fig. 6 GITT profiles of the LMFP cathodes with different Mn to Fe ratios for the (a) 40:60, (b) 60:40, and (c) 80:20 samples. | ||
4 Conclusions
In summary, this work presents a novel precursor phase (Mn, Fe)5(PO4)2(HPO4)2·4H2O for LMFP synthesis without involving ammonia, which can enable a low-cost, sustainable, scalable production of LMFP cathode materials with reduced environmental impact. Our results suggest that the reaction conditions, such as pH, type of base solutions, and temperature play a vital role in the phase purity and atomic scale mixing between Mn and Fe. The optimal conditions to obtain the pure MFP phase are at pH = 5 and 60 °C with NaOH as the base solution. Reaction temperatures below 60 °C or pH > 5 can lead to the formation of Fe3(PO4)2·8H2O phase as this phase is kinetically favored compared to Mn precipitation. From this method, phases-pure MFP precursors with Mn:Fe ratios ranging from 40:60 to 80:20 can be prepared by carefully controlling the reaction conditions. The MFP precursor reported here is advantageous for commercial production compared to previously reported precursors for LMFP, due to the ammonia-free synthesis and improved air stability of the precursor. The improved particle morphology of the MFP precursor also leads to a higher tap density LMFP cathode, which improves the volumetric capacity of the battery.
After the spray-drying and calcination processes, the LMFP cathodes from these precursors show a consistent electrochemical performance in half cells with capacity retentions of ≥95% after 150 cycles at a C/3 rate. Based on the electrochemical analysis, the 80:20 sample shows the worst performance due to the high content of Mn which leads to low capacity and high polarization. Although a high amount of Mn can increase the operating voltage, the lower capacity and higher polarization due to the sluggish kinetics of Mn redox reduce the useable energy density. An optimal amount of Mn content in the LMFP cathode is required to achieve the best performance, which is between 40% and 60% based on this work. The synthesis methods presented in this work will allow for the fine tuning of the Mn:Fe ratio to obtain optimal electrochemical performance. Overall, these findings show that the reaction parameters have a great effect on the phase purity and homogeneous mixing of the as-synthesized MFP precursors and that the Mn content is a key factor in determining the electrochemical performance of the LMFP cathodes. This work also offers a scalable and ammonia-free approach to synthesize MFP precursors via a facile co-precipitation reaction, which can serve as a guideline towards a sustainable synthesis route for LMFP cathodes.
Conflicts of interest
The authors declare no conflict of interest.Acknowledgements
The financial support by Tesla, Inc. and the U.S. Department of Energy, Office of Basic Energy Sciences, Division of Materials Science and Engineering under award number DE-SC0005397 is gratefully acknowledged. The authors would like to thank Seamus Ober for his assistance in ICP-OES data collection and Seth Reed for the insightful discussions.References
- K. Mizushima, P. C. Jones, P. J. Wiseman and J. B. Goodenough, Mater. Res. Bull., 1980, 15, 783–789 CrossRef CAS.
- A. Manthiram, Nat. Commun., 2020, 11, 1550 CrossRef CAS PubMed.
- J. B. Goodenough and K. S. Park, J. Am. Chem. Soc., 2013, 135, 1167–1176 CrossRef CAS PubMed.
- E. A. Olivetti, G. Ceder, G. G. Gaustad and X. Fu, Joule, 2017, 1, 229–243 CrossRef.
- R. Schmuch, R. Wagner, G. Hörpel, T. Placke and M. Winter, Nat. Energy, 2018, 3, 267–278 CrossRef CAS.
- Y. Liu, R. Zhang, J. Wang and Y. Wang, iScience, 2021, 24, 102332 CrossRef CAS PubMed.
- J. Song, H. Wang, Y. Zuo, K. Zhang, T. Yang, Y. Yang, C. Gao, T. Chen, G. Feng, Z. Jiang, W. Xiao, T. Luo and D. Xia, Electrochem. Energy Rev., 2023, 6, 20 CrossRef CAS.
- Y. Hao, X. Li, W. Liu, J. Wang, H. Shan, W. Li, X. Liu, L. Lin, X. Wang and X. Sun, Carbon Energy, 2023, 5, e272 CrossRef CAS.
- J. Zuo, J. Wang, R. Duan, Y. Bai, K. Xu, K. Zhang, J. Wang, K. Zhang, Z. Yang, Z. Yang, M. Li, G. Cao, Q. Jiang, W. Liu, J. Wang, W. Li and X. Li, Nano Energy, 2024, 121, 109214 CrossRef CAS.
- J. R. Croy, M. Balasubramanian, K. G. Gallagher and A. K. Burrell, Acc. Chem. Res., 2015, 48, 2813–2821 CrossRef CAS PubMed.
- D. Mohanty, A. S. Sefat, J. Li, R. A. Meisner, A. J. Rondinone, E. A. Payzant, D. P. Abraham, D. L. Wood and C. Daniel, Phys. Chem. Chem. Phys., 2013, 15, 19496–19509 RSC.
- W. M. Dose, J. K. Morzy, A. Mahadevegowda, C. Ducati, C. P. Grey and M. F. L. De Volder, J. Mater. Chem. A, 2021, 9, 23582–23596 RSC.
- Y. Kim, W. M. Seong and A. Manthiram, Energy Storage Mater., 2021, 34, 250–259 CrossRef.
- S. Lee and A. Manthiram, ACS Energy Lett., 2022, 7, 3058–3063 CrossRef CAS.
- J. R. Croy, B. R. Long and M. Balasubramanian, J. Power Sources, 2019, 440, 227113 CrossRef CAS.
- H. Li, M. Cormier, N. Zhang, J. Inglis, J. Li and J. R. Dahn, J. Electrochem. Soc., 2019, 166, A429–A439 CrossRef CAS.
- A. Yamada, S. C. Chung and K. Hinokuma, J. Electrochem. Soc., 2001, 148, A224 CrossRef CAS.
- S. Y. Chung, J. T. Bloking and Y. M. Chiang, Nat. Mater., 2002, 1, 123–128 CrossRef CAS PubMed.
- W. J. Zhang, J. Power Sources, 2011, 196, 2962–2970 CrossRef CAS.
- A. K. Padhi, K. S. Nanjundaswamy and J. B. Goodenough, J. Electrochem. Soc., 1997, 144, 1188–1194 CrossRef CAS.
- X. Zhang, M. Van Hulzen, D. P. Singh, A. Brownrigg, J. P. Wright, N. H. Van Dijk and M. Wagemaker, Nano Lett., 2014, 14, 2279–2285 CrossRef CAS PubMed.
- R. Malik, F. Zhou and G. Ceder, Nat. Mater., 2011, 10, 587–590 CrossRef CAS PubMed.
- L. Hong, L. Li, Y. K. Chen-Wiegart, J. Wang, K. Xiang, L. Gan, W. Li, F. Meng, F. Wang, J. Wang, Y. M. Chiang, S. Jin and M. Tang, Nat. Commun., 2017, 8, 1194 CrossRef PubMed.
- L. Yang, W. Deng, W. Xu, Y. Tian, A. Wang, B. Wang, G. Zou, H. Hou, W. Deng and X. Ji, J. Mater. Chem. A, 2021, 9, 14214–14232 RSC.
- T. Muraliganth and A. Manthiram, J. Phys. Chem. C, 2010, 114, 15530–15540 CrossRef CAS.
- A. M. M. Kyaw, G. Panomsuwan and R. Munprom, IOP Conf. Ser.: Mater. Sci. Eng., 2022, 1234, 012029 CAS.
- Z. Ahsan, B. Ding, Z. Cai, C. Wen, W. Yang, Y. Ma and S. Zhang, J. Electrochem. Energy Convers. Storage, 2021, 18, 010801 CrossRef CAS.
- T. Ruan, B. Wang, F. Wang, R. Song, F. Jin, Y. Zhou, D. Wang and S. Dou, Nanoscale, 2019, 11, 4073–4082 RSC.
- W. Xiang, Y. J. Zhong, J. Y. Ji, Y. Tang, H. Shen, X. D. Guo, B. H. Zhong, S. X. Dou and Z. Y. Zhang, Phys. Chem. Chem. Phys., 2015, 17, 18629–18637 RSC.
- J. Li, Y. Wang, J. Wu, H. Zhao, H. Wu, Y. Zhang and H. Liu, ChemElectroChem, 2017, 4, 175–182 CrossRef CAS.
- X. Zhang, M. Hou, A. G. Tamirate, H. Zhu, C. Wang and Y. Xia, J. Power Sources, 2020, 448, 227438 CrossRef CAS.
- E. Lyle, R. Vaeli, M. Cormier and M. Metzger, J. Electrochem. Soc., 2022, 169, 060527 CrossRef CAS.
- H. Qian, H. Ren, Y. Zhang, X. He, W. Li, J. Wang, J. Hu, H. Yang, H. M. K. Sari, Y. Chen and X. Li, Electrochem. Energy Rev., 2022, 5, 2 CrossRef CAS.
- Z. Lv, M. Li, J. Lin, J. Luo, B. Wu, R. Hong and S. C. Cao, J. Solid State Electrochem., 2024, 28, 577–587 CrossRef CAS.
- E. Téliz, M. Martínez, R. Faccio, F. Pignanelli, F. Zinola and V. Díaz, J. Electroanal. Chem., 2020, 878, 114581 CrossRef.
- H. Hu, H. Li, Y. Lei, J. Liu, X. Liu, R. Wang, J. Peng and X. Wang, J. Energy Storage, 2023, 73, 109006 CrossRef.
- M. S. Islam, D. J. Driscoll, C. A. J. Fisher and P. R. Slater, Chem. Mater., 2005, 17, 5085–5092 CrossRef CAS.
- H. Jin, J. Zhang, L. Qin, Y. Hu, H. Jiang and C. Li, Ind. Eng. Chem. Res., 2023, 62, 1029–1034 CrossRef CAS.
- T. K. Pietrzak, M. Wasiucionek, I. Gorzkowska, J. L. Nowiński and J. E. Garbarczyk, Solid State Ionics, 2013, 251, 40–46 CrossRef CAS.
- L. Yang, Y. Wang, J. Wu, M. Xiang, J. Li, B. Wang, Y. Zhang, H. Wu and H. Liu, Ceram. Int., 2017, 43, 4821–4830 CrossRef CAS.
- K. S. Park, K. T. Kang, S. B. Lee, G. Y. Kim, Y. J. Park and H. G. Kim, Mater. Res. Bull., 2004, 39, 1803–1810 CrossRef CAS.
- W. Yang, Y. Bi, Y. Qin, Y. Liu, X. Zhang, B. Yang, Q. Wu, D. Wang and S. Shi, J. Power Sources, 2015, 275, 785–791 CrossRef CAS.
- J. M. Zheng, X. B. Wu and Y. Yang, Electrochim. Acta, 2011, 56, 3071–3078 CrossRef CAS.
- D. Wang, I. Belharouak, L. H. Ortega, X. Zhang, R. Xu, D. Zhou, G. Zhou and K. Amine, J. Power Sources, 2015, 274, 451–457 CrossRef CAS.
- J. Li, M. Xiang, Y. Wang, J. Wu, H. Zhao and H. Liu, J. Mater. Chem. A, 2017, 5, 7952–7960 RSC.
- S. M. Oh, S. T. Myung, Y. S. Choi, K. H. Oh and Y. K. Sun, J. Mater. Chem., 2011, 21, 19363–19374 Search PubMed.
- Z. Tan, X. Wang and H. Zhou, Electrochim. Acta, 2013, 90, 597–603 CrossRef CAS.
- L. Su, K. Jarvis, H. Charalambous, A. Dolocan and A. Manthiram, Adv. Funct. Mater., 2023, 33, 2213675 CrossRef CAS.
- Y. Xi, X. Wang, H. Wang, M. Wang, G. Wang, J. Peng, N. Hou, X. Huang, Y. Cao, Z. Yang, D. Liu, X. Pu, G. Cao, R. Duan, W. Li, J. Wang, K. Zhang, K. Xu, J. Zhang and X. Li, Adv. Funct. Mater., 2024, 34, 2309701 CrossRef CAS.
- M. H. Lee, T. H. Kim, Y. S. Kim and H. K. Song, J. Phys. Chem. C, 2011, 115, 12255–12259 CrossRef CAS.
- T. Gao, Y. Shen, Z. Jia, G. Qiu, F. Liu, Y. Zhang, X. Feng and C. Cai, Geochem. Trans., 2015, 16, 1–14 CrossRef CAS PubMed.
- J. Vaughan, W. Hawker and D. White, ALTA 2011 Nickel-Cobalt-Copper Conf., 2011, pp. 1–12 Search PubMed.
- M. L. Escoda, F. De La Torre and V. Salvadó, Polyhedron, 1999, 18, 3269–3274 CrossRef CAS.
- A. J. Francis and C. J. Dodge, Appl. Environ. Microbiol., 1993, 59, 109–113 CrossRef CAS PubMed.
- K. D. Gilroy, H. C. Peng, X. Yang, A. Ruditskiy and Y. Xia, Chem. Commun., 2017, 53, 4530–4541 RSC.
- C. Boukouvala, J. Daniel and E. Ringe, Nano Convergence, 2021, 8, 1–15 CrossRef PubMed.
- Y. Li, H. Chen, K. Lim, H. D. Deng, J. Lim, D. Fraggedakis, P. M. Attia, S. C. Lee, N. Jin, J. Moškon, Z. Guan, W. E. Gent, J. Hong, Y. S. Yu, M. Gaberšček, M. S. Islam, M. Z. Bazant and W. C. Chueh, Nat. Mater., 2018, 17, 915–922 CrossRef CAS PubMed.
- B. G. Prajapati, V. D. Prajapati, B. Basu, P. N. Kendre, S. Mukherjee, T. Pal, M. Kundu, S. Singh, S. Bhattacharya, J. B. Dharmameher and D. C. Parikh, Methods for Nanoencapsulation, INC, 2023 Search PubMed.
- K. P. Scanlan and A. Manthiram, J. Electrochem. Soc., 2023, 170, 100515 CrossRef.
- C. Delacourt, P. Poizot, M. Morcrette, J. M. Tarascon and C. Masquelier, Chem. Mater., 2004, 16, 93–99 CrossRef CAS.
- S. Wi, J. Park, S. Lee, J. Kim, B. Gil, A. J. Yun, Y. E. Sung, B. Park and C. Kim, Nano Energy, 2017, 39, 371–379 CrossRef CAS.
- D. B. Ravnsbæk, K. Xiang, W. Xing, O. J. Borkiewicz, K. M. Wiaderek, P. Gionet, K. W. Chapman, P. J. Chupas and Y. M. Chiang, Nano Lett., 2014, 14, 1484–1491 CrossRef PubMed.
- D. B. Ravnsbæk, K. Xiang, W. Xing, O. J. Borkiewicz, K. M. Wiaderek, P. Gionet, K. W. Chapman, P. J. Chupas, M. Tang and Y. M. Chiang, Nano Lett., 2016, 16, 2375–2380 CrossRef PubMed.
- X. Wei, M. Zhang, B. Miao and R. Liu, Scr. Mater., 2021, 194, 113638 CrossRef CAS.
Footnote |
| † Electronic supplementary information (ESI) available. See DOI: https://doi.org/10.1039/d4su00125g |
| This journal is © The Royal Society of Chemistry 2024 |