 Open Access Article
Creative Commons Attribution 3.0 Unported Licence
Effect of impregnation strategy on structural characteristics of Ce–Mn/Al2O3 and its catalytic ozonation of benzoic acid†
Shengjuan Shao *a,
Ting Chengb,
Yifan Chenga and
Bingxin Chena
aDepartment of Chemistry and Chemical Engineering, Taiyuan Institute of Technology, Taiyuan, 030008, China. E-mail: shaosj_tit@163.com
bSchool of Chemistry and Chemical Engineering, North University of China, Taiyuan, Shanxi 030051, China
First published on 30th September 2024
Abstract
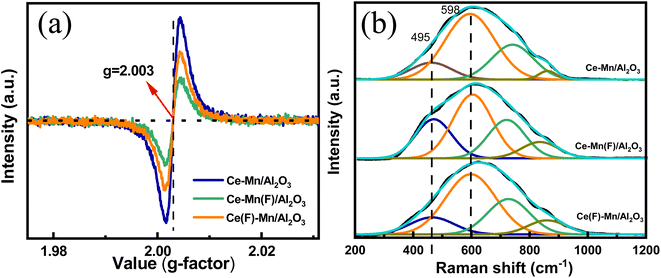
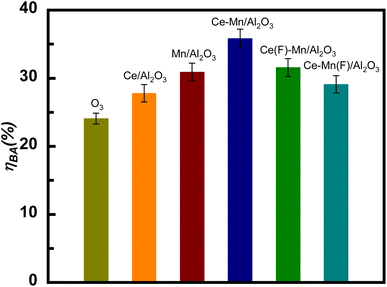
Ce–Mn binary oxides supported on Al2O3 (Ce–Mn/Al2O3), with enhanced activity and stability for catalytic ozonation of benzoic acid, were synthesized using a facile impregnation method. The competitive synergetic effects between cerium and manganese significantly influenced the structural characteristics and catalytic performance of the catalysts depending on the impregnation sequence. Catalysts prepared via the one-step impregnation process exhibited a higher concentration of homogeneous Ce3+ species on the catalyst surface. This led to an increase in surface oxygen vacancies, thereby enhancing catalytic activity. In contrast, the two-step impregnation process resulted in fewer oxygen vacancies due to reduced competitive effects between cerium and manganese. Overall, the optimized Ce–Mn/Al2O3 catalysts demonstrated improved catalytic performance in ozonation reactions, highlighting the importance of impregnation method and calcination conditions in tailoring catalyst properties for enhanced activity and stability. Oxygen vacancies play a crucial role as active sites for ozone adsorption and dissociation into *O2 and *O, facilitated by the reduction of Mn4+ to Mn3+ and the oxidation of Ce3+ to Ce4+. This process forms an electron closed loop that maintains electron balance. The synergistic interactions between cerium and manganese enable rapid electron transfer between Ce4+ and Mn3+, facilitating the regeneration of Ce3+ and Mn4+. Due to the increase of the dual redox conjugate pairs and the surface reactive oxygen species, the catalytic ozonation activity and stability of Ce–Mn/Al2O3 was enhanced.
1. Introduction
Heterogeneous catalytic ozonation is considered to be one of the effective methods for the refractory organic pollutants in water.1 Dhandapani et al.2 conducted a comparative study on the catalytic ozonation capabilities of various metal oxides (Ag, Mn, Fe, Cu, Mg, Ce, Co, Cr, Ni, and V) supported on Al2O3. Among these, MnO2/Al2O3 exhibited superior catalytic ozonation performance attributed to its excellent reducibility and the characteristics of p-type oxides facilitated the decomposition of O3 into superoxide (˙O2−), enhancing the overall efficiency. Faria et al.3 prepared mixed oxides-supported catalysts using the transition metal Mn and rare earth element Ce for catalytic ozonation of sulfanilic acid and aniline. The Ce–Mn mixed oxides demonstrated larger specific surface areas and stronger redox capacities compared to their single oxide counterparts. This resulted in significant improvements in the mineralization of sulfanilic acid and aniline. The enhanced catalytic performance was primarily attributed to improved lattice oxygen mobility and increased surface reactive oxygen species, highlighting synergistic interactions between Ce and Mn.4–6 Previous research has also indicated that the enhanced ozonation efficiency observed in Ce-containing catalysts is largely due to increased concentrations of Ce(III) and oxygen vacancies.7–9 As is known to all, CeO2 possesses a unique 4f orbital that is incompletely filled with electrons, enabling it to serve as an electron reservoir facilitating rapid conversion between Ce3+ and Ce4+. This characteristic endows CeO2 with high oxygen storage capacity and efficient oxygen transfer abilities. These findings underscore the importance of understanding metal oxide interactions and their impact on catalytic processes for water treatment applications.Our previous work has also demonstrated that the redox pairs and oxygen vacancy had a synergetic effect on the catalytic ozonation of nitrobenzene wastewater by Ce–Mn/Al2O3.10 However, the effects of preparation methods on the structural characteristics of Ce–Mn/Al2O3, especially the effects of impregnation sequence were not elucidated in our previous work. Zhu et al.11 investigated the impact of impregnation sequence on the hydrothermal stability and NH3-SCR activity of Ce–Nb/SnO2 catalysts. They found that catalysts impregnated first with Nb followed by Ce exhibited enhanced synergy between Nb and Sn, showcasing the strongest redox capability while also demonstrating superior structural stability and NH3-SCR activity. In a similar vein, Ozcan et al.12 compared the catalytic performance and stability of alumina-supported Co, W, Zr catalysts prepared using sequential impregnation and co-impregnation methods for biofuel production. Their results highlighted that the catalysts prepared via co-impregnation showed the highest bio-oil conversion rate and selectivity. These studies underscore the significant impact of impregnation methods, particularly impregnation sequence, on catalyst structure and catalytic activity. Further research in this area holds promise for optimizing catalyst design and performance in heterogeneous catalytic ozonation processes.
Benzoic acid (BA) is an aromatic organic compound widely employed as a food preservative in beverages, juices, cold foods, soy sauce, vinegar, and canned foods. It acts as a bacteriostatic agent, effectively inhibiting the growth of bacteria, molds, and fungi. Due to its resistance to biodegradation by traditional microbial methods,13 effective treatment methods for benzoic acid wastewater include photocatalytic oxidation,14,15 electrochemical oxidation,16,17 and heterogeneous catalytic ozonation.18–21 Qin et al.18 investigated the catalytic performance of cerium oxide supported on N, S-doped activated carbon (Ce/ACNS) for the ozonation of benzoic acid. They attributed the superior activity of Ce/ACNS to increased surface electron density of N and S atoms, along with higher Ce(III) content on the surface. Fijołek et al.19 studied CePO4, CeO2, and bifunctional CePO4/CeO2 nanocomposites for catalytic ozonation of benzoic acid in the presence of chlorides. Among these, CePO4/CeO2 exhibited the best ozonation recovery performance, and the improved reactivity was attributed to the synergistic interaction between CePO4 and CeO2 in the bifunctional nanocomposite. Franco Peláez et al.20 utilized CeO2 thin films to catalyze the ozonation of benzoic acid. They found that the oxidation of Ce3+ contributed to the formation of reactive oxygen species, facilitating high mineralization of benzoic acid. These findings underscore the diverse applications and effective mechanisms of cerium-based catalysts in advancing the treatment of benzoic acid wastewater through ozonation processes.
In this study, we evaluated the catalytic ozonation efficiency of Ce–Mn/Al2O3 using benzoic acid as the target pollutant. The main objectives were threefold: (1) to investigate the impact of different preparation methods, particularly the impregnation sequence, on the structural characteristics and catalytic properties of Ce–Mn/Al2O3. (2) To assess the catalytic activity and stability of Ce–Mn/Al2O3 in the degradation of benzoic acid through catalytic ozonation. (3) To elucidate the synergistic interactions between Ce and Mn binary oxides, focusing on how they enhance the overall catalytic performance. These objectives aimed to deepen our understanding of Ce–Mn/Al2O3 as a catalyst and its potential application in environmental remediation processes involving ozonation.
2. Experimental procedure
2.1 Catalyst preparation
The catalysts were prepared according to the impregnation methods including the one-step impregnation and two-step impregnation method. Ce–Mn/Al2O3 catalysts were synthesized with varying amounts of Mn and Ce at different Mn to Ce molar ratios (7![[thin space (1/6-em)]](https://www.rsc.org/images/entities/char_2009.gif) :
:![[thin space (1/6-em)]](https://www.rsc.org/images/entities/char_2009.gif) 3, 3
3, 3![[thin space (1/6-em)]](https://www.rsc.org/images/entities/char_2009.gif) :
:![[thin space (1/6-em)]](https://www.rsc.org/images/entities/char_2009.gif) 1, 1
1, 1![[thin space (1/6-em)]](https://www.rsc.org/images/entities/char_2009.gif) :
:![[thin space (1/6-em)]](https://www.rsc.org/images/entities/char_2009.gif) 1, and 2
1, and 2![[thin space (1/6-em)]](https://www.rsc.org/images/entities/char_2009.gif) :
:![[thin space (1/6-em)]](https://www.rsc.org/images/entities/char_2009.gif) 1).
1).
For instance, the Ce–Mn/Al2O3 catalyst prepared via the one-step impregnation method had a total (Mn + Ce) content of 8.0 wt% and a Mn/Ce molar ratio of 7![[thin space (1/6-em)]](https://www.rsc.org/images/entities/char_2009.gif) :
:![[thin space (1/6-em)]](https://www.rsc.org/images/entities/char_2009.gif) 3. Specifically, 0.34 g of Mn(CH3COO)2·4H2O and 0.26 g of Ce(NO3)3·6H2O (supplied by Shanghai Maclin Biochemical Technology Co., Ltd) were dissolved in 5 mL of deionized water. 2.0 g of γ-Al2O3 (∼2 mm) were added and ultrasonically impregnated for 60 minutes. The impregnated samples were then dried at 100 °C for 12 hours and calcined at temperatures ranging from 400 to 700 °C for 4 hours to obtain the Ce–Mn/Al2O3 catalyst.
3. Specifically, 0.34 g of Mn(CH3COO)2·4H2O and 0.26 g of Ce(NO3)3·6H2O (supplied by Shanghai Maclin Biochemical Technology Co., Ltd) were dissolved in 5 mL of deionized water. 2.0 g of γ-Al2O3 (∼2 mm) were added and ultrasonically impregnated for 60 minutes. The impregnated samples were then dried at 100 °C for 12 hours and calcined at temperatures ranging from 400 to 700 °C for 4 hours to obtain the Ce–Mn/Al2O3 catalyst.
For the two-step impregnation method, Ce–Mn(F)/Al2O3 was prepared by first impregnating Mn and then impregnating Ce; Ce(F)–Mn/Al2O3 was prepared by first impregnating Ce and then impregnating Mn. Mn/Al2O3 and Ce/Al2O3 were also prepared by the same method with the single metal content of 8.0 wt%.
2.2 Catalyst characterization
Transmission electron microscopy (TEM) images were acquired using an FEI Tecnai F20. X-ray diffraction (XRD) patterns were carried out on the Rigaku SmartLab powder diffractometer using a CuKα radiation source (λ = 1.541 Å) with the scanning range of 10–80°. The nitrogen adsorption/desorption Brunauer–Emmett–Teller (BET) tests were performed using the Micromeritics TriStar II surface area analyzer, and the average pore diameter of catalysts were calculated by the Barrett–Joyner–Halenda (BJH) method. X-ray photoelectron spectroscopy (XPS) spectra were determined on the Thermofisher K-Alpha spectrometer using an AlKα radiation source of 1487 eV with the spot size of 400 μm, and the binding energies were calibrated with reference to the C 1s line at 284.8 eV. Electron paramagnetic resonance (EPR) tests were performed on the Bruker A300 spectrometer at X-band (9.5 GHz) at 77 K. Raman spectra were obtained using a Horiba Scientific LabRAM HR Evolution spectrometer equipped with a laser emitting at an excitation wavelength of 514 nm.2.3 Catalytic ozonation process
All experiments were performed in a glass column reactor with an effective volume of 1000 mL. Ozone was generated by the 3S–T3 ozone generator and dispersed into microbubbles by an aeration stick (Fig. S1†). Ozone concentration CO3 was maintained at 7.5 mg L−1 with the flow rate VO3 of 0.5 L min−1. The concentration of benzoic acid wastewater (cBA) was 50 mg L−1 which was analyzed by the TU-1950 UV-Vis spectrophotometer at the wavelength of 225 nm. The total organic carbon (TOC) was analyzed using the Aurora l030C TOC analyzer. The degradation rate of benzoic acid was estimated using eqn (1).
 | (1) |
2.4 Methods of theoretical calculation
All calculations were performed using the DMol3 (Materials Studio 2018) based on the density functional theory (DFT).22 The exchange and correlation interactions were calculated by generalized gradient approximation non-empirical function Perdew-Wang (GGA-PW91), the core electrons were calculated by the DFT semi-core pseudopotentials (DSPP) method, and the valence electrons were calculated by double-numerical plus polarization (DNP) function. The K point grid of Brillouin zone integration was set to 2 × 2 × l, the cutoff radius was set to 4.2 Å, the convergence tolerance of self-consistent iteration was set to 2.0 × 10⁻⁶, and the convergence accuracy of energy, maximum force and maximum displacement was set to 1.0 × 10⁻⁵ Ha, 0.002 Ha Å−1 and 0.005 Å, respectively. A four-layer periodic slab model containing twelve γ-Al2O3 units was obtained by cutting the γ-Al2O3 bulk along the (110) surface, fixing the bottom two layers and allowing the upper two layers to relax23 and a 12 Å vacuum layer was added to the (110) surface along the z axis. A supported model of Ce–Mn cluster on Al2O3(110) surface (Ce–Mn/Al2O3(110)) was established by geometric configuration optimization.The formation energy of oxygen vacancy on the surface of Ce–Mn/Al2O3(110) was calculated as follows:
| EOV = ECe–Mn/Al2O3(110)–OV + 1/2EO2 − ECe–Mn/Al2O3(110) |
The adsorption energy of O3 at the oxygen vacancy of Ce–Mn/Al2O3(110) was as follows:
| Eads = ECe–Mn/Al2O3(110)–O3 − EO3 − ECe–Mn/Al2O3(110)–OV |
3. Results and discussion
3.1 TEM analysis
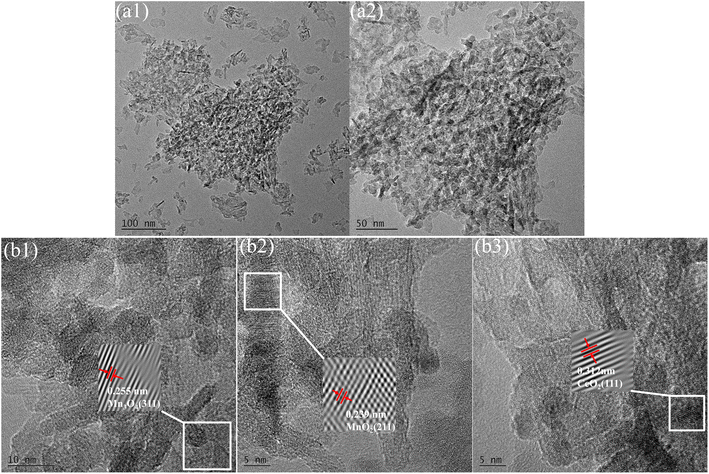
Cerium and manganese oxides were successfully loaded onto the surface of γ-Al2O3, forming spherical (as shown in Fig. 1(a1 and a2)) and short rod-like structures. HRTEM lattice fringe images (Fig. 1(b1–b3)) further revealed specific crystal planes of cerium and manganese oxides. The lattice spacings of 0.255 nm corresponded to the (311) planes of Mn3O4 (JCPDS no. 13-0162). It has been verified that when manganese acetate is used as a precursor, MnOX is mainly the Mn3O4 phase.24 Lattice spacings of 0.239 nm corresponded to the (211) planes of α-MnO2 (JCPDS no. 44-0141), while lattice spacings of 0.312 nm corresponded to the (111) planes of fluorite-type CeO2 (JCPDS no. 34-0394), indicating the presence of MnO2 and CeO2 on the catalyst surface.3.2 Effect of catalyst preparation parameters on catalytic activity of Ce–Mn/Al2O3
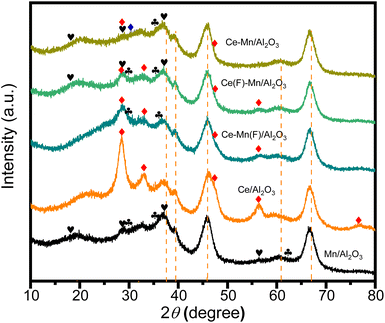
The structural composition of the catalyst significantly influences its performance, particularly in relation to the molar ratio of metal precursors. Fig. 2(a) illustrates the structural and phase characteristics of synthesized Ce–Mn/Al2O3 catalysts at varying Mn/Ce molar ratios, analyzed via X-ray diffraction. In all samples, diffraction peaks (indicated by dashed lines) at approximately 37.60°, 39.49°, 45.86°, and 67.03° are attributed to the Al2O3 phase (JCPDS no. 10-0425). For catalysts with Mn/Ce ratios of 1![[thin space (1/6-em)]](https://www.rsc.org/images/entities/char_2009.gif) :
:![[thin space (1/6-em)]](https://www.rsc.org/images/entities/char_2009.gif) 1 and 2
1 and 2![[thin space (1/6-em)]](https://www.rsc.org/images/entities/char_2009.gif) :
:![[thin space (1/6-em)]](https://www.rsc.org/images/entities/char_2009.gif) 1, the predominant crystalline phase of manganese oxides is Mn3O4 (JCPDS no. 13-0162). With increasing Mn content, additional diffraction peaks associated with α-MnO2 emerge at 18.11°, 28.84°, 37.52°, and 60.27° (JCPDS no. 44-0141) in catalysts with Mn/Ce ratios of 3
1, the predominant crystalline phase of manganese oxides is Mn3O4 (JCPDS no. 13-0162). With increasing Mn content, additional diffraction peaks associated with α-MnO2 emerge at 18.11°, 28.84°, 37.52°, and 60.27° (JCPDS no. 44-0141) in catalysts with Mn/Ce ratios of 3![[thin space (1/6-em)]](https://www.rsc.org/images/entities/char_2009.gif) :
:![[thin space (1/6-em)]](https://www.rsc.org/images/entities/char_2009.gif) 1 and 7
1 and 7![[thin space (1/6-em)]](https://www.rsc.org/images/entities/char_2009.gif) :
:![[thin space (1/6-em)]](https://www.rsc.org/images/entities/char_2009.gif) 3, which is beneficial to improve the catalytic ozonation activity due to the best redox ability of Mn4+ species.25 Ramsdellite-type MnO2 is detected in catalysts with Mn/Ce ratios of 2
3, which is beneficial to improve the catalytic ozonation activity due to the best redox ability of Mn4+ species.25 Ramsdellite-type MnO2 is detected in catalysts with Mn/Ce ratios of 2![[thin space (1/6-em)]](https://www.rsc.org/images/entities/char_2009.gif) :
:![[thin space (1/6-em)]](https://www.rsc.org/images/entities/char_2009.gif) 1 and 3
1 and 3![[thin space (1/6-em)]](https://www.rsc.org/images/entities/char_2009.gif) :
:![[thin space (1/6-em)]](https://www.rsc.org/images/entities/char_2009.gif) 1. Additionally, diffraction peaks corresponding to Mn2O3 (JCPDS no. 33-0900) are observed in the Mn/Ce = 3
1. Additionally, diffraction peaks corresponding to Mn2O3 (JCPDS no. 33-0900) are observed in the Mn/Ce = 3![[thin space (1/6-em)]](https://www.rsc.org/images/entities/char_2009.gif) :
:![[thin space (1/6-em)]](https://www.rsc.org/images/entities/char_2009.gif) 1 catalyst, indicating the presence of Mn3+ with oxygen vacancies.26 The primary crystalline phase of cerium oxides is cerianite-type CeO2 (JCPDS no. 34-0394), particularly evident in the Mn/Ce = 1
1 catalyst, indicating the presence of Mn3+ with oxygen vacancies.26 The primary crystalline phase of cerium oxides is cerianite-type CeO2 (JCPDS no. 34-0394), particularly evident in the Mn/Ce = 1![[thin space (1/6-em)]](https://www.rsc.org/images/entities/char_2009.gif) :
:![[thin space (1/6-em)]](https://www.rsc.org/images/entities/char_2009.gif) 1 catalyst. A reduction in Ce content eliminates CeO2 diffraction peaks, leaving only Ce2O3 (JCPDS no. 23-1048). The presence of Ce3+ indicates the existence of oxygen vacancies, which enhance catalytic ozonation activity.27 Notably, no distinct CeOX diffraction peaks are detected in the Mn/Ce = 2
1 catalyst. A reduction in Ce content eliminates CeO2 diffraction peaks, leaving only Ce2O3 (JCPDS no. 23-1048). The presence of Ce3+ indicates the existence of oxygen vacancies, which enhance catalytic ozonation activity.27 Notably, no distinct CeOX diffraction peaks are detected in the Mn/Ce = 2![[thin space (1/6-em)]](https://www.rsc.org/images/entities/char_2009.gif) :
:![[thin space (1/6-em)]](https://www.rsc.org/images/entities/char_2009.gif) 1 catalyst, whereas both Ce2O3 and MnO2 peaks are evident in Mn/Ce = 7
1 catalyst, whereas both Ce2O3 and MnO2 peaks are evident in Mn/Ce = 7![[thin space (1/6-em)]](https://www.rsc.org/images/entities/char_2009.gif) :
:![[thin space (1/6-em)]](https://www.rsc.org/images/entities/char_2009.gif) 3 catalysts, indicating potentially superior catalytic activity in subsequent ozonation processes. The catalytic performances of the catalysts follow the order Mn/Ce = 7
3 catalysts, indicating potentially superior catalytic activity in subsequent ozonation processes. The catalytic performances of the catalysts follow the order Mn/Ce = 7![[thin space (1/6-em)]](https://www.rsc.org/images/entities/char_2009.gif) :
:![[thin space (1/6-em)]](https://www.rsc.org/images/entities/char_2009.gif) 3 > 3
3 > 3![[thin space (1/6-em)]](https://www.rsc.org/images/entities/char_2009.gif) :
:![[thin space (1/6-em)]](https://www.rsc.org/images/entities/char_2009.gif) 1 > 1
1 > 1![[thin space (1/6-em)]](https://www.rsc.org/images/entities/char_2009.gif) :
:![[thin space (1/6-em)]](https://www.rsc.org/images/entities/char_2009.gif) 1 > 2
1 > 2![[thin space (1/6-em)]](https://www.rsc.org/images/entities/char_2009.gif) :
:![[thin space (1/6-em)]](https://www.rsc.org/images/entities/char_2009.gif) 1 (Fig. S2†), suggesting optimal synergistic effects between Mn and Ce at a molar ratio of 7
1 (Fig. S2†), suggesting optimal synergistic effects between Mn and Ce at a molar ratio of 7![[thin space (1/6-em)]](https://www.rsc.org/images/entities/char_2009.gif) :
:![[thin space (1/6-em)]](https://www.rsc.org/images/entities/char_2009.gif) 3.
3.
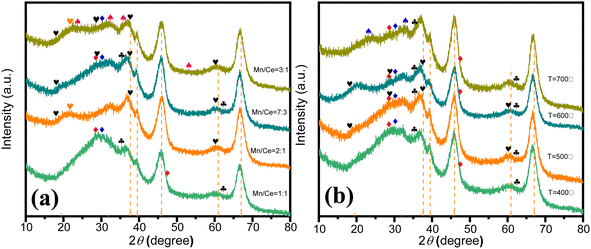 | ||
Fig. 2 XRD patterns of Ce–Mn/Al2O3 at different molar ratios of Mn/Ce (a) and different calcination temperatures (b). ( α-MnO2, α-MnO2,  Ramsdellite, Ramsdellite,  Mn3O4, Mn3O4,  Mn2O3, Mn2O3,  CeO2, CeO2,  Ce2O3, Ce2O3,  bixbyite α-Mn2O3). bixbyite α-Mn2O3). | ||
Appropriate calcination temperature is also important for the catalytic performance of catalysts. Too low calcination temperatures may lead to incomplete calcination of catalyst precursor, resulting in insufficient dispersion and formation of active sites, whereas excessively high temperatures can cause sintering of active sites.28 For instance, at a calcination temperature of 400 °C, cerium oxides mainly consist of CeO2 and Ce2O3, while manganese oxides are primarily Mn3O4. Upon increasing the calcination temperature to 600 °C, diffraction peaks associated with α-MnO2 (JCPDS no. 44-0141) begin to appear. Comparatively, the intensity of Ce2O3 diffraction peaks increases in the catalyst calcined at 600 °C compared to that at 500 °C, indicating higher Ce3+ content, which makes for the improvement of catalytic ozonation activity. However, at 700 °C, the diffraction peaks of MnO2 disappear, replaced by bixbyite α-Mn2O3.29 The absence of Mn4+ results in decreased catalytic activity. Therefore, the catalytic performances of catalysts rank as follows: 600 °C > 500 °C > 400 °C > 700 °C, suggesting that the optimal calcination temperature is 600 °C.
The textural properties of catalysts, such as specific surface area and pore structure, significantly influence their catalytic performance, which correlates closely with metal loadings. Insufficient loadings result in fewer active sites, whereas excessive ones can lead to surface clustering, thereby reducing catalytic ozonation performance.28 As depicted in Fig. 3, the adsorption–desorption isotherms of Ce–Mn/Al2O3 synthesized with varying metal loadings exhibit similar type IV isotherms with a typical H3 hysteresis loop, albeit with slight alterations in pore distribution. Metal loadings on γ-Al2O3 have been observed to decrease specific surface area (SBET) and pore volume (Vp) while increasing pore diameter (Da) (Table S1†). It's noteworthy that there is minimal change in pore volume as metal loadings increase from 8% to 12%. This indicates that with the increase in metal loadings, more metal oxides are deposited onto the support surface. This phenomenon is particularly pronounced in the catalyst with %L = 12%, where the increase in SBET can be attributed precisely to the presence of metal oxides supported on the γ-Al2O3 surface. The catalytic performances of the catalysts rank as follows: %L = 8% > 12% > 10% > 6%, suggesting that a metal loading of 8% is optimal.
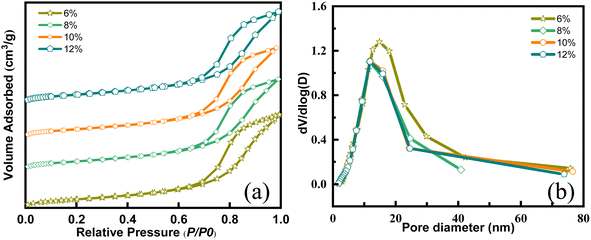 | ||
| Fig. 3 N2 adsorption and desorption isotherms (a) and pore size distribution curves (b) of Ce–Mn/Al2O3 with different metal loadings. | ||
3.3 Effect of impregnation sequence on catalytic ozonation activity of Ce–Mn/Al2O3
![[thin space (1/6-em)]](https://www.rsc.org/images/entities/char_2009.gif) :
:![[thin space (1/6-em)]](https://www.rsc.org/images/entities/char_2009.gif) 3.
3.
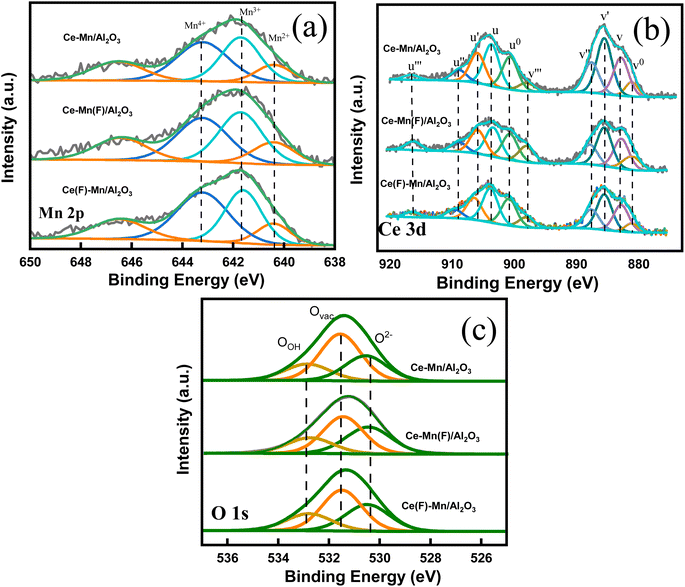 | ||
| Fig. 5 High resolution Mn 2p (a), Ce 3d (b) and O 1s (c) XPS spectra of Ce–Mn/Al2O3, Ce–Mn(F)/Al2O3 and Ce(F)–Mn/Al2O3. | ||
Besides, the impregnation sequence has a great influence on the chemical states and relative percentage of elements on the catalyst surface (Table 1). For Mn 2p3/2 spectra, the fitting peaks at 640.4, 641.7 and 643.2 eV are ascribed to Mn2+, Mn3+ and Mn4+, respectively.32–34 The satellite peak at ∼646 eV represents the existence of Mn2+, and the shoulder peak at ∼643 eV represents the existence of Mn4+.35–37 As depicted in the Fig. 3(a), the ratios of Mn4+ to the sum of Mn4+, Mn3+ and Mn2+ on Ce–Mn/Al2O3, Ce–Mn(F)/Al2O3 and Ce(F)–Mn/Al2O3 are 0.38, 0.34, and 0.40. It is consistent with the XRD results that the peak intensity of MnO2 in Ce(F)–Mn/Al2O3 is intensified than that of Ce–Mn/Al2O3. Moreover, the ratios of Mn2+ are 0.30, 0.32 and 0.28, respectively. Combined with XRD analysis, the main crystal phase of manganese is Mn3O4 on Ce–Mn(F)/Al2O3, which is consistent with the increase of Mn2+ content in XPS results. That is, the first impregnation of Ce followed by Mn will increase the ratio of Mn4+, while the first impregnation of Mn followed by Ce will increase the ratio of Mn2+. The lowest content of Mn4+ on Ce–Mn(F)/Al2O3 is unfavorable for the improvement of catalytic activity.
| Sample | O 1s (eV) | Ovac/% | Mn 2p3/2 (eV) | Mn4+/% | Ce 3d (eV) | Ce3+/% | |||||
|---|---|---|---|---|---|---|---|---|---|---|---|
| OOH | Ovac | O2− | Mn4+ | Mn3+ | Mn2+ | Ce4+ | Ce3+ | ||||
| Ce–Mn/Al2O3 | 532.8 | 531.5 | 530.5 | 51.24 | 643.2 | 641.7 | 640.4 | 37.72 | uu′′u′′′ | u0u′ | 52.18 |
| vv′′v′′′ | v0v′ | ||||||||||
| Ce–Mn(F)/Al2O3 | 532.8 | 531.5 | 530.5 | 43.75 | 643.2 | 641.7 | 640.4 | 34.49 | uu′′u′′′ | u0u′ | 45.58 |
| vv′′v′′′ | v0v′ | ||||||||||
| Ce(F)–Mn/Al2O3 | 532.8 | 531.5 | 530.5 | 45.77 | 643.2 | 641.7 | 640.4 | 40.5 | uu′′u′′′ | u0u′ | 47.00 |
| vv′′v′′′ | v0v′ | ||||||||||
For the Ce 3d spectra, it consists of 5 pairs of doublets, where u and v represent the Ce 3d5/2 and 3d3/2 spin–orbit splits, respectively. The peaks v (882.8 eV), v′′ (887.5 eV), v′′′ (898 eV) are attributed to Ce4+ 3d3/2, and the peaks u (903.6 eV), u′′ (909 eV), u′′′ (916.5 eV) are attributed to Ce4+ 3d5/2. The peaks v0 (881.1 eV), v′ (885.5 eV) are attributed to Ce3+ 3d3/2, and the peaks u0 (900.7 eV), and u′ (906 eV) are attributed to Ce3+ 3d5/2.37,38 The ratios of Ce3+ to the sum of Ce4+ and Ce3+ on Ce–Mn/Al2O3, Ce–Mn(F)/Al2O3 and Ce(F)–Mn/Al2O3 are 0.52, 0.46, and 0.47, respectively. Obviously, the synergetic effects of Mn and Ce in the one-step impregnation promotes the formation of Ce3+, while the two-step impregnation is adverse to the formation of Ce3+. The presence of Ce3+ can greatly increase the electron donor density and promote the formation of more oxygen vacancies due to the charge compensation.39 By comparison, Ce–Mn/Al2O3 has the largest amount of Ce3+, which is conclusive to the formation of more oxygen vacancies, thereby improving its catalytic ozonation activity.33,40
For O 1s spectra, the fitting peaks at 530.5 eV, 531.5 eV, 532.8 eV are ascribed to lattice oxygen (O2−), surface atomic oxygen adsorbed on oxygen vacancies (Ovac) and surface hydroxyl groups or chemisorbed water (OOH), respectively. The ratios of Ovac on Ce–Mn/Al2O3, Ce–Mn(F)/Al2O3 and Ce(F)–Mn/Al2O3 are 0.51, 0.44, and 0.46, respectively, indicating that there are abundant surface oxygen vacancies. It is well known that the content of oxygen vacancy in CeO2 catalyst is closely related to the content of Ce3+,41 and the content ordering of Ovac in this study is exactly consistent with that of Ce3+.
In all, the competitive synergistic effects of cerium and manganese noticeably increased the oxygen vacancy content during the one-step impregnation process, whereas the absence of such competitive effects resulted in a decrease in oxygen vacancy content in the two-step impregnation processes.
3.4 Catalytic ozonation activity and stability of Ce–Mn/Al2O3 on the degradation of benzoic acid
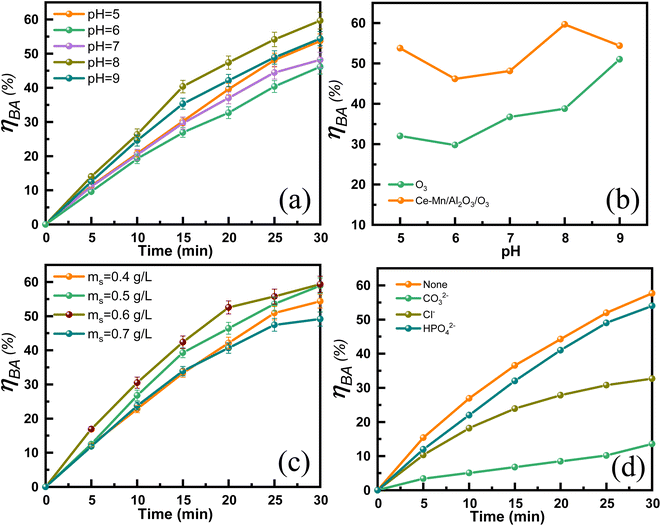 | ||
| Fig. 8 Effect of pH (a) and (b), catalyst dosage (c) and anions (d) on the catalytic ozonation degradation efficiency of benzoic acid. | ||
Fig. 8(c) shows the effects of catalyst dosage on the catalytic ozonation efficiency of benzoic acid. The ηBA gradually increased from 54.4% to 59.3% with the catalyst dosage increases from 0.4 to 0.6 g L−1 due to the increased exposure of the surface reactive sites. Further increasing the catalyst dosage, the ηBA decreased. The possible reason maybe that high dosage of Ce–Mn/Al2O3 produces too much active species such as ˙OH and O2˙−, resulting in inactivation and self-quenching of active species.45 Fig. 8(d) also shows the effects of common anions (CO32−, Cl−, HPO42−, 10 mM) on the degradation efficiency of benzoic acid. The presence of anions resulted in a significant decrease of the degradation efficiency of benzoic acid, and its inhibitory effects followed the order of CO32− > Cl− > HPO42−. Wang et al.21 have proposed that the dominant reactive oxygen species for the degradation of BA is ˙OH. The stepwise hydroxylation of benzoic acid is the predominant reaction pathway, during which ˙OH react with the aromatic ring to form hydroxybenzoic acids, dihydroxy-benzoic acids and trihydroxy-benzoic acids.46 CO32− is known to have a strong scavenging effect on ˙OH, with the relatively high reaction rate constant (k = 4.2 × 10⁸ M−1 s−1) and the ηBA significantly decreased from 57.7% to 13.6% in the presence of CO32−. ˙OH can also be scavenged by Cl− with the moderate reactivity (k = 8.9 × 10⁷ M−1 s−1), resulting in a 25% reduction in ηBA in the presence of Cl−.47 It is inferred that due to the relatively low reactivity of HPO42− with ˙OH, the ηBA was reduced by only 3.7% in the presence of HPO42−.
Table 2 presents a comparison of the treatment efficiency of catalytic ozonation of BA with previous studies. The catalytic performance of Ce–Mn/Al2O3 in this study is at a moderate level compared with other reported catalysts, primarily due to the low ozone concentration and the large volume of the BA solution used. Notably, the spherical shape of the Ce–Mn/Al2O3 catalyst facilitates easier recovery from the aqueous solution compared to other powder-form catalysts.
| Catalyst | CO3 | ms | cBA/VBA | Time | TOC removal efficiency | Ref. |
|---|---|---|---|---|---|---|
| CeO2 film | 15 mg min−1 | 3 mg L−1 | 115 mg L−1/0.4 L | 120 min | 84% | 20 |
| Fe-shaving | 60.8 mg min−1 | 33.3 g L−1 | 122 mg L−1/1.5 L | 90 min | 56% | 21 |
| Mn/ZSM | 20 mg min−1 | 0.5 g L−1 | 67.5 mg L−1/0.5 L | 30 min | 75.4% | 46 |
| CeOx/AC | — | 0.5 g L−1 | 50 mg L−1/0.3 L | 30 min | 35% | 18 |
| CePO4/CeO2 | — | 0.2 g L−1 | 2.9 mg L−1/0.2 L | 60 min | 40% | 19 |
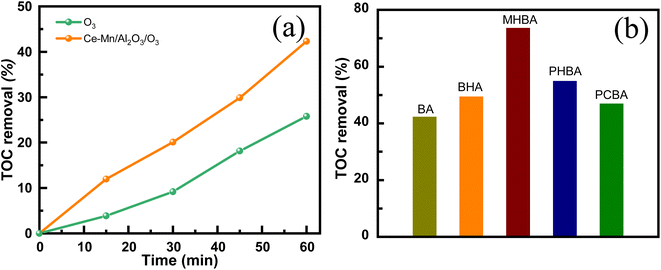
| Ce–Mn/Al2O3 | 3.75 mg min−1 | 0.5 g L−1 | 50 mg L−1/1 L | 60 min | 42.3% | This study |
 | ||
| Fig. 11 High resolution Mn 2p (a), Ce 3d (b) and O 1s (c) XPS spectra of Ce–Mn/Al2O3 before and after use. | ||
As shown in Table 3, the ratio of Mn4+ to the sum of Mn species decreases from 37.7% to 36.3%, while the ratio of Mn3+ increases from 32.2% to 36.5% after catalytic ozonation. The ratio of Ce3+ to the sum of Ce species decreases from 52.2% to 45.7% and the ratio of Ce4+ increases from 47.8% to 54.3%. The reduction of Mn4+ and the oxidation of Ce3+ occurred simultaneously in the catalytic ozonation process.10,48–50 The significant increase in Ce4+ might result in an increase in the lattice oxygen, which is converted by the oxygen uptake at oxygen vacancies. Ozone molecule can also be adsorbed on the oxygen vacancy to form superoxide anion radicals,51 and the surface hydroxyl groups can also be attacked by ozone molecule to form ozonide anion radicals.52 As a result, the ratio of Ovac decreases from 51.2% to 49.9% and the ratio of Oads also decreases from 20.3% to 18.2% after catalytic ozonation. In contrast, the ratio of O2− increases from 28.5% to 31.9%. These results indicates that the active centers of catalytic ozonation of benzoic acid are mainly Mn4+, Ce3+, surface hydroxyl groups and oxygen vacancies. Although the inactivation and loss of the active sites occurred during the ozonation process, the synergetic interactions between cerium and manganese atoms enable the rapid electron transfer between Ce4+ and Mn3+ to promote the recovery of Ce3+ and Mn4+:53
| Ce4+ + Mn3+→ Mn4+ + Ce3+ | (2) |
| Sample | O 1s (eV) | Ovac/% | Mn 2p3/2 (eV) | Mn4+/% | Ce 3d (eV) | Ce3+/% | |||||
|---|---|---|---|---|---|---|---|---|---|---|---|
| Oads | Ovac | O2− | Mn4+ | Mn3+ | Mn2+ | Ce4+ | Ce3+ | ||||
| Before | 532.8 | 531.5 | 530.5 | 51.24 | 643.2 | 641.7 | 640.4 | 37.72 | uu′′u′′′ | u0u′ | 52.18 |
| vv′′v′′′ | v0v′ | ||||||||||
| After | 532.6 | 531.5 | 530.4 | 49.87 | 643.4 | 641.7 | 640.7 | 36.30 | uu′′u′′′ | u0u′ | 45.66 |
| vv′′v′′′ | v0v′ | ||||||||||
To illustrate this, we also studied the adsorption configuration of ozone on the active centers of Ce–Mn/Al2O3. The γ-Al2O3 structure is established and optimized according to the cell parameters provided by Digne et al.54 The cell parameters are a = 5.59 Å, b = 8.42 Å, c = 8.10 Å and β = 90.60°. Since the (110) surface is considered to be the most exposed crystal surface of γ-Al2O3 (70–83%), the (110) surface is chosen as the representative of γ-Al2O3. The Ce–Mn/Al2O3 model is established by adsorption of the optimized Ce–Mn cluster on the surface of Al2O3(110). After optimization, Mn atom is bonded to O60, O61 and O62 with bond lengths of 2.30 Å, 1.90 Å and 2.04 Å respectively, and Ce atom is bonded to O23 and O15 with bond lengths of 2.38 Å, as shown in Fig. S4.†
The unsaturated coordination oxygen O64 can easily transfer electrons to Mn atom and release oxygen to form oxygen vacancy, given that its Mulliken charge is −0.364|e| and its conformation is far away from the Ce–Mn/Al2O3(110) surface. The calculated oxygen vacancy formation energy EOV is only 0.02 eV, indicating that the (110) surface of Ce–Mn/Al2O3 is very active to form oxygen vacancy defects. As shown in Fig. 12(a), with the formation of oxygen vacancy, the charge density around the oxygen vacancy drops sharply, resulting in a significant increase in the charge density around the Mn atom, forming an electron-rich center to maintain electrical neutrality. Meanwhile, there is also electron transfer between Mn and Ce atoms, and the charge density around Ce atom increase slightly due to the dual redox reaction of Mn3+/Mn4+ and Ce4+/Ce3+.
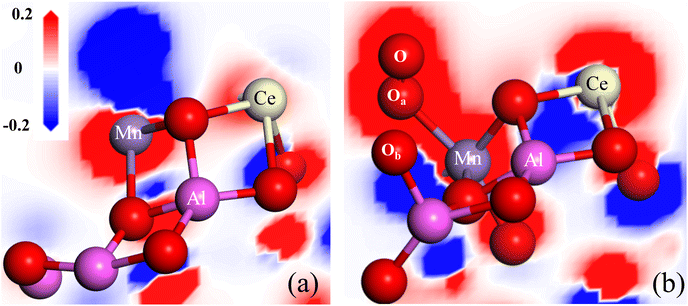 | ||
| Fig. 12 The differential charge density adjacent to the oxygen vacancy of Ce–Mn/Al2O3(110) surface before (a) and after (b) ozone adsorption. | ||
When the ozone molecule is adsorbed on the oxygen vacancy of Ce–Mn/Al2O3(110) surface, it can be dissociated into *O2 and bonded to the Mn atom. The O–O a bond length is 1.26 Å, which is exactly the same as that of O2˙−. At the same time, an *O atom is also formed and bonded to the Al atom (Fig. 12(b)), thus replenishing the released lattice oxygen. The dissociation energy of ozone on the oxygen vacancy of Ce–Mn/Al2O3(110) surface is −34.18 kcal mol−1, and the reaction energy barrier is only 1.616 kcal mol−1. This process is very favorable both thermodynamically and kinetically. With the adsorption and dissociation of ozone on the oxygen vacancy, the charge density around Mn atom increases, while the charge density around Ce atom decreases, indicating that the adsorption of ozone on the oxygen vacancy is accompanied by the reduction of Mn4+ and the oxidation of Ce3+. In a word, the oxygen vacancy acts as an effective active site for ozone adsorption and dissociation into *O2 and *O, so the ratio of Oads increases correspondingly after catalytic ozonation, and this process also involves the dual redox reactions of Mn4+/Mn3+ and Ce3+/Ce4+ to form an electron closed loop and to maintain the balance of electron supply, which fully explains and supports our previous experimental results.
4. Conclusion
Ce–Mn binary oxides supported on Al2O3 with enhanced activity and stability for catalytic ozonation of benzoic acid have been obtained by one-step impregnation method. The different impregnation conditions especially impregnation sequence have a great influence on the structure and the catalytic ozonation performance of catalysts. The diffraction peaks of Ce2O3 and MnO2 appeared in the catalyst with Mn/Ce = 7![[thin space (1/6-em)]](https://www.rsc.org/images/entities/char_2009.gif) :
:![[thin space (1/6-em)]](https://www.rsc.org/images/entities/char_2009.gif) 3, and the calcination temperature of 600 °C enhanced the intensity of Ce2O3, which are favorable to the improvement of catalytic ozonation activity. Ce–Mn/Al2O3 demonstrated strong catalytic ozonation activity towards benzoic acid derivatives, achieving a TOC removal of 42.3% from benzoic acid and 73.6% from m-hydroxybenzoic acid solution within 60 min. The competitive synergetic effects of cerium and manganese in the one-step impregnation process promoted the dispersion of Ce component, resulting in more homogeneous Ce3+ species on the catalysts surface, which substantially increased the surface oxygen vacancies of catalysts, while the lack of competitive effects in the two-step impregnation process led to a decrease in oxygen vacancy content. Oxygen vacancies act as the effective active sites for ozone adsorption and dissociation to *O2 and *O, accompanied with the reduction of Mn4+ to Mn3+ and the oxidation of Ce3+ to Ce4+, to form an electron closed loop and maintain the balance of electron supply. The synergetic interactions between cerium and manganese also enable the rapid electron transfer between Ce4+ and Mn3+ to promote the recovery of Ce3+ and Mn4+. Due to the synergetic effects, the catalytic ozonation activity and stability of Ce–Mn/Al2O3 was enhanced.
3, and the calcination temperature of 600 °C enhanced the intensity of Ce2O3, which are favorable to the improvement of catalytic ozonation activity. Ce–Mn/Al2O3 demonstrated strong catalytic ozonation activity towards benzoic acid derivatives, achieving a TOC removal of 42.3% from benzoic acid and 73.6% from m-hydroxybenzoic acid solution within 60 min. The competitive synergetic effects of cerium and manganese in the one-step impregnation process promoted the dispersion of Ce component, resulting in more homogeneous Ce3+ species on the catalysts surface, which substantially increased the surface oxygen vacancies of catalysts, while the lack of competitive effects in the two-step impregnation process led to a decrease in oxygen vacancy content. Oxygen vacancies act as the effective active sites for ozone adsorption and dissociation to *O2 and *O, accompanied with the reduction of Mn4+ to Mn3+ and the oxidation of Ce3+ to Ce4+, to form an electron closed loop and maintain the balance of electron supply. The synergetic interactions between cerium and manganese also enable the rapid electron transfer between Ce4+ and Mn3+ to promote the recovery of Ce3+ and Mn4+. Due to the synergetic effects, the catalytic ozonation activity and stability of Ce–Mn/Al2O3 was enhanced.
Data availability
The data supporting this article have been included as part of the ESI.†Conflicts of interest
The authors declare no competing financial interest, and manuscript is approved by all authors for publication.Acknowledgements
The authors are grateful for the financial support from Scientific and Technological Innovation Programs of Higher Education Institutions in Shanxi (No. 2022L535), Fundamental Research Program of Shanxi Province (No. 202303021222301) and Taiyuan Institute of Technology Scientific Research Initial Funding (No. 2023KJ014).References
- W. Chen, H. He, J. Liang, X. Wei, X. Li, J. Wang and L. Li, J. Hazard. Mater., 2023, 443, 130302 CrossRef CAS PubMed.
- B. Dhandapani and S. T. Oyama, Appl. Catal., B, 1997, 11, 129–166 CrossRef CAS.
- P. C. C. Faria, J. J. M. Órfão and M. F. R. Pereira, Catal. Commun., 2008, 9, 2121–2126 CrossRef CAS.
- S. Gong, W. Wang, K. Chen, K. Xiao and Y. Yin, J. Environ. Chem. Eng., 2022, 10, 107571 CrossRef CAS.
- Z. Wu, G. Zhang, R. Zhang and F. Yang, Ind. Eng. Chem. Res., 2018, 57, 1943–1953 CrossRef CAS.
- W. Feng, F. He, X. Chen, B. Jiang, H. Wang and Z. Wu, Chem. Eng. J., 2024, 488, 150804 CrossRef CAS.
- Y. Ding, J. Wang, S. Xu, K.-Y. A. Lin and S. Tong, Sep. Purif. Technol., 2018, 207, 92–98 CrossRef CAS.
- F. Chen, X. Shen, Y. Wang and J. Zhang, Appl. Catal., B, 2012, 121–122, 223–229 CrossRef CAS.
- J. Wang, X. Quan, S. Chen, H. Yu and G. Liu, J. Hazard. Mater., 2019, 368, 621–629 CrossRef CAS PubMed.
- S. Shao, Z. Li, J. Zhang, K. Gao, Y. Liu and W. Jiao, Chem. Eng. Sci., 2022, 248, 117246 CrossRef CAS.
- Y. Zhu, W. Shan, Z. Lian, J. Liu, Y. Zhang and H. He, J. Environ. Sci., 2024, 138, 450–457 CrossRef CAS PubMed.
- M. C. Ozcan, P. Degirmencioglu, E. Ekinci, B. P. Karaman, K. Murtezaoglu and N. Oktar, Appl. Catal., A, 2024, 683, 119850 CrossRef CAS.
- N. Altunay, M. F. Lanjwani, H. U. Haq, M. Tuzen and A. Elik, Sustainable Chem. Pharm., 2024, 38, 101464 CrossRef CAS.
- J. Arshad, F. M. A. Alzahrani, S. Munir, U. Younis, M. S. Al-Buriahi, Z. A. Alrowaili and M. F. Warsi, Ceram. Int., 2023, 49, 18988–19002 CrossRef CAS.
- F. M. A. Alzahran, J. Arshad, M. S. Al-Buriahi, Z. A. Alrowaili and S. Munir, J. Taibah Univ. Sci., 2023, 17, 2209676 CrossRef.
- T. Velegraki, G. Balayiannis, E. Diamadopoulos, A. Katsaounis and D. Mantzavinos, Chem. Eng. J., 2010, 160, 538–548 CrossRef CAS.
- A. Arts, K. P. van den Berg, M. T. de Groot and J. van der Schaaf, Curr. Res. Green Sustainable Chem., 2021, 4, 100217 CrossRef CAS.
- H. Qin, R. Xiao, Y. Wang and H. Li, Acta Sci. Circumstantiae, 2019, 39, 3786–3793 CAS.
- L. Fijołek and L. Wolski, Sci. Rep., 2022, 12, 9043 CrossRef PubMed.
- D. Franco Peláez, J. L. Rodríguez S, T. Poznyak, H. Martínez Gutiérrez, J. A. Andraca Adame, L. Lartundo Rojas and C. J. Ramos Torres, RSC Adv., 2024, 14, 3923–3935 RSC.
- Z. Wang, X. Lin, Y. Huang and L. Ma, J. Hazard. Mater., 2022, 431, 128620 CrossRef CAS PubMed.
- H. Li, D. H. Wang and S. Hui, Appl. Surf. Sci., 2021, 569, 150994 CrossRef CAS.
- J. Xiang, L. Wang, F. Cao, K. Qian, S. Su, S. Hu, Y. Wang and L. Liu, Chem. Eng. J., 2016, 302, 570–576 CrossRef CAS.
- L. Cheng, S. Sin, J. Ji, S. Yang, C. Tan, Z. Gu, W. Song, C. Huang, C. Sun, C. Tang and L. Dong, Fuel, 2023, 342, 127772 CrossRef CAS.
- J. Yang, S. Ren, B. Su, Y. zhou, G. Hu, L. Jiang, J. Cao, W. Liu, L. Yao, M. Kong, J. Yang and Q. Liu, Catal. Lett., 2021, 151, 2964–2971 CrossRef CAS.
- Y. Huang, L.-c. Nengzi, X. Zhang, J. Gou, Y. Gao, G. Zhu, Q. Cheng and X. Cheng, Chem. Eng. J., 2020, 388, 124274 CrossRef CAS.
- P. Dutta, S. Pal, M. S. Seehra, Y. C. Shi, A. Eyring and R. D. Ernst, Chem. Mater., 2006, 18, 5144–5146 CrossRef CAS.
- C. Chen, Y. Li, W. Ma, S. Guo, Q. Wang and Q. X. Li, Sep. Purif. Technol., 2017, 183, 1–10 CrossRef CAS.
- S. Dey and V. V. Praveen Kumar, Curr. Res. Green Sustainable Chem., 2020, 3, 100012 CrossRef.
- H. Zheng, T. Guo, Z. Li, F. Meng and Y. Qin, Chin. J. Inorg. Chem., 2013, 29, 2575–2581 CAS.
- G. Gao, J.-W. Shi, C. Liu, C. Gao, Z. Fan and C. Niu, Appl. Surf. Sci., 2017, 411, 338–346 CrossRef CAS.
- Y. Zhang, Z. Zeng, Y. Li, Y. Hou, J. Hu and Z. Huang, Fuel, 2021, 288, 119700 CrossRef CAS.
- M. Wang, X. Hong, J. Chen, J. Li, X. Chen, J. Mi, Z. Liu and S. Xiong, Chem. Eng. J., 2022, 440, 135854 CrossRef CAS.
- E. Yadav, P. Ghising, K. Rajeev and Z. Hossain, Phys. Rev. B, 2023, 107, 214446 CrossRef CAS.
- I. Arora and P. Kumar, J. Mater. Sci.: Mater. Electron., 2020, 31, 12725–12734 CrossRef CAS.
- E. A. Arkhipova, A. S. Ivanov, K. I. Maslakov, R. Y. Novotortsev, S. V. Savilov, H. Xia and S. M. Aldoshin, Ionics, 2024, 30, 1125–1136 CrossRef CAS.
- B. Zhang, P. Liang, X. Zhang, J. Wang, C. Zhang, M. Xiong and X. He, J. Colloid Interface Sci., 2024, 660, 703–715 CrossRef CAS PubMed.
- C. Chen, H. Xie, P. He, X. Liu, C. Yang, N. Wang and C. Ge, Appl. Surf. Sci., 2022, 571, 151285 CrossRef CAS.
- P. Li, Z. Song, M. Yang, S. Chen, X. Xiao, W. Duan, L. Li and X. Huang, Anal. Chem., 2020, 92, 16089–16096 CrossRef CAS PubMed.
- W. Chen, R. Ran, D. Weng, X. Wu, J. Zhong and S. Han, J. Rare Earths, 2017, 35, 970–976 CrossRef CAS.
- K. Reed, A. Cormack, A. Kulkarni, M. Mayton, D. Sayle, F. Klaessig and B. Stadler, Environ. Sci.: Nano, 2014, 1, 390–405 RSC.
- W. Hong, M. Shao, T. Zhu, H. Wang, Y. Sun, F. Shen and X. Li, Appl. Catal., B, 2020, 274, 119088 CrossRef CAS.
- L. Lan, H. Gengshen, L. Jiqing and L. Mengfei, Acta Phys.-Chim. Sin., 2012, 28, 1012–1020 Search PubMed.
- S. Shao, D. Lei, Y. Song, L. Liang, Y. Liu and W. Jiao, Ind. Eng. Chem. Res., 2021, 60, 2123–2135 CrossRef CAS.
- X. Wei, S. Shao, X. Ding, W. Jiao and Y. Liu, J. Cleaner Prod., 2020, 248, 119179 CrossRef CAS.
- Y. Xu, Q. Wang, B. A. Yoza, Q. X. Li, Y. Kou, Y. Tang, H. Ye, Y. Li and C. Chen, Front. Chem., 2019, 7, 384 CrossRef CAS PubMed.
- L. Zhao, W. Ma, S. Lu and J. Ma, Sep. Purif. Technol., 2019, 210, 167–174 CrossRef CAS.
- Y. Wang, W. Yang, X. Yin and Y. Liu, J. Environ. Chem. Eng., 2016, 4, 3415–3425 CrossRef CAS.
- S. Afzal, X. Quan and S. Lu, Appl. Catal., B, 2019, 248, 526–537 CrossRef CAS.
- Y. Liao, M. Fu, L. Chen, J. Wu, B. Huang and D. Ye, Catal. Today, 2013, 216, 220–228 CrossRef CAS.
- R. Radhakrishnan, S. T. Oyama, J. G. Chen and K. Asakura, J. Phys. Chem. B, 2001, 105, 4245–4253 CrossRef CAS.
- L. Zhao, J. Ma, Z. Sun and H. Liu, Appl. Catal., B, 2009, 89, 326–334 CrossRef CAS.
- X. Weng, P. Sun, Y. Long, Q. Meng and Z. Wu, Environ. Sci. Technol., 2017, 51, 8057–8066 CrossRef CAS PubMed.
- M. Digne, P. Sautet, P. Raybaud, P. Euzen and H. Toulhoat, J. Catal., 2004, 226, 54–68 CrossRef CAS.
Footnote |
| † Electronic supplementary information (ESI) available. See DOI: https://doi.org/10.1039/d4ra06148a |
| This journal is © The Royal Society of Chemistry 2024 |

