 Open Access Article
Rapid isotopic analysis of uranium particles by laser ablation MC-ICP-MS†
Josh
Wimpenny
 *a,
Kyle M.
Samperton
 ab,
Pedro
Sotorrio
a,
Matthew S.
Wellons
b,
Spencer M.
Scott
b,
David
Willingham
a and
Kim
Knight
a
aLawrence Livermore National Laboratory, Livermore, CA 94550, USA. E-mail: wimpenny1@llnl.gov
bSavannah River National Laboratory, Aiken, SC 29808, USA
First published on 9th February 2023
Abstract
We present a methodology for characterizing the isotopic composition of uranium (U) in μm-scale particles by laser ablation multicollector-inductively coupled plasma-mass spectrometry (MC-ICP-MS). Analyses were performed using two U particle materials, 235U-enriched Certified Reference Material (CRM) U200 and depleted uranium (DU) produced by Savannah River National Laboratory (SRNL). The laser was rastered over the sample surface and the signal derived from each individual particle was integrated separately and reduced using a bespoke data reduction package, including application of corrections for instrumental mass bias and ion counter gains. Accurate 234U/238U, 235U/238U and 236U/238U ratios were obtained with percent-level precision in samples with isotopic compositions spanning >2 orders of magnitude, including successfully resolving 234U and 236U abundances of <10 ppm and <80 ppm respectively in SRNL-DU. Comparable results obtained by laser ablation (LA) MC-ICP-MS and large geometry—secondary ionization mass spectrometry (LG-SIMS) indicate that laser ablation can provide valuable information when rapid U isotopic analysis of environmental samples is required.
1. Introduction
Environmental sampling is an International Atomic Energy Agency (IAEA) safeguards tool that helps ensure that nuclear facilities, e.g., enrichment plants, are not being misused and that there is no undeclared nuclear material contained therein. Swipe sampling is performed to collect μm-scale particulates which are analyzed to identify their elemental and isotopic compositions; this provides important information about the enrichment level, potential time of reprocessing, and the particle age.1 The characterization of U isotope ratios in individual particles is commonly performed by large geometry—secondary ionization mass spectrometry (LG-SIMS), which can achieve a precision of <1% on the 235U/238U ratio and <20% on the minor isotope ratios 234U/238U and 236U/238U.2–5 However, SIMS instruments are costly, require significant investment in infrastructure and personnel, and can have strict sample preparation requirements. An alternative analytical technique that could potentially be useful for safeguards particulate analysis is laser ablation multicollector – inductively coupled plasma – mass spectrometry (MC-ICP-MS). Laser ablation is a rapid in situ sampling technique that requires minimal sample preparation. Modern MC-ICP-MS platforms are highly versatile and can characterize the isotopic composition of a wide range of elements with precision down to the parts-per-million level. Thus, LA-MC-ICP-MS could potentially fill an important role as an alternative in situ analytical technique for isotopic analyses of U in particulate materials.The isotopic analysis of particles by laser ablation presents several challenges in comparison with the measurement of macroscopic samples such as glasses, rock thin sections and mineral separates. First, the optics provided on most laser ablation systems are optimized for spot sizes of 10–100 μm, which makes identifying μm or sub-μm scale objects difficult. Second, the mass of material generated from ablation of a μm-scale particle will be orders-of-magnitude smaller than the mass generated by a typical 20–50 μm spot analysis in glass or other solid. Thus, the resulting ion beam may not be resolvable on a Faraday detector and may be challenging to resolve using ion counters. Perhaps more significantly, any particle-scale signal that is produced will be short lived on the order of seconds, and the signal is liable to be highly unstable compared to ablation of a glass. Other problems that can affect particle data generated by LA-MC-ICP-MS include lag time differences between Faraday detectors and ion counters6,7 and detector ‘blind time’, which affects the precision of isotopic data obtained using ultra short (<0.13 s) integration times.8 Finally, instability in the ablation signal means data with near background-level ion beam intensities are common, and their highly anomalous isotope ratios can have a disproportionate effect on final isotopic compositions. For this reason, particle data cannot be processed using simple point-by-point averaging,6 and alternative data reduction strategies are required to ensure accurate isotope ratios are produced with representative uncertainties. Thus, obtaining accurate and high-precision isotopic data for U particles is challenging not only from a technical standpoint, but also requires robust and reproducible data reduction procedures.
Several previous studies have developed methods to analyze U particles by laser ablation ICP-MS.6–15 These studies have yielded U isotope ratios that are accurate within their stated precisions, with the caveat that data is highly imprecise in comparison to isotope ratios obtained by conventional solution analyses (<0.1%16). Here, we note that throughout this manuscript uncertainties are reported as two times the standard deviation of the mean, abbreviated as 2σ. Typical published precision on the 235U/238U ratios of U-particles measured by laser ablation ICP-MS range from 0.2 to 40% (2σ), with higher precision data generated by multi-collector ICP-MS (over single collector instruments) and by ablating particles over 5 μm in diameter.9–14 For isotopic analyses of ≤ 1 μm diameter particles, which are most relevant to safeguards operations, precision of 1.8–6% (2σ) has been achieved on the 235U/238U ratio and 2.4–4.8% (2σ) on the 234U/238U ratio.7,15 Although these results show that laser ablation is a promising technique for U particle analyses, several key aspects of technique development have remained untested. To date, most particle analyses have been performed on materials with natural or near-natural U isotopic compositions, meaning the capability to accurately analyze the isotopic composition of samples with higher than natural 235U enrichment levels have not been thoroughly assessed. Furthermore, because 236U does not exist in natural samples, the ability to characterize the 236U/238U ratio has not yet been demonstrated, despite its importance to safeguards as a potential signature of reprocessing activity. Finally, correction factors for mass bias and ion counter gains have, up until now, been applied using pre-calculated constants that were derived from prior analyses of U reference materials in solution10 or online aspiration of U standards prior to and after ablation.6 Thus, shifts in these correction factors between and/or within each analytical session cannot be accounted for during particle analyses, potentially impacting the reproducibility of isotope ratio data.
Here, we aim to further develop LA-MC-ICP-MS as an analytical tool for safeguards evaluation by testing its performance during the isotopic analysis of two particulate reference standards; U.S. New Brunswick Laboratory Program Office (NBL PO) Certified Reference Material (CRM) U200, and DU-oxide particulates developed by SRNL. Both materials have well characterized and distinctive U isotopic compositions, with 236U contents that are resolvable above background.17,18 In the case of SRNL-DU, its 234U and 236U contents are both extremely low (0.00068 and 0.0086% respectively), making it an ideal sample to assess the detection limits of LA-MC-ICP-MS with respect to LG-SIMS.18 We also aim to streamline data collection by using an in-house U reference glass as a mass bias and ion counter gain standard, negating the need to pre-calibrate in solution mode or aspirate solutions into the plasma before and after each laser ablation analytical session. In theory, this approach will also enable us to better account for in-run drift in mass bias, which may in turn help to improve the accuracy and precision of U isotopic data.
2. Experimental setup and methods
2.1. Hardware configuration
The analytical setup at Lawrence Livermore National Laboratory (LLNL) consists of a 193 nm excimer laser system with a 4 ns pulse length (Photon Machines Analyte), combined with a multi-collector—inductively coupled plasma—mass spectrometer (MC-ICP-MS, Thermo Scientific Neptune-Plus). The 193 nm laser energy is in the UV spectrum and couples well with IR transparent materials. Although the nanosecond pulse length is not as effective at reducing thermal effects of laser interaction with the sample surface as newer femtosecond laser systems, this is less important when ablating μm-scale particles, which are rapidly destroyed irrespective of the laser configuration. The Analyte laser ablation system is equipped with the two-volume ‘Helex’ laser cell, which ensures a rapid sample response rate and washout time and eliminates any spatial fractionation effects that occur within the sample chamber. Helium was supplied to the Helex cell and used as a carrier gas to transfer sample aerosol from the laser chamber to the ICP-MS. An additional argon gas was added to the carrier gas prior to sample introduction to the plasma. Testing was performed using a simple Tygon sample line from the chamber to the torch and comparing the performance with a sample homogenizing device (so called ‘squid’) to reduce spectral skew effects. No discernible difference in the accuracy or precision of isotope ratios was observed and, as such, all analyses were performed using the simple sample transfer line, which is less prone to accumulation of sample background.The Neptune-Plus MC-ICP-MS at LLNL is equipped with 10 Faraday detectors, 3 full-size secondary electron multipliers (SEMs), and 3 compact discrete dynode detectors (CDDs). The ion counting configuration is designed for isotopic analyses of uranium, enabling intense ion beams of the major uranium isotopes (238U and 235U) to be measured on Faraday detectors and minor isotopes (233U, 234U and 236U) to be measured using ion counters (Fig. S1†). Energy filters (or RPQs) on ion counter (IC)-1 and IC3 help to reduce scattering of ions and peak tailing that might affect accurate analysis of 234U and 236U. The 235U channel can be switched from Faraday to IC2 for low 235U materials, meaning that the detector configuration can be optimized for samples with varying 235U enrichment levels. The Neptune was fitted with high sensitivity cones (‘Jet’ sampler and ‘X’ skimmer) which increase sensitivity by ∼3 times over the standard (‘H’) cones. Faraday detectors were assigned with 1011 Ω resistors and Faraday preamplifier gain factors were measured prior to the start of each analytical session. Ion counter gain factors were calibrated during each session, as described in ESI-1.†
Samples were loaded into the laser ablation cell and the chamber was evacuated to remove air prior to filling with He carrier gas. After plasma ignition, the helium flow rates were set to ∼0.6 l min−1 in the Helex cell and ∼0.5 l min−1 in the internal sampling cup. These flow rates and the argon sample gas were then optimized by tuning on the National Institute of Standards and Technology (NIST) 610 glass, which contains ∼500 ppm U. Using a 50 μm spot size, frequency of 7 Hz and fluence of 2.1 J cm−2, a typical 238U intensity of 0.6–0.7 V was obtained, and instrument performance was evaluated at the start of each analytical session to ensure similar day-to-day performance. Typical instrument parameters used during LA-MC-ICP-MS analyses are provided in Table 1.
| Neptune MC-ICP-MS | Photon machines analyte | ||
|---|---|---|---|
| Sample cone | Jet | Helium 1 (main cell) | 0.6 l min−1 |
| Skimmer cone | X | Helium 2 (inner cup) | 0.5 l min−1 |
| Sample gas (Ar) | 0.9–1.05 l min−1 | Spot size (μms) | 40–85 |
| Aux gas | 0.8 l min−1 | Ablation frequency | 5–7 Hz |
| Cool gas | 16 l min−1 | Fluence (J cm−2) | 2.1–3.8 |
| Center mass | 254.15 | ||
| Integration time | 0.13–0.26 s | ||
| No. of integrations | 200–400 | ||
| Resolution (m/Δm) | Low (400) |
2.2. Samples and reference materials
The wide range of reference material isotopic compositions enables robust evaluation of our ability to characterize samples with variable 235U enrichment levels and minor isotope abundances. To be of value for in situ isotopic analyses, either for QC purposes or as calibration standards, their spatial heterogeneity must be assessed. This was previously performed using secondary ionization mass spectrometry (NanoSIMS) at LLNL, and the Naval Ultra-Trace Isotope Laboratory's Universal Spectrometer (NAUTILUS), which is a SIMS—Single-Stage Accelerator Mass Spectrometry (SIMS-SSAMS)21 at the U.S. Naval Research Laboratory.19 The average composition of multiple in situ analyses are presented in Table S2† and the degree of isotopic heterogeneity is represented by the reproducibility of the analyses (in-%). Based on these results, U-glass CAS-53-500 (∼50% 235U, 500 ppm) has the most homogenous 235U/238U composition, with relative uncertainties associated with duplicate 235U/238U analyses of up to 0.4%. To further assess the suitability of CAS-53-500 as a mass bias standard for laser ablation analyses, we made 20 in situ isotopic analyses of U that were performed systematically over a 0.5 mm by 0.5 mm grid. During each isotopic analysis the 238U and 235U intensities were initially >100 mV, with internal precision on the raw 235U/238U ratios of <0.03%. The external precision associated with the duplicate 235U/238U analyses were <0.1%, including drift in the raw ratios caused by shift in instrumental mass bias. This indicates that any isotopic heterogeneities in the CAS-53-500 glass are well below the % level precision that is expected for isotopic analyses of U in μm-sized particles. Although a U-doped silicate glass is not a true matrix matched standard with U3O8 particles, it can be assumed that slight discrepancies in mass bias between different analytes will be relatively inconsequential compared to the analytical uncertainty. Thus, given its subequal 235U and 238U abundances, well characterized minor isotope compositions, high U concentration (∼500 ppm), and relatively homogenous isotopic composition, we infer that CAS-53-500 is the best available U standard to use for correction of mass bias and ion counter gain effects during U isotopic analyses by LA-MC-ICP-MS.
2.3. Analytical protocol
The basic architecture of each analytical sequence was the same, irrespective of whether glasses or particles were being analyzed. Each series of unknowns were bracketed by replicate analyses of the CAS-53-500 standard used to correct for instrumental mass bias and ion counter gains. Isotopic data was then exported from the MC-ICP-MS in raw format and reduced using a bespoke data reduction code developed in R, an open-source statistical computing environment.22 This workflow enables rapid, reliable and reproducible reduction of laser ablation data while incorporating relevant sources of uncertainty into the final ratio results. More details about data collection parameters for glasses and U particles are provided below.2.4. Data reduction
Reduction of U isotopic data from the ablation of silicate glasses and U3O8 particles follow similar basic principles, requiring characterization of instrument backgrounds, isolation of raw data for each sample and standard, followed by application of correction factors for average blank, instrumental mass bias and ion counter gain. Solution based MC-ICP-MS analyses of U also apply additional corrections for peak tailing (i.e. the half-mass baseline), and U-hydride interference on 236U. However, given the relatively low precision of U isotopic analyses by laser ablation (i.e. %-level on 236U/238U), it is likely that any such corrections have negligible effect on the final isotope ratios. Moreover, it is not practical to perform an on-peak half mass baseline correction for in situ analyses that produce highly transient ion beams.For glass samples, isolation of the raw data and calculation of raw isotope ratios are relatively straightforward; after ∼5 s stabilization period the point-by-point U isotope data is simply averaged and the uncertainty is calculated as the standard error of the mean. Although U intensities decay during spot analyses, there is no accompanying drift in the U isotope ratios, consistent with the fact that simultaneous detection of ion beams overcomes the relatively stable changes in intensity generated by ablating down through a sample. Typical precision on the raw 235U/238U ratio generated from a single spot analysis on CAS-53-500 was 0.03–0.05% (2σ).
As described in Section 1, accurate and representative reduction of U particle data must overcome detrimental effects such as time lag differences between detectors and skewing of final isotopic data by anomalous low-level data points. Thus, simple averaging of point-by-point isotopic data produces final isotope ratios that are highly imprecise. Several methods have been used to overcome these challenges, including integrating the total signal for a given sample,14 synchronizing signals by using a linear regression slope6,7,14 and development of a finite mixture model.7 Despiking routines have also been developed to exclude data points with highly anomalous isotopic compositions.14 Here, we used the integration method to reduce U isotope data from individual particles. This is a relatively simple reduction method that effectively gives more weighting to data points with higher 23xU intensities, while also taking background intensities into account. Based on the scatter in the background prior to and after the sample signal we established a threshold value of 0.3 mV of 238U, above which we assume we are recording the U isotope signal associated with the particle rather than fluctuations in the background. Final uranium data was integrated for all data points with 238U intensity >0.3 mV. Uncertainties associated with these summed counts were estimated based on counting statistics. Typical uncertainties on 235U/238U for a single particle of U200 are 3–4 times lower than using the point-by-point reduction method. The procedures required to reduce U-particle data by the integration method and the assignment of representative internal uncertainties are detailed below:
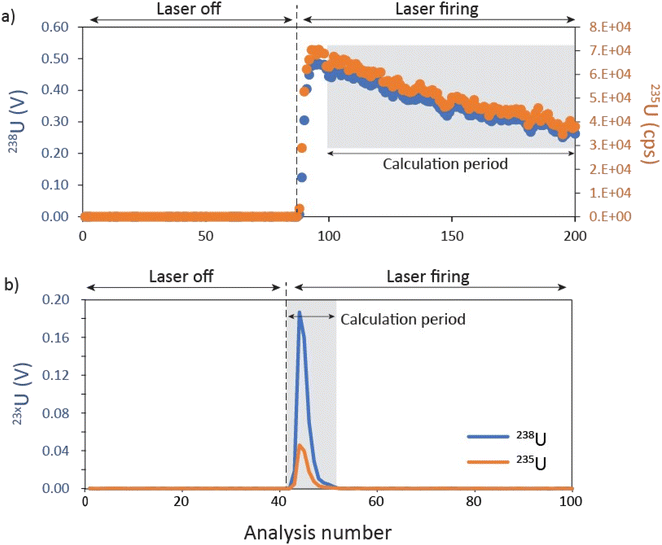
(i) Sample intensities/voltages are summed over the data collection period where 238U > 0.3 mV (Fig. 1b).
(ii) Integrated Faraday signals for 238U and 235U are converted into intensities (cps) assuming that 1 mV = 62![[thin space (1/6-em)]](https://www.rsc.org/images/entities/char_2009.gif) 415 counts per second (cps).
415 counts per second (cps).
(iii) Uncertainties associated with the integrated sample signal are calculated as follows:
| Std. Uncert. 23xUsample = √∑ 23xUsample | (1) |
However, eqn (1) underestimates uncertainty in practice, because it does not take into account noise from the detector. This consideration is particularly important for isotopes measured by Faraday detector as mV signals equate to count rates of 10's–100's k cps, which generate very low uncertainties based solely on counting statistical assumptions. Because mV-level signals are close to background levels on the Faraday detectors, any instability in that background signal adds a significant additional uncertainty to the final sample analysis and must be explicitly incorporated. To this end, total 23xU background counts for each isotope are calculated using eqn (2), where σ23xU is the standard deviation of the background for isotope 23xU (in cps), and N23xUsample is the number of data points that are integrated for each sample.
| ∑ 23xU = σ23xUbackground × N23xUsample | (2) |
(iv) The sample and background uncertainties are then summed to obtain a final measurement uncertainty for each isotope:
| Std. Uncert. 23xUTotal = Std. Uncert. 23xUsample + ∑ 23xU | (3) |
(v) The final uncertainties for each ratio are then calculated using eqn (4):
 | (4) |
Once raw data and associated uncertainties are obtained for glass and/or particle samples, those data must be corrected for mass bias effects and differences in ion counter performance (i.e. the ion counter gain). These correction factors are not constants, but rather change both between and within individual analytical sessions, which must be accounted for during setup of the analytical routine and during data processing. Detailed description of how these correction factors were calculated are provided in ESI-1.†
Due to the large amount of data generated by laser ablation analyses and the complexity involved with accurate correction of the data, an automated data reduction script was written in the statistical programming language R22. This approach ensured a robust and consistent treatment of U isotopic data and associated uncertainties for all samples and standards.
3. Results and discussion
3.1. Isotopic analyses of U in silicate glasses by LA-MC-ICP-MS
Summarized results of the isotopic analyzes of NIST-610 and the three U-doped glass standards are provided in Table 2, with corrected ratios provided in Table S4† and plotted in Fig. S3 and S4.†| 234U/238U | 2σ | RSD (%) | Offset (%) | 235U/238U | 2σ | RSD (%) | Offset (%) | 236U/238U | 2σ | RSD (%) | Offset (%) | |
|---|---|---|---|---|---|---|---|---|---|---|---|---|
| NIST 610 | 0.0000107 | 0.0000004 | 3.51 | 13.4 | 0.0023544 | 0.0000032 | 0.14 | −1.7 | 0.0000445 | 0.0000005 | 1.20 | 3.3 |
| CAS3-94-500 | 0.1701 | 0.0010 | 0.60 | 1.1 | 16.101 | 0.025 | 0.16 | 1.2 | 0.05090 | 0.00041 | 0.81 | 1.2 |
| SAC-53-50 | 0.007823 | 0.000037 | 0.48 | 0.2 | 1.1004 | 0.0015 | 0.14 | 0.2 | 0.005518 | 0.000035 | 0.64 | 0.4 |
| SAC-53-500 | 0.007995 | 0.000042 | 0.53 | −0.3 | 1.12601 | 0.00039 | 0.03 | −0.2 | 0.005652 | 0.000034 | 0.61 | 0.1 |
![[thin space (1/6-em)]](https://www.rsc.org/images/entities/char_2009.gif) 000), which allowed polyatomic interferences to be resolved from the various isotopes of uranium. NIST-610 is well known to have an elevated Pt content due to its preparation in a Pt–Rh lined furnace24 and the polyatomic species 194Pt40Ar+ and 196Pt40Ar+ would be difficult to resolve from 234U and 236U at low resolution. Although the Neptune-plus at LLNL is capable of performing isotopic analyses at high resolving power, this reduces the transfer of ions through the mass spectrometer by up to a factor of 10, which is problematic given the sample-limited nature of particle analyses. Because NIST 610 has only trace amounts of 234U and 236U (isotopic abundances of <50 ppm) and uniformly high trace element concentrations (400–500 ppm), the minor U isotope ratios are far more susceptible to interferences generated by polyatomic species than either the in-house glass standards or U-oxide particles. New generations of MC-ICP-MS are utilizing collision cell technology to remove potential interferences and matrix elements online, which could help to improve laser ablation capabilities in the future for samples with complex matrices.
000), which allowed polyatomic interferences to be resolved from the various isotopes of uranium. NIST-610 is well known to have an elevated Pt content due to its preparation in a Pt–Rh lined furnace24 and the polyatomic species 194Pt40Ar+ and 196Pt40Ar+ would be difficult to resolve from 234U and 236U at low resolution. Although the Neptune-plus at LLNL is capable of performing isotopic analyses at high resolving power, this reduces the transfer of ions through the mass spectrometer by up to a factor of 10, which is problematic given the sample-limited nature of particle analyses. Because NIST 610 has only trace amounts of 234U and 236U (isotopic abundances of <50 ppm) and uniformly high trace element concentrations (400–500 ppm), the minor U isotope ratios are far more susceptible to interferences generated by polyatomic species than either the in-house glass standards or U-oxide particles. New generations of MC-ICP-MS are utilizing collision cell technology to remove potential interferences and matrix elements online, which could help to improve laser ablation capabilities in the future for samples with complex matrices.
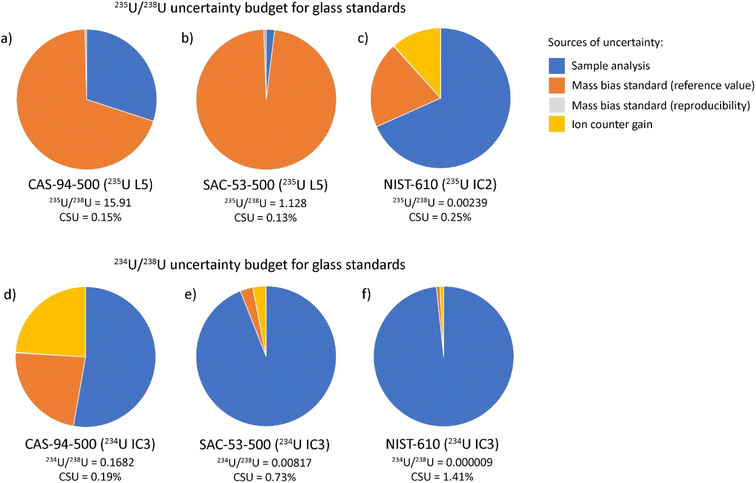
As shown in Fig. 2a–c, the uncertainty budget for 235U/238U is highly dependent on the isotopic composition of U in the glass. For SAC-53-500, there are subequal amounts of 235U and 238U, meaning voltages produced for both isotopes are relatively high (>100 mV) and the error associated with the sample measurement is ∼2% of the final uncertainty. Instead, the uncertainty of the isotopic composition of the mass bias standard accounts for ∼98% of the error. This indicates that changes in data collection or experimental parameters would not greatly improve the final CSU of the isotopic analyses. The analytical uncertainty associated with the raw ratios becomes more important where there is greater disparity in the contents of 235U and 238U, accounting for ∼30% of the total uncertainty in CAS-94-500. For NIST-610, the 235U signal is measured by ion counter and the sample measurement contributes the dominant source of uncertainty (∼70%).
The uncertainty budget for the minor isotope ratios (234U/238U and 236U/238U) are dominated by uncertainty associated with the sample analysis, which accounts for >50% of total uncertainty for the four glass samples (Fig. 2d–f). In detail, our analyses show that glasses with higher minor isotope abundances give higher precision 234U/238U and 236U/238U ratios, as is expected given that higher 234U and 236U contents generate higher count rates. Thus, the sample with the highest 234U and 236U contents (CAS-94-500) has the lowest fraction of the total uncertainty budget from the sample analysis.
3.2. U-particle analyses
| 234U/238U | 2σ | RSD (%) | 235U/238U | 2σ | RSD (%) | 236U/238U | 2σ | RSD (%) | |
|---|---|---|---|---|---|---|---|---|---|
| All data (n = 49) | 0.00148 | 0.00050 | 34.0 | 0.2517 | 0.0062 | 2.5 | 0.00242 | 0.00083 | 34.3 |
| Outliers excluded (n = 40) | 0.001549 | 0.000031 | 2.0 | N/A | N/A | N/A | 0.00255 | 0.00010 | 3.8 |
| Reference value16 | 0.0015661 | 0.0000021 | 0.1 | 0.25119 | 0.00025 | 0.1 | 0.0026549 | 0.0000019 | 0.1 |
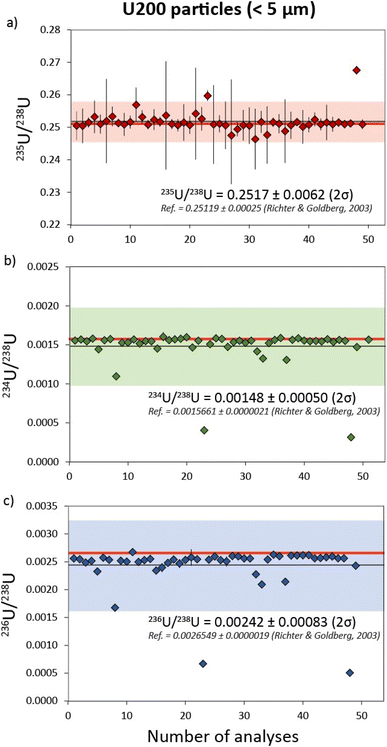 | ||
| Fig. 3 Uranium isotope systematics for 49 separate U200 particles with 235U/238U, 234U/238U and 236U/238U data in (a), (b) and (c) respectively. Reference isotope ratios (red) are taken from Richter & Goldberg.16 Uncertainties are 2σ. | ||
In contrast to 235U/238U, the measured minor U isotope ratios (234U/238U and 236U/238U) exhibited a greater degree of scatter, equating to RSDs (2σ) of ∼34%. However, much of this apparent variability was generated by a subset of U200 particles with 234U/238U ratios that covary with 236U/238U and fall outside of uncertainty from the main sample population (Fig. 4). This indicates that the U200 material was mixed with a contaminant that was relatively depleted in 234U and 236U contents (Fig. 4a) and, to a lesser extent, relatively enriched in 235U (Fig. 4b). If the particles that fall on this correlation line are excluded, the reproducibility of 234U/238U and 236U/238U values in the remaining populations are improved to 2 and 3.8% respectively (Table 3). The origin of this contaminant phase cannot currently be ascertained. In theory, it may be inherent to the U200 reference material or was added during sample preparation at LLNL. The two-component mixing array is likely to reflect variable agglomeration of particles with these two isotopically distinct U compositions. At the bulk level, this contaminant phase is unlikely to be significant as it only imparts minor variations to the U isotope ratios and the heterogeneities are only observed in a subset of U particles (∼20%). However, this neatly illustrates the effectiveness of characterizing U-isotope ratios at the particle scale by laser ablation MC-ICP-MS and the potential for identifying isotopic signatures that may not be apparent using bulk dissolution techniques.
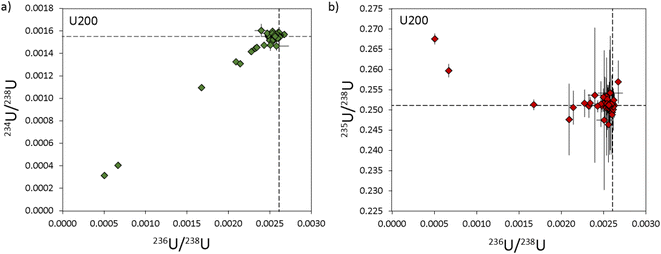 | ||
| Fig. 4 Three isotope plots of the uranium composition in U200 particles with 234U/238U vs.236U/238U in (a) and 235U/238U vs.236U/238U in (b). Reference values (dashed lines) are from Richter & Goldberg.16 All uncertainties are 2σ. | ||
| Isotopic composition | 234U/238U | 2σ | 235U/238U | 2σ | 236U/238U | 2σ |
|---|---|---|---|---|---|---|
| a Reference values from LG-SIMS analyses are from Scott et al.18. | ||||||
| Laser ablation (235U IC2) | 0.0000071 | 0.0000025 | 0.001677 | 0.000030 | 0.000078 | 0.000014 |
| Laser ablation (235U L5) | 0.0016 | 0.0013 | ||||
| LG-SIMS (single particle)a | 0.0000068 | 0.0000035 | 0.00173 | 0.00010 | 0.0000807 | 0.0000086 |
| LG-SIMS (particle mapping)a | 0.0000088 | 0.00174 | 0.000079 | |||
| Isotopic distribution | 234U | 235U | 235U | 235U | ||
|---|---|---|---|---|---|---|
| Laser ablation (LLNL) | 0.00071% | 0.1674% | 0.0078% | 99.82% | ||
| LG-SIMSa | 0.00068% | 0.1720% | 0.00804% | 99.640% | ||
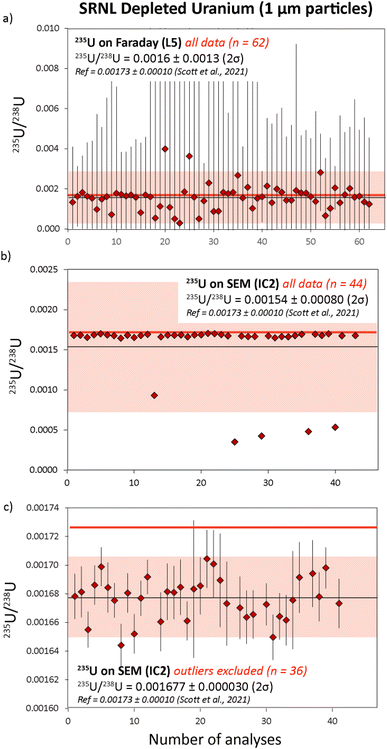 | ||
| Fig. 5 235U/238U ratios measured in SRNL-DU particles. In (a) the 235U was analyzed using the L5 Faraday. In (b) the 235U content was measured using IC2, and the final 235U/238U average with five outliers excluded are in (c). Reference isotope ratios (red) are taken from Scott et al..18 All uncertainties are 2σ. | ||
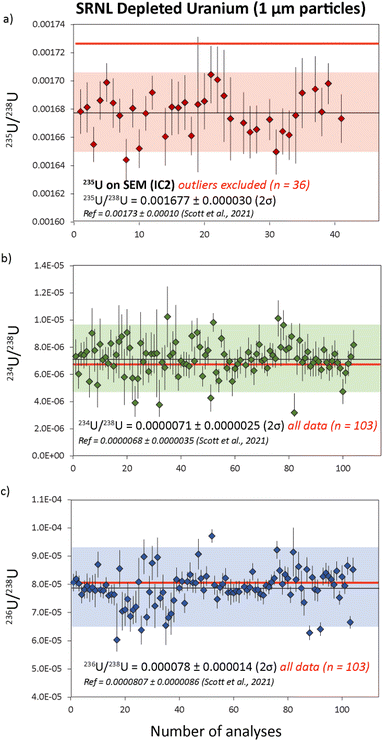 | ||
| Fig. 6 Uranium isotope data from replicate analyses of SRNL-DU particles with 235U/238U, 234U/238U and 236U/238U data in (a), (b) and (c) respectively. Five outliers were rejected from the 235U/238U population based on 2σ of the mean. Samples with outlying 235U/238U ratios did not have outlying 234U/238U and 236U/238U ratios. Reference isotope ratios (red) are taken from Scott et al..18 All uncertainties are 2σ. | ||
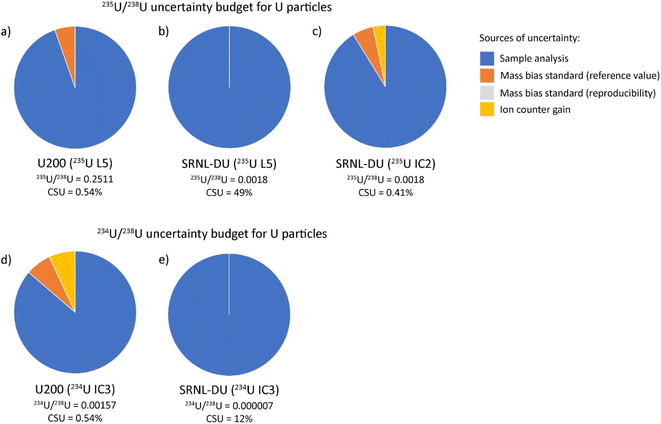
The SRNL-DU sample has a 235U content of 0.1720 ± 0.0104%, meaning the 235U content is highly depleted compared to either natural U or U200. Maximum 235U signals on the L5 Faraday were 3–4 mV, which is difficult to resolve from the background noise on the detector. Consequently, the 235U/238U ratios obtained with 235U on the L5 Faraday were highly dispersed, with an average ratio of 0.0016 ± 0.0013 (2σ) from 62 measurements (Fig. 5a). After 2σ outlier rejection, the statistics were improved slightly to 0.0015 ± 0.0010 (2σ) from 60 measurements. This equates to an RSD of 67%, a value that is broadly consistent with internal CSU values that range between 50–200%. Although the Faraday–Faraday 235U/238U data are highly imprecise, we note that they are within uncertainty of the reference value for SRNL-DU. As would be expected, the 235U/238U ratios generated with 235U on IC2 were far more precise. In this case, typical 235U counts on IC2 were ∼10–12k cps, which were easily measurable above background levels (<5 cps). If all data were included, we obtained a final average 235U/238U ratio of 0.00154 ± 0.00080 (2σ), as shown in Fig. 5b. The large RSD (53%) is driven by a subset of samples with relatively depleted 235U contents, that fall outside of the 2σ uncertainty associated with the mean (Fig. 5b). If we apply a 2σ outlier rejection, the average 235U/238U value of the main population is more precisely defined, with a value of 0.001677 ± 0.000030 (2σ), which equates to an RSD of 1.8% (Fig. 5c). This is slightly lower, although still within uncertainty of the reference value obtained by LG-SIMS on this material,18 as presented in Table S3.† The small offset in 235U/238U measured by laser ablation is likely to reflect the use of a constant gain factor to correct 235U measurements on IC2. This technique is sensitive to changes in ion counter performance between analytical sessions that would generate small differences in the 235U/238U ratio (see ESI-1† for more details). To overcome this, we recommend use of a secondary glass standard with depleted 235U contents to calculate the IC2 gain factors during each session. The question of which detector to use for 235U measurements in an operational scenario is a key consideration. In such a case the isotopic composition of particles will be unknown and potentially have variable 235U enrichment levels. Samples with high 235U enrichments are likely to saturate the ion counter, preventing accurate isotope ratios from being attained. Thus, collecting 235U data on the Faraday detector is the safest and more generalizable option, despite the poor precision for samples with depleted 235U contents. Future implementation of newly developed amplifiers with 1013 Ω resistors could help to extend the dynamic range of Faraday detectors to the mV-range, i.e. decreasing the signal-to-noise ratio for low ion beams. If so, this could be a viable method to ensure percent-level U isotopic data be achieved largely independent of the U isotopic composition of an unknown sample.
The cause of anomalous 235U/238U ratios measured with 235U on the L5 ion counter are difficult to constrain. Unlike U200, where isotopic heterogeneities in 234U, 235U and 236U covary (Fig. 4a), the heterogeneities in SRNL-DU are only evident in the 235U/238U ratio (Fig. 7a). The five DU particles with low 235U/238U ratios (<0.001) do not have anomalous 234U/238U and 236U/238U ratios, indicating that the low 235U/238U ratios derive from depletions in 235U, rather than simple addition of material with high 238U. Although anomalous 235U/238U values could be analytical in origin, it is unclear what process could cause suppression of the 235U signal during mass spectrometry. Maximum 235U intensities for SRNL-DU were between 10–20k cps, which are far too low to have caused saturation of the detector or been affected by detector dead time. Although 235U/238U ratios were also characterized using the Faraday detectors, the relatively poor precision means we cannot resolve whether similarly anomalous ratios were produced using a different detector. Peak tailing effects from a high 238U beam would potentially be problematic for a highly 235U-depleted sample, but this would cause minor isotope ratios to increase and be more prominent on the 236U/238U ratio, neither of which are consistent with our observations. The alternative is that the data is accurate and reflects a subset of samples with very low 235U/238U ratios within the deposited U3O8 particle population. However, current analysis of SRNL-DU by LG-SIMS has not identified such a contaminant phase (Scott et al. 2021) and would require further characterization of the sample using better imaging techniques and/or secondary ion mass spectrometry (SIMS) for verification. Furthermore, it is difficult to invoke a contaminant phase with an anomalous 235U/238U ratio but 234U/238U and 236U/238U ratios that are identical to the main sample population. Resolving why a subset of U particles have anomalous 235U/238U ratios is critical for future implementation of LA-MC-ICP-MS for particle analyses.
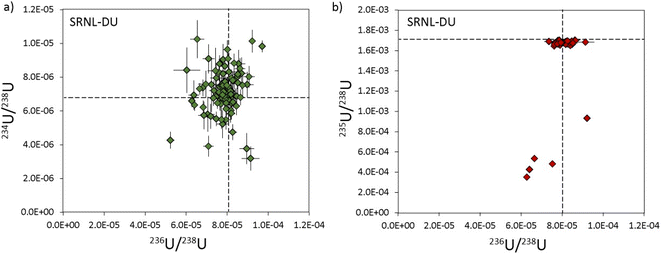 | ||
| Fig. 7 Three isotope plots of the uranium composition in SRNL-DU particles with 234U/238U vs.236U/238U in (a) and 235U/238U vs.236U/238U in (b). Reference values (dashed lines) are from Scott et al..18 All uncertainties are 2σ. | ||
The average 234U/238U and 236U/238U ratios obtained from SRNL-DU particles were 0.0000071 ± 0.0000025 (2σ) and 0.000078 ± 0.000014 (2σ) respectively, from 103 measurements (Fig. 6). If a 2σ outlier rejection is applied, the final average 234U/238U and 236U/238U ratios are 0.0000072 ± 0.0000018 (2σ) and 0.000079 ± 0.000010 (2σ) from a total of 96 and 95 analyses, respectively. These values equate to external precisions of 25 and 13% respectively for 234U/238U and 236U/238U. These values are within uncertainty of the reference values obtained using LG-SIMS18 (Table 4). This indicates that LA-MC-ICP-MS is capable of characterizing abundances of 234U and 236U in U particles at the <10 and 80 ppm level, demonstrating that accurate isotopic data can be obtained from count rates in the 10's to 100's of cps.
3.2.4.1. Laser ablation studies. Our results show that accurate U isotope data with %-level precision can be obtained for U particles with significant differences in their isotopic compositions. This is consistent with previous studies that obtained U isotope data with %-level precision from μm sized particles of natural U7,15 and the NIST U-oxide standard U050.15 However, the previous studies investigated a limited range of isotopic compositions and could not adequately investigate the capability to analyze the 236U/238U ratio, due to a lack of 236U in natural U samples. Our current study has increased the range of isotopic compositions that have been successfully characterized by LA-MC-ICP-MS by two orders of magnitude (Fig. 9), including more robust constraints on the 236U/238U ratio. Thus, current laser ablation studies have successfully measured the isotopic composition of U-oxide particles with 235U contents ranging from highly depleted (0.16%) to moderately enriched (25%), which is critical for future use of this technique for characterizing the isotopic composition of U-particles with unknown, but potentially variable, isotopic compositions. One caveat is that current work has focused exclusively on the ability to analyze U in relatively pure substrates, in which U is the dominant component. Particles encountered during environmental testing may have other matrices (e.g. silicates, other metals), within which U is a trace component. As shown from our analyses of U in NIST-610, such materials may be more challenging for accurate isotopic analyses of U by laser ablation, particularly for minor isotope abundances.
 | ||
| Fig. 9 Comparison between known and measured U isotopic measurements in uranium particles studied here (closed symbols) and in previous studies (open symbols).7,15 Data for 234U/238U, 235U/238U and 236U/238U are presented in (a), (b) and (c) respectively. As shown, the analyzes of U in SRNL-DU and U200 have greatly increased the range of isotopic compositions that have been characterized in U-particles by LA-MC-ICP-MS. | ||
3.2.4.2. SIMS. On average, the accuracy and precision of U isotope measurements by laser ablation were similar to data obtained by LG-SIMS for the SRNL-DU standard (Table 4). Previous work by Esaka et al.2 analyzed 0.6–4.2 μm particles of U050 by SIMS (IMS-6f) which collected U isotopic data by peak jumping, in contrast to simultaneous collection by LG-SIMS. Their results showed a strong relationship between isotopic measurement precision and particle size but RSDs associated with the 235U/238U ratios of individual particles typically range from 1–2%, which is similar to the laser ablation results (see Tables S5 and S6†). Given that samples for laser ablation have limited sample preparation requirements and isotopic analyses can be performed by rastering over a planchet without prior sample identification or sample characterization, it is clear that LA-MC-ICP-MS can potentially address a niche for rapid isotopic analyses of U particles that is difficult to match by other techniques. A limited comparison of data quality between LA-MC-ICP-MS and SIMS shows that the attained U isotopic data is both accurate and obtained with similar precision (at the %-level).
Although LA-MC-ICP-MS can obtain U isotopic data that matches SIMS for a single particle, we recognize that there are inherent advantages to SIMS that laser ablation cannot match. The first involves the mapping capability of SIMS, which enables an operator to rapidly triage the initial particle population and select individual particles of interest to study in more detail. The second is that SIMS is inherently a less destructive technique than laser ablation, meaning that a particle of interest can be analyzed multiple times if necessary, which might be required if an anomalous isotopic composition is encountered. Because μm-scale particles are completely consumed during laser ablation, the technique must be thoroughly standardized and have undergone appropriate quality control testing in order to evaluate the isotopic compositions in a sample population with confidence.
4. Conclusions
Results of method development and testing at LLNL demonstrate that LA-MC-ICP-MS can achieve accurate U isotope ratio data for silicate glasses and μm sized U-particles. The results obtained from isotopic analyses of the four silicate glasses demonstrate that LA-MC-ICP-MS can produce U isotopic data that are accurate at the %-level, even for minor isotopes 234U and 236U. When operating with %-level precision, effects such as peak tailing and U-hydride formation are not discernible, even for a sample such as CAS-94-500 which contains >90% 235U. However, correction factors for mass bias and ion counter gain remain critical to obtaining accurate data, as typical correction factors shift isotope ratios by several %. The data from NIST-610 illustrate that the chemical composition of the sample analyte is a key consideration, both for trace element content and U isotopic composition.The ablation of μm scale U-particles is challenging due to the limited and transient U signal generated by each particle. Despite this, we show that it is possible to achieve accurate and precise 235U/238U ratios at the %-level from μm sized U-particles using LA-MC-ICP-MS. The technique is sufficiently sensitive to produce 234U/238U and 236U/238U ratios that closely match ratios and uncertainties produced by LG-SIMS. Testing on SRNL-DU demonstrates that 234U contents <10 ppm and 236U contents <80 ppm can be resolved in micron-scale particles of uranium. Ultimately, the results of this study indicate that LA-MC-ICP-MS is a promising technique that could be useful in support of the IAEA safeguards verification mission.
Conflicts of interest
There are no conflicts of interest to declare.Acknowledgements
This work was performed under the auspices of the U.S. Department of Energy by Lawrence Livermore National Laboratory under Contract DE-AC52-07NA27344. The work presented in this paper was funded by the National Nuclear Security Administration of the Department of Energy, Office of International Nuclear Safeguards. LLNL-JRNL-841588. Savannah River National Laboratory is managed by Battelle Savannah River Alliance, LLC under Contract No. 89303321CEM000080 with the U.S. Department of Energy. This manuscript has been authored by Lawrence Livermore National Security, LLC under Contract No. DE-AC52-07NA27344 with the US. Department of Energy. The United States Government, and the publisher, by accepting the article for publication, acknowledge that the United States Government retains a non-exclusive, paid-up, irrevocable, world-wide license to publish or reproduce the published form of this manuscript, or allow others to do so, for United States Government purposes.References
- C. Szakal, D. S. Simons, J. D. Fassett and A. J. Fahey, Advances in age-dating of individual uranium particles by large geometry secondary ion mass spectrometry, Analyst, 2019, 144(14), 4219–4232 RSC.
- F. Esaka, M. Magara, C. G. Lee, S. Sakurai, S. Usuda and N. Shinohara, Comparison of ICP-MS and SIMS techniques for determining uranium isotope ratios in individual particles, Talanta, 2009, 78(1), 290–294 CrossRef CAS PubMed.
- F. Esaka, K. Watanabe, T. Onodera, C. G. Lee, M. Magara, S. Sakurai and S. Usuda, Dependence of the precision of uranium isotope ratio on particle diameter in individual particle analysis with SIMS, Appl. Surf. Sci., 2008, 255(4), 1512–1515 CrossRef CAS.
- Y. Ranebo, P. M. L. Hedberg, M. J. Whitehouse, K. Ingeneri and S. Littmann, Improved isotopic SIMS measurements of uranium particles for nuclear safeguard purposes, J. Anal. At. Spectrom., 2009, 24(3), 277–287 RSC.
- E. E. Groopman, T. L. Williamson and D. S. Simons, Improved uranium particle analysis by SIMS using O3− primary ions, J. Anal. At. Spectrom., 2022, 37(10), 2089–2102 RSC.
- S. Kappel, S. F. Boulyga and T. Prohaska, Direct uranium isotope ratio analysis of single μm- sized glass particles, J. Environ. Radioact., 2012, 113, 8–15 CrossRef CAS PubMed.
- F. Claverie, A. Hubert, S. Berail, A. Donard, F. Pointurier and C. Pécheyran, Improving Precision and Accuracy of Isotope Ratios from Short Transient Laser Ablation-Multicollector-Inductively Coupled Plasma Mass Spectrometry Signals: Application to μm-Size Uranium Particles, Anal. Chem., 2016, 88(8), 4375–4382 CrossRef CAS PubMed.
- G. Craig, M. S. Horstwood, H. J. Reid and B. L. Sharp, ‘Blind time’–current limitations on laser ablation multi-collector inductively coupled plasma mass spectrometry (LA-MC-ICP-MS) for ultra- transient signal isotope ratio analysis and application to individual sub-micron sized uranium particles, J. Anal. At. Spectrom., 2020, 35(5), 1011–1021 RSC.
- Z. Varga, Application of laser ablation inductively coupled plasma mass spectrometry for the isotopic analysis of single uranium particles, Anal. Chim. Acta, 2009, 625(1), 1–7 CrossRef PubMed.
- N. S. Lloyd, R. R. Parrish, M. S. Horstwood and S. R. Chenery, Precise and accurate isotopic analysis of microscopic uranium-oxide grains using LA-MC-ICP-MS, J. Anal. At. Spectrom., 2008, 24(6), 752–758 RSC.
- F. Pointurier, A. C. Pottin and A. Hubert, Application of nanosecond-UV laser ablation– inductively coupled plasma mass spectrometry for the isotopic analysis of single subμm-size uranium particles, Anal. Chem., 2011, 83(20), 7841–7848 CrossRef CAS PubMed.
- F. Pointurier, A. Hubert and A. C. Pottin, Performance of laser ablation: quadrupole-based ICP-MS coupling for the analysis of single micrometric uranium particles, J. Radioanal. Nucl. Chem., 2013, 296(2), 609–616 CrossRef CAS.
- A. Hubert, F. Claverie, C. Pécheyran and F. Pointurier, Measurement of the isotopic composition of uranium μm-size particles by femtosecond laser ablation-inductively coupled plasma mass spectrometry, Spectrochim. Acta, Part B, 2014, 93, 52–60 CrossRef CAS.
- A. Donard, F. Pointurier, A. C. Pottin, A. Hubert and C. Pécheyran, Determination of the isotopic composition of micrometric uranium particles by UV femtosecond laser ablation coupled with sector-field single-collector ICP-MS, J. Anal. At. Spectrom., 2017, 32(1), 96–106 RSC.
- A. L. Ronzani, A. Hubert, F. Pointurier, O. Marie, N. Clavier, A. C. Humbert and N. Dacheux, Determination of the isotopic composition of single sub-μm-sized uranium particles by laser ablation coupled with multi-collector inductively coupled plasma mass spectrometry, Rapid Commun. Mass Spectrom., 2019, 33(5), 419–428 CrossRef CAS PubMed.
- S. Richter and S. A. Goldberg, Improved techniques for high accuracy isotope ratio measurements of nuclear materials using thermal ionization mass spectrometry, Int. J. Mass Spectrom., 2003, 229(3), 181–197 CrossRef CAS.
- S. Richter, H. Kühn, Y. Aregbe, M. Hedberg, J. Horta-Domenech, K. Mayer and K. Mathew, Improvements in routine uranium isotope ratio measurements using the modified total evaporation method for multi-collector thermal ionization mass spectrometry, J. Anal. At. Spectrom., 2011, 26(3), 550–564 RSC.
- S. M. Scott, A. T. Baldwin, M. G. Bronikowski, M. A. DeVore II, L. A. Inabinet, W. W. Kuhne and M. S. Wellons, Scale-up and production of Uranium-Bearing QC reference particulates by an aerosol synthesis method (No. SRNL-STI-2021-00350), Savannah River National Lab. (SRNL), Savannah River Site (SRS), Aiken, SC, United States, 2021 Search PubMed.
- K. Knight, J. Wimpenny, P. Weber, D. Willingham and E. Groopman, Low-Level Actinide Glasses for Spatial Analyses, Goldschmidt Abstracts, 2018, p. 1315 Search PubMed.
- G. R. Eppich, J. B. Wimpenny, M. E. Leever, K. B. Knight, I. D. Hutcheon and F. J. Ryerson, Characterization of Low Concentration Uranium Glass Working Materials (No. LLNL-TR-645481), Lawrence Livermore National Lab. (LLNL), Livermore, CA, (United States), 2016 Search PubMed.
- E. E. Groopman, D. G. Willingham, A. J. Fahey and K. S. Grabowski, An overview of NRL's NAUTILUS: a combination SIMS-AMS for spatially resolved trace isotope analysis, J. Anal. At. Spectrom., 2020, 35(3), 600–625 RSC.
- R Core Team, R: A Language and Environment for Statistical Computing, R Foundation for Statistical Computing, Vienna, Austria, 2021, https://www.R-project.org/ Search PubMed.
- A. M. Duffin, K. W. Springer, J. D. Ward, K. D. Jarman, J. W. Robinson, M. C. Endres and G. C. Eiden, Femtosecond laser ablation multicollector ICPMS analysis of uranium isotopes in NIST glass, J. Anal. At. Spectrom., 2015, 30(5), 1100–1107 RSC.
- A. M. Duffin, G. L. Hart, R. C. Hanlen and G. C. Eiden, Isotopic analysis of uranium in NIST SRM glass by femtosecond laser ablation MC-ICPMS, J. Radioanal. Nucl. Chem., 2013, 296(2), 1031–1036 CrossRef CAS.
Footnote |
| † Electronic supplementary information (ESI) available. See DOI: https://doi.org/10.1039/d2ja00403h |
| This journal is © The Royal Society of Chemistry 2023 |

