
 Open Access Article
 This Open Access Article is licensed under a
 Creative Commons Attribution 3.0 Unported Licence
Spectral library transfer between distinct laser-induced breakdown spectroscopy systems trained on simultaneous measurements†
J.
Vrábel
*ab,
E.
Képeš
ab,
P.
Nedělník
a,
J.
Buday
ab,
J.
Cempírek
c,
P.
Pořízka
*ab and
J.
Kaiser
ab
aCEITEC, Brno University of Technology, Purkyňova 123, Brno, 612 00, Czech Republic. E-mail: jakub.vrabel@ceitec.vutbr.cz; pavel.porizka@ceitec.vutbr.cz
bInstitute of Physical Engineering, Brno University of Technology, Technická 2, Brno, 616 00, Czech Republic
cDepartment of Geological Sciences, Faculty of Science, Masaryk University, Kotlářská 2, Brno, 602 00, Czech Republic
First published on 8th February 2023
Abstract
The mutual incompatibility of distinct spectroscopic systems is among the most limiting factors in laser-induced breakdown spectroscopy (LIBS). The cost related to setting up a new LIBS system is increased, as its extensive calibration is required. Solving this problem would enable inter-laboratory reference measurements and shared spectral libraries, which are fundamental for other spectroscopic techniques. We study a simplified version of this challenge where LIBS systems differ only in the spectrometers used and collection optics but share all other parts of the apparatus and collect spectra simultaneously from the same plasma plume. Extensive datasets measured as hyperspectral images of a heterogeneous rock sample are used to train machine learning models that can transfer spectra between systems. The transfer is realized using a composed model that consists of a variational autoencoder (VAE) and a multilayer perceptron (MLP). The VAE is used to create a latent representation of spectra from a primary system. Subsequently, spectra from a secondary system are mapped to corresponding locations in the latent space by the MLP. The transfer is evaluated using several figures of merit (Euclidean and cosine distances, both spatially resolved; k-means clustering of transferred spectra). We demonstrate the viability of the method and compare it to several baseline approaches of varying complexities.
1. Introduction
Laser-induced breakdown spectroscopy (LIBS) is an optical emission spectroscopic technique with rapid real-time sensing capabilities, providing reliable qualitative and semi-quantitative analysis. LIBS is gaining traction as a laboratory technique, e.g., for producing large (megapixel) high-resolution (tens of μm lateral resolution) hyperspectral images,1,2 with great relevance in biological,3 geological,4 and industrial settings.5 LIBS is often preferred for in situ analyses owing to its stand-off capabilities, robust instrumentation, and low demands on sample preparation. Consequently, LIBS is being used for extraterrestrial exploration, namely in the ChemCam device on the Curiosity rover,6 SuperCam on the Perseverance rover,7 and MarSCoDe on the Mars rover (Tianwen-1 mission).8As a trade-off for its instrumental robustness, LIBS exhibits a high sensitivity to changes in the analyzed target's topography9 and matrix.10 More importantly, LIBS is significantly affected by the changes in experimental conditions (such as ablation11,12 and collection geometry13). A complete list of physics-related factors responsible for the structure of spectra is beyond the scope of this work and was described elsewhere.14 The most prominent and easily recognizable changes in the spectrum's structure can be attributed to the spectrograph and camera. Namely, spectrographs commonly differ in their spectral range and resolving power. Similarly, pixel size and the related quantum efficiency of a detector affect the resolution and overall structure of detected spectra. While the detector's response can be addressed by intensity calibrations using standard light sources, corrections for the spectrograph's impact remain elusive.
Problems with non-trivial signal dependence on experimental conditions and instrumentation could be partially neglected for a simple qualitative analysis. Tasks such as element detection and sample classification require only a wavelength position-calibrated spectrograph and a sufficient resolution. Therefore, even cost-efficient spectrographs could provide adequate performance for qualitative applications.15 In contrast, a reliable quantitative analysis is significantly more demanding, with the necessity of spectral intensity correction, compensation for the matrix effects, and instrumental limitations. A common practice is to create a calibration curve from a set of known standards, which has limited extrapolation reliability. An intriguing alternative to calibration curves is calibration-free (CF) LIBS,16 where plasma emission models are used. Despite many efforts, the applicability of CF-LIBS to real-world tasks and general experimental conditions is disputable.
The challenges described up to this point concerned measurements on a single instrument. However, many applications would benefit from the cooperation of several systems and the combination of their outputs, i.e. the transfer of data libraries. A representative example is the ChemCam device mounted on the Curiosity Mars rover that has an exact copy operating on Earth.17 The compatibility of measurements from two distinct systems is the missing element for a trustworthy inter-laboratory comparison and creation of shared spectral libraries in the LIBS community. Both technical and physics-related limitations rule out generally valid transfer (as spectral ranges and resolving power of detectors may vary significantly). However, even a reasonable approximation would have great potential for the practice.
A method we propose forspectral transfer is based on a client-server relationship between a preferred primary system and one or possibly many secondary systems. We use a variational autoencoder (VAE) to find a latent representation of the primary system spectra, which is expected to abstract from the specifics of the primary system. Then a multilayer perceptron (MLP) is trained to map the corresponding spectral pairs from the secondary system to the latent representation of the primary system. The final model for the spectral transfer between the two systems is obtained by joining the MLP with the decoder part of the autoencoder. The transfer methodology is illustrated in Fig. 1. It should be noted that the latent space is identical for all participating secondary systems. As a result, the amount of data that needs to be exchanged to include a new secondary system or to enrich a possible shared library of spectra is greatly reduced (as opposed to an approach where the full spectral space of the primary system is shared and not only the latent space), leading to multiple practical advantages. Additionally, a shared, low-dimensional representation can be directly used to create shared calibration, classification, and clustering models or to enhance any efforts directed toward the interpretability of the data and utilized models. In future work, we plan to expand on this point further by introducing physics-relevant constraints on the latent space. Finally, the latent space formed by the VAE can be used to generate new spectra.
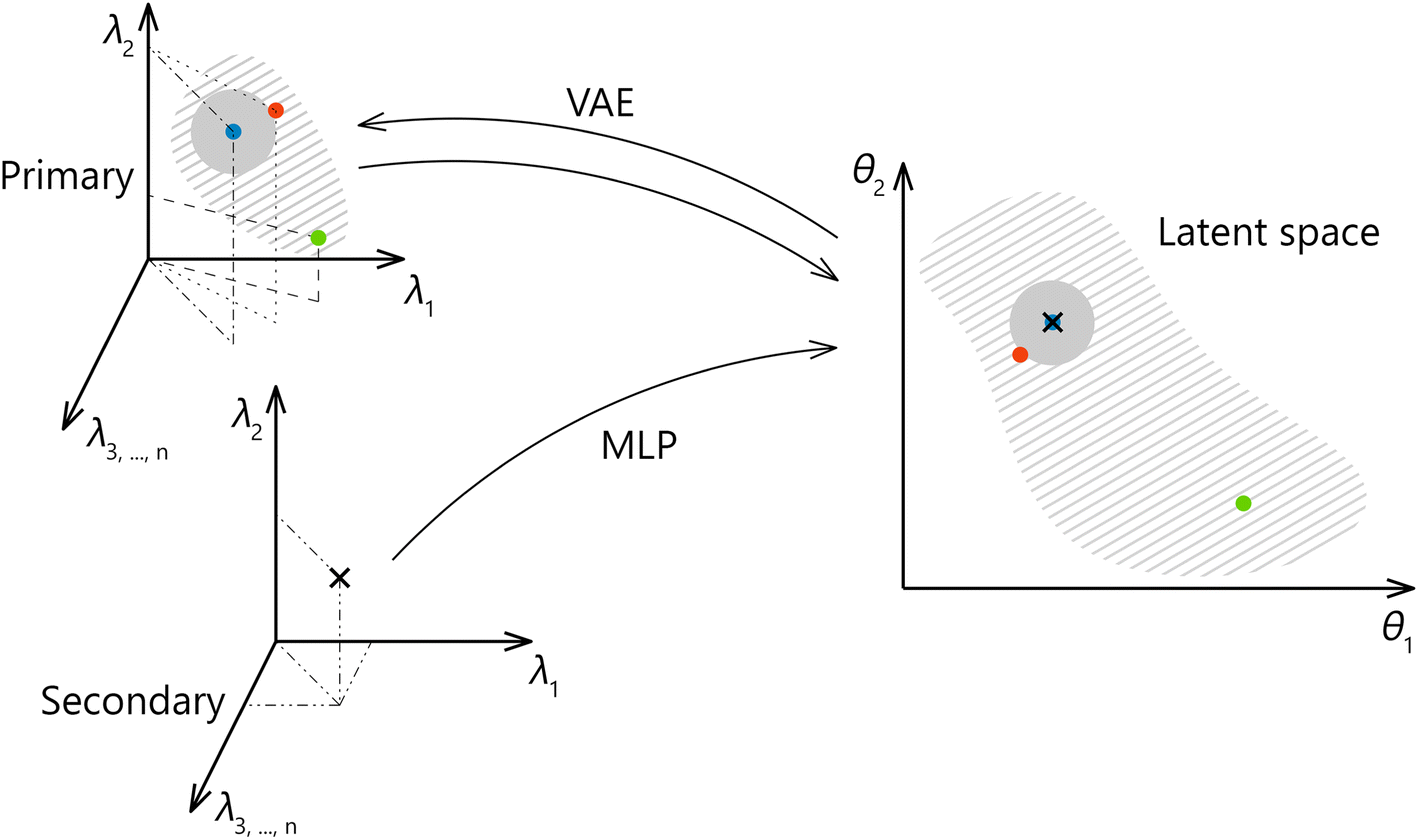 | ||
| Fig. 1 Schematic representation of the proposed transfer methodology. A latent representation is obtained from the primary system and later used for mapping spectra from the secondary system. Points from the latent space can be easily reconstructed back to the space of the primary system. | ||
We demonstrate that our methodology can efficiently transfer spectra (secondary → primary) even when the secondary system covers a considerably narrower spectral region. The performance is evaluated on out-of-sample data that were measured on a different day and location on the sample. Using multiple figures of merit, we compare the model to several baselines and provide a detailed analysis of the results.
Note that to establish transfer between the primary and the secondary systems, a one-to-one correspondence is required for training spectra. A common solution for this requirement is to use a set of shared standardized samples. A number of shared samples and their spectral variability determine the efficiency of the transfer. In practice, only a small number of shared samples are being used (max. tens) due to cost and unavailability of suitable standards. Even more, considering system fluctuations between the measurements of the standards and experimental error, the one-to-one correspondence is only approximate. We propose a novel approach for obtaining matched pairs of spectra, where we measure on both systems simultaneously from the same plasma plume. While this setup imposes certain limitations (e.g. a necessity of two systems being physically present together during the training phase, tedious synchronization, etc.), it creates the possibility to obtain an unprecedented amount of unique spectral pairs. This, in combination with the large-scale mapping of heterogeneous samples, allows us to precisely study the performance and limitations of the transfer between the given two systems.
2. Related work
The spectral transfer between two systems is often a crucial part of the so-called calibration transfer (CT), but the goal of each is different. In spectral transfer, we aim to have a minimum transfer error between predicted and real spectra on a given system. CT is an analytical approach to create a shared calibration model, which is built on a single spectral database.18 Note that this generally does not require transferring all the data but rather obtaining a specific feature response of the secondary system. Alternatively, the calibration model can be built in a low-dimensional embedding space, where data from both systems are aligned.19 CT was extensively studied in various spectroscopic branches (mostly in NIR and IR18) but has emerged in LIBS only relatively recently (see ref. 19 and 20). While the data complexity varies between distinct spectroscopic techniques (e.g., the number of effective features in NIR spectra is considerably lower than that in LIBS21), transfer approaches are analogical and extendable among the techniques.Considering mainly the CT approaches that utilize some form of the spectral transfer as a part of the process, the main contrasts between our work and prior efforts are the possibility of a higher discrepancy between studied systems and the use of non-linear techniques (up to the exceptions mentioned below, linear models were predominantly used in previous studies).
Similarly to our work, the authors of (ref. 22) transferred NIR spectra from a system with a narrow wavelength range to a broader one using the direct standardization (DS) method (with various regularizers). Major drawbacks of the DS approach are the impossibility to express a complex non-linear dependency between systems and high computational space complexity (scaling N × M, where N is the number of shared data samples and M is the dimension of spectra). The latter rules out its use for large shared datasets.
A non-linear approach (pseudo-autoencoder) was used in ref. 23 to transfer NIR spectra. However, the transfer was performed only between systems with matching wavelength ranges and similar spectral responses. Additionally, the term autoencoder is used incorrectly in the mentioned work. The model's architecture only resembles that of a standard autoencoder (by the presence of a bottleneck), but it was not trained or used as an autoencoder (i.e. for dimension reduction and reconstruction). The utilized model is an extreme learning machine (architecture and forward pass are analogical to the MLP but weights are not trainable), which was shown to be significantly outperformed by MLPs (trained by the stochastic gradient descent) for large datasets.24
In LIBS, CT was studied in ref. 19, as an example of a general manifold alignment problem. The authors proposed a novel method called low rank alignment (LRA) that creates a shared low-dimensional embedding space, where the distance between the corresponding spectral pair embeddings is minimized. LRA was used for CT on ChemCam spectra measured at two different energies, but the dimensions were the same for both setups. The calibration model was built in the embedding space on high-energy spectra and used for predictions on low-energy spectra. The reconstruction from the embedding space to the spectral space of each system was not provided. The performance of the transferred calibration model is only compared to another manifold alignment technique (affine matching), but the absolute value of RMSE is missing. Also, as the authors state, the method has cubic time complexity w.r.t. a number of data examples, which makes it unsuitable for large shared datasets.
Last to mention is our previous work,25 where we used an MLP to transfer spectra from the ChemCam to the SuperCam to improve calibration models for studied oxides. We were able to improve the RMSE over models that were trained solely on the SuperCam system. The focus was placed on calibration models, and the spectral transfer was not examined separately. Furthermore, we experienced certain limitations in the spectral transfer performance that are addressed in the present work by adding an intermediate step to the process (the VAE part).
The contribution of the present work is a novel spectral transfer methodology based on deep artificial neural networks (ANNs) that can process large shared datasets, works between systems with reasonably different dimensions (from lower to higher), and allows to connect more secondary systems to the same primary system. In addition, we present a unique way for obtaining unprecedentedly large datasets of corresponding spectral pairs, which results in more robust models for the spectral transfer.
3. Experiments and data
The LIBS instrumental setup consisted of two spectrometers (each with its own collection system) synchronized for simultaneous measurements and sharing the rest of the instrumental setup. Both spectrometers were Czerny–Turner type, with partially overlapping spectral ranges of different resolutions and sizes. Henceforth, we refer to the spectrometer with a broader spectral range, its collecting optics, and the rest of the instrumentation (laser, delay generator, …) as an experimental primary system. Analogically, the secondary system is the set containing a Czerny–Turner spectrometer with a narrower spectral range and shared parts. The collected datasets are denoted by Xprimary and Xsecondary, respectively. The setup diagram is shown in Fig. 2.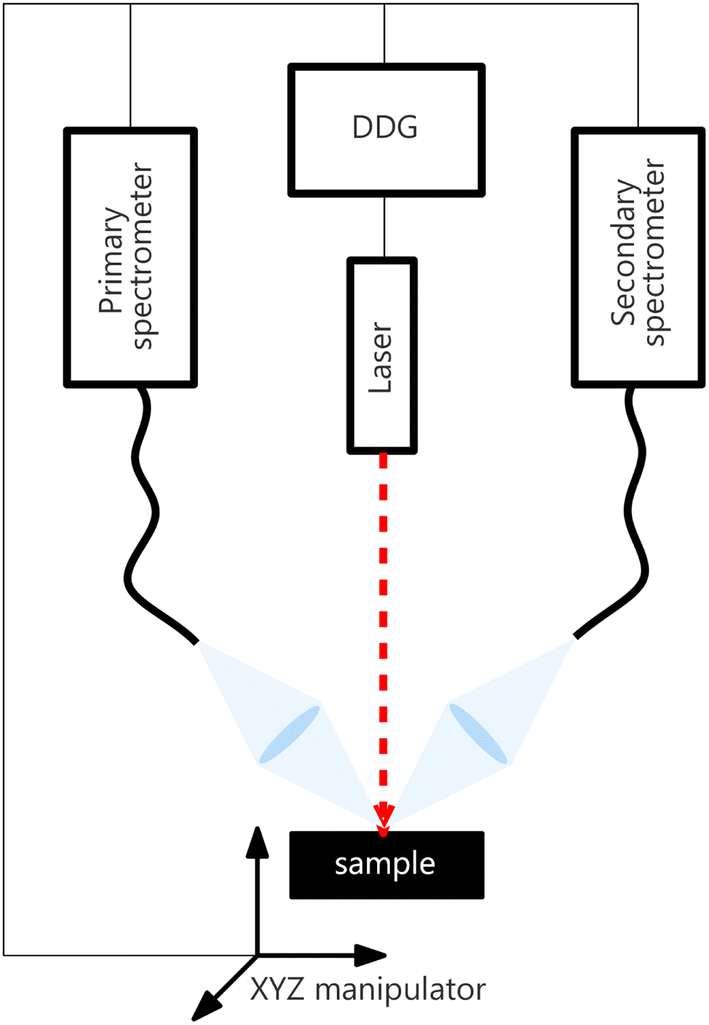 | ||
| Fig. 2 Illustration of the experimental setup. All devices (laser, motorized stage, and both spectrometers) are synchronized using a digital delay generator (DDG). | ||
To ensure a large variability of training data, we selected a heterogeneous rock sample (rare-element granitic pegmatite, further described below) and measured it in a mapping regime (i.e. raster over the sample surface, obtaining one spectrum from each spot). Each row (spectrum) xi,primary corresponds to the row xi,secondary, i.e., there is a one-to-one correspondence between the measurements, which were obtained from a slightly different spot of the same laser-induced plasma.
The test sample was cut from a strongly heterogeneous rock, classified as granitic pegmatite (locality Maršíkov D6e). Pegmatites are vein rocks specific by an extreme degree of chemical and textural fractionation, resulting in large contents of chemical elements that are otherwise rare in the Earth's continental crust. These include especially e.g. Li, Be, F, Rb, Cs, Ta, and Nb. The studied rock sample is mineralogically dominated by three minerals: quartz, albite, and muscovite. In subordinate amounts, it contains Fe–Mn garnet (almandine–spessartine), beryl, and Nb and Ta-oxides (columbite, fermite, and microlite).
All LIBS measurements were performed on a Firefly LIBS system (Lightigo, Czech Republic). The Firefly was equipped with a diode-pumped solid-state laser (266 nm, 5 ns, 50 Hz, 5 mJ) used for sample ablation and plasma generation. The laser beam was focused onto the sample (30 μm spot size) and plasma emission was then collected using a wide-angle objective and through an optical fiber bundle (400 μm core diameter), where each of the fibers collected radiation from a slightly different part of the plasma. Plasma emission was transferred to both Czerny–Turner spectrometers. The primary system ranged from 245 to 407 nm with a resolution varying from 0.035 to 0.046 nm, and for the secondary system from 260 to 370 nm with a resolution varying from 0.023 to 0.032 nm (see Fig. 4). The slit size was 25 μm for both spectrometers. Samples were placed onto a computer-controlled motorized stage. Spectra were acquired for each sampling position resulting in a raster with 40 μm spacing for training and 20 μm for the test dataset, in both X and Y axes.
The collected data from both systems were separated into three datasets; the training dataset (used for model training), the validation dataset (used for hyperparameter optimization and model validation during the training process), and the test dataset (used for final one-shot testing). To ensure that the results are representative of the performance on unseen data, each dataset corresponds to a separate measurement (out-of-sample evaluation) of a hyperspectral image. Their respective dimensions are 560 × 560 (training), 266 × 500 (validation), and 500 × 500 (test). Note that the test dataset was measured on a different day than the training and validation datasets. The sample photo with highlighted locations for each of the datasets can be seen in Fig. 3.
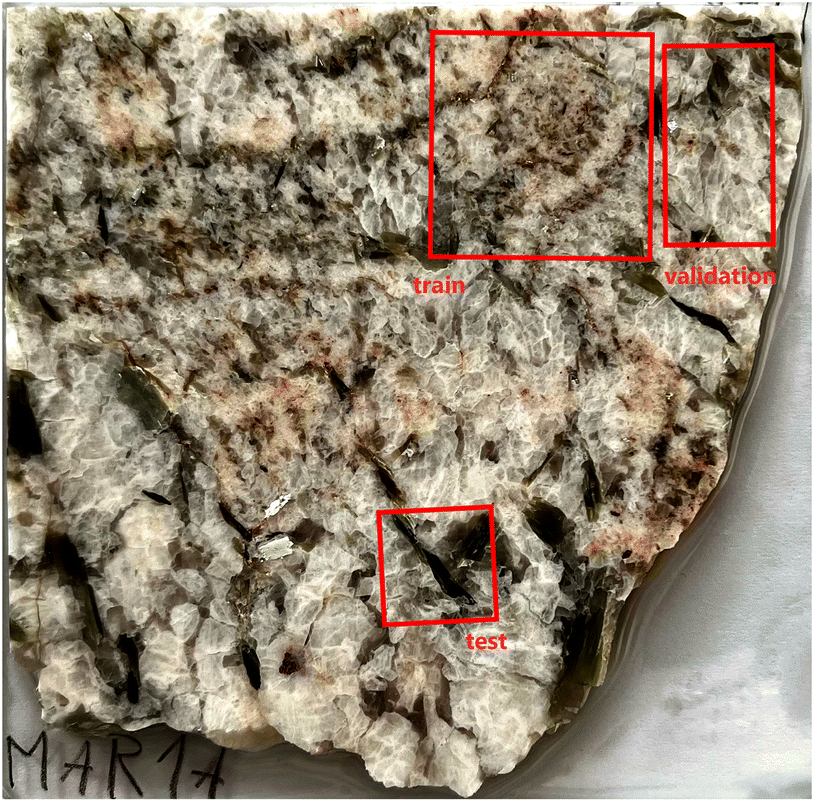 | ||
| Fig. 3 Photograph of the measured mineral sample. The highlighted regions correspond to the training, validation, and test datasets. | ||
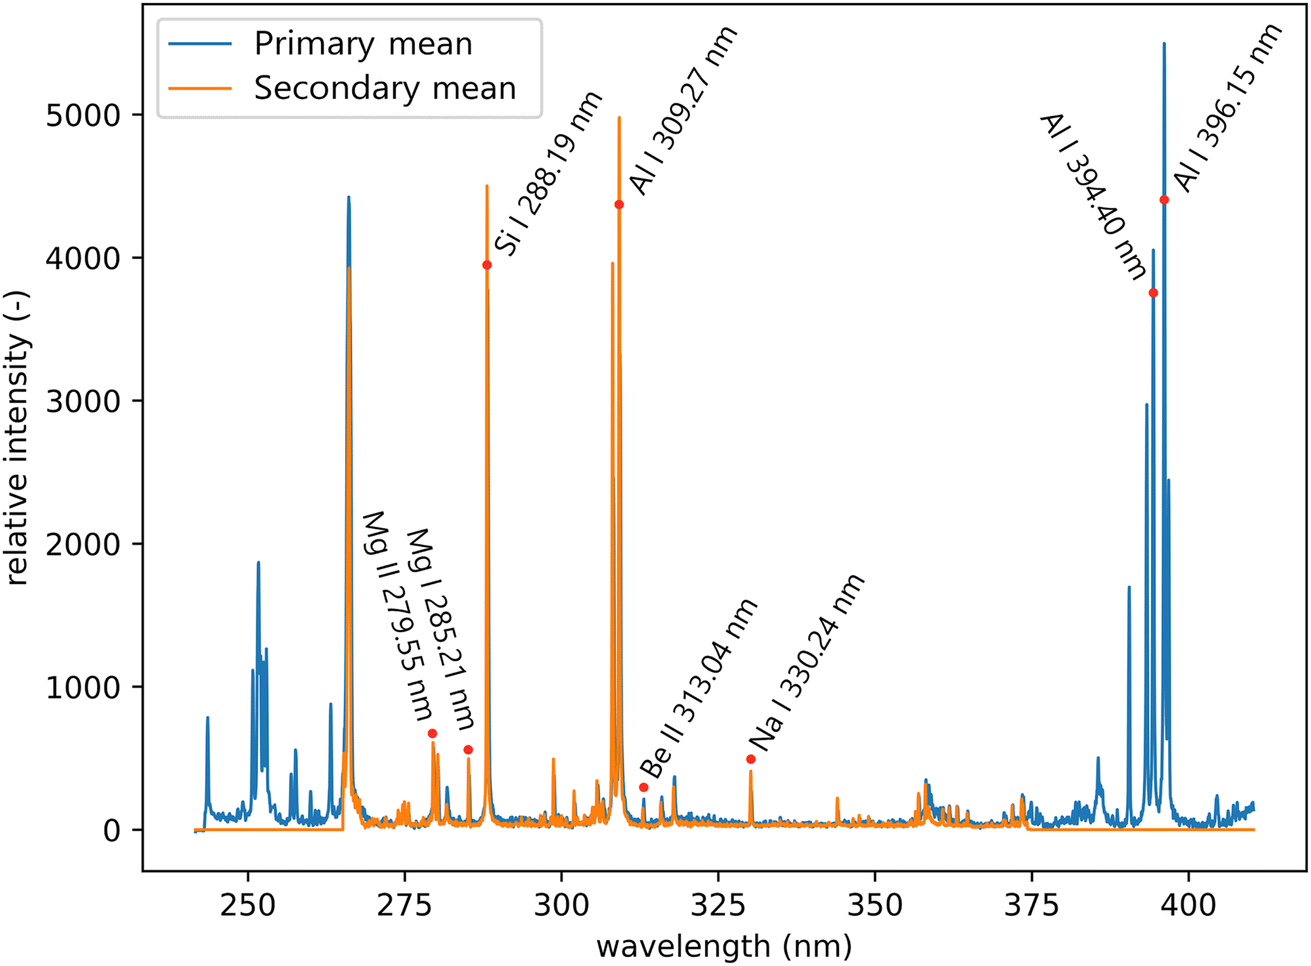 | ||
| Fig. 4 Mean spectra of the primary and secondary systems from the test dataset. Significant lines that are relevant to the sample composition are labeled. | ||
The training/validation/test datasets consist of 313![[thin space (1/6-em)]](https://www.rsc.org/images/entities/char_2009.gif) 600/133000/250000 spectra (about a 45–20–35% ratio) with 4062 and 3872 features for primary and secondary systems, respectively. For example, this means that the dimensions of the primary training dataset are
600/133000/250000 spectra (about a 45–20–35% ratio) with 4062 and 3872 features for primary and secondary systems, respectively. For example, this means that the dimensions of the primary training dataset are 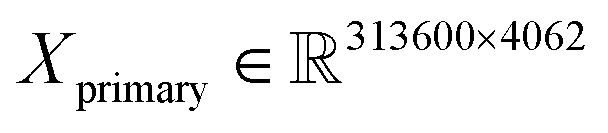 and
and 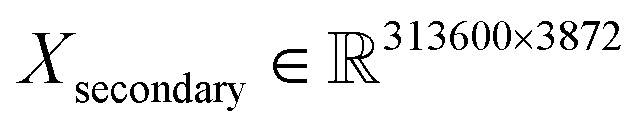 for secondary. The combined size of all the datasets is roughly 22 GB.
All spectra were baseline corrected by performing a sliding minimum operation followed by a sliding Gaussian mean smooth (window size 100 and smooth parameter 50).26 In addition, each dataset was individually mean-centered and scaled to feature-wise unit variance (standard scaling). This was performed to compensate for the significant shift in the baseline of the spectra from the training and the test datasets (see Fig. 5). Since the dataset's original mean and variance can be saved, this transformation is reversible and lossless. All results are presented in the unscaled form. Selected examples of raw and processed spectra are available in the Appendix.
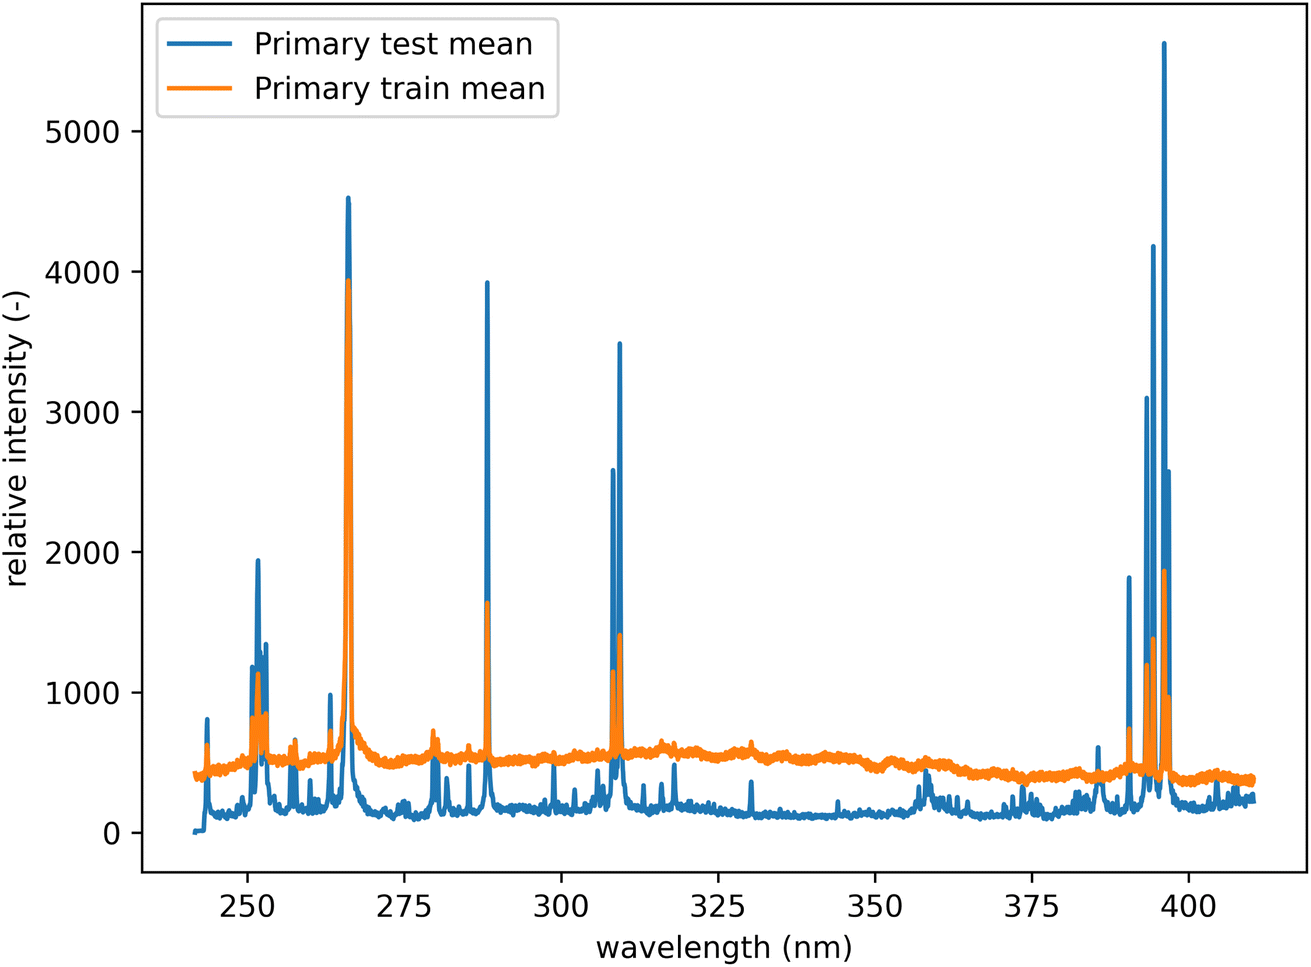 | ||
| Fig. 5 Mean spectra from the primary system before preprocessing. Comparison of test and training datasets. There is a notable shift in the baseline. | ||
4. Methodology
The envisioned application is to create a robust primary system that will be used to represent spectra from possibly many secondary systems. The primary system will be well-understood and hold an extensive spectral library. Thus, to transfer spectra between systems, we aim to find a mapping f: Xsecondary → Xprimary that gives a corresponding primary spectrum for each measurement in the secondary system. Considering the non-matching spectral ranges and resolutions of the two distinct experimental systems, the corresponding spectra Xprimary and Xsecondary may differ significantly. Since the mapping between the two spaces of different dimensions and spectral range coverages cannot be generally found, we obtain an effective mapping f′: Xsecondary →![[X with combining circumflex]](https://www.rsc.org/images/entities/i_char_0058_0302.gif) primary and utilize it for practical applications.
primary and utilize it for practical applications.
We propose a two-step approach: using a VAE (see Section 4.2), we obtain a (low-dimensional) latent representation of the data (denoted as Lprimary). In the second step, which is repeated for every secondary system, we train an MLP (see Section 4.1) to map the Xsecondary spectra to the latent space Lprimary. The second step requires the one-to-one correspondence of training spectra between the two systems. The ground truth vector for the MLP loss function is obtained from coordinates in the Lprimary (as illustrated in Fig. 6). Finally, by combining the shared decoder part of the VAE with the newly trained MLP we get the desired mapping f′. Parts of the proposed model are further explained below, followed by the evaluation methodology and baseline models for comparison.
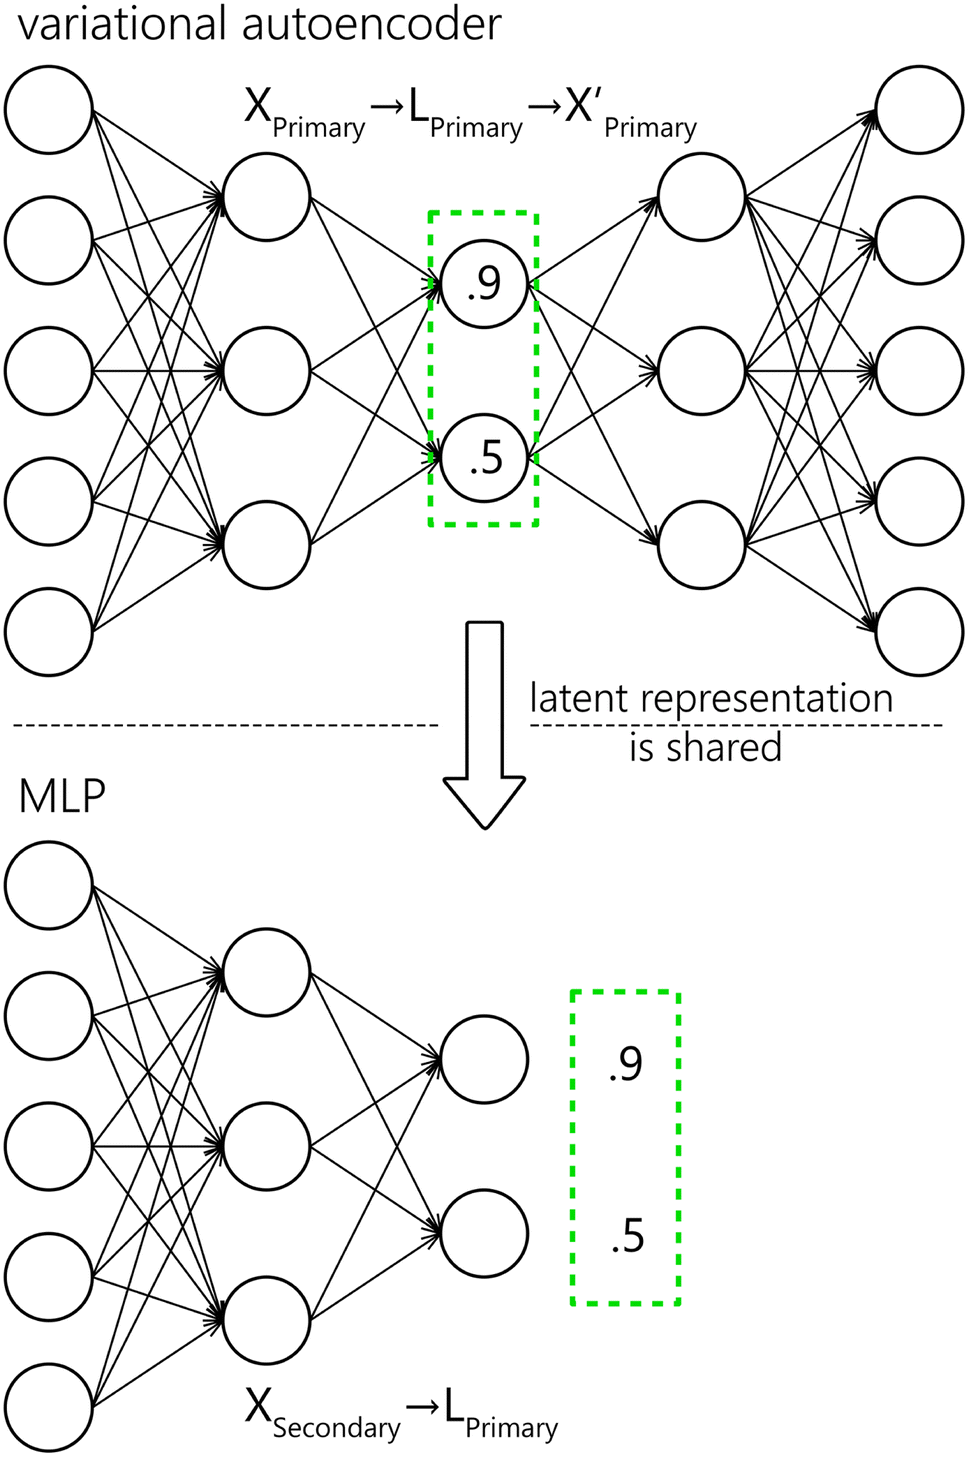 | ||
| Fig. 6 Schematic representation for the VAE and MLP. The latent encoding of the Xprimary is shared with the MLP as the ground truth for training. Values in the latent representation and neuron counts are only illustrational. | ||
4.1. Multilayer perceptron (MLP)
ANNs are computational models defined by their architecture and learning procedure.27 In general, they are composed of formal neurons (defined by a set of weights and activation functions) arranged into interconnected layers of set sizes – one input, one output, and possibly other hidden ones. These connections form the architecture of the network. ANNs can approximate any continuous function28 that relates the output of a network to its input. The output of the network is computed by a subsequent application of layers. Weights (i.e. parameters) of the network have to be learned in order to make relevant predictions, which is usually performed by a stochastic gradient descent algorithm with backpropagation.29 MLP30 is a well-established31,32 type of neural network architecture that is feed-forward (i.e. connections between the neurons do not form cycles) and fully connected (each neuron within every layer is connected to all neurons in the subsequent layer, with the exception of the output layer).In this work, the model hyperparameters (architecture and learning) were optimized on the validation data (see Section 3) with a hyperband algorithm.33 The considered domains, as well as other fixed hyperparameters, were selected heuristically, using prior experience with processing of spectroscopic data, along with non-exhaustive manual experimentation. The MLP is composed of two layers. For the first (second) layer 2048, 1024, 512, and 128 (1024, 512, and 128) neurons were considered, and 128 (512) was chosen by the optimization algorithm as the best. The leaky ReLU activation function was used in every layer except the last one that utilized a linear activation. Mean squared error with L2 regularization was used as the loss function. For training, the Adam optimizer was selected with a learning rate of 1 × 10⁻⁴, which was optimized from the following options: 1 × 10⁻³, 1 × 10⁻⁴, and 1 × 10⁻⁵. The model was trained for 100 epochs with early stopping set on validation loss and a batch size of 128. To reiterate, the inputs to the model are the Xsecondary spectra and the outputs are mapped as closely as possible to the corresponding Lprimary embeddings.
4.2. Autoencoder (AE)
Autoencoders are unsupervised deep learning models commonly used for tasks such as dimensionality reduction,34 data denoising,35 and others.36 Autoencoders are trained to encode and reconstruct the input dataset with the stipulation that at some point in the topology of the network there is a bottleneck (a layer with a limited number of neurons).37 Using the bottleneck, we can separate the network into two parts – the encoder that consists of the bottleneck and the layers preceding it, and the decoder, made up of the layers after the bottleneck. From the bottleneck, we can extract a low-dimensional latent representation of the original input (encoding). The encoder can be interpreted as an MLP creating Lprimary encodings from the model input. Similarly, the decoder can be viewed as an MLP reconstructing the model input from Lprimary embeddings. It should be noted that the reconstruction obtained from the autoencoder is lossy.We used a variational autoencoder (VAE)38 that differs from the standard AE by bottleneck regularization and sampling from the bottleneck, in order to achieve desired characteristics of the latent space. The aforementioned characteristics are continuity (two “close” points should give similar results) and completeness (for a chosen distribution of the latent space, any point sampled from it should give meaningful results). In practice, the VAE is trained to predict a distribution (defined by its expected value and its variance), rather than predicting the latent encoding directly. The distribution of the latent space is regularized to fit the normal distribution centered at zero with unit variance by using the Kullback–Leibler divergence.39
Similarly to the MLP, the model parameters were optimized on the validation data with a hyperband algorithm. The autoencoder is composed of five layers, mirrored around the bottleneck. For the first and last layer we considered the following options: 2048, 1024, 512, and 128, and out of these 1024 was chosen. For the second and fourth (second to last) layers we considered 1024, 512, and 64 neurons, from which 512 was selected. The bottleneck was optimized to 64 neurons out of 3, 8, 32, and 64. The leaky ReLU activation function was used in every layer except the last and the bottleneck, which utilized a linear activation. Mean squared error with L2 regularization was used as the loss function. The Kullback–Leibler divergence was scaled by 4-cycle linear annealing40 going from 0 to 0.5. For training, the Adam optimizer was selected. The learning rate was optimized to 1 × 10⁻⁴ from the following options: 1 × 10⁻³, 1 × 10⁻⁴, and 1 × 10⁻⁵. The model was trained for 50 epochs with a batch size of 128. Both, the input and the output of the model are Xprimary. Note that for the proposed model (MLP + VAE), the output (prediction) is primary, which is obtained from the input Xsecondary.
4.3. Benchmark models
We benchmark the model against common multivariate regression baselines: a partial least squares regression model (denoted as the PLS baseline) and k-nearest neighbors regressor (denoted as the KNN baseline), described in Sections 4.3.2 and 4.3.1 respectively. Additionally, we also consider an MLP trained to predict theprimary spectra from the Xsecondary directly (one-step MLP), described in more detail in Section 4.3.3.
primary spectra from the Xsecondary directly, i.e. without the intermediate step (Xsecondary → ![[L with combining circumflex]](https://www.rsc.org/images/entities/i_char_004c_0302.gif) primary → primary). Effectively, the one-step MLP has almost ten times (8.9) as many trainable parameters in comparison to the proposed model (MLP + VAE). Therefore, it can most likely outperform the proposed model, and for applications where the transfer error is of the utmost importance, the one-step MLP model might be preferred. As a trade-off, we lose the latent space (shared among all secondary systems) and generative properties of the model. The one-step MLP model requires significantly more data to be shared and stored between the participating systems (in this case about 50 times as much). The exact value of the compression ratio CR (from the perspective of the proposed model) can be calculated as follows:
primary → primary). Effectively, the one-step MLP has almost ten times (8.9) as many trainable parameters in comparison to the proposed model (MLP + VAE). Therefore, it can most likely outperform the proposed model, and for applications where the transfer error is of the utmost importance, the one-step MLP model might be preferred. As a trade-off, we lose the latent space (shared among all secondary systems) and generative properties of the model. The one-step MLP model requires significantly more data to be shared and stored between the participating systems (in this case about 50 times as much). The exact value of the compression ratio CR (from the perspective of the proposed model) can be calculated as follows: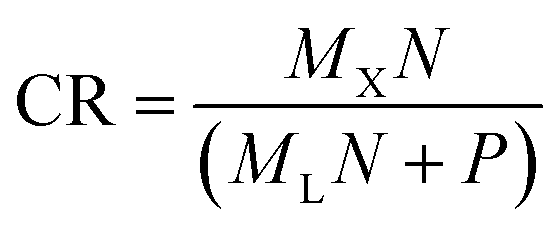 | (1) |
4.4. Evaluation
We evaluate the performance (i.e. the discrepancy between the primary spectra and their predicted counterparts from the secondary system) of the methodology from the two basic points of view that are relevant to the LIBS applications: first the quantitative, and second, the qualitative analysis. We measure the differences between Xprimary and predictedprimary spectra using two distance metrics:
Euclidean distance of the i-th spectral pair:
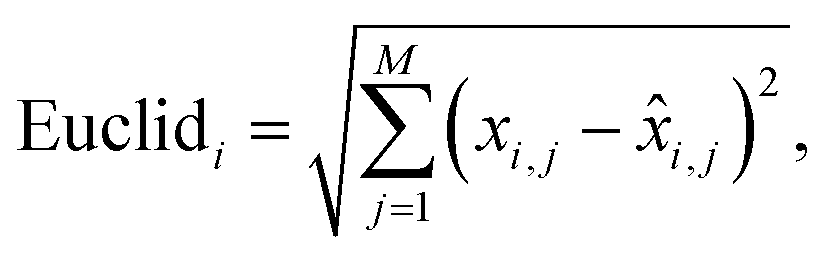 | (2) |
![[x with combining circumflex]](https://www.rsc.org/images/entities/i_char_0078_0302.gif) i,j is the predicted value.
i,j is the predicted value.
Cosine distance of the i-th spectral pair:
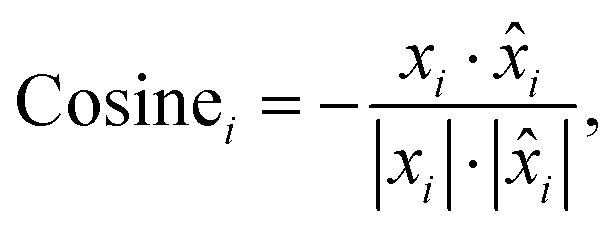 | (3) |
is the i-th predicted spectrum. It ranges from 1 to −1, where values closer to −1 indicate greater similarity, 0 indicates orthogonality and 1 indicates opposite values. We then average the results computed for each pair of spectra to obtain a single value that represents the result on the entire dataset (〉Euclid〈, 〉cosine〈).
Additionally, we also calculate the relative squared error (RSE) as:
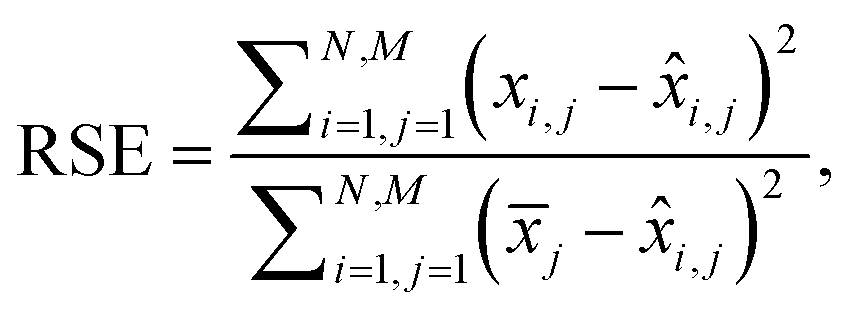 | (4) |
i,j is the predicted value and ![[x with combining macron]](https://www.rsc.org/images/entities/i_char_0078_0304.gif) j is the mean of the actual values on the j-th wavelength. Intuitively, RSE represents the performance of the model relative to the performance of a naïve baseline prediction. Here, we chose the mean spectrum of the test dataset as a naïve-baseline. The RSE ranges from 0 to inf, where 0 indicates a perfect reconstruction, 1 indicates the same performance as the naïve-baseline, and values greater than 1 indicate performance worse than the baseline.
j is the mean of the actual values on the j-th wavelength. Intuitively, RSE represents the performance of the model relative to the performance of a naïve baseline prediction. Here, we chose the mean spectrum of the test dataset as a naïve-baseline. The RSE ranges from 0 to inf, where 0 indicates a perfect reconstruction, 1 indicates the same performance as the naïve-baseline, and values greater than 1 indicate performance worse than the baseline.
Lastly, for the impact on the qualitative analysis, we train a k-means clustering algorithm on the Xprimary train dataset and compare its predictions on the Xprimary test and the corresponding primary test measurements (i.e. spectra transferred from the secondary to the primary system). A simple accuracy metric was used:
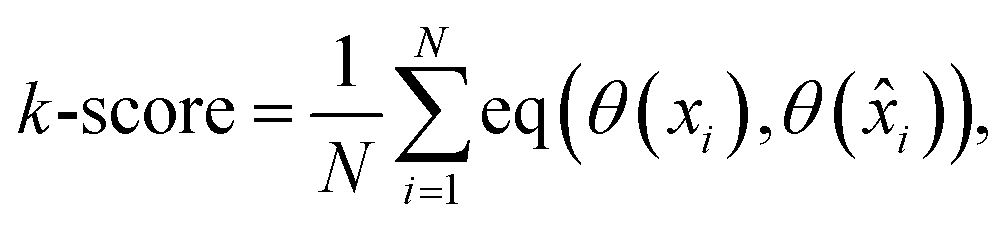 | (5) |
) represent the predicted label on the i-th spectra from the Xprimary and primary datasets respectively, and eqn:  :
: | (6) |
000 spectra (10%) was used for the optimization. k = 4 was selected as the optimal number from the considered options: 3, 4, 5, 6, 7, 8, 9, 10, 15, and 20.
5. Results and discussion
In this section, we present the performance of the proposed method compared to that of the baseline models in a one-shot evaluation on the hold-out test dataset. The results of the evaluation metrics (as described in Section 4.4) are listed in Table 1. Both ANN-based models significantly outperformed other considered models in all the error metrics.| 〈Euclid〉 | 〈cosine〉 | RSE | k-score | |
|---|---|---|---|---|
| VAE + MLP | 4658.72 | −0.9919 | 0.1219 | 0.9758 |
| One-step MLP | 4201.44 | −0.9931 | 0.1021 | 0.9798 |
| KNN baseline | 17437.70 |
−0.9075 | 1.8272 | 0.4495 |
| PLS baseline | 5141.14 | −0.9917 | 0.1346 | 0.9670 |
A comparison between the total emissivity map of the Xprimary dataset and the primary can be seen in Fig. 7. It should be noted that the spectra outside the interquantile range Q0.99–Q0.01 are aggregated together and displayed with the same color as the corresponding quantile value. This is performed to filter out the outliers present in the data (the same approach is repeated for each subsequent hyperspectral image).
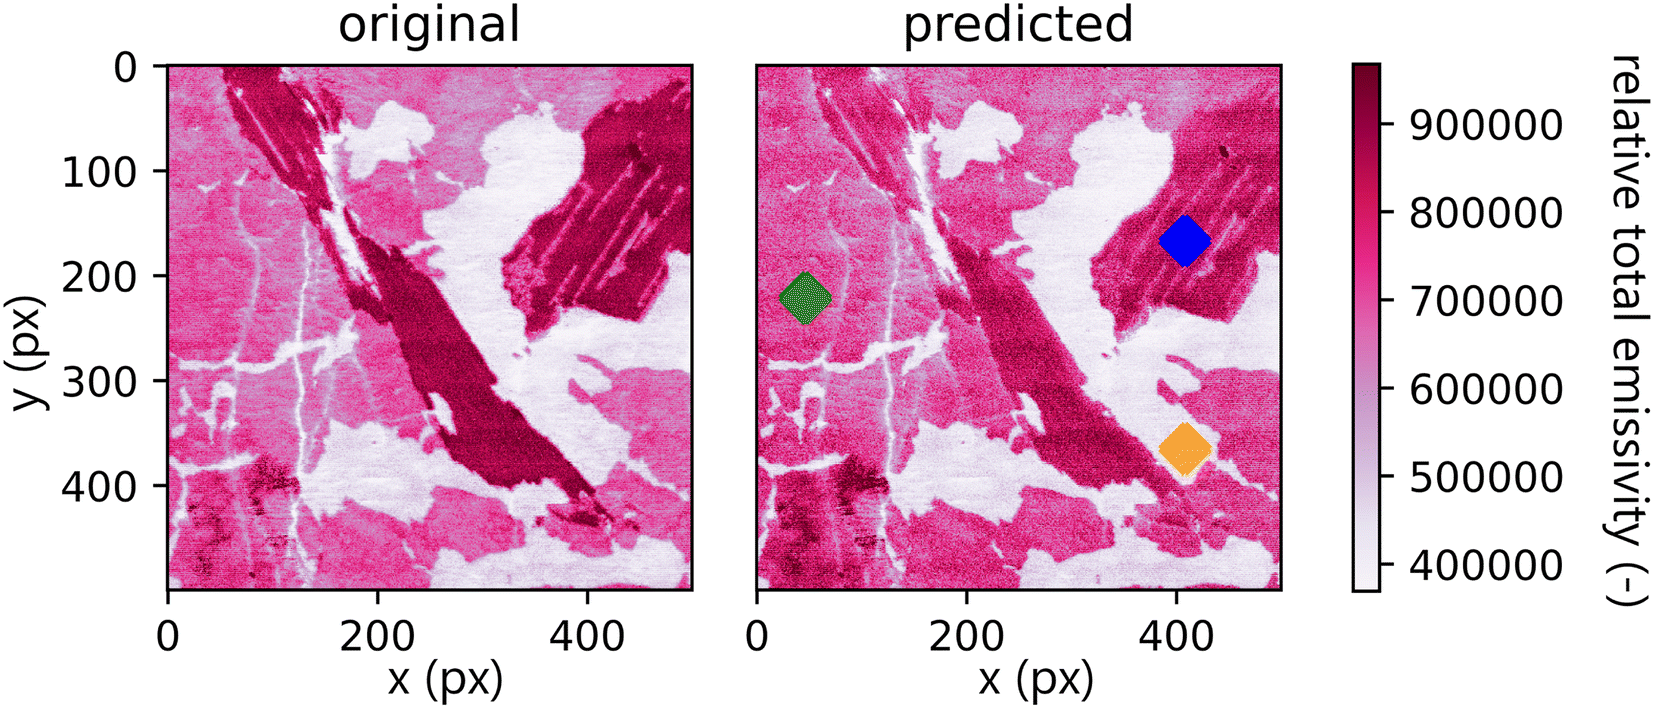 | ||
| Fig. 7 Comparison of total emissivity maps of Xprimary (original) and primary (predicted). There is a visible decrease in overall intensity. Three color-marked spots are used for representative spectral comparison below. Values outside the interquantile range Q0.99–Q0.01 are aggregated together and displayed with the same color as the corresponding quantile value. | ||
The spatial distribution of the transfer error can be seen in Fig. 8. Ideally, the error would be spatially invariant; however, it is clear that this is not the case. The spectra with the highest error are assembled on the borders of distinct matrices. This follows from the under-representation of boundary spectra in the dataset and contamination of the emission signal by the previous measurements.
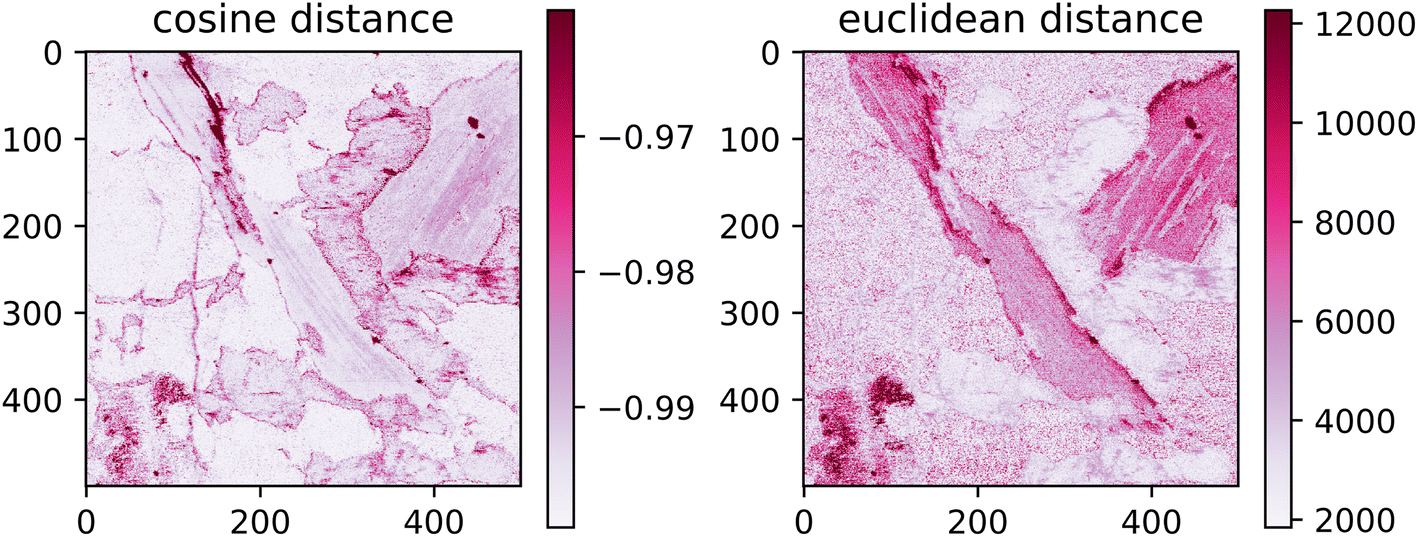 | ||
| Fig. 8 Spatial distribution of the euclidean and cosine distances. Values outside the interquantile range Q0.99–Q0.01 are aggregated together and displayed with the same color as the corresponding quantile value. | ||
Qualitatively, the transfer was highly successful, and the sample topology is well-preserved in the predicted map (see Fig. 7b). However, some important features (spectral lines) are predicted imperfectly. For the applications related to the qualitative analysis, these errors are not significant, but for quantitative analysis they could be considerable. To further investigate the prediction error and its wavelength dependency, we selected three representative spots, each from a different matrix present in the sample (see Fig. 7) and compared the original and predicted spectra from these spots (see Fig. 9–11). Predictions of representative spectra depicted in Fig. 9 and 10 show a good performance of the transfer methodology, where only a minor discrepancy between specific line intensities is present. More significant reconstruction error can be seen in Fig. 11, especially between 390 nm and 410 nm, where some lines are missed in the prediction, and a couple of background wavelengths are predicted with negative intensity. This error is representative of most of the spectra of the same matrix. This is likely a consequence of the background signal change (specifically for the test spectra of this matrix), since the aforementioned line intensities are below the background in the training dataset (see Fig. 5).
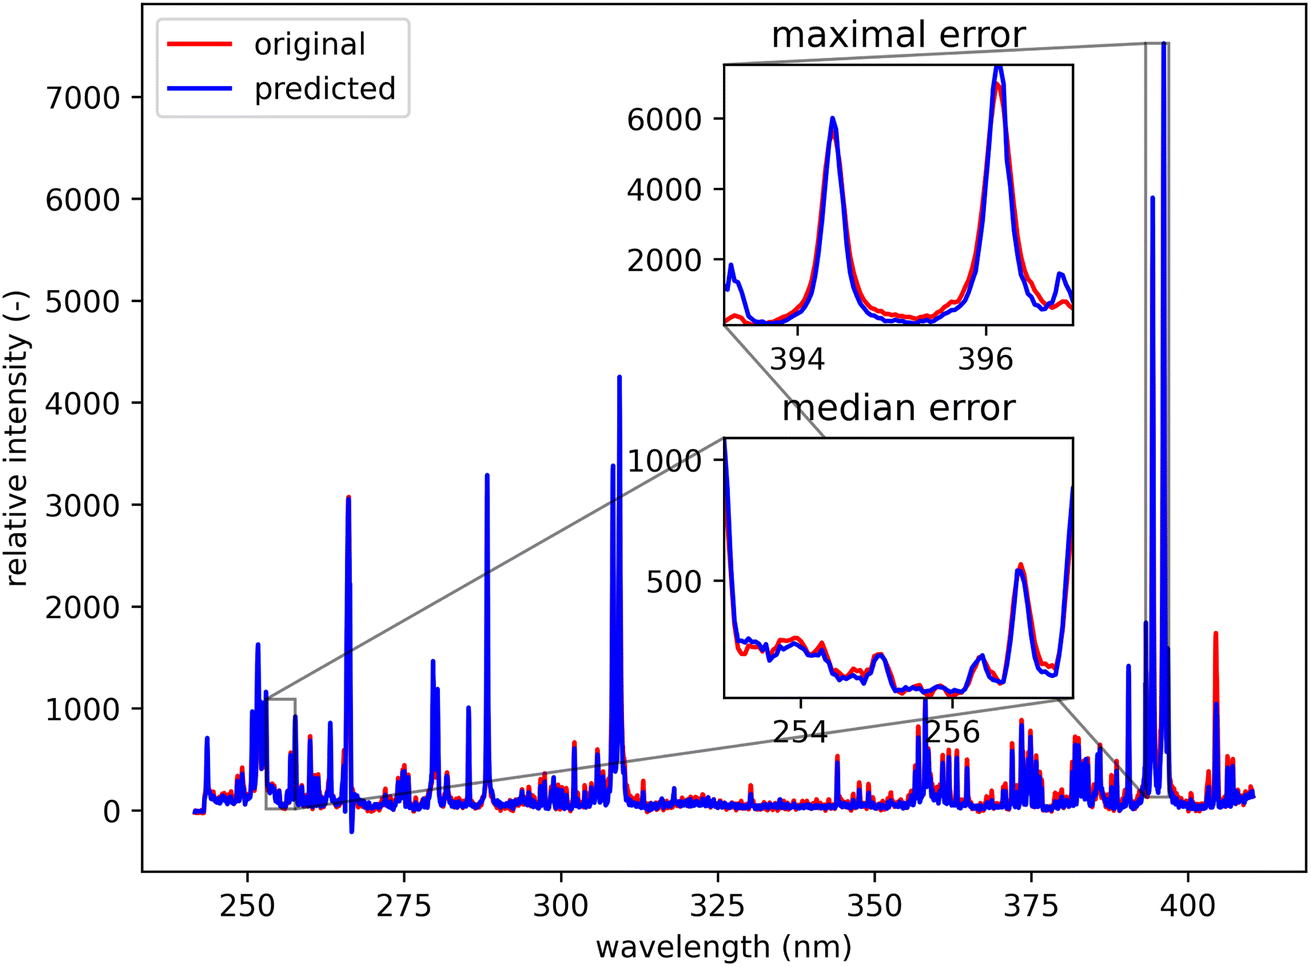 | ||
| Fig. 9 Blue spot, from Fig. 5 (coordinates 408, 167). Muscovite (ideally KAl3Si3O10(OH)2; composition: K 9.8 wt%, Al 20.3 wt%, Si 21.2 wt%, O 48.2 wt%, and H 0.5 wt%). The original spectrum is from the primary system and prediction is from the secondary system. | ||
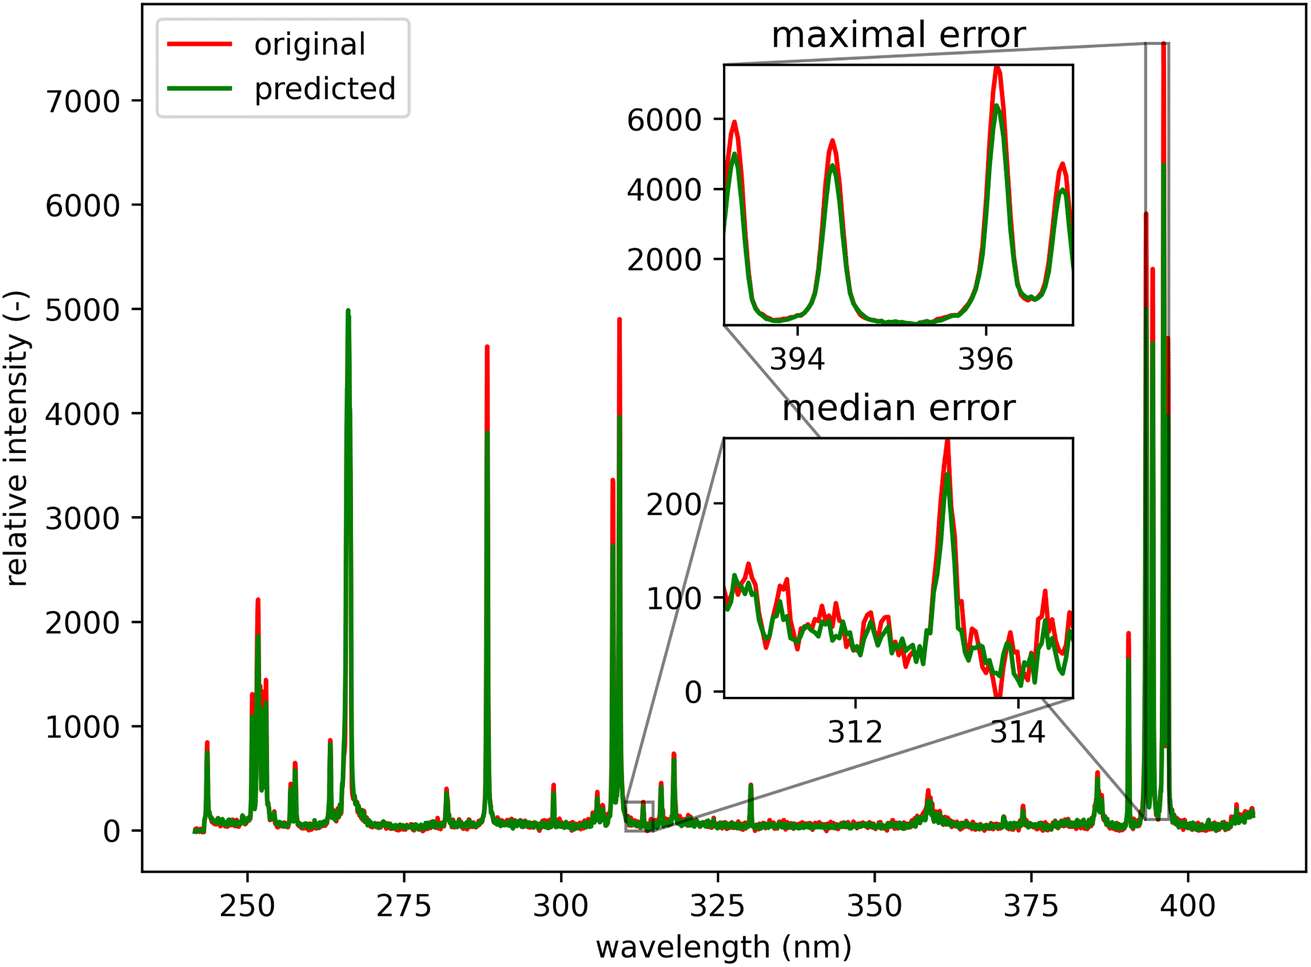 | ||
| Fig. 10 Green spot from Fig. 5 (coordinates 46, 221). Albite (ideally NaAlSi3O8; element contents: Na 8.8 wt%, Al 10.3 wt%, Si 32.1 wt%, and O 48.8 wt%). The original spectrum is from the primary system and prediction is from the secondary system. | ||
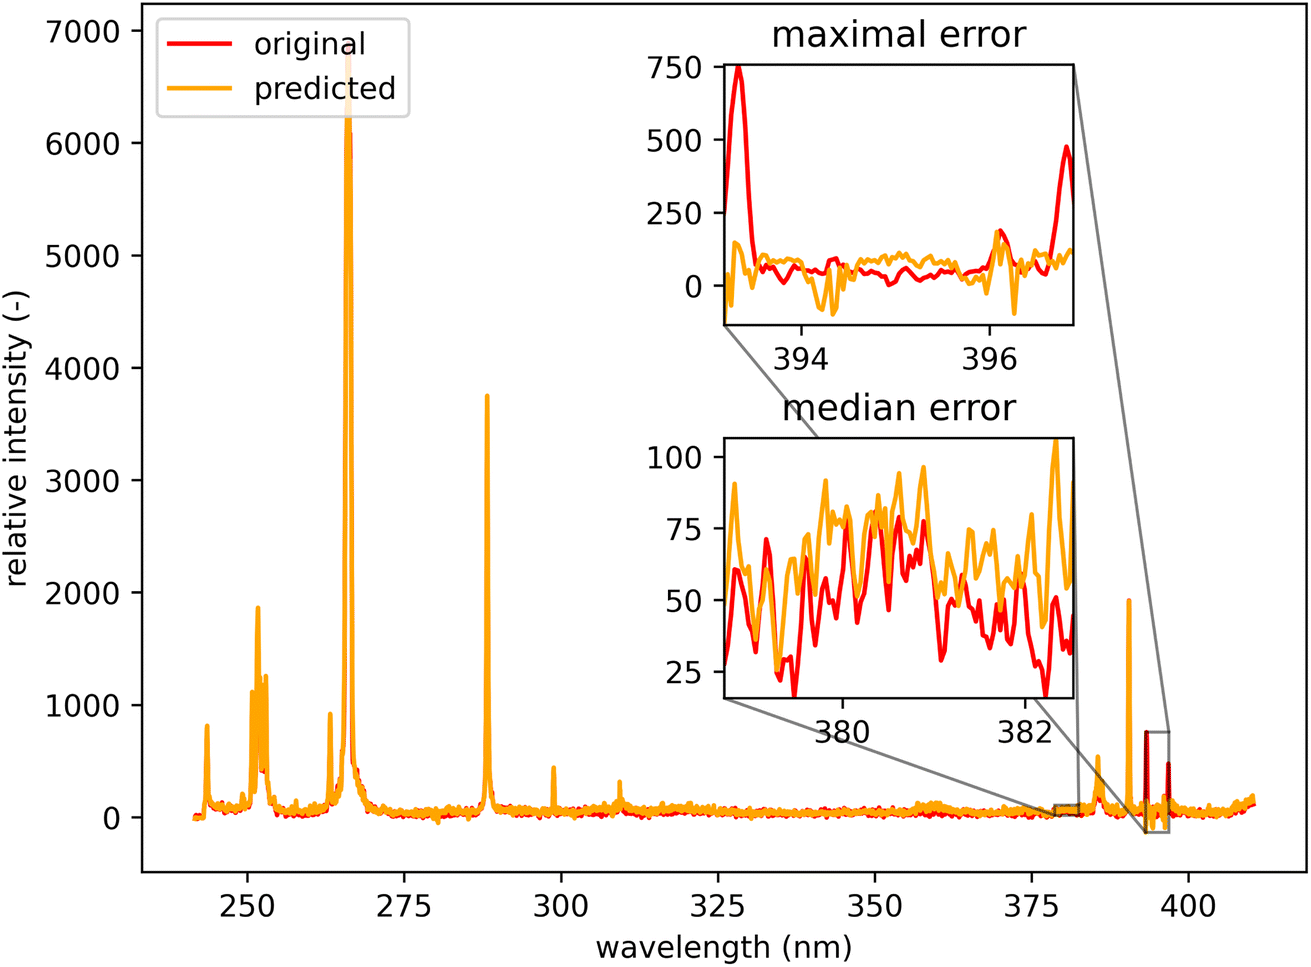 | ||
| Fig. 11 Orange spot from Fig. 5 (coordinates 408, 365). Quartz (ideally SiO2; element contents: Si 46.7 wt% and O 53.3 wt%). The original spectrum is from the primary system and prediction is from the secondary system. | ||
Lastly, we present the results from the k-means experiment described in the methodology section. The hyperspectral images of the test dataset were clustered into four clusters given by the k-means model built on the training dataset. We compared predictions on the original primary test and predictions from secondary test spectra. Misclustered spots after the prediction are plotted in Fig. 12. The k-score was 97.578, which demonstrates great potential for qualitative applications of the methodology (including classification tasks). Furthermore, the results show the robustness of the proposed method and the ability to generalize when faced with previously unseen data (even if they are coming from different measurement and samples with different matrix/composition ratios). However, they also reaffirm the suspected limitation of predicting the spectra on the borders of distinct matrices.
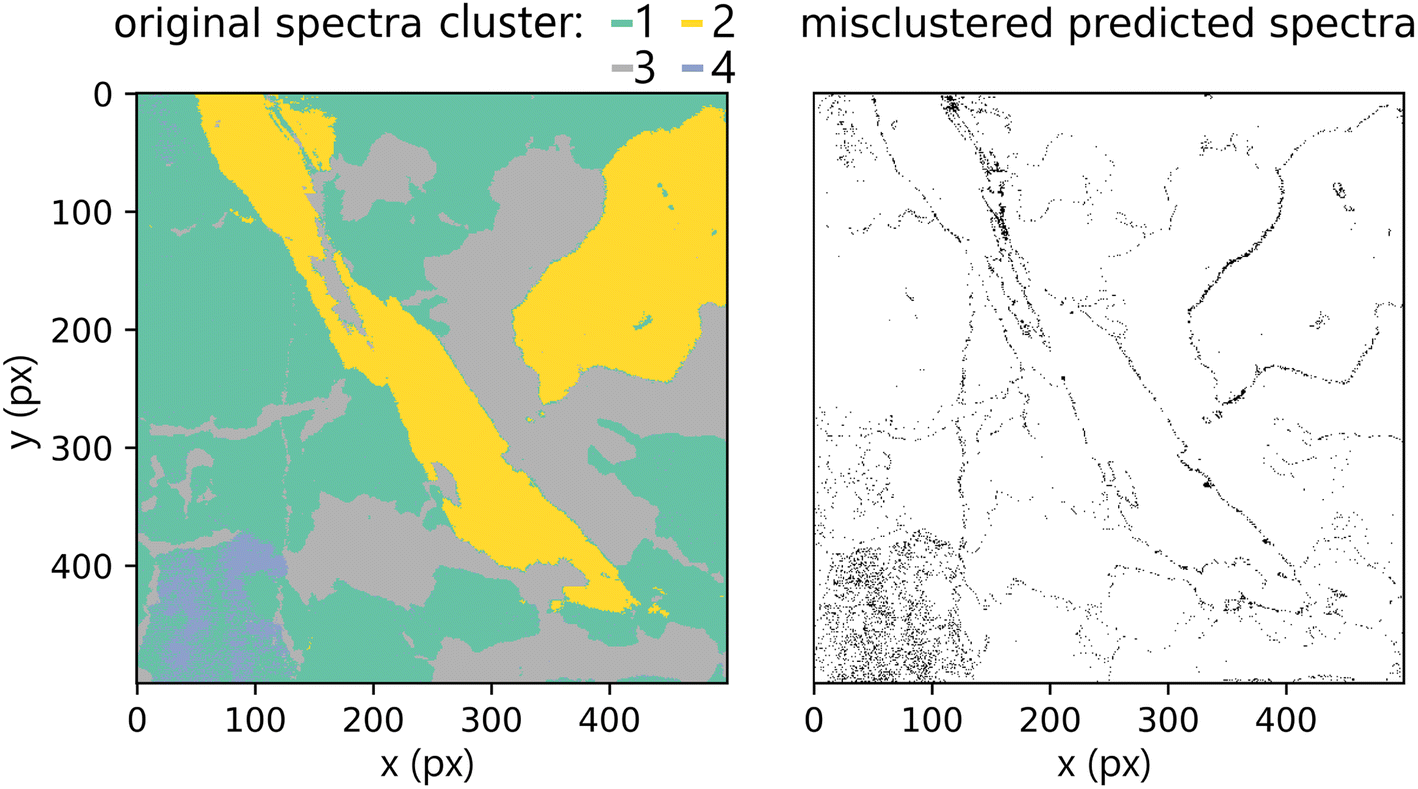 | ||
| Fig. 12 Labels of the Xprimary (original) dataset as predicted by k-means (k = 4), along with the highlighted differences to the primary (predicted) dataset. Most of the misclustered spectra are from the boundaries between distinct matrices. | ||
6. Conclusion
We have demonstrated the possibility of transferring spectra from a secondary system (cost-efficient, narrow spectral range) to a primary system (complex, broader spectral range) by using a composed model based on deep artificial neural networks. A simplified problem setup was employed, where the shared samples are measured simultaneously using both systems. This allows collection of unprecedentedly large shared datasets with one-to-one spectra correspondence between the systems. The methodology consists of a two-step computation, where first, a latent representation of the primary system spectra is found (by using a variational autoencoder), and second, spectra from the secondary system are mapped to this latent space (by using a multilayer perceptron). This procedure was trained and validated on large hyperspectral maps of a heterogeneous rock sample. It was demonstrated that such a transfer is possible and performs well even on unseen data from a different measurement. The performance and limitations of the transfer were evaluated by studying several metrics relevant to qualitative and quantitative LIBS analysis. We found that the spectral transfer will have only a negligible effect on clustering. Considering the quantitative analysis, the transfer error is spatially dependent and may negatively affect quantitative predictions about the sample composition in underrepresented regions (especially for boundaries between the matrices in the sample). Considering the versatility of the utilized models, the methodology could be further generalized to a different domain beyond the initial training data (e.g. to train the transfer model on rock spectra and fine-tune on metal standards).Appendices
A: Data and code
Data are available at https://dx.doi.org/10.6084/m9.figshare.20713504. The code is available at https://github.com/LIBS-ML-team/libs-transfer-library.B: Additional figures
See the ESI.†Conflicts of interest
There are no conflicts to declare.Acknowledgements
JV is grateful for the support provided by the grants CEITEC-K-21-6978 and CEITEC VUT-J-22-8099 from the Brno University of Technology. Grant CEITEC-K-21-6978 is realised within the project Quality Internal Grants of BUT (KInG BUT), Reg. No. CZ.02.2.69/0.0/0.0/19_073/0016948, which was financed from the OP RDE. JK gratefully acknowledges the support of the grant FSI-S-20-6353 from the Faculty of Mechanical Engineering, Brno University of Technology.References
- A. Limbeck, L. Brunnbauer, H. Lohninger, P. Pořízka, P. Modlitbová, J. Kaiser, P. Janovszky, A. Kéri and G. Galbács, Methodology and applications of elemental mapping by laser induced breakdown spectroscopy, Anal. Chim. Acta, 2021, 1147, 72–98 CrossRef CAS PubMed.
- V. Motto-Ros, S. Moncayo, C. Fabre, and B. Busser, Chapter 14 – Libs imaging applications, in Laser-Induced Breakdown Spectroscopy, ed. J. P. Singh and S. N. Thakur, Elsevier, Amsterdam, 2nd edn, 2020, pp. 329–346, DOI:10.1016/B978-0-12-818829-3.00014-9, URL: https://www.sciencedirect.com/science/article/pii/B9780128188293000149.
- P. Modlitbová, S. Střítežská, A. Hlaváček, D. Prochazka, P. Pořízka and J. Kaiser, Laser-induced breakdown spectroscopy as a straightforward bioimaging tool for plant biologists; the case study for assessment of photon-upconversion nanoparticles in brassica oleracea l. plant, Ecotoxicol. Environ. Saf., 2021, 214, 112113, DOI:10.1016/j.ecoenv.2021.112113 . URL: https://www.sciencedirect.com/science/article/pii/S0147651321002244.
- A. Nardecchia, C. Fabre, J. Cauzid, F. Pelascini, V. Motto-Ros and L. Duponchel, Detection of minor compounds in complex mineral samples from millions of spectra: a new data analysis strategy in libs imaging, Anal. Chim. Acta, 2020, 1114, 66–73 CrossRef CAS PubMed.
- L. Jolivet, V. Motto-Ros, L. Sorbier, T. Sozinho and C.-P. Lienemann, Quantitative imaging of carbon in heterogeneous refining catalysts, J. Anal. At. Spectrom., 2020, 35(5), 896–903 RSC.
- R. C. Wiens, S. Maurice, B. Barraclough, M. Saccoccio, W. C. Barkley, J. F. Bell and B. Wong-Swanson, The chemcam instrument suite on the mars science laboratory (msl) rover: body unit and combined system tests, Space Sci. Rev., 2012, 170(1), 167–227, DOI:10.1007/s11214-012-9902-4.
- R. C. Wiens, S. Maurice, S. H. Robinson, A. E. Nelson and P. Willis, The supercam instrument suite on the nasa mars 2020 rover: body unit and combined system tests, Space Sci. Rev., 2020, 217(1), 4, DOI:10.1007/s11214-020-00777-5.
- W. Xu, X. Liu, Z. Yan, L. Li, Z. Zhang, Y. Kuang, H. Jiang, H. Yu, F. Yang, C. Liu, T. Wang, C. Li, Y. Jin, J. Shen, B. Wang, W. Wan, J. Chen, S. Ni, Y. Ruan, R. Xu, C. Zhang, Z. Yuan, X. Wan, Y. Yang, Z. Li, Y. Shen, D. Liu, B. Wang, R. Yuan, T. Bao and R. Shu, The marscode instrument suite on the mars rover of china's tianwen-1 mission, Space Sci. Rev., 2021, 217(5), 64, DOI:10.1007/s11214-021-00836-5.
- Z. Salajková, M. Holá, D. Prochazka, J. Ondráček, D. Pavliňák, L. Čelko, F. Gregar, P. Šperka, P. Pořízka, V. Kanický, A. De Giacomo and J. Kaiser, Influence of sample surface topography on laser ablation process, Talanta, 2021, 222, 121512, DOI:10.1016/j.talanta.2020.121512 . URL: https://www.sciencedirect.com/science/article/pii/S0039914020308031.
- T. Takahashi and B. Thornton, Quantitative methods for compensation of matrix effects and self-absorption in laser induced breakdown spectroscopy signals of solids, Spectrochim. Acta, Part B, 2017, 138, 31–42, DOI:10.1016/j.sab.2017.09.010 . URL: https://www.sciencedirect.com/science/article/pii/S0584854716303299.
- E. Képeš, I. Gornushkin, P. Pořízka and J. Kaiser, Tomography of double-pulse laser-induced plasmas in the orthogonal geometry, Anal. Chim. Acta, 2020, 1135, 1–11, DOI:10.1016/j.aca.2020.06.078 . URL: https://www.sciencedirect.com/science/article/pii/S0003267020308096.
- E. Képeš, I. Gornushkin, P. Pořízka and J. Kaiser, Spatiotemporal spectroscopic characterization of plasmas induced by non-orthogonal laser ablation, Analyst, 2021, 146, 920–929, 10.1039/D0AN01996H.
- S. Shabanov and I. Gornushkin, Geometrical effects in data collection and processing for calibration-free laser-induced breakdown spectroscopy, J. Quant. Spectrosc. Radiat. Transfer, 2018, 204, 190–205, DOI:10.1016/j.jqsrt.2017.09.018 . URL: https://www.sciencedirect.com/science/article/pii/S0022407317304661.
- A. W. Miziolek, V. Palleschi and I. Schechter, Laser Induced Breakdown Spectroscopy, Cambridge University Press, 2006, DOI:10.1017/CBO9780511541261.
- J. Vrábel, P. Pořízka, J. Klus, D. Prochazka, J. Novotný, D. Koutný, D. Paloušek and J. Kaiser, Classification of materials for selective laser melting by laser-induced breakdown spectroscopy, Chem. Pap., 2019, 73(12), 2897–2905, DOI:10.1007/s11696-018-0609-1.
- A. Ciucci, M. Corsi, V. Palleschi, S. Rastelli, A. Salvetti and E. Tognoni, New procedure for quantitative elemental analysis by laser-induced plasma spectroscopy, Appl. Spectrosc., 1999, 53(8), 960–964, DOI:10.1366/0003702991947612.
- S. M. Clegg, R. C. Wiens, R. Anderson, O. Forni, J. Frydenvang, J. Lasue, A. Cousin, V. Payre, T. Boucher and M. D. Dyar, et al. , Recalibration of the mars science laboratory chemcam instrument with an expanded geochemical database, Spectrochim. Acta, Part B, 2017, 129, 64–85 CrossRef CAS.
- J. J. Workman Jr, A review of calibration transfer practices and instrument differences in spectroscopy, Appl. Spectrosc., 2018, 72(3), 340–365 CrossRef PubMed.
- T. Boucher, C. Carey, S. Mahadevan, M. Dyar, Aligning mixed manifolds, in Proceedings of the AAAI Conference on Artificial Intelligence, 2015, vol. 29, pp. 2511–2517 Search PubMed.
- E. Képeš, J. Vrábel, P. Pořízka and J. Kaiser, Improving laser-induced breakdown spectroscopy regression models via transfer learning, J. Anal. At. Spectrom., 2022, 37(9), 1883–1893 RSC.
- J. Vrábel, P. Pořízka and J. Kaiser, Restricted boltzmann machine method for dimensionality reduction of large spectroscopic data, Spectrochim. Acta, Part B, 2020, 167, 105849, DOI:10.1016/j.sab.2020.105849 . URL: https://www.sciencedirect.com/science/article/pii/S0584854720300410.
- T. Boucher, M. D. Dyar and S. Mahadevan, Proximal methods for calibration transfer, J. Chemom., 2017, 31(4), e2877 CrossRef.
- W.-R. Chen, J. Bin, H.-M. Lu, Z.-M. Zhang and Y.-Z. Liang, Calibration transfer via an extreme learning machine auto-encoder, Analyst, 2016, 141(6), 1973–1980 RSC.
- U. Markowska-Kaczmar and M. Kosturek, Extreme learning machine versus classical feedforward network, Neural Comput. Appl., 2021, 33(22), 15121–15144, DOI:10.1007/s00521-021-06402-y.
- E. Kepes, J. Vrabel, P. Pořízka and J. Kaiser, Improving laser-induced breakdown spectroscopy regression models via transfer learning, J. Anal. At. Spectrom., 2022, 37, 1883–1893 RSC.
- E. Képeš, P. Pořízka, J. Klus, P. Modlitbová and J. Kaiser, Influence of baseline subtraction on laser-induced breakdown spectroscopic data, J. Anal. At. Spectrom., 2018, 33(12), 2107–2115 RSC.
- Y. LeCun, Y. Bengio and G. Hinton, Deep learning, Nature, 2015, 521(7553), 436–444 CrossRef CAS PubMed.
- G. Cybenko, Approximation by superpositions of a sigmoidal function, Math. Control Signals Syst., 1989, 2(4), 303–314 CrossRef.
- Y. LeCun, D. Touresky, G. Hinton, T. Sejnowski, A theoretical framework for back-propagation, in Proceedings of the 1988 Connectionist Models Summer School, vol. 1, 1988, pp. 21–28 Search PubMed.
- D. E. Rumelhart, G. E. Hinton, R. J. Williams, Learning Internal Representations by Error Propagation, Tech. Rep., California Univ San Diego La Jolla Inst for Cognitive Science, 1985 Search PubMed.
- M. W. Gardner and S. Dorling, Artificial neural networks (the multilayer perceptron)—a review of applications in the atmospheric sciences, Atmos. Environ., 1998, 32(14–15), 2627–2636 CrossRef CAS.
- T. Kotsiopoulos, P. Sarigiannidis, D. Ioannidis and D. Tzovaras, Machine learning and deep learning in smart manufacturing: the smart grid paradigm, Comput. Sci. Rev., 2021, 40, 100341 CrossRef.
- T. O'Malley, E. Bursztein, J. Long, F. Chollet, H. Jin and L. Invernizzi, et al., Kerastuner, 2019, https://github.com/keras-team/keras-tuner Search PubMed.
- W. Wang, Y. Huang, Y. Wang, L. Wang, Generalized autoencoder: a neural network framework for dimensionality reduction, in Proceedings of the IEEE Conference on Computer Vision and Pattern Recognition Workshops, 2014, pp. 490–497 Search PubMed.
- P. Vincent, H. Larochelle, Y. Bengio, P.-A. Manzagol, Extracting and composing robust features with denoising autoencoders, in Proceedings of the 25th International Conference on Machine Learning, 2008, pp. 1096–1103 Search PubMed.
- D. Bank, N. Koenigstein and R. Giryes, Autoencoders, 2020, preprint, arXiv:2003.05991.
- M. A. Kramer, Nonlinear principal component analysis using autoassociative neural networks, AIChE J., 1991, 37(2), 233–243 CrossRef CAS.
- D. P. Kingma and M. Welling, Auto-encoding variational bayes, 2013, preprint, arXiv:1312.6114, DOI:10.48550/ARXIV.1312.6114, URL: https://arxiv.org/abs/1312.6114.
- D. P. Kingma, M. Welling, Auto-encoding Variational bayes, 2013, preprint, arXiv:1312.6114.
- H. Fu, C. Li, X. Liu, J. Gao, A. Celikyilmaz and L. Carin, Cyclical annealing schedule: a simple approach to mitigating Kl vanishing, 2019, preprint, arXiv:1903, 10145.
- N. S. Altman, An introduction to kernel and nearest-neighbor nonparametric regression, Am. Stat., 1992, 46(3), 175–185 Search PubMed.
- S. Wold, M. Sjöström and L. Eriksson, Pls-regression: a basic tool of chemometrics, Chemom. Intell. Lab. Syst., 2001, 58(2), 109–130 CrossRef CAS.
- J. A. Wegelin, A Survey of Partial Least Squares (Pls) Methods, with Emphasis on the Two-Block Case, 2000 Search PubMed.
- S. Lloyd, Least squares quantization in pcm, IEEE Trans. Inform. Theory, 1982, 28(2), 129–137, DOI:10.1109/TIT.1982.1056489.
- P. J. Rousseeuw, Silhouettes: a graphical aid to the interpretation and validation of cluster analysis, J. Comput. Appl. Math., 1987, 20, 53–65 CrossRef.
Footnote |
| † Electronic supplementary information (ESI) available. See DOI: https://doi.org/10.1039/d2ja00406b |
| This journal is © The Royal Society of Chemistry 2023 |