 Open Access Article
Creative Commons Attribution 3.0 Unported Licence
Intense near-infrared-II luminescence from NaCeF4:Er/Yb nanoprobes for in vitro bioassay and in vivo bioimaging†
Xialian
Lei
ab,
Renfu
Li
 a,
Datao
Tu
*ab,
Xiaoying
Shang
a,
Yan
Liu
a,
Wenwu
You
a,
Datao
Tu
*ab,
Xiaoying
Shang
a,
Yan
Liu
a,
Wenwu
You
 a,
Caixia
Sun
c,
Fan
Zhang
c and
Xueyuan
Chen
 *ab
*ab
aCAS Key Laboratory of Design and Assembly of Functional Nanostructures, Fujian Key Laboratory of Nanomaterials, Fujian Institute of Research on the Structure of Matter, Chinese Academy of Sciences, Fuzhou, Fujian 350002, China. E-mail: dttu@fjirsm.ac.cn; xchen@fjirsm.ac.cn; Fax: +86 591 63179421
bCollege of Materials Science and Engineering, Fujian Normal University, Fuzhou, Fujian 350007, China
cDepartment of Chemistry, State Key Laboratory of Molecular Engineering of Polymers, Collaborative Innovation Center of Chemistry for Energy Materials, Fudan University, Shanghai 200433, China
First published on 1st May 2018
Abstract
Near-infrared (NIR) II luminescence between 1000 and 1700 nm has attracted reviving interest for biosensing due to its unique advantages such as deep-tissue penetration and high spatial resolution. Traditional NIR-II probes such as organic fluorophores usually suffer from poor photostability and potential long-term toxicity. Herein, we report the controlled synthesis of monodisperse NaCeF4:Er/Yb nanocrystals (NCs) that exhibit intense NIR-II emission upon excitation at 980 nm. Ce3+ in the host lattice was found to enhance the luminescence of Er3+ at 1530 nm with a maximum NIR-II quantum yield of 32.8%, which is the highest among Er3+-activated nanoprobes. Particularly, by utilizing the intense NIR-II emission of NaCeF4:Er/Yb NCs, we demonstrated their application as sensitive homogeneous bioprobes to detect uric acid with the limit of detection down to 25.6 nM. Furthermore, the probe was detectable in tissues at depths of up to 10 mm, which enabled in vivo imaging of mouse organs and hindlimbs with high resolution, thus revealing the great potential of these NaCeF4:Er/Yb nanoprobes in deep-tissue diagnosis.
Introduction
Luminescent biolabeling is a powerful technique that employs optical probes for detecting biomolecular concentration or visualizing biological events.1–5 In order to avoid autofluorescence and improve the signal-to-noise (S/N) ratio, several luminescent probes have emerged based on unique optical properties such as long-lived downshifting (DS) luminescence or near-infrared (NIR)-triggered upconversion (UC) luminescence.6–10 Generally, the emission lights for these probes are located below 1000 nm, which is not optimal in bioapplications since the photon scattering may limit the tissue penetration depth. To solve this problem, luminescent materials exhibiting NIR-II emission (1000–1700 nm) in the second biological window have recently been proposed as an excellent class of probes that can significantly reduce light scattering and increase the probing depth in bioapplications.11–13In the past few years, continuous efforts have been dedicated to developing NIR-II probes including organic fluorophores, carbon nanotubes, and semiconductor quantum dots (QDs).14–17 However, the use of these bioprobes has several limitations. For example, organic fluorophores commonly possess poor photostability and are susceptible to photobleaching. The applicability of QDs is compromised by photoblinking and high toxicity of heavy metal elements (e.g., cadmium and selenium). Moreover, both organic fluorophores and QDs may induce high background noise owing to a small Stokes shift, which decreases the detection sensitivity for bioassays. These concerns fuel high demand for a new generation of luminescent probes to circumvent the limitations of traditional ones.18
Lanthanide (Ln3+)-doped nanocrystals (NCs), as another kind of promising luminescent probe, have received growing attention due to their tunable emissions from different Ln3+ activators.19–22 Compared with organic fluorophores and QDs, Ln3+-doped NCs feature long luminescence lifetime, high photostability, low toxicity and sharp f–f emission peaks. Thus, they are widely applied for in vitro bioassays and in vivo bioimaging.23,24 Nevertheless, most previous research studies focused on the exploration of UC nanoprobes with emission light in the UV or visible range,25,26 which may restrict the tissue penetration depth. Several Ln3+ ion (e.g., Pr3+, Nd3+, Sm3+, Dy3+, Ho3+, Er3+, Tm3+ and Yb3+) doped NCs have been reported to emit NIR-II light.27 However, the NIR-II quantum yields for most of these Ln3+-based NCs are still low for practical application. To meet the requirement of sensitive bioassays, it is urgent to develop Ln3+-doped NCs with highly efficient emission in the NIR-II region.
In this regard, we herein report the synthesis of monodisperse and size controllable Er3+/Yb3+-doped hexagonal NaCeF4 core-only and core/shell NCs that exhibit intense NIR-II emission upon 980 nm excitation, by virtue of the efficient Yb3+–Er3+–Ce3+ energy transfer. The maximum NIR-II quantum yield for the NaCeF4:Er/Yb NCs is determined to be 32.8%, which is ∼17.5 times higher than that of the widely reported NaYF4:Er/Yb NCs. After surface modification, these NaCeF4:Er/Yb nanoprobes can be applied for sensitive and selective detection of uric acid (UA) in human serum through a simple mix-and-measure type assay, with the limit of detection (LOD) down to 25.6 nM. Moreover, the tissue penetration depth of NIR-II emission from the proposed probe is found to be higher than that of the green UC emission of NaYF4:Er/Yb NCs of similar particle sizes under otherwise identical conditions. After tail vein injection of hydrophilic NaCeF4:Er/Yb@NaCeF4 NCs into nude mice, the biodistribution of the nanoprobes is clearly monitored for 24 h using an in vivo bioimaging system (Scheme 1).
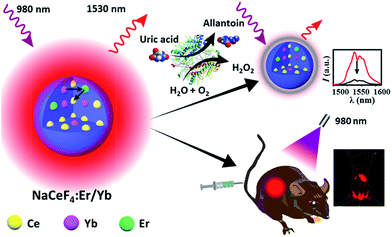 | ||
| Scheme 1 Schematic illustration showing in vitro bioassays and in vivo bioimaging based on NaCeF4:Er/Yb nanoprobes. | ||
Results and discussion
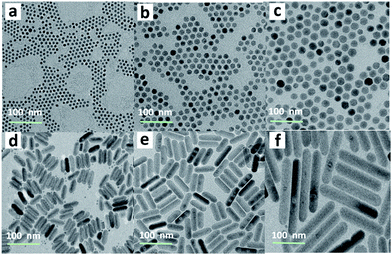
Hydrophobic and monodisperse NaCeF4:Er/Yb NCs were synthesized via a facile high-temperature co-precipitation method.28 The X-ray diffraction (XRD) patterns of the as-prepared NCs can be indexed to pure hexagonal NaCeF4 (JCPDS no. 75-1924), and no traces of other phases or impurities were detected (ESI Fig. S1†). Energy-dispersive X-ray (EDX) spectroscopy confirms the successful doping of Er3+/Yb3+ ions into the NaCeF4 host (ESI Fig. S1†). By changing the reaction time at 320 °C, the sizes and morphologies of these NCs can be finely tailored. Specifically, longer reaction time resulted in larger particles. As shown in Fig. 1, when the reaction time increased from 20 to 30 min, the size of the obtained NaCeF4:Er/Yb NCs increased markedly from 7.1 ± 0.5 to 25.2 ± 2.7 nm (Fig. 1a–c). With further increasing the reaction time to 45 min, the coexistence of small nanospheres and large nanorods was observed (Fig. 1d), which may be attributed to an Ostwald-ripening process where small particles dissolved and big nanorods grew simultaneously. After heating for 60 or 90 min, the small nanospheres completely transformed into larger nanorods with lengths of 103.3 ± 10.9 and 200.6 ± 16.5 nm (Fig. 1e–f), respectively.Besides the core-only NCs, core/shell NCs were also synthesized through epitaxial growth of inert NaCeF4 shells on the core-only NCs (7.1 ± 0.5 nm). These core/shell NCs, with an average size of 18.1 ± 1.9 nm, can be well dispersed in nonpolar organic solvents such as cyclohexane to form a stable transparent colloidal solution (ESI Fig. S2†). The high-resolution TEM (HRTEM) image shows a clearly observed d-spacing of 0.308 nm, which is in good agreement with the lattice spacing in the (01![[1 with combining macron]](https://www.rsc.org/images/entities/char_0031_0304.gif) 1) planes of hexagonal NaCeF4, indicative of the high crystallinity of the as-prepared NCs.
1) planes of hexagonal NaCeF4, indicative of the high crystallinity of the as-prepared NCs.
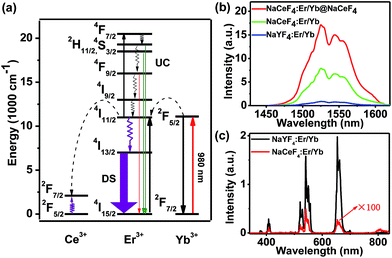
Currently, Er3+/Yb3+-doped fluorides (e.g., NaYF4) with low phonon energy are frequently reported as UC materials. For the typical UC emission process, the Yb3+ ion is usually used as the sensitizer to harvest 980 nm photons. An Er3+ ion is then excited to its excited states via two or more successive energy transfers from Yb3+ ions in close proximity, followed by radiative relaxation, resulting in UC emission of a higher-energy photon (Fig. 2a).29 Nevertheless, the energy gap between the 2F5/2 and 2F7/2 levels of Ce3+ (∼2300 cm−1) is close to that of the 4I11/2–4I13/2 energy gap (∼3700 cm−1) of Er3+. Therefore, for NaCeF4:Er/Yb NCs, the 4I13/2 level of Er3+ is significantly populated through the efficient phonon-assisted nonradiative relaxation from the 4I11/2 level facilitated by Ce3+ ions.30 Upon excitation at 980 nm, intense DS emissions centered at ∼1530 nm that are ascribed to the 4I13/2 → 4I15/2 transition of Er3+ were detected for all the synthesized Er3+/Yb3+ co-doped NaCeF4 NCs (ESI Fig. S3 and S4†). With the size increasing from 7.1 nm to 200.6 nm, the NIR-II emission intensity increased by 4.1 times, and the effective PL lifetime of 4I13/2 was found to increase from 1.53 to 5.60 ms (ESI Fig. S5†).
The NIR-II absolute quantum yield (QY), defined as the ratio of the number of emitted photons to the number of absorbed photons, was determined to be as high as 32.8% for NaCeF4:Er/Yb NCs with a size of 200.6 nm upon excitation by a 980 nm laser with a power density of ∼100 W cm−2 (ESI Fig. S3†). Meanwhile, impressive 3.6-fold and 13.6-fold enhancements of NIR-II emission at ∼1530 nm for NaCeF4:Er/Yb core-only and NaCeF4:Er/Yb@NaCeF4 core/shell NCs were observed relative to that of NaYF4:Er/Yb NCs (20.1 ± 1.8 nm, ESI Fig. S6†), upon excitation at 980 nm (Fig. 2b). In sharp contrast, the visible UC emissions for Er3+ were negligibly weak in NaCeF4:Er/Yb NCs, due to the effective depopulation of 2H11/2, 4S3/2, and 4F9/2 levels in the presence of Ce3+ ions (Fig. 2c). The NIR-II absolute QYs were determined to be 1.9%, 5.6% and 19.5% for NaYF4:Er/Yb, NaCeF4:Er/Yb core-only, and NaCeF4:Er/Yb@NaCeF4 core/shell NCs, respectively.
To make the OA-capped NaCeF4:Er/Yb NCs hydrophilic for bioapplications, we removed the surface ligands through an acid treatment.31 The successful synthesis of ligand-free NaCeF4:Er/Yb NCs was verified by TGA, FTIR spectra and zeta-potential analyses (ESI Fig. S7–S9†). More importantly, the ligand-free NCs preserved the intense NIR-II emission from the OA-capped NCs with essentially unchanged intensity. The ζ potential of ligand-free NCs in aqueous solution was measured to be 21.9 ± 0.9 mV (ESI Fig. S9†) due to the existence of positively charged Ln3+ ions (i.e., Er3+, Yb3+ and Ce3+) on the surface of ligand-free NCs, which endows these NCs with excellent dispersibility in aqueous solutions.
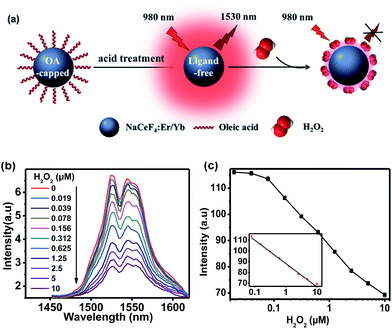
Since Ce3+ ions in the host matrix were exposed on the surface of ligand-free NCs after the acid treatment, H2O2 can directly oxidize Ce3+ to Ce4+ through redox reaction,32 resulting in the quenching of NIR-II emission of Er3+ upon 980 nm excitation. Benefiting from such a redox reaction, NaCeF4:Er/Yb NCs can be explored as an effective bioprobe for the detection of H2O2 or H2O2-generated biomolecules (Fig. 3a). In order to investigate the quenching effect of H2O2 on the NIR-II emission of NaCeF4:Er/Yb NCs, the spectral response of ligand-free NaCeF4:Er/Yb NCs with a size of 25.2 ± 2.7 nm (0.5 mg mL−1) upon addition of different amounts of H2O2 (0–10 μM) was measured upon 980 nm excitation (Fig. 3b). The integrated DSL intensity of NaCeF4:Er/Yb decreased gradually with increasing concentration of H2O2, due to the redox reaction between the H2O2 and Ce3+ ions. As a result, the concentration of H2O2 can be quantified by the NIR-II emission intensity of NaCeF4:Er/Yb NCs (Fig. 3c). In the control experiment, by utilizing NaYF4:Er/Yb or NaYF4:Er/Yb/Ce (with a Ce3+ content of 10 mol%) as the probe, a negligible photoluminescence (PL) quenching effect of Er3+ was observed upon addition of different concentrations of H2O2 (ESI Fig. S10†). The LOD, defined as the concentration that corresponds to 3 times the standard deviation above the signal measured in the blank, was determined to be 41.8 nM based on NaCeF4:Er/Yb nanoprobes.
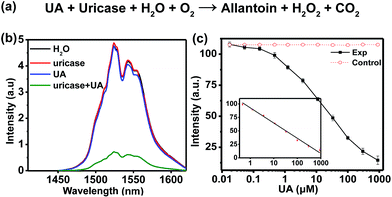
The highly sensitive response of H2O2 allows for the detection of biomarkers such as UA which can yield H2O2 through the UA/uricase reaction (Fig. 4a). The level of UA, which is the end product of purine metabolism in the human body in human blood and urine, can be treated as an indicator for certain clinical criteria. Abnormal levels of UA may cause diseases like gout, arthritis, renal disorder, Lesch–Nyhan syndrome, etc.33,34 Specifically, excess UA in human blood is a risk factor in cardiovascular related diseases, while reduced UA levels (hypouricemia) have been found to be closely related to several diseases such as diabetes mellitus and AIDS.35 Therefore, the accurate detection of UA is of great importance in physiological survey and clinical diagnosis.
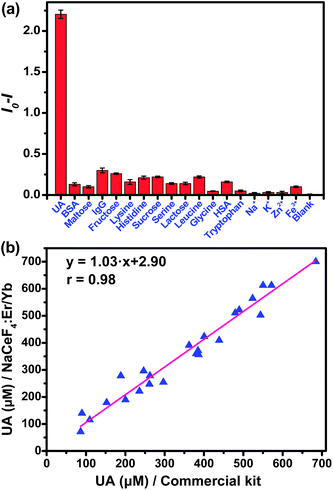
In the assay system, UA or uricase alone was not able to quench the NIR-II emission of NaCeF4:Er/Yb nanoprobes upon 980 nm excitation, since no H2O2 was generated (Fig. 4b). However, a notable quenching in Er3+ emission was observed with the addition of both UA and uricase in NaCeF4:Er/Yb solution. Meanwhile, it was found that a time of 3 h was needed to reach equilibrium for the NIR-II emission of Er3+ (ESI Fig. S11†). Under the optimized conditions (0.5 mg mL−1 NaCeF4:Er/Yb and 0.011 U mL−1 uricase), the integrated NIR-II emission intensity of Er3+ decreased gradually with UA concentration from 0 to 900 μM (Fig. 4c), due to the gradual release of H2O2. The calibration curve for the UA concentration exhibits a linear dependence in the range of 0.411–900 μM. The LOD of UA assay was determined to be 25.6 nM, which is much lower than the UA level in the serum of healthy human beings (130–460 μM).35 In order to verify the specificity of the bioassay, we performed control experiments by replacing UA with other possible interfering biomolecules and electrolytes that may exist in serum samples, such as metal ions, proteins, and amino acids, under otherwise identical conditions. As displayed in Fig. 5a, the quenching of NIR-II emission of Er3+ in the control groups was negligibly small, which is in marked contrast to the significant quenching effect caused by the addition of UA. Such an exclusive PL quenching in the experiment group confirms the high specificity of the assay, thus validating the applicability of NaCeF4:Er/Yb nanoprobes for UA detection in complex biological matrices such as serum.
For the detection of UA in human serum samples, the NIR-II signal of the serum-based detection system exhibited a linear dependence on the UA concentration ranging from 1.234 to 900 μM (ESI Fig. S12†). To show the reliability of direct quantitation of UA in complex biological fluids by applying the NaCeF4:Er/Yb nanoprobes, we carried out in vitro detection of UA in 24 serum samples. The UA concentrations determined by NaCeF4:Er/Yb nanoprobes were compared with those detected based on a commercial kit. As shown in Fig. 5b and Table S1,† the UA levels determined from the NaCeF4:Er/Yb based assay are highly consistent with those from the commercial assay kit. The correlation coefficient between both kinds of assays was determined to be 0.98, demonstrating that the NC-based assay is as reliable as that using the commercial kit.
Moreover, we determined the recovery of three human serum samples upon addition of UA standard solutions with different concentrations. The analytical recoveries are in the range of 93.4–108.8% (Table 1). Both the coefficients of variation (CV) and recovery are within the acceptance criteria (CVs ≤ 15%, and recoveries in the range of 90–110%) set for bioanalytical method validation.36 These results clearly prove that the NaCeF4:Er/Yb nanoprobe has high reliability and practicability for UA detection in complex biological samples. Therefore, the proposed NaCeF4:Er/Yb nanoprobe, exhibiting background-free NIR-II emission under NIR excitation, is highly desired as a homogeneous bioassay nanoplatform for accurate detection of UA and other H2O2-generated biomarkers in clinical bioassays. Compared to previously reported UA bioassay systems, the homogeneous assay carried out employing the NaCeF4:Er/Yb nanoprobe is much more convenient and cost-effective, given that the assay can be performed based on a simple mixing of the test samples with uricase and the ligand-free NaCeF4:Er/Yb nanoprobe, and no complicated operations are involved in either nanoprobe preparation or surface modification.
| Added (μM) | Found (μM) | CV (%) n = 4 | Recovery (%) |
|---|---|---|---|
| Serum 1 | 145.6 | 5.1 | — |
| 50 | 198.2 | 6.2 | 105.3% |
| 100 | 254.4 | 4.3 | 108.8% |
| 200 | 332.5 | 2.7 | 93.4% |
| Serum 2 | 208.0 | 3.5 | — |
| 50 | 259.4 | 7.6 | 102.9% |
| 100 | 311.4 | 6.6 | 103.4% |
| 200 | 417.8 | 3.9 | 104.9% |
| Serum 3 | 189.3 | 2.4 | — |
| 50 | 237.2 | 8.2 | 95.7% |
| 100 | 287.5 | 5.9 | 98.1% |
| 200 | 396.8 | 4.4 | 103.7% |
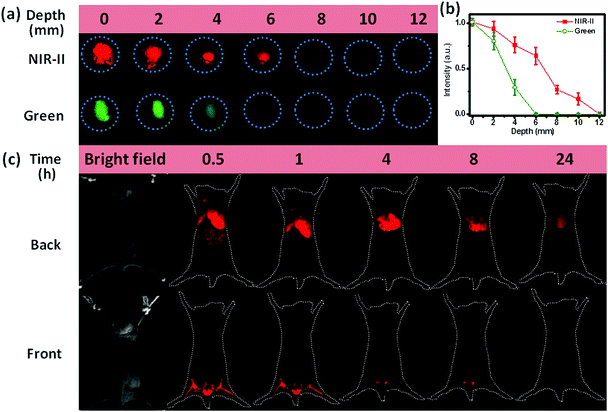
Another important application of NIR-II emission is the deep-tissue bioimaging. To make the as-prepared hydrophobic NCs biocompatible, we coated the surface of OA-capped NaCeF4:Er/Yb@NaCeF4 NCs with amphiphilic 1,2-distearoyl-sn-glycero-3-phosphoethanolamine-N-[carboxy-(polyethyleneglycol)-2000] (DSPE-PEG2000-COOH) phospholipids (Lipo).37 The resultant Lipo-modified NaCeF4:Er/Yb@NaCeF4 NCs with a hydrodynamic diameter of 22.3 ± 1.1 nm were monodisperse in water (ESI Fig. S9†). As a proof-of-concept experiment to examine the tissue penetration ability of NIR-II emission, we covered Lipo-modified NaCeF4:Er/Yb@NaCeF4 and NaYF4:Er/Yb NCs with pork muscle tissue of various thicknesses, which were imaged using a modified Maestro imaging system. As shown in Fig. 6a and b, the NIR-II luminescence of NaCeF4:Er/Yb@NaCeF4 NCs was detectable even at a depth of 10 mm upon excitation at 980 nm. By contrast, the green UC luminescence of NaYF4:Er/Yb NCs can only be observed at 4 mm beneath the tissue surface under otherwise identical conditions. The penetration depths that correspond to 50% of the original signal of NIR-II and green luminescence were determined to be ∼7 and ∼3 mm, respectively. The higher depth of penetration of NIR-II emission is due to reduced tissue scattering of light within the NIR-II window compared with that in the visible range.
Furthermore, to demonstrate their great capability for noninvasive imaging, in vivo bioimaging experiments were carried out based on the Lipo-modified NaCeF4:Er/Yb@NaCeF4 and NaYF4:Er/Yb nanoprobes via tail vein injection into mice with the same dosage (0.1 mg mL−1, 1 mL). After 30 min of blood circulation, images were taken upon excitation at 980 nm with appropriately equipped filters. Fig. 6c shows the evolution of the PL signal over 24 h arising from the injection of NaCeF4:Er/Yb@NaCeF4 nanoprobes. 0.5 h after injection, the NCs accumulated essentially in the hindlimbs, liver, spleen, and lungs, as can be monitored by the bright NIR-II signals of Er3+. Particularly, images of the mouse blood vessels of organs and hindlimbs can be clearly observed, which reveals the excellent spatial resolution of NIR-II bioimaging. After longer time periods of blood circulation, PL fading from hindlimbs was observed. 24 h later, all the NaCeF4:Er/Yb@NaCeF4 nanoprobes accumulated in the liver. Note that no tissue autofluorescence signal and light scattering were detected during in vivo imaging experiments. Considering the depth of the nude-mice organs (>3 mm), only weak visible UC emission of Er3+ can be observed in the control experiment by utilizing NaYF4:Er/Yb as the probe under otherwise identical conditions (ESI Fig. S13†). These results are well consistent with the penetration depths of NIR-II and visible lights verified in the above-mentioned in vitro imaging experiments with pork tissue.
Conclusions
In summary, we have developed a highly efficient NIR-II nanoprobe based on NaCeF4:Er/Yb NCs. Upon 980 nm excitation, intense NIR-II emissions at 1530 nm were realized because of efficient Yb3+–Er3+–Ce3+ energy transfer. The maximum absolute NIR-II QY for NaCeF4:Er/Yb NCs has been determined to be 32.8%, which is the highest among Er3+-activated NIR-II nanoprobes. Significantly, the NIR-II emission can be effectively inhibited by H2O2 produced via the UA/uricase reaction, due to the redox reaction between the H2O2 and Ce3+ ions. By virtue of such H2O2-responsive luminescence, we have achieved an LOD of 25.6 nM for UA detection. The concentrations of UA in 24 human serum samples determined using NaCeF4:Er/Yb nanoprobes were highly consistent with those measured independently using a commercial kit, showing the assay's accuracy and reliability. More importantly, a deep tissue penetration depth and superior spatial resolution in in vivo imaging of mouse organs and hindlimbs have been demonstrated by employing the distinct NIR-II emission of NaCeF4:Er/Yb@NaCeF4 in comparison with the UC emission of NaYF4:Er/Yb. These findings reveal the great potential of NaCeF4:Er/Yb nanoprobes in practical in vivo detection of disease markers, which may open up a new route to the exploitation of Ln3+-doped NIR-II nanoprobes in versatile biomedical applications.Experimental
Detailed experimental procedures are reported in the ESI.†Conflicts of interest
There are no conflicts to declare.Acknowledgements
This work is supported by the Strategic Priority Research Program of the Chinese Academy of Sciences (XDB20000000 and XDA09030307), the 973 program of MOST (No. 2014CB845605), the NSFC (No. 21650110462, 11774345, and 21771185), the Natural Science Foundation of Fujian Province, China (No. 2017I0018), the CAS/SAFEA International Partnership Program for Creative Research Teams, and the Youth Innovation Promotion Association (No. 2014264).Notes and references
- Y. M. Yang, Q. Zhao, W. Feng and F. Y. Li, Chem. Rev., 2012, 113, 192–270 CrossRef PubMed
.
- J.-C. G. Bunzli and C. Piguet, Chem. Soc. Rev., 2005, 34, 1048–1077 RSC
.
- S. V. Eliseeva and J.-C. G. Bunzli, Chem. Soc. Rev., 2010, 39, 189–227 RSC
.
- Q. Liang, Z. Li, Y. Bai, Z.-H. Huang, F. Kang and Q.-H. Yang, Sci. China Mater., 2017, 60, 109–118 CrossRef CAS
.
- D. Wang, R. Wang, L. Liu, Y. Qu, G. Wang and Y. Li, Sci. China Mater., 2017, 60, 68–74 CrossRef CAS
.
- A. Xia, M. Chen, Y. Gao, D. M. Wu, W. Feng and F. Y. Li, Biomaterials, 2012, 33, 5394–5405 CrossRef CAS PubMed
.
- Q. F. Xiao, X. P. Zheng, W. B. Bu, W. Q. Ge, S. J. Zhang, F. Chen, H. Y. Xing, Q. G. Ren, W. P. Fan, K. L. Zhao, Y. Q. Hua and J. L. Shi, J. Am. Chem. Soc., 2013, 135, 13041–13048 CrossRef CAS PubMed
.
- Y. M. Yang, Q. Shao, R. R. Deng, C. Wang, X. Teng, K. Cheng, Z. Cheng, L. Huang, Z. Liu, X. G. Liu and B. G. Xing, Angew. Chem., Int. Ed., 2012, 51, 3125–3129 CrossRef CAS PubMed
.
- W. W. Ye, M. K. Tsang, X. Liu, M. Yang and J. H. Hao, Small, 2014, 10, 2390–2397 CrossRef CAS PubMed
.
- P. Huang, D. T. Tu, W. Zheng, S. Y. Zhou, Z. Chen and X. Y. Chen, Sci. China Mater., 2015, 58, 156–177 CrossRef CAS
.
- R. Wang, X. M. Li, L. Zhou and F. Zhang, Angew. Chem., Int. Ed., 2014, 53, 12086–12090 CrossRef CAS PubMed
.
- S. Diao, J. L. Blackburn, G. S. Hong, A. L. Antaris, J. L. Chang, J. Z. Wu, B. Zhang, K. Cheng, C. J. Kuo and H. J. Dai, Angew. Chem., Int. Ed., 2015, 54, 14758–14762 CrossRef CAS PubMed
.
- D. J. Naczynski, M. C. Tan, M. Zevon, B. Wall, J. Kohl, A. Kulesa, S. Chen, C. M. Roth, R. E. Riman and P. V. Moghe, Nat. Commun., 2013, 4, 2199 CAS
.
- G. S. Hong, S. Diao, J. L. Chang, A. L. Antaris, C. X. Chen, B. Zhang, S. Zhao, D. N. Atochin, P. L. Huang, K. I. Andreasson, C. J. Kuo and H. J. Dai, Nat. Photonics, 2014, 8, 723–730 CrossRef CAS PubMed
.
- O. T. Bruns, T. S. Bischof, D. K. Harris, D. Franke, Y. X. Shi, L. Riedemann, A. Bartelt, F. B. Jaworski, J. A. Carr, C. J. Rowlands, M. W. B. Wilson, O. Chen, H. Wei, G. W. Hwang, D. M. Montana, I. Coropceanu, O. B. Achorn, J. Kloepper, J. Heeren, P. T. C. So, D. Fukumura, K. F. Jensen, R. K. Jain and M. G. Bawendi, Nat. Biomed. Eng., 2017, 1, 0056 CrossRef PubMed
.
- A. L. Antaris, H. Chen, S. Diao, Z. R. Ma, Z. Zhang, S. J. Zhu, J. Wang, A. X. Lozano, Q. L. Fan, L. L. Chew, M. Zhu, K. Cheng, X. C. Hong, H. J. Dai and Z. Cheng, Nat. Commun., 2017, 8, 15269 CrossRef CAS PubMed
.
- X. N. Dang, L. Gu, J. F. Qi, S. Correa, G. Zhang, A. M. Belcher and P. T. Hammond, Proc. Natl. Acad. Sci. U. S. A., 2016, 113, 5179–5184 CrossRef CAS PubMed
.
- R. Wang, L. Zhou, W. X. Wang, X. M. Li and F. Zhang, Nat. Commun., 2017, 8, 14702 CrossRef PubMed
.
- L. D. Sun, Y. F. Wang and C. H. Yan, Acc. Chem. Res., 2014, 47, 1001–1009 CrossRef CAS PubMed
.
- H. Schäfer, P. Ptacek, O. Zerzouf and M. Haase, Adv. Funct. Mater., 2008, 18, 2913–2918 CrossRef
.
- J. B. Zhao, D. Y. Jin, E. P. Schartner, Y. Q. Lu, Y. J. Liu, A. V. Zvyagin, L. X. Zhang, J. M. Dawes, P. Xi, J. A. Piper, E. M. Goldys and T. M. Monro, Nat. Nanotechnol., 2013, 8, 729–734 CrossRef CAS PubMed
.
- W. P. Fan, W. B. Bu and J. L. Shi, Adv. Mater., 2016, 28, 3987–4011 CrossRef CAS PubMed
.
- G. F. Wang, Q. Peng and Y. D. Li, Acc. Chem. Res., 2011, 44, 322–332 CrossRef CAS PubMed
.
- Y. T. Zhong, Z. R. Ma, S. J. Zhu, J. Y. Yue, M. X. Zhang, A. L. Antaris, J. Yuan, R. Cui, H. Wan, Y. Zhou, W. Z. Wang, N. F. Huang, J. Luo, Z. Y. Hu and H. J. Dai, Nat. Commun., 2017, 8, 737 CrossRef PubMed
.
- M. Misiak, M. Skowicki, T. Lipiński, A. Kowalczyk, K. Prorok, S. Arabasz and A. Bednarkiewicz, Nano Res., 2017, 10, 3333–3345 CrossRef CAS
.
- S. Lu, D. Tu, X. Li, R. Li and X. Chen, Nano Res., 2016, 9, 187–197 CrossRef CAS
.
- K. Binnemans, Chem. Rev., 2009, 109, 4283–4374 CrossRef CAS PubMed
.
- Z. Q. Li, Y. Zhang and S. Jiang, Adv. Mater., 2008, 20, 4765–4769 CrossRef CAS
.
- L. A. Cheng, K. Yang, S. A. Zhang, M. W. Shao, S. T. Lee and Z. A. Liu, Nano Res., 2010, 3, 722–732 CrossRef CAS
.
- X. S. Zhai, J. Li, S. S. Liu, X. Y. Liu, D. Zhao, F. Wang, D. M. Zhang, G. S. Qin and W. P. Qin, Opt. Mater. Express, 2013, 3, 270–277 CrossRef CAS
.
- N. Bogdan, F. Vetrone, G. A. Ozin and J. A. Capobianco, Nano Lett., 2011, 11, 835–840 CrossRef CAS PubMed
.
- Y. A. Huang, Q. B. Xiao, J. Wang, Y. L. Xi, F. J. Li, Y. M. Feng, L. Y. Shi and H. Z. Lin, J. Lumin., 2016, 173, 66–72 CrossRef CAS
.
- M. Noroozifar, M. Khorasani-Motlagh, R. Akbari and M. B. Parizi, Biosens. Bioelectron., 2011, 28, 56–63 CrossRef CAS PubMed
.
- B. Alvarez-Lario and J. Macarron-Vicente, Rheumatology, 2010, 49, 2010–2015 CrossRef CAS PubMed
.
- N. Chauhan and C. S. Pundir, Anal. Biochem., 2011, 413, 97–103 CrossRef CAS PubMed
.
- S. Y. Zhou, W. Zheng, Z. Chen, D. T. Tu, Y. S. Liu, E. Ma, R. F. Li, H. M. Zhu, M. D. Huang and X. Y. Chen, Angew. Chem., Int. Ed., 2014, 53, 12498–12502 CAS
.
- Y. Cen, Y. M. Wu, X. J. Kong, S. Wu, R. Q. Yu and X. Chu, Anal. Chem., 2014, 86, 7119–7127 CrossRef CAS PubMed
.
Footnote |
| † Electronic supplementary information (ESI) available. See DOI: 10.1039/c8sc00927a |
| This journal is © The Royal Society of Chemistry 2018 |

