 Open Access Article
Efficient production of acrylic acid by dehydration of lactic acid over BaSO4 with crystal defects†
Shuting Lyu and
Tiefeng Wang *
*
Beijing Key Laboratory of Green Reaction Engineering and Technology, Department of Chemical Engineering, Tsinghua University, Beijing 100084, China. E-mail: wangtf@tsinghua.edu.cn
First published on 7th February 2017
Abstract
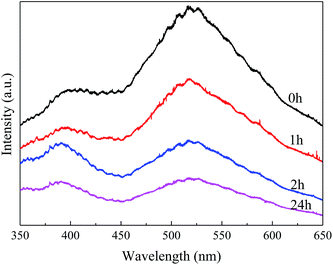
BaSO4 catalysts with different micromorphologies and crystal texture were prepared and used to investigate the structure–activity relationship in the dehydration reaction of lactic acid (LA) to acrylic acid (AA). SEM and N2 physisorption were used to study the micromorphology. XRD and photoluminescence spectra were employed to analyze the crystal texture of samples prepared with different methods and treatments. The results revealed that BaSO4 with smaller crystals and more defects had higher activity and selectivity to AA. It was likely that the crystal defects provided the active acid sites for dehydration of LA to AA, as evidenced by XPS and NH3-TPD measurements. Using ethanol as the solvent and ultrasound treatment during the preparation of BaSO4, imperfect small crystals with more defects were formed, which increased the AA selectivity to 78.8%.
1. Introduction
Lactic acid (LA), one of the most important biomass derived platform chemicals, is regarded as a promising alternative resource due to the excessive depletion of fossil resources.1,2 With two functional groups, LA has wide applications in the food industry, commodity chemicals and biopolymers.3,4 LA can be produced by traditional microbial fermentation5 or glycerol dehydrogenation.6 In a recent work, LA was produced with a high yield of 70% by catalytic conversion of biomass raw materials such as lignocellulose.7LA can be converted into valuable chemicals by a variety of catalytic processes, among which the dehydration of lactic acid to acrylic acid (AA) attracts particular attention,8 because AA is widely used in the manufacture of paint additives, adhesives, textiles, leather treating agents and synthetic resins. Currently, the industrial production of AA mainly depends on petroleum-based propylene or propane as feedstocks, which is costly and unsustainable.6 Therefore, the development of a sustainable process for conversion of LA to AA is of great significance.
The main side products in dehydration of LA are acetaldehyde (AD) and COx from decarbonylation and decarboxylation, propionic acid (PA) from hydrogenation, and 2,3-pentanedione from condensation. Non-catalytic self-esterification and polymerization can also produce some side products.9 Further side products such as acetic acid (AcOH) are produced from oxidization of acetaldehyde or carbonylation of propionic acid.10 Diverse reaction pathways of LA with or without catalysis make it challenging to increase the yield of AA in dehydration of LA.
The early research on dehydration of LA focused on mixed metal phosphates and sulfates as catalysts. In 1958, mixed sulfates of Na2SO4/CaSO4 with molar ratio of 1![[thin space (1/6-em)]](https://www.rsc.org/images/entities/char_2009.gif) :
:![[thin space (1/6-em)]](https://www.rsc.org/images/entities/char_2009.gif) 25 was reported to give an AA yield of 68% at 400 °C.11 However, little attention was attracted at that time and the mechanisms of LA reaction such as dehydration and decarbonylation/decarbonylation were not studied until the last decade. Studies on different zeolites modified with alkali/alkali-earth metal salts revealed that weak and medium acid sites were active sites in the dehydration reaction,12–14 while some reported that a kind of cooperative acid–base catalysis also help during the dehydration of LA to AA.12,15,16 Decarbonylation and decarboxylation, known as the most important side reactions, were mainly catalyzed by strong acid sites and were enhanced under high reaction temperature.13,17 The surface hydroxyl groups could also lead to particular adsorption mode favoring decarbonylation/decarbonylation to AD, evidenced by later study on the alkaline earth hydroxyapatites.18 In the early period, extensive studies were conducted on different zeolites modified with alkali/alkali-earth metal salts to improve the catalysis efficiency.12,13,17,19–23 However, the durability of the alkali/alkali-earth modified zeolites is a big problem because of the deactivation, instability of framework and loss of surface modifiers under the atmosphere of water vapor and high temperature.24 Recently, more attentions were paid to phosphates and sulfates of alkaline earth metal.18,25–28 Vidhya et al. reported a 60% selectivity over calcium hydroxyapatite (HAP) catalysts, and proposed the possible mechanism of LA conversion to AA and AD.25 Barium sulfate and the Ca3(PO4)2–Ca2P2O7 (50
25 was reported to give an AA yield of 68% at 400 °C.11 However, little attention was attracted at that time and the mechanisms of LA reaction such as dehydration and decarbonylation/decarbonylation were not studied until the last decade. Studies on different zeolites modified with alkali/alkali-earth metal salts revealed that weak and medium acid sites were active sites in the dehydration reaction,12–14 while some reported that a kind of cooperative acid–base catalysis also help during the dehydration of LA to AA.12,15,16 Decarbonylation and decarboxylation, known as the most important side reactions, were mainly catalyzed by strong acid sites and were enhanced under high reaction temperature.13,17 The surface hydroxyl groups could also lead to particular adsorption mode favoring decarbonylation/decarbonylation to AD, evidenced by later study on the alkaline earth hydroxyapatites.18 In the early period, extensive studies were conducted on different zeolites modified with alkali/alkali-earth metal salts to improve the catalysis efficiency.12,13,17,19–23 However, the durability of the alkali/alkali-earth modified zeolites is a big problem because of the deactivation, instability of framework and loss of surface modifiers under the atmosphere of water vapor and high temperature.24 Recently, more attentions were paid to phosphates and sulfates of alkaline earth metal.18,25–28 Vidhya et al. reported a 60% selectivity over calcium hydroxyapatite (HAP) catalysts, and proposed the possible mechanism of LA conversion to AA and AD.25 Barium sulfate and the Ca3(PO4)2–Ca2P2O7 (50![[thin space (1/6-em)]](https://www.rsc.org/images/entities/char_2009.gif) :
:![[thin space (1/6-em)]](https://www.rsc.org/images/entities/char_2009.gif) 50 wt%) catalysts were reported to give high AA selectivity of 74% and 76%, respectively.28,29 However, the knowledge of the relationship between acidity of sulfate catalysts and the selectivity to acrylic acid is still limited.
50 wt%) catalysts were reported to give high AA selectivity of 74% and 76%, respectively.28,29 However, the knowledge of the relationship between acidity of sulfate catalysts and the selectivity to acrylic acid is still limited.
In the present work, we studied the BaSO4 catalysts to identify the reactive sites in sulfate for dehydration of LA to AA. Different preparation methods were used to change the textures and acidities of the BaSO4 catalysts. The catalytic performance was correlated with the surface and microscopic characteristics, suggesting that crystal defects provided the required weak and medium acid sites, which were the essential active sites for LA conversion and AA formation. A high selectivity to AA was achieved over the optimized active BaSO4 catalyst.
2. Experimental
2.1. Catalyst preparation
The BaSO4 catalysts were purchased or prepared by co-precipitation using (NH4)2SO4 and BaCl2·2H2O as precursors. Firstly, 0.03 mol (NH4)2SO4 and 0.03 mol BaCl2·2H2O were separately dissolved in 120 mL distilled water. The obtained BaCl2 solution was added to the (NH4)2SO4 solution dropwise to form white precipitate of barium sulfate, which was washed, dried at 80 °C in air overnight, and then calcined at 500 °C for 4 h to obtain the catalysts denoted as Co-pre. Other BaSO4 samples with different crystal defects were prepared using different solvents (water and ethanol) and ultrasonic treatment in the precipitation process. In a typical experiment, the obtained (NH4)2SO4 solution and BaCl2 solution were added to the solvent (e.g. ethanol) co-currently to form white precipitate of barium sulfate, which was treated with ultrasound immediately for 15 min. Aging for varied time, the white precipitate was also washed, dried at 80 °C in air overnight, and then calcined at 350, 500, 600 and 700 °C for 4 h to obtain the catalysts denoted as EtOH/ult-mh-T, in which EtOH represented the solvent ethanol, m was the aging time in hour, and T was the calcination temperature in Celsius.2.2. Catalyst characterization
The morphology of the catalysts were characterized with the field emission scanning electron microscopy (SEM, JSM 7401F, JEOL, Japan). The BET surface area and pore volume were calculated from nitrogen adsorption–desorption isotherms measured at 77 K on a physical adsorption apparatus (Quandasorb-SI-4, Quantachrome) after degassing the sample at 573 K. The composition and texture of the catalysts were identified by an X-ray powder diffractometer (XRD, Bruker-AXS D8 Advance, Germany), using Cu Kα (λ = 0.154178 nm) radiation. The scanning of enlarged (121) diffraction peaks was specially conducted at a rate of 0.1° min−1 to provide precise information for calculation of the interplanar spacing and crystal size. The contents of crystal defects were characterized by the room temperature photoluminescence spectra (PL). The measurement was conducted on a Hitachi F-7000 luminescence spectrometer, using a Xe lamp with an excitation wavelength of 325 nm. The surface composition and chemical states of the samples were characterized by an X-ray photoelectron spectrometer (XPS, Thermal Scientific ESCALAB 250Xi). NH3-TPD was carried out to determine the acidity of catalysts using an automated adsorption system (ChemBET Pulsar TPR/TPD, Quantachrome) with a thermal conductivity detector (TCD). For each NH3-TPD experiment, a sample of 600 mg was placed in a quartz tubular reactor and pretreated at 350 °C with a He flow of 30 mL min−1 for 30 min, simulating the sample pretreatment in the catalytic reactor prior to the reaction. The sample was cooled to 80 °C, and then 5% NH3/He was introduced at a flow rate of 30 mL min−1 for 30 min at 80 °C, and then the sample was purged in He stream until a constant TCD level was obtained. The reactor temperature was programmed at a rate of 10 °C min−1 to 600 °C and the desorbed NH3 was detected online by the TCD. Considering the pretreatment temperature, the signals above 350 °C could be assigned to the evolution of NH3 from the thermal decomposition of ammonium or carbonate residues in the samples, and had no effects on the overall acidity of the samples.152.3. Catalytic reaction
The catalysts were evaluated for the dehydration of LA in a fixed-bed quartz reactor (11 mm i.d.) using 0.25–1 g of catalyst at 350 °C under atmospheric pressure. An aqueous solution of 20 wt% LA (1.2 mL h−1) was fed into the reactor by a HPLC pump (Series 3, 0.01–5 mL min−1, SS, S. G. Seal Self Flush, Pulse Damper) with nitrogen (30 mL min−1) as carrier. The contact time, decided by all these reaction conditions, were calculated according to the literature.30 All the reactants and products were preheated to 160 °C to avoid undesired condensation.26 The reaction products and unconverted LA were collected in a cold trap of −5 °C and analyzed offline by gas chromatograph (GC 7900, Techcomp Ltd.) equipped with a FID detector and a TM-SuperWax column (30 m × 0.25 mm × 0.25 μm, Techcomp Ltd.). The reaction was conducted for 9 h, and the products of the first three hours were not taken into account because they did not satisfy a good mass balance. A comprehensive evaluation result for the sample was derived by solving the average conversions or selectivities during 4–9 h. The LA conversion and product selectivity were calculated by3. Results and discussion
3.1. Catalyst characterization
| Catalyst | Particle sizea (μm) | Surface area (m2 g−1) | Pore volume (mL g−1) | Interplanar spacingb (nm) | Crystal sizeb (nm) | Acid amount (μmol g−1) |
|---|---|---|---|---|---|---|
| a Determined by SEM.b Determined by enlarged (121) diffraction peaks of XRD patterns. | ||||||
| Commercial | 0.2–1.2 | 4.2 | 0.006 | 0.3102 | — | 0.21 |
| Co-pre | 0.1–0.6 | 10.1 | 0.027 | 0.3104 | — | 4.08 |
| Water/ult | 0.1–0.8 | 9.5 | 0.024 | 0.3088 | — | 6.83 |
| EtOH/ult-0 h-500 | 0.03–0.3 | 20.0 | 0.102 | 0.3063 | 60.0 | 21.15 |
| EtOH/ult-1 h-500 | 0.03–0.3 | 18.5 | 0.095 | 0.3081 | 66.7 | 19.04 |
| EtOH/ult-2 h-500 | 0.03–0.3 | 17.9 | 0.094 | 0.3096 | 72.9 | 18.22 |
| EtOH/ult-24 h-500 | 0.03–0.3 | 17.7 | 0.093 | 0.3099 | 79.4 | 17.92 |
| EtOH/ult-0 h-350 | 0.03–0.3 | 17.4 | 0.069 | 0.3063 | 84.1 | 6.92 |
| EtOH/ult-0 h-600 | 0.03–0.4 | 15.8 | 0.073 | 0.3070 | 87.3 | 11.22 |
| EtOH/ult-0 h-700 | 0.1–0.8 | 5.9 | 0.031 | 0.3072 | — | 2.22 |
The specific surface area and pore volume for all the BaSO4 catalysts are summarized in Table 1. The first four rows exhibited considerable differences in surface area (4.2 to 20.0 m2 g−1) and pore volume (0.006 to 0.102 mL g−1) among the samples prepared with different methods. The BET surface area and pore volume of the commercial sample were very low due to its big particle size and nonporous structure. The samples synthesized in water with and without ultrasonic treatment exhibited similar medium surface area and pore volume. In contrast, the catalysts prepared in ethanol had much higher surface area and pore volume because they had smaller particle size and porous structure. These results indicated that the solvent had more significant effects on the particle morphology than ultrasound treatment. Because of the lower solubility of precursors, ethanol could reduce the particle size and restrain the particle growth.31–33
Entries 4 to 10 compared the EtOH/ult samples with different aging time or different calcination temperature (350 to 700 °C). When the aging time increased from 0 to 24 h, the BET surface area slightly decreased from 20.0 to 17.7 m2 g−1, and the pore volume decreased from 0.102 to 0.093 mL g−1, indicating slow crystal growth during the aging process. Entries 8 to 10 showed that the increase of calcination temperature led to a sharp decline of surface area, especially at 700 °C, which could be attributed to the accelerated recrystallization under high temperatures. The recrystallization increased the particle size and decreased the surface area. An exception was the sample calcined at 350 °C, which displayed a lower surface area than that at 500 °C due to the undesired carbonization of adsorbed ethanol on the catalyst surface, as confirmed by its ash appearance and the TG measurement (Fig. S2†).
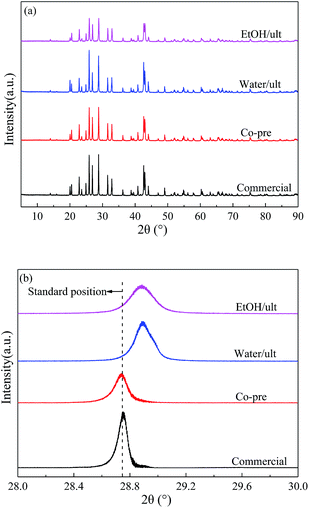 | ||
| Fig. 1 (a) XRD patterns and (b) enlarged (121) diffraction peaks of BaSO4 catalysts prepared with different methods. | ||
The enlarged XRD (121) diffraction peaks of BaSO4 aged for different time were compared in Fig. 2(a). With the increase of aging time, the shift of the (121) diffraction peak gradually decreased, indicating that the interplanar spacing became closer to the standard value (entries 4–7 in Table 1) and the integrality of crystals was improved. Meanwhile, the full width at half maximum (FWHM) of the (121) diffraction peak decreased from 0.169° to 0.158°, 0.151° and 0.144° when the aging time increased from 0 to 1, 2 and 24 h respectively, indicating that the crystal grew larger with longer aging time (Table 1). These results revealed that the defect-induced lattice contraction was gradually eliminated due to the improvement of crystal integrality and the reduction of defects during the aging process. The BaSO4 sample prepared without aging had the most significant crystal defects among these four samples.
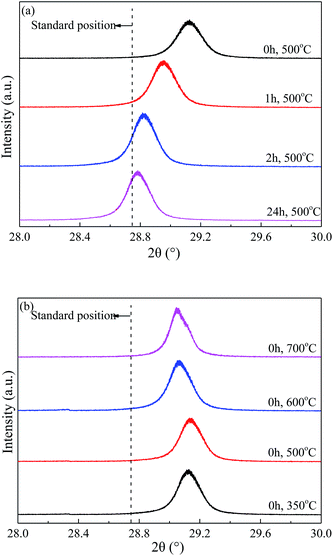 | ||
| Fig. 2 Enlarged XRD (121) diffraction peaks of BaSO4 catalysts (a) aged with varied time length and (b) calcined at different temperature. | ||
Fig. 2(b) compared the crystal textures of the BaSO4 samples calcined at different temperatures. The left shift of diffraction peak only slightly reduced with increasing calcination temperature, suggesting that the calcination temperature had insignificant effect on the crystal defects. In addition, the crystal size displayed a modest growth with the calcination temperature increasing from 500 °C to 700 °C (Entries 4, 9 and 10 in Table 1). The abnormally larger crystal size observed in the sample calcined at 350 °C was likely attributed to the residue of deposited ethanol in crystals. Combined with the discussion on the particle size and morphology in 3.1.1, it can be concluded that the high-temperature calcination significantly increased the particle size and reduced the pore structure, but only slightly affected the crystal textures and defects.
| Aging time (h) | 0 | 1.0 | 2.0 | 24.0 |
|---|---|---|---|---|
| S2p BE, eV | 168.82 | 168.82 | 168.86 | 168.89 |
| O1s BE, eV | 531.85 | 531.90 | 531.96 | 531.98 |
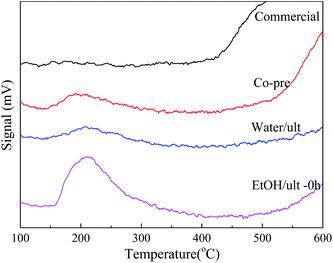
As shown in Table 1 and Fig. 4, the EtOH/ult BaSO4 sample had the highest acid amount of 21.15 μmol g−1, indicating that ethanol solvent and ultrasound treatment enhanced the formation of surface acid sites. In contrast, the acid amount of Water/ult sample was only 6.83 μmol g−1, mainly because the change of solvent significantly affected the particle size and surface area. Nevertheless, both the EtOH/ult and Water/ult samples had larger acid amount than the Co-pre sample, which confirmed the positive effect of ultrasonic treatment. Meanwhile, the peak temperatures of desorption were 192, 207 and 211 °C for the Co-pre, Water/ult and EtOH/ult samples, respectively, indicating that the catalyst acidity became slightly stronger when using ethanol solvent and ultrasonic treatment.
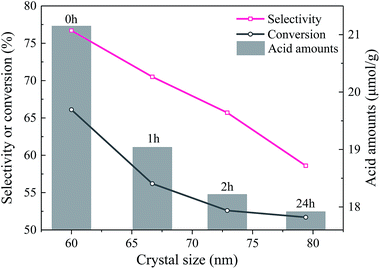
The NH3-TPD results of the EtOH/ult samples with varied aging time were compared in Fig. S4(a).† With increasing aging time, the overall acid amount slightly decreased, as listed in Table 1. The decrease of acidity amount was attributed to the decrease of defects, especially the point defects, which was revealed by the XPS and shift of XRD diffraction peaks. These defects accompanied with local imbalance of electrons can provide the active adsorption sites for NH3. With the increase of aging time, the amount of defects decreased and resulted in the reduction of acid sites.
The NH3-TPD profiles of the BaSO4 samples calcined at different temperatures are shown in Fig. S4(b).† The calcination temperature had significant effects on the acidic properties. The catalyst calcined at 350 °C was not considered because of the undesired carbonization of the deposited ethanol on the surface. The peak temperature of desorption decreased from 211 to 195 °C when the calcination temperature increased from 500 to 700 °C. In addition, the acid amount significantly decreased with increasing calcination temperature, and the largest acid amount was obtained with the catalyst calcined at 500 °C. One reason was the notable decrease of surface area which directly reduced the acid amounts, because NH3 molecules and reactants were only adsorbed on the surface. However, this was not the only reason. Note that the acid density also decreased, some acid sites should also disappeared under high temperature, consisting with the unstable feature of crystal defects with a higher electron density. This result further confirmed that these crystal defects acted as acid sites and they were unstable under high temperatures.
3.2. Catalytic evaluation
| Catalyst | Reaction conditions | Conversion (%) | Selectivity (%) | Ref. | ||||
|---|---|---|---|---|---|---|---|---|
| T (°C) | N2 flow (mL min−1) | Space velocity (h−1) | Contact time (s) | AA | AD | |||
| Commercial | 350 | 30 | 2.5 (WHSV) | 0.19 | 29.8 | 28.8 | 41.2 | This work |
| Co-pre | 350 | 30 | 2.5 (WHSV) | 0.19 | 69.5 | 65.8 | 23.2 | |
| Water/ult | 350 | 30 | 2.5 (WHSV) | 0.19 | 70.1 | 69.7 | 18.0 | |
| EtOH/ult | 350 | 30 | 2.5 (WHSV) | 0.19 | 77.6 | 78.9 | 12.7 | |
| EtOH/ult | 350 | 30 | 5.0 (WHSV) | 0.10 | 66.1 | 76.7 | 16.4 | |
| Na2HPO4/NaY | 350 | 30 | 2.7 (LHSV) | 0.61 | 78.3 | 72.3 | 5.6 | 30 |
| HAP1.62-360 | 360 | 15.5 | 1.4 (WHSV) | — | 84 | 74 | 18 | 21 |
| BaSO4 | 400 | 1 | 2.1 (WHSV) | 0.5 | 100 | 74 | — | 28 |
The commercial BaSO4 catalyst showed a low LA conversion of 29.8% and a low AA selectivity of 28.8%. In contrast, the other three catalysts prepared in this work had enhanced LA conversion and AA selectivity. The Co-pre and Water/ult catalysts showed similar LA conversion of 69.5% and 70.1%, respectively, while Water/ult had a slightly higher AA selectivity (69.7%) than Co-pre (65.8%). Among all the prepared catalysts, EtOH/ult had the best performance with 77.6% LA conversion and 78.9% AA selectivity under the same reaction condition. By decreasing the space velocity, the LA conversion increased to 97.5% while maintaining the selectivity to AA (Table S3†). As shown in Table S1,† the EtOH/ult catalyst had carbon balance close to 100%, indicating that the reaction data were reliable and the amount of other unknown side products was very low. However, some other catalysts had lower carbon balance, due to the poor selectivity to AA and formation of heavier products that could not be detected by GC. Considering the typical catalysts shown in Table 3, the HAP1.62-360 catalyst was evaluated within TOS = 6–8 h,21 and the Na2HPO4/NaY and BaSO4 catalysts were evaluated within TOS = 2 h.28,30 Overall, the EtOH/ult catalyst had a higher efficiency of AA production than the typical catalysts in the literature.21,28,30 In the work of Peng et al., the BaSO4 catalyst was reported to have an AA selectivity of 74% and LA conversion of 100% at a contact time of 0.5 s and temperature of 400 °C. In this work, the EtOH/ult BaSO4 catalyst had a LA conversion of 77.6% at a much shorter contact time (0.19 s) and much lower temperature (350 °C), suggesting EtOH/ult had a higher activity. In addition, EtOH/ult showed slightly higher selectivity to AA.
The difference in the catalyst activity could be attributed to the difference in acid amounts. With increasing crystal defects (Fig. S3a†) and surface area (Table 1), much more acid sites were observed with the EtOH/ult catalyst, which were the active sites of LA conversion.12–14 In addition, the EtOH/ult catalyst showed a higher AA selectivity (78.9%) than the Co-pre (65.8%) and Water/ult catalyst (69.7%), due to their difference in weak and medium acid amount. In this work, the acid sites of all BaSO4 catalysts were of weak to medium strength, which were suitable for the dehydration of LA to AA.14,40 Few strong acid sites were observed, indicating that no undesired active sites were provided. Thus, most of the side reactions occurred without catalysis or on other sites such as the surface hydroxyl groups.9,13,17,18 The increase of suitable acid sites enhanced the effective adsorption and subsequent dehydration of LA to AA, while the side reactions such as the decarbonylation/decarboxylation and polymerization were therefore maintained or suppressed by the promotion of the main dehydration reaction. As a result, both the LA conversion and AA selectivity were enhanced. Furthermore, the synchronous increase of acid sites and crystal defects indicated that the formation of acidity could be attributed to the escaped cations in crystal defects.
| Catalyst | Conversion (%) | Selectivity (%) | |||
|---|---|---|---|---|---|
| AA | AD | AcOH | PA | ||
| a Conditions: reaction temperature 350 °C, BaSO4 catalyst: 0.25 g, feed flow rate: 1.2 mL h−1, WHSV = 5 h−1, LA feedstock: 20 wt% in water, carrier gas N2: 30 mL min−1, TOS = 4–9 h. | |||||
| EtOH/ult-0 h-500 | 66.1 | 76.7 | 16.4 | 2.9 | 2.0 |
| EtOH/ult-1 h-500 | 56.2 | 70.5 | 18.2 | 3.0 | 3.0 |
| EtOH/ult-2 h-500 | 52.6 | 65.7 | 17.2 | 3.2 | 2.7 |
| EtOH/ult-24 h-500 | 51.7 | 58.6 | 15.2 | 2.7 | 1.4 |
| Catalyst | Conversion (%) | Selectivity (%) | |||
|---|---|---|---|---|---|
| AA | AD | AcOH | PA | ||
| a Conditions: reaction temperature 350 °C, BaSO4 catalyst: 0.25 g, feed flow rate: 1.2 mL h−1, WHSV = 5 h−1, LA feedstock: 20 wt% in water, carrier gas N2: 30 mL min−1, TOS = 4–9 h. | |||||
| EtOH/ult-0 h-350 | 72.9 | 66.4 | 17.4 | 3.1 | 1.0 |
| EtOH/ult-0 h-500 | 66.1 | 76.7 | 16.4 | 2.9 | 2.0 |
| EtOH/ult-0 h-600 | 45.8 | 59.2 | 20.5 | 3.5 | 2.3 |
| EtOH/ult-0 h-700 | 28.2 | 59.4 | 21.3 | 6.6 | 3.8 |
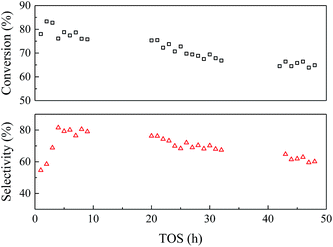 | ||
| Fig. 6 Catalyst stability of EtOH/ult-0 h-500 within 48 h. Temperature 350 °C, WHSV = 2.5 h−1, LA feedstock: 20 wt% in water, carrier gas N2: 30 mL min−1. | ||
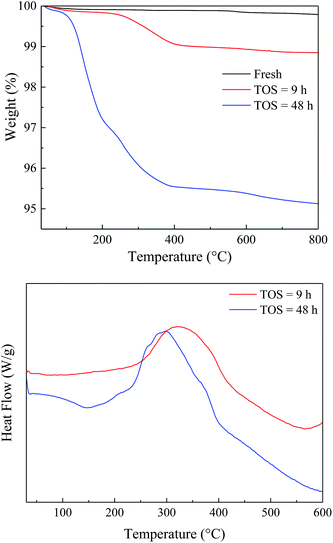
To study the variation of the catalysts during the reaction, the spent catalysts were analyzed by TG-DTA and the results were shown in Fig. 7. The weight loss of the spent catalyst was relatively small due to the slow carbon deposition (Table S1†). Both the EtOH/ult-0 h-500 spent for 9 and 48 h had most weight loss under 400 °C and showed a broad heat flow peak around 300 °C, indicating complex chemical composition of the deposition. Furthermore, XRD was used to study the crystal texture of the spent catalysts, and the results were shown in Fig. S6.† The intensity of diffraction peak was reduced after reaction because of the carbon deposition. No peak shift was observed in the enlarged patterns, indicating that the crystal texture was stable during the reaction and the carbon deposition should be responsible for the catalyst deactivation.
4. Conclusions
The structure–activity relationship of the BaSO4 catalyst was studied for the dehydration reaction of LA to AA. Specific conditions such as ethanol solvent and ultrasonic treatment were employed in the co-precipitation preparation of BaSO4 catalysts, and the obtained catalyst had a much smaller crystal size and more crystal defects. These catalysts, denoted as EtOH/ult, also had much higher surface area and acid amount. Further studies of the catalyst texture and binding energy revealed that the crystal defects with unbalanced electrons provided acid and basic sites, which acted as the active sites in LA dehydration. This was further confirmed by changing the catalyst preparation conditions such as the aging time and calcination temperature, in which the catalysis performance had a good correlation with the amounts of crystal defects and acid amounts. The highest surface area and acid amount were obtained over the EtOH/ult-0 h-500 catalyst, which consequently showed enhanced reaction activity (88.9% LA conversion) and selectivity (78.8% AA selectivity).Acknowledgements
This work was supported by the National Natural Science Foundation of China (No. 21676155).References
- M. Dusselier, P. Van Wouwe, A. Dewaele, E. Makshina and B. F. Sels, Energy Environ. Sci., 2013, 6, 1415 CAS.
- P. Gallezot, Chem. Soc. Rev., 2012, 41, 1538–1558 RSC.
- Y. Fan, C. Zhou and X. Zhu, Catal. Rev., 2009, 51, 293–324 CAS.
- Z. Y. Zhong, P. J. Dijkstra and J. Feijen, J. Am. Chem. Soc., 2003, 125, 11291–11298 CrossRef CAS PubMed.
- M. A. Abdel-Rahman, Y. Tashiro and K. Sonomoto, Biotechnol. Adv., 2013, 31, 877–902 CrossRef CAS PubMed.
- F. Auneau, L. S. Arani, M. Besson, L. Djakovitch, C. Michel, F. Delbecq, P. Sautet and C. Pinel, Top. Catal., 2012, 55, 474–479 CrossRef CAS.
- Y. Wang, W. Deng, B. Wang, Q. Zhang, X. Wan, Z. Tang, Y. Wang, C. Zhu, Z. Cao, G. Wang and H. Wan, Nat. Commun., 2013, 4, 2141 Search PubMed.
- X. Xu, J. Lin and P. Cen, Chin. J. Chem. Eng., 2006, 14, 419–427 CrossRef CAS.
- S. Varadarajan and D. J. Miller, Biotechnol. Prog., 1999, 15, 845–854 CrossRef CAS PubMed.
- Z. Zhai, X. Li, C. Tang, J. Peng, N. Jiang, W. Bai, H. Gao and Y. Liao, Ind. Eng. Chem. Res., 2014, 53, 10318–10327 CrossRef CAS.
- R. E. Holmen, Minnesota Mining and MFG, US Pat., 2859240, 1958.
- P. Sun, D. Yu, K. Fu, M. Gu, Y. Wang, H. Huang and H. Ying, Catal. Commun., 2009, 10, 1345–1349 CrossRef CAS.
- H. Wang, D. Yu, P. Sun, J. Yan, Y. Wang and H. Huang, Catal. Commun., 2008, 9, 1799–1803 CrossRef CAS.
- J. Yan, D. Yu, H. Li, P. Sun and H. Huang, J. Rare Earths, 2010, 28, 803–806 CrossRef CAS.
- J. Yan, D. Yu, P. Sun and H. Huang, Chin. J. Catal., 2011, 32, 405–411 CrossRef CAS.
- D. Yu, P. Sun, Z. Tang, Z. Li and H. Huang, Can. J. Chem. Eng., 2011, 89, 484–490 CrossRef CAS.
- J. Zhang, Y. Zhao, X. Feng, M. Pan, J. Zhao, W. Ji and C. T. Au, Catal. Sci. Technol., 2014, 4, 1376 CAS.
- G. Näfe, Y. Traa, T. Hirth and E. Klemm, Catal. Lett., 2014, 144, 1144–1150 CrossRef.
- J. Zhang, X. Feng, Y. Zhao, W. Ji and C. T. Au, J. Ind. Eng. Chem., 2014, 20, 1353–1358 CrossRef CAS.
- C. Yuan, H. Liu, Z. Zhang, H. Lu, Q. Zhu and Y. Chen, Chin. J. Catal., 2015, 36, 1861–1866 CrossRef CAS.
- B. Yan, L. Z. Tao, Y. Liang and B. Q. Xu, ACS Catal., 2014, 4, 1931–1943 CrossRef CAS.
- B. Yan, L. Z. Tao, Y. Liang and B. Q. Xu, ChemSusChem, 2014, 7, 1568–1578 CrossRef CAS PubMed.
- E. Blanco, C. Lorentz, P. Delichere, L. Burel, M. Vrinat, J. M. M. Millet and S. Loridant, Appl. Catal., B, 2016, 180, 596–606 CrossRef CAS.
- G. Näfe, M. A. López-Martínez, M. Dyballa, M. Hunger, Y. Traa, T. Hirth and E. Klemm, J. Catal., 2015, 329, 413–424 CrossRef.
- V. C. Ghantani, S. T. Lomate, M. K. Dongare and S. B. Umbarkar, Green Chem., 2013, 15, 1211 RSC.
- E. Blanco, P. Delichere, J. M. M. Millet and S. Loridant, Catal. Today, 2014, 226, 185–191 CrossRef CAS.
- Y. Matsuura, A. Onda, S. Ogo and K. Yanagisawa, Catal. Today, 2014, 226, 192–197 CrossRef CAS.
- J. Peng, X. Li, C. Tang and W. Bai, Green Chem., 2014, 16, 108–111 RSC.
- C. Tang, J. Peng, G. Fan, X. Li, X. Pu and W. Bai, Catal. Commun., 2014, 43, 231–234 CrossRef CAS.
- J. Zhang, Y. Zhao, M. Pan, X. Feng, W. Ji and C. T. Au, ACS Catal., 2011, 1, 32–41 CrossRef CAS.
- D. Wu, H. Zhu, C. Zhang and L. Chen, Chem. Commun., 2010, 46, 7250–7252 RSC.
- H. P. Cong and S. H. Yu, Cryst. Growth Des., 2009, 9, 210–217 CAS.
- V. Ramaswamy, R. M. Vimalathithan and V. Ponnusamy, J. Ceram. Process. Res., 2011, 12, 173–175 Search PubMed.
- L. Y. Chen, Y. T. Yin, C. H. Chen and J. W. Chiou, J. Phys. Chem. C, 2011, 115, 20913–20919 CAS.
- J. Wang, S. Hou, H. Chen and L. Xiang, J. Phys. Chem. C, 2014, 118, 19469–19476 CAS.
- H. Zeng, G. Duan, Y. Li, S. Yang, X. Xu and W. Cai, Adv. Funct. Mater., 2010, 20, 561–572 CrossRef CAS.
- J. Haubrich, E. Kaxiras and C. M. Friend, Chem.–Eur. J., 2011, 17, 4496–4506 CrossRef CAS PubMed.
- A. Linsebigler, G. Q. Lu and J. T. Yates, J. Chem. Phys., 1995, 103, 9438–9443 CrossRef CAS.
- T. L. Thompson and J. T. Yates, Chem. Rev., 2006, 106, 4428–4453 CrossRef CAS PubMed.
- X. Zhang, L. Lin, T. Zhang, H. Liu and X. Zhang, Chem. Eng. J., 2016, 284, 934–941 CrossRef CAS.
Footnote |
| † Electronic supplementary information (ESI) available. See DOI: 10.1039/c6ra28429a |
| This journal is © The Royal Society of Chemistry 2017 |


