Electrolytes at interfaces: accessing the first nanometers using X-ray standing waves†
Soumaya
ben Jabrallah
a,
Florent
Malloggi
*a,
Luc
Belloni
a,
Luc
Girard
b,
Dmitri
Novikov
c,
Cristian
Mocuta
d,
Dominique
Thiaudière
d and
Jean
Daillant
d
aLaboratoire Interdisciplinaire sur l'Organisation Nanométrique et Supramoléculaire, NIMBE, CEA, CNRS, Université Paris-Saclay, CEA Saclay 91191 Gif sur Yvette Cedex, France. E-mail: florent.malloggi@cea.fr
bICSM UMR 5257 – CEA/CNRS/UM/ENSCM, Site de Marcoule, Bâtiment 426 BP 17171 F-30207 Bagnols sur Cèze Cedex, France
cDeutsches Elektronensynchrotron DESY, Notkestrasse 85, D-22607 Hamburg, Germany
dSynchrotron SOLEIL, L'Orme des Merisiers, Saint-Aubin, BP 48, F-91192 Gif-sur-Yvette Cedex, France
First published on 29th November 2016
Abstract
Ion–surface interactions are of high practical importance in a wide range of technological, environmental and biological problems. In particular, they ultimately control the electric double layer structure, hence the interaction between particles in aqueous solutions. Despite numerous achievements, progress in their understanding is still limited by the lack of experimental determination of the surface composition with appropriate resolution. Tackling this challenge, we have developed a method based on X-ray standing waves coupled to nano-confinement which allows the determination of ion concentrations at a solid–solution interface with a sub-nm resolution. We have investigated mixtures of KCl/CsCl and KCl/KI in 0.1 mM to 10 mM concentrations on silica surfaces and obtained quantitative information on the partition of ions between bulk and Stern layer as well as their distribution in the Stern layer. Regarding partition of potassium ions, our results are in agreement with a recent AFM study. We show that in a mixture of KCl and KI, chloride ions exhibit a higher surface propensity than iodide ions, having a higher concentration within the Stern layer and being on average closer to the surface by ≈1–2 Å, in contrast to the solution water interface. Confronting such data with molecular simulations will lead to a precise understanding of ionic distributions at aqueous interfaces.
1 Introduction
The interfacial behavior of ions is of key importance in a number of phenomena and processes ranging from biological systems to micro- and nanofluidics. Ion–surface interactions are important both in a direct way, e.g. in sorption or ion exchange related effects, or indirectly because modifying the effective surface charge they will affect the structure of the electric double layer, hence the interaction between charged particles in aqueous solutions.1 In this context, particularly interesting are the so-called “specific effects”, referring to phenomena where ions of the same valency have a different effect.2–4 These effects resulting from a subtle balance between polarisability, hydration and interfacial water structure usually follow “Hofmeister series” (SCN− > ClO4− ≈ I− > Br− > Cl− > F− for anions) in direct or reverse order.4–6 They have a major effect on as diverse phenomena as colloidal stability,2 protein stability3 or the surface tension of electrolytes.7 In environmental sciences, the interaction between ions, humics and minerals influences the mobility and availability of pollutants.8 The interfacial behavior of ions is also of key importance in micro- and nanofluidics.9 Phenomena occurring within the diffuse Gouy–Chapman layer indeed become dominant in determining flow properties as channel size, Debye length and slip length become on the same order of magnitude, leading to unusual phenomena.10 For example, with charged walls, channels can be filled with a unipolar solution of counter-ions, suggesting that the type and concentration of ions can be controlled by the surface charge density of the channel wall.11,12 In addition, “specific effects” could allow for even finer control over the ion type as specific adsorption will eventually determine the double layer structure.13Determining the interfacial distribution of ions with sufficient accuracy is, however, a challenge. Indeed, the ionic concentration deviates from the bulk concentration only in the Stern layer and diffuse Gouy–Chapman layer: from 1 nm to 100 nm depending on the solution concentration. Several surface sensitive techniques like photoemission,14–17 sum-frequency generation (SFG), second-harmonic generation (SHG),18,19 X-ray fluorescence7 or X-ray reflectivity20,21 have been used. More recently Atomic Force Microscopy has also been used to directly probe the electrical double layer.22–24 However, SFG and SHG have surface sensitivity but are not directly sensitive to ions and lack depth resolution, X-ray reflectivity or neutron reflectivity have no direct element sensitivity. Though photoemission has recently been extended to determine surface potential at the colloid/electrolyte interface,16 it has no direct sensitivity to the ion distribution. In this study, we used the X-ray standing waves (XSW) technique which has the advantage of having both element and depth sensitivity to probe the first nanometers at the solid surface. The technique first developed to locate atoms in crystals or adsorbed at crystal surfaces25 has also been applied to soft condensed matter.26 It has in particular been used to investigate the adsorption of heavy ions on crystal surfaces from solutions.27,28 We show here that the method can be extended to light ions (down to chlorine or sulfur) on surfaces like silica which are of very broad interest in colloidal science.
2 Experimental
2.1 The X-ray standing wave technique
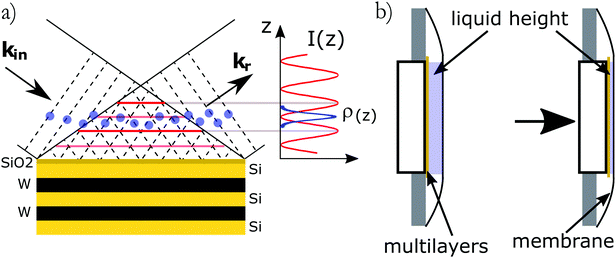
The X-ray standing waves (XSW) technique is based upon creating an electromagnetic standing wave field by interference between incident and Bragg reflected X-rays (Fig. 1a).29 The standing wave phase depends on the deviation from the exact Bragg angle and can be varied in a controlled way, thus moving the X-ray field nodes in a range spanning half of the diffraction plane spacing. The variation of secondary fluorescence signal coming from the atoms, that get excited by this XSW field, can be then used to locate the atom positions with (sub)Angstrom resolution. The method allows one to simultaneously investigate positions of different atoms, monitoring their specific emission lines. The standing waves are present where the incident and diffracted waves overlap, which includes the solid/liquid interface and the bulk solution above. A specific XSW variant especially suited for investigation of liquid/solid interfaces employs XSW generators, based on artificially grown multilayer structures (ML). Another advantage of this approach is the possibility to tune the resolution by changing the diffracting plane spacing as well as the large choice of ML materials. In particular it would be possible to apply an external bias by embedding a conducting layer in the ML. The ML-generated XSW were used for instance for investigation of Zn2+ distribution above a charged lipid layer27 and in studies of electrochemical deposition of iodine on Pt.30In order to calculate the fluorescence intensity, the sample is divided in as many layers j as necessary to describe the elemental distribution. We choose the layers to be thin enough for the local density of element k in layer j ρk,j(z) to be constant. The fluorescence intensity for element k at grazing angle of incidence θ is then given by:
 | (1) |
 | (2) |
| Ej(x,z) = (A+jeikz,jz + A−je−ikz,jz)e+i(ωt−kx,jx), | (3) |
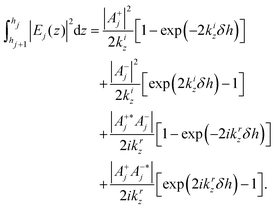 | (4) |
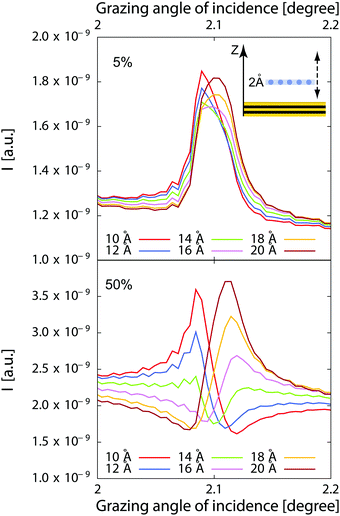
Though this method is accurate, it does not allow one to develop an intuition of the expected shape of the standing wave curve. For a monolayer located at z, one would have
 | (5) |
Obviously, the sensitivity is very high for the 50% case. However the different location can still be distinguished in a fit with good quality data in the 5% case as the shape of the curve is still significantly different.
2.2 Experimental methods
X-ray standing-wave measurements were performed at the DiffAbs beamline of Synchrotron SOLEIL, Saint-Aubin, France. A schematic of the methods used to probe ions at interfaces as well as the setup used at the DiffAbs beamline are shown on Fig. 1. The samples consisted in an ultra thin liquid layer sandwiched between the multilayer substrate used to create the standing waves and a 4 μm thick ultralene® X-ray transparent window (Fig. 1b). The experiments were performed using a 7 keV incident beam energy with a small parallel beam (250 μm × 200 μm) allowing to resolve the Bragg peaks.The substrates used in these experiments were Si–W multilayers (150 periods of 2.5 nm) manufactured by AXO (Dresden, Germany). They include a thin (<0.5 nm) Cr layer below the top SiO2 to serve as a reference for the phase. Substrates were cleaned following the RCA cleaning procedure33 before being used. KCl, CsCl, CsI (Sigma-Aldrich, 99.9995% purity) and KI (Sigma-Aldrich, 99.999% purity) were used without further purification. Molar stock solutions were prepared using water from a Millipore Milli-Q® system (18.2 MΩ cm resistivity) and further diluted and mixed just before the experiments. Small volumes of solution ranging from 250 nl to 1.5 μl were introduced in the cell. The multilayer was then pressed against the cover ultralene® film allowing for the control of the sample thickness (Fig. 1b). All manipulations were performed in a clean room to avoid dust contamination.
3 Results
Both reflectivity curves for sample characterization and fluorescence curves around the Bragg peak were recorded for each sample. The full analysis of the results first requires the determination of the liquid layer thickness by X-ray reflectivity. The fluorescence of each ion as a function of the grazing angle of incidence around the Bragg peak (standing wave curve) is then determined by fitting the fluorescence spectrum for each angle of incidence, and each standing wave curve is finally analysed to obtain the ionic distribution profiles. Bare substrates and empty samples with Ultralene window were first measured as a reference for background subtraction.3.1 Sample thickness determination using X-ray reflectivity
Reflectivity curves were recorded using a scintillator detector and carefully normalized to the incident beam intensity. They were analyzed using the Reflec software (A. Gibaud, G. Vignaud) based on the matrix method.31 We used a model consisting of the multilayer substrate, a solution layer and the 4 μm thick Ultralene® film which was fitted to the data, allowing to determine the thickness of the liquid layer. Obtaining good fits is important in order to constrain the standing waves analysis. Fig. 3 shows experimental reflectivity curves (as measured, without any corrections) as well as the corresponding fits before and after solution injection. The fitting procedure includes illuminated area and water layer absorption corrections. In order to determine the thickness from the fit of reflectivity curves, the empty cell curves were fitted first. A solution layer was then added to the model without allowing any change in the multilayer parameters. The change in refractive index when a liquid layer is present modifies the shape of the curve in the qz ≈ 0.1 Å−1 region i.e. in between the critical angle for total external reflection at the substrate-solution interface and the Bragg peak (Fig. 3). Though the solution layer is generally either too thick or not homogeneous enough to give rise to fringes that could be resolved in the reflectivity curves, its thickness can nevertheless be determined from the shape of the reflectivity curve in the region below and close to the critical angle (qz ∼ 0.05 Å−1 in Fig. 3). For a very thick layer, the intensity at the critical angle can indeed be reduced by more than one order of magnitude compared to the empty cell because the incident and reflected X-rays will have to travel hundreds of microns in the absorbing solution for grazing angles of incidence in the mrad range, even for a liquid layer thickness <1 μm. One should also notice that the thickness we determine is an average over the approximately 8 mm long and 250 μm wide beam footprint on the sample.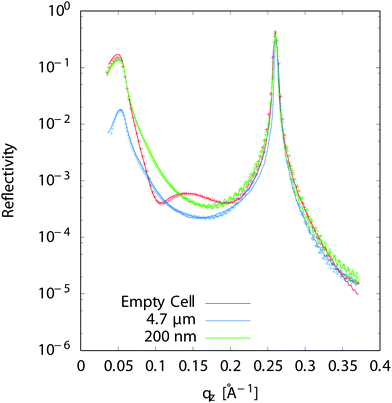 | ||
| Fig. 3 Measured X-ray reflectivity and best fit for an empty cell (no liquid), a 4.7 μm and a 200 nm liquid layer thickness. | ||
3.2 X-ray fluorescence measurements and analysis
Fluorescence curves were recorded using a 4-element energy sensitive detector and first accurately normalized to the incident beam intensity. The fluorescence curves were analyzed following the procedure detailed in ref. 7 using a home made software with a peak model based on the physics of detection, including a Voigtian peak shape, a tail and a shelf.34 The different peak parameters have a simple energy dependence, thus reducing the number of fitting parameters. Another advantage of this method is that the background from photon counting being built up by the shelf contributions, it is automatically and consistently subtracted. In order to determine the interfacial contribution of ions only, we also need to subtract the contribution of elements present in the sample cell, mainly chlorine in the multilayer substrate and calcium in the ultralene film. This is done by manually subtracting the reference sample contribution, yielding standing wave curves for the interface and solution only.Representative spectra are given on Fig. 4 for a mixture of 10 mM solutions of KCl and KI. The Cl Kα line at 2622 eV, the Ar Kα line at 2957 eV (Ar is present in air), the K Kα line at 3313 eV, the Ca Kα and Kβ lines at 3690 eV and 4014 eV (Ca is an impurity in the Ultralene film, not affecting the measurements) and the I Lα line at 3938 eV and Lβ line at 4220 eV can in particular be identified on Fig. 4. An advantage of fluorescence based methods is their high sensitivity to chemical elements in low quantities (traces). Samples with minute concentration (10−4 M) or very thin liquid layers (a few 10 s of nms) could in particular be studied. Integrated over the beam footprint for a 100 nm thick sample, the technique allows to resolve 1 femtomole or better.
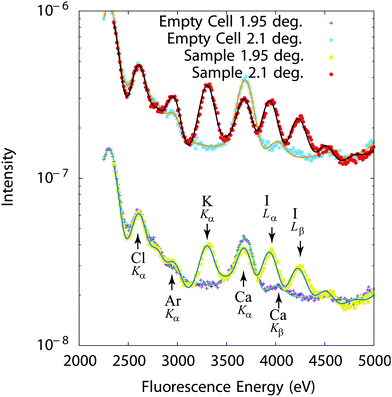 | ||
| Fig. 4 Fluorescence intensity (experiments: symbols–fits: solid lines) recorded at 1.95° and 2.1° (Bragg peak) from an empty cell and a 250 nm thick cell filled with a 10 mM KCl + 10 mM KI solution. | ||
The differences in the curves recorded at a grazing angle of incidence of 0.25° below the Bragg peak (1.95°) and at the Bragg peak (grazing angle of incidence of 2.10°) in Fig. 4 directly result from the interfacial distribution of ions. Indeed, shifting the standing wave field distribution, different positions above the interface are probed as shown in Fig. 2. This is however more clearly seen by representing the fluorescence for each chemical element as a function of the grazing angle of incidence around the Bragg peak (standing wave curves).
3.3 Standing wave curves
Typical standing wave curves (fluorescence intensity for each element as a function of the grazing angle of incidence across the Bragg peak) are given on Fig. 5.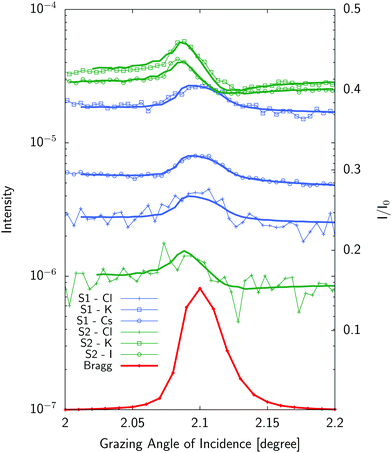 | ||
| Fig. 5 Standing wave curves (experiments:symbols–fits:solid lines) for a mixture of 1 mM solutions of KCl and CsCl (S1) and 10 mM solutions of KCl and KI (S2). Liquid layer sample thickness was 2.85 μm for (S1) and 250 nm for (S2) respectively. Curves have been shifted for clarity. The Bragg peak is shown in red as reference. See Table S1 in ESI† for fitting parameters. | ||
Standing wave curves for the thicker sample (2.85 μm) have a profile which resembles the Bragg peak one. This is expected as these curves are dominated by the homogeneous ionic distribution in the bulk liquid (Fig. 2). Neglecting fluorescence effects close to the interface for a thick solution layer, the fluorescence will be excited by the incident and reflected beam and will be roughly proportional to the incident beam plus reflected beam intensity which is peaked at the Bragg angle. Differences with respect to this shape give access to surface effects which can be determined and are more prominent for thinner samples (like the 250 nm thick sample) also shown in Fig. 5. In such a case, the position and the shape of the standing wave curve is already indicative of the position of the ions with respect to the multilayer which is therefore unambiguously determined.
As mentionned above, we analyzed the standing wave curves using a very simple model consisting only of a homogeneous bulk solution and a Stern layer modelled as a stack of 2 Å thick ionic layers, one for each ion. The sample is divided in as many layers as necessary to describe the elemental distribution and the electromagnetic field is calculated in each layer using the matrix method.31 Fitting the model (eqn (5)) to the experimental curve by minimizing the χ2 function, one obtains the composition, concentration and average position of the different ions in the Stern layer.
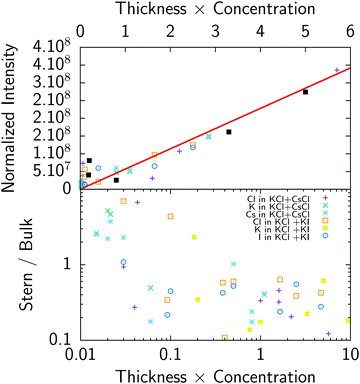
In order to get a first check of the consistency of the analysis, we have plotted on Fig. 6 (top) the normalized fluorescence intensity (i.e. fluorescence is normalized such as any single ion would give the same fluorescence intensity, this is equivalent to dividing the experimental fluorescence by BkTk in eqn (5)) as a function of the product concentration times thickness, which gives the expected number of ions in the cell. As can be seen in Fig. 6 (top), there is good correlation between fluorescence intensity and the expected number of ions: in other words fluorescence nicely follows the total number of ions. This result shows that both the fluorescence measurements, including the background subtraction procedure for chloride, and thickness determination using reflectivity curves give consistent results.
4 Discussion
4.1 Gouy–Chapman–Stern model
The simplest model used to calculate the distribution of ions at interfaces is the Gouy–Chapman–Stern model.1,35 The electric potential ϕ in the double layer obeys the Poisson equation: | (6) |
 is the charge density, with ni the concentration of the ion i of valency zi. e = 1.602 × 10⁻¹⁹ C is the elementary charge, ε0 = 8.85 × 10⁻¹² F m−1 is the vacuum permittivity and εr the relative permittivity. Concentrations in the double layer obey a Boltzmann distribution:
 | (7) |
 | (8) |
 | (9) |
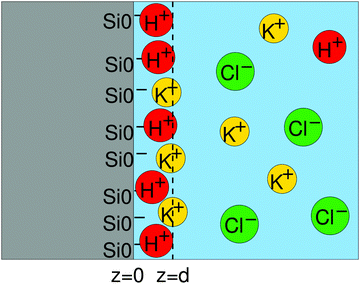 | ||
| Fig. 7 Schematics of the Stern layer and the double layer. z = d is the location of the outer Helmholtz plane. | ||
By inserting eqn (8) in eqn (9), one obtains.
 | (10) |
On the other hand, the composition of the Stern layer is determined by surface equilibria, related to the dissociation of surface silanol groups for our silica surface. For protons and a monovalent salt with cation Me+, one would have:
 | (11) |
 | (12) |
| Γ = ΓSiO− + ΓSiOH + ΓSiOC. | (13) |
| ϕ(d) − ϕ(0) = σ0/CStern. | (14) |
A bare surface density of sites Γ = 8SiO− sites per nm2 (reduced by protonation and ion complexation, eqn (13)), a capacitance of the Stern layer CStern ≈ 2.9 F m−2 and KH = 10−7.5–10−7 are well established in the literature.36 The complexation constants for cations are less documented. Davis et al.37 report a much weaker specific adsorption for SiO2 than for the other oxides, with pKK ≈ 0.5. Sonnefeld38 suggests an even weaker binding. On the contrary, Tao et al.39 and Zhao et al.24 give pKK = 1 and pKK = 2 respectively, and the results of Dishon et al.22 are consistent with even larger values (see Fig. 8 bottom).
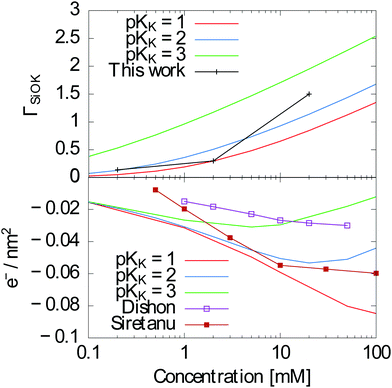 | ||
| Fig. 8 Top: ΓSiOK as measured in this work and calculated using the Gouy–Chapman–Stern model as explained above with pKK = 2. Bottom: Surface charge calculated using the same model with pKK = 1, 2 and 3 together with measurements from Dishon et al.22 and Siretanu et al.,23 showing the consistency with our results. | ||
4.2 Partition between Stern layer and solution
In contrast to the previous estimates of pKK, our measurements provide a direct access to surface concentrations. We find Potassium surface concentrations in the Stern layer of 0.14 nm−2, 0.3 nm−2 and 1.5 nm−2 for 0.1 mM, 1 mM and 10 mM KCl/KI mixtures respectively. As an indication, a 1 nm−2 surface concentration would correspond for a 2 Å thick layer to a concentration of 3 mol l−1.These results can be compared to the Gouy–Chapman–Stern model presented above in order to check whether they are in the expected range. With pKK = 2, we obtain ΓSiOK ≈ 0.13 nm−2 for a 0.1 mM solution of KCl at pH = 7, ΓSiOK ≈ 0.5 nm−2 for a 1 mM solution and ΓSiOK ≈ 1.13 nm−2 for a 10 mM solution, in fairly good agreement with our experimental results (Fig. 8 (top)). As shown on Fig. 8 (top), the agreement is less good with pKK = 1 for the 10 mM solution and significantly less good for all concentrations with pKK = 3.
Previous experiments gave access to the effective surface charge ΓSiO− instead of the K+ concentration in the Stern layer. Using the Gouy–Chapman–Stern model, we can calculate ΓSiO− using the same parameters for different concentrations, allowing for an indirect comparison of our results to previous experiments.22,23 Note that in both ref. 22 and 23, surfaces were prepared by plasma cleaning which might lead to a different surface chemistry. Whereas ref. 22 shows a better agreement with pKK = 3, ref. 23 shows better agreement with pKK = 2 as in our case.
A difference between the model and our measurements is that there is a finite reservoir of ions in our experiments, in contrast with the theory which assumes a fixed concentration. Using the Gouy–Chapman–Stern model, one expects to have in between ≈0.4 × 10¹⁴ and ≈6 × 10¹⁴ ions in the Stern layer on a 2 × 2 cm2 substrate (for ΓSiOK ≈ 0.1 nm−2 and ΓSiOK ≈ 1.5 nm−2 respectively).
We typically spread 500 nl–1 μl droplets containing 3–6 × 10¹⁴ ions for a mM solution. This crude calculation shows that a range of 0.1 to 10 is expected for the surface to bulk concentration ratio. The ratio of adsorbed ions in the Stern layer with respect to the total number of ions in the bulk is represented on Fig. 6 (bottom). This ratio ranges from 0.1 for thick and concentrated samples to ≈5 for thin layers and dilute solutions where a significant amount of ions go to the surface in agreement with the previous estimate. It also implies that the above modeling using the Poisson–Boltzmann–Stern approach, which requires an infinite reservoir, cannot be used without caution, at least for the least concentrated solutions (0.1 mM).
A ratio of 0.1 to 10 falls well in the range where the different elements can be located as discussed earlier and explains why some curves are “bulk-like” with standing wave curves having a shape which resembles the Bragg peak (concentrated thick samples) and why “surface-like” features are more prominent in others.
It should be noted here that as the Stern layer is much thinner and concentrated than the total film, the standing wave curve is mainly sensitive to the Stern layer and it is more difficult to determine a concentration profile in the rest of the film.
4.3 Distribution within the Stern layer
The standing wave technique also allows for the determination of the position of ions relative to the multilayer lattice, and therefore relative to each other. Most interesting is of course the competition between K+ and Cs+ in KCl and CsCl mixtures and between Cl− and I− in KCl and KI mixtures.Two representative examples are given on Fig. 9 for a 1 mM KCl/CsCl mixture in a 50 nm thick sample and a 1 mM KCl/KI mixture in a 120 nm thick sample. The XSW curves have been analysed using the model described above, where the ionic distributions have been convolved with the surface roughness. We first note that there is a large concentration of both cations and anions in a 4 to 5 Å thick layer, with concentrations ≈100 times larger than in the bulk of the film. Then, looking more deeply into the details, we see that in all cases, cations are located closer to the surface than anions, as expected for a negatively charged surface, and K+ and Cs+ show an almost equal propensity for the surface. Regarding the competition between Cl− and I−, we find that the center of the Cl− distribution is systematically closer to the surface, compared to the I− distribution. In this case the shift is 2.5 Å (see top inset of Fig. 9). This is in contrast with the air–water interface where I− was shown to have a higher propensity for the surface compared to Cl−.7 Interestingly enough, this higher propensity of the Cl− ions for the surface is also reflected in the Stern layer concentration as we find a ≈1.6 ± 0.3 larger concentration of chloride ions compared to iodide ions. These two findings are not necessarily in contradiction since both the surface chemistry (affecting short range interactions), including interaction with the other ions, and the dielectric function (affecting the dispersion forces) are different.
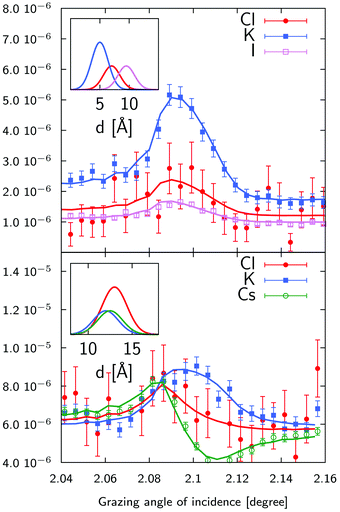 | ||
| Fig. 9 X-ray standing wave curves and ionic distributions (insets) for a 1 mM KCl/CsCl mixture (bottom) and a 1 mM KCl/KI mixture (top). The KCl/CsCl sample was 50 nm thick and the KCl/KI sample was 120 nm thick sample. The width of the distributions has been set equal to the surface roughness. As we do not determine absolute concentrations, the distributions have been scaled arbitrarily. See Table S1 in ESI† for fitting parameters. | ||
5 Conclusion
In this paper, we have shown that X-ray standing waves can be used to investigate ionic distributions in nanometer thick liquid layers using surfaces and ions of broad interest in colloidal science and nanoscience. Not only the amount of ions in the bulk and Stern layer can be determined, but also their distribution in the direction perpendicular to the surface. Confronting such data to simulations taking into account all molecular interactions40,41 should lead to a detailed understanding of ionic distributions at aqueous interfaces which is of utmost importance for several areas of science.Acknowledgements
The authors gratefully thank Christian Blot for manufacturing the sample cell and Elodie Barruet for concentration measurements of the solutions using capillary electrophoresis. The Marie Sklodowska Curie initial Training network SOMATAI under EU Grant Agreement No. 316866 is gratefully acknowledged for funding the PhD grant of Soumaya ben Jabrallah.References
- J. Lyklema, Fundamentals of Interface and Colloid Science, Solid-Liquid Interfaces, Academic Press, 1995, vol. 2 Search PubMed.
- K. Collins and M. Washabaugh, Q. Rev. Biophys., 1985, 18, 323–422 CrossRef CAS PubMed.
- M. Cacace, E. Landau and J. Ramsden, Q. Rev. Biophys., 1997, 30, 241–277 CrossRef CAS.
- Specific Ion Effects, World Scientific, Singapore, ed. W. Kunz, 2009 Search PubMed.
- P. Jungwirth and D. Tobias, Chem. Rev., 2006, 106, 1259–1281 CrossRef CAS PubMed.
- P. Koelsch, P. Viswanath, H. Motschmann, V. L. Shapovalov, G. Brezesinski, H. Mohwald, D. Horinek, R. R. Netz, K. Giewekemeyer, T. S. Alditt, H. Schollmeyer, R. von Klitzing, J. Daillant and P. Guenoun, Colloids Surf., A, 2007, 303, 110–136 CrossRef CAS.
- V. Padmanabhan, J. Daillant, L. Belloni, S. Mora, M. Alba and O. Konovalov, Phys. Rev. Lett., 2007, 99, 086105 CrossRef PubMed.
- L. Koopal, T. Saito, J. Pinheiroa and W. van Riemsdijk, Colloids Surf., A, 2005, 265, 40–54 CrossRef CAS.
- L. Bocquet and E. Charlaix, Chem. Soc. Rev., 2010, 39, 1073–1095 RSC.
- Q. Pu, J. Yun, H. Temkin and S. Liu, Nano Lett., 2004, 4, 1099–1103 CrossRef CAS.
- D. Stein, M. Kruithof and C. Dekker, Phys. Rev. Lett., 2004, 93, 035901 CrossRef PubMed.
- R. Karnik, R. Fan, M. Yue, D. Li, P. Yang and A. Majumdar, Nano Lett., 2005, 5, 943–948 CrossRef CAS PubMed.
- D.-M. Huang, C. Cottin-Bizonne, C. Ybert and L. Bocquet, Phys. Rev. Lett., 2007, 98, 177801 CrossRef PubMed.
- R. Weber, B. Winter, P. Schmidt, W. Widdra, I. Hertel, M. Dittmar and M. Faubel, J. Phys. Chem. B, 2004, 108, 4729–4736 CrossRef CAS.
- M. Cheng, K. Callahan, A. Margarella, D. Tobias, J. Hemminger, H. Bluhm and M. Krisch, J. Phys. Chem. C, 2012, 116, 4545–4555 CAS.
- M. Brown, Z. Abbas, A. Kleibert, R. Green, A. Goel, S. May and T. Squires, Phys. Rev. X, 2016, 6, 011007 Search PubMed.
- M. Brown, A. Goel and Z. Abbas, Angew. Chem., Int. Ed., 2016, 55, 3790–3794 CrossRef CAS PubMed.
- E. Raymond and G. Richmond, J. Phys. Chem. B, 2004, 108, 5051–5059 CrossRef CAS.
- S. Gopalakrishnan, D. Liu, H. Allen, M. Kuo and M. Shultz, Chem. Rev., 2006, 106, 1155–1175 CrossRef CAS PubMed.
- E. Sloutskin, J. Baumert, B. Ocko, I. Kuzmenko, A. Checco, L. Tamam, T. Ofer, E. Gog, O. Gang and M. Deutsch, J. Chem. Phys., 2007, 126, 054704 CrossRef CAS PubMed.
- J. Duval, S. Bera, L. Michot, J. Daillant, L. Belloni, O. Konovalov and D. Pontoni, Phys. Rev. Lett., 2012, 108, 206102 CrossRef PubMed.
- M. Dishon, O. Zohar and U. Sivan, Langmuir, 2009, 25, 2831–2836 CrossRef CAS PubMed.
- I. Siretanu, D. Ebeling, M. Andersson, S. Stipp, A. Philipse, M. Cohen Stuart, D. van den Ende and F. Mugele, Sci. Rep., 2014, 4, 4956 CAS.
- C. Zhao, D. Ebeling, I. Siretanu, D. van der Ende and F. Mugele, Nanoscale, 2015, 7, 16298–16311 RSC.
- J. Zegenhagen, Surf. Sci. Rep., 1993, 18, 202–271 CrossRef.
- E. Schneck and B. Demé, Curr. Opin. Colloid Interface Sci., 2015, 20, 244–252 CrossRef CAS.
- M. Bedzyk, G. Bommarito, M. Caffrey and T. Penner, Science, 1990, 248, 52–56 CAS.
- C. Park, P. Fenter, K. Nagy and N. Sturchio, Phys. Rev. Lett., 2006, 97, 016101 CrossRef PubMed.
- The X-Ray Standing Wave Technique: Principles and Applications, ed. J. Zegenhagen, World Scientific Publishing, 2013 Search PubMed.
- M. J. Bedzyk, D. Bilderback, J. White, H. D. Abruna and M. G. Bommarito, J. Phys. Chem., 1986, 90, 4926–4928 CrossRef CAS.
- A. Gibaud and G. Vignaud, X-ray and neutron reflectivity: principles and applications, Berlin Heidelberg, 2009, pp. 87–139 Search PubMed.
- M. Bedzyk, X-ray Standing Wave Techniques, Encyclopedia of Condensed Matter Physics, Oxford, 2005, pp. 330–341 Search PubMed.
- W. Kern, J. Electrochem. Soc., 1990, 137, 1887–1892 CrossRef CAS.
- M. van Gysel, P. Lemberge and P. van Espen, X-Ray Spectrom., 2003, 32, 434–441 CrossRef CAS.
- G. Trefalt, S. Behrens and M. Borkovec, Langmuir, 2015, 32, 380–400 CrossRef PubMed.
- T. Hiemstra, J. de Wit and W. van Riemsdijk, J. Colloid Interface Sci., 1989, 133, 105–117 CrossRef CAS.
- J. Davis, R. James and J. Leckie, J. Colloid Interface Sci., 1978, 63, 480–499 CrossRef CAS.
- J. Sonnefeld, Colloid Polym. Sci., 1995, 273, 932–938 CAS.
- Z. Tao and H. Zhang, J. Colloid Interface Sci., 2002, 252, 15–20 CrossRef CAS PubMed.
- N. Schwierz, D. Horinek and R. Netz, Langmuir, 2013, 29, 2602–2614 CrossRef CAS PubMed.
- N. Schwierz, D. Horinek and R. Netz, Langmuir, 2015, 31, 215–225 CrossRef CAS.
Footnote |
| † Electronic supplementary information (ESI) available. See DOI: 10.1039/c6cp06888j |
| This journal is © the Owner Societies 2017 |

