Bayesian progress curve analysis of MicroScale thermophoresis data
Abstract
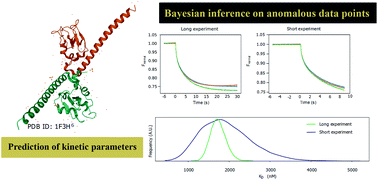
MicroScale Thermophoresis (MST) follows the movement of fluorescent-labelled biomolecules with different sizes along a temperature gradient. The presence of a “contrary trend” pattern, that is, the trend of fluorescence change reversing at higher titrant concentrations, is a well-known problem with uncertain cause. Conventionally, binding curves and kinetic parameters are derived from MST datasets using regression analysis on isolated time windows, while the rest of the data are ignored, and the “contrary trend” fluorescent levels are also usually removed as outliers. This biased approach can be avoided with a more continuous analysis of the entire kinetic process. The Bayesian model of MST progress curves allows the inference of parameters and modelling of the whole experiment. The removal of unusual data points is unnecessary once the anomalous kinetic process is identified. This alternative data analysis approach was applied to our MST datasets from survivin–hSgol2 interactions, and the results show that the binding curves remained sigmoid when all data were included. We were also able to infer the value and uncertainty of the dissociation constant (KD) by ascribing the anomalous data points to a new, linear kinetic component. This approach demonstrates good posterior predictions from the MST process in both short and longer experiments as well as the feasibility of KD inference from short experiments.


 Please wait while we load your content...