Incorporation of Al3+ into turbostratic graphite: an efficient route toward improved thermal and electrical conductivity
Received
17th August 2025
, Accepted 26th October 2025
First published on 27th October 2025
Abstract
Creation of carbide crystals in turbostratic graphite sheets (TGS) promotes thermal conductivity and diffusivity by 56–59%, along with a 53–73% decrease in electrical resistivity. The improved conductivity is due to the lengthened mean free path of phonons by 36%.
1. Introduction
Heat dissipation rate (Hr) represents the true performance of materials that can rapidly transport thermal energy over long distances and is equivalent to the mean free path of phonons (l).1 Metals and alloys have a specific heat (c) lower than 1 J g−1 °C−1, and large l so Hr is often expressed by thermal conductivity (k):where v is phonon velocity (= sound velocity) and k and Hr have comparable values, hereafter defined as the k-rule. Attributable to rapid growth in semiconductor technology, the Hr has become the primary challenge in micro-electronics, and the solution currently relies on metal-based heatsinks, such as manifold microchannels.2 Over the past decade, the heatsink technique has gradually exposed its weaknesses, including heavy structural load, high cost and limited usage space.2 Accordingly, alternative routes toward thermal management of printed circuit boards (PCBs) have been developed, including material selection, layer stack design, via-in-pad and microvia technology, thermal interface materials (TIMs) and thermoelectric coolers.3 Among others, TIMs such as thermal gel/grease (e.g. oil/Si/ZnO composites) or phase change materials (e.g. acrylic resin/Al2O3/carbon nanotubes or Cu nanowires/3D graphene systems) have drawn much attention because of their low cost, mini size and equivalent heatsink effect.3 The k-rule, however, becomes inapplicable to evaluate the Hr of TIMs/composite materials; first, the c of TIMs is no longer as small as metals/alloys, for example, Al2O3 is three-fold greater than Al and fiber-polymer composites can reach 2–3 J g−1 °C−1; second, the l due to heterogeneous phases is small, and hence Hr is low.4 In other words, the high k observed in TIMs/composites is mainly contributed by c (i.e. k ∼ c).4 Thermal diffusivity (α) is indeed an appropriate parameter to characterize the Hr of TIMs/composite materials because it includes material density (d) and excludes c [eqn (2)], so α, l and Hr exhibit minimal variation for a given d (defined as the α-rule).| |  | (2) |
Graphite has been considered as a possible TIM for PCB mainly due to the following; (i) a greater c than metals/alloys; (ii) onset of oxidation at 500 °C;5 (iii) processing with ease; (iv) low d and lightweight. (i) means that a large amount of heat energy can be accommodated so a high Hr may be obtained through l lengthening. (ii) is superior to Al and Cu. Graphite, however, is a layered structure with anisotropic σ and k (i.e. σ‖ and k‖ exceed σ⊥ and k⊥, where σ and subscripts ‖ and ⊥ denote electrical conductivity along and normal to the basal planes),6 which limits its applications in many aspects, such as chip manufacture, automobile and aerospace technology. Intercalation of cations in graphite, however, does not promote k⊥ and lattice substitutions, on the other hand, may enhance the Umklapp mechanism.7Fig. 1a shows, based on reports, the structures of turbostratic graphite (TG) where finite size graphitic domains are randomly embedded in amorphous carbons (ACs), thus limiting their contribution to σ and k.8 Graphitization of the amorphous matrix through heat treatment (HT), however, only enhances both σ‖ and k‖.9
 |
| | Fig. 1 Structures of TG based on reports (a), DES-treated TG (b) and the four-terminal technique for σ measurements (c). | |
Various methods have been developed to improve the conductive properties of carbon materials, including chemical modification by acidic and aerial oxidation, and mechanochemical treatments such as ball-milling in erythritol.10 Physical approaches, on the other hand, mostly focus on conductive networking through elongated nano-fillers, for example, alumina, carbon nanotubes, graphene and metallic filaments.11–15 Since ACs mainly consist of non-graphitizable carbons and act as conductive barriers (blue square, Fig. 1a),16 this work has developed a facile technique to promote k, α and l of TG and the processes involve (i) incorporation of Al3+ into TG and (ii) conversion of ACs into high k aluminum carbide crystals (Al4C3, k > 700 W m−1 K−1). Measurements confirm the formation of carbide crystals and the k and α are simultaneously improved by 56–59%, along with a 36.6% increase in l.
2. Experimental
2.1. Sample production
A wet chemistry technique is employed to incorporate Al3+ into the TG sheets (TGS) (d = 1.16 g cm−3, thickness = 2 mm, diameter = 50 mm, Pentad Scientific Corp, Taiwan). First, TGS are immersed in deep eutectic solvents (DESs) consisting of 12.07 g aluminum chloride, 6.98 g choline chloride [AlCl3 + ChCl, Ch = (CH3)3NCH2CH2OH)] and 100 ml deionized water at room temperature for 6 h. Second, the DES treated TGS are removed and are placed in an oven (40 °C) for 6 h drying. Third, the dried TGS are loaded into a N2 filled furnace for 1–6 h HT at 400 and 800 °C, respectively (heating rate = 10 °C min−1). It is worth mentioning that Al3+ diffusion in TGS requires a long period of time at elevated temperature, and the DESs are therefore used to accelerate ionic migration.17 Comparison is made of AlCl3 aqueous solution (ionic solution, IL) with similar soaking procedures and drying/HT conditions. The resultant samples are hereafter defined as TGSDES and TGSIL where subscripts denote DES and IL-treated (Fig. 1b).
2.2. Structural and material characterization
TGSDES and TGSIL are inspected by scanning electron microscope (SEM, Hitachi-SU8010, accelerating voltage = 15 kV), which provides information regarding the surface texture, size and distribution of the particles. Chemical composition and bonding characters are analyzed using SEM-EDS, Raman Spectroscopy (LABRAM HR 800 UV) and X-ray photoelectron emission spectroscopy (XPS, ULVAC-PHI PHI Quantera II), the XPS peak intensity (Cx) being calculated according to the full width at half maximum (FWHM) and elemental ratio of the C1s and O1s spectra expressed as| |  | (3) |
where Xx is the corrected relative sensitivity factor and Ix is the signal intensity.18 X-ray diffraction (XRD-6000) is employed to determine the crystal structures of the particles based on peak intensity and position. The electrical properties of TGSDES and TGSIL are measured by the four-terminal method (i.e. van der Pauw technique, keithley 2450), which excludes contact resistance (R) and determines sample R according to the equation below| | 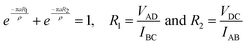 | (4) |
where ρ is electrical resistivity, and a is specimen thickness (2 mm, Fig. 1c).19 It is worth mentioning the difference between R and ρ; the former is an extensive property changing with system parameters such as mass, volume and size. The latter, on the other hand, comes from the intrinsic property of the samples and is structure and bonding-type related. Accordingly, the DES and IL treatment-induced structural changes can be verified by ρ measurements. Carrier concentration is probed by the Hall-effect measurement system using Ecopia, HMS 5000. The k and α are measured by the laser flash technique (NETZSCH, LFA 447) based on classic equations| | 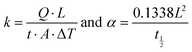 | (5) |
where Q, ΔT, A, L and t½ are the heat energy, temperature difference created by laser irradiation for a given time (t), cross-sectional area and thickness of the sample, and time required for heating the sample at half of the highest temperature.
3. Results and discussion
Fig. 2a shows the k–t plots of TGSIL and TGSDES recorded at 400 °C where t denotes HT time (1–6 h). First, the k increases with t and is greatly improved in both samples by 28% for TGSIL and 55% for TGSDES at t = 6 h. Second, the k-TGSDES is greater than k-TGSIL throughout. Third, the k-TGSDES > k-TGSIL also takes place at HT = 800 °C (Fig. 2b) with k improvement by 31% for TGSIL and 60% for TGSDES. Note that pristine TGS with different k (i.e. k = 73 and 80.5 at t = 0 h, Fig. 2a and b) is because experiments were carried out on different samples so k may slightly vary from TGS to TGS. Fig. 2a and b verifies a large k improvement and the underlying mechanism possibly involves formation of Al4C3 crystals in ACs; (i) Al4C3 forms at 300–400 °C and has a high k thus promoting heat transport in the AC regions;20 (ii) the DSC profile recorded from the TGSDES sample shows an endothermic peak at 300–320 °C, corresponding to decomposition of ChCl and carbide formation (Fig. S1, SI); (iii) the k improvement due to graphitization of ACs is unlikely because HT here is far below 2000 °C;9 (iv) SEM inspections do not detect a change in surface texture and particle morphology before and after HT = 800 °C (Fig. 3a and b), supporting (iii); (v) XRD shows reflections arising from various crystal lattices including (002), (004) and (100) of graphite, (021), (110), (006) and (113) of Al4C3 and (311) of α-Al (Fig. 3c). Additional evidence in support of Al4C3 crystal formation comes from XPS spectra recorded from TGSIL and TGSDES at HT = 800 °C where the Al-C peak at 73.1 eV is consistent with chemical shifts for Al-2p (1.2 ± 0.1 eV) and C-1s (−2.1 ± 0.1 eV) (Fig. 4a and b).21Table 1 lists the relative concentrations of C and Al in TGSIL and TGSDES based on SEM-EDS and data are recorded after HT (800 °C, 6 h); note that pristine TGSs do not contain Al and are therefore not shown. First, the Al-TGSDES > Al-TGSIL indicates a greater content of carbide in TGSDES, verifying the DES promoted Al3+ diffusion in TGS. Second, reactions of Al and C consume free carbon content (274 → 170 wt%). Third, Fig. 5 shows the Raman spectra of TGSDES (top) and untreated TGS (lower); the former clearly shows characteristic peaks of Al4C3 at 492 and 862 cm−1.22
 |
| | Fig. 2 The k–t plots of TGSIL and TGSDES at HT = 400 (a) and 800 °C (b). | |
 |
| | Fig. 3 SEM images of TGSDES before (a) and after HT at 800 °C for 6 h (b) and corresponding XRD profiles (c). | |
 |
| | Fig. 4 XPS spectra of TGSIL (a) and TGSDES (b) after 6 h HT at 800 °C. | |
Table 1 The relative content of C and Al in TGSIL and TGSDES after 6 h HT at 800 °C
| Elements/Samples |
w.t% |
a.t% |
| C |
TGSIL |
274.05 |
88.36 |
| TGSDES |
170.81 |
67.69 |
| Al |
TGSIL |
22.64 |
7.29 |
| TGSDES |
53.00 |
21.00 |
 |
| | Fig. 5 Raman spectra of TGSDES (top) and untreated TGS (lower). | |
As described above, the application of k- and α-rules is dependent on the magnitude of l; the former fits monolithic materials that yield x-ray diffraction and form solid solution phase.23 The latter is better used for those made of heterogeneous species and compounds, such as composite materials, ceramics and TIMs. Simultaneous improvements on k and α have not been reported on carbon materials thus far, for example, pyrolytic graphite displays a high k at low temperature where l due to the low density of phonons and scattering is large (i.e. l-governed k). At elevated temperature, the l reduces significantly, and the high k remains as a result of the c increase (i.e. c-controlled k).24 In other words, the k- and α-rules can barely operate simultaneously at room and elevated temperatures. Table 2 lists the c, l, ρ, carrier concentration and mobility of pristine TGS, TGSIL and TGSDES after 6 h HT at 400 and 800 °C respectively. First, creation of carbide crystals in TGS promotes c by 4% for both TGSIL and TGSDES at HT = 400 °C and by 13 and 7% for TGSIL and TGSDES at HT = 800 °C, indicative of increased carbide content at higher temperature. Since c depends on phonon density of states and reaches the maximum at the Debye temperature, the increased c here must come from the carbide phase that produces additional vibration modes of phonons thus promoting c.25,26 Second, the l gives a similar trend, and improvement reaches 20% (i.e. 8.77 → 10.57 nm) for TGSIL and 36% (i.e. 8.77 → 11.98 nm) for TGSDES, i.e. carbide formation lengthens l and, k and α are simultaneously improved (Fig. 2 and 6). The ρ, on the other hand, decreases with carbide formation (53% for TGSIL and 73% for TGSDES) and the underlying mechanism possibly involves increased carrier mobility; first, carrier concentration does not increase but decreases by one order of magnitude; second, crystal formation promotes carrier mobility.27–31 It is worth mentioning that asymmetric phonons of both carbide and graphite lie on different frequencies and therefore phonon scattering at interfaces may occur.12–15,20
Table 2 List of c, l, ρ, carrier concentration and mobility of pristine TGS, TGSIL and TGSDES after 6 h HT at 400 and 800 °C
|
H
T (6 h) |
c (J g−1 K−1) |
l (nm) |
ρ (Ω cm) |
Carrier concentration (cm−3) |
Mobility (cm2 V−1 s−1) |
| TGS |
0.68 |
8.77 |
1.52 |
6.928 × 10¹⁸ |
3.96 |
| TGSIL (400 °C) |
0.71 |
9.93 |
1.15 |
1.099 × 10¹⁹ |
3.29 |
| TGSIL (800 °C) |
0.77 |
10.57 |
0.71 |
1.612 × 10¹⁹ |
3.64 |
| TGSDES (400 °C) |
0.71 |
10.95 |
1.08 |
1.819 × 10¹⁹ |
2.12 |
| TGSDES (800 °C) |
0.73 |
11.98 |
0.41 |
1.309 × 10¹⁹ |
7.76 |
 |
| | Fig. 6 The α-t plots of TGSIL and TGSDES at HT = 400 (a) and 800 °C (b). | |
Finally, it is worth mentioning that Al4C3 is often created in harsh conditions involving high temperature/pressure in the absence of oxygen.32 The wet chemistry technique here provides a simple and controllable route toward improved k and α for TIMs. In this study, the modified TGS, which show low density, high mechanical strength, high Hr, low CTE, chemical inertness, and thermal stability, may be considered as promising candidates for TIMs.
4. Conclusion
A facile technique is demonstrated to promote k and α of TGS. Processes involve the immersion of TGS in DES and IL respectively, followed by HT at 400–800 °C for 1–6 h. Measurements reveal that k and α of TGS are improved by 56–59%, along with a 53–73% decrease in ρ. Formation of Al4C3 crystals in conjunction with graphitic domains improves σ and lengthens l by 36%, accounting for simultaneous improvements on k and α.
Conflicts of interest
There are no conflicts to declare.
Data availability
The data supporting this article have been included as part of the supplementary information (SI). Supplementary information is available. See DOI: https://doi.org/10.1039/d5tc03109e.
Acknowledgements
This work is supported by the National Science & Technology Council, Taiwan (NSTC-113-2221-E-007-050). The authors also thank the Instrumentation Centre at NTHU (Hsinchu, Taiwan) for the use of F200 HRTEM and ARM200 Cs TEM. The financial support provided by the Energy Administration, Ministry of Economic Affairs, Taiwan (Grant No. 114-S0102) is gratefully acknowledged.
References
- K. T. Regner, D. P. Sellan, Z. Su, C. H. Amon, A. J. H. McGaughey and J. A. Malen, Nat. Commun., 2013, 4, 1640 CrossRef PubMed.
- N. Gilmore, V. Timchenko and C. Menictas, Int. J. Heat Mass Transfer, 2021, 170, 121025 CrossRef.
- Y. Cui, M. Li and Y. Hu, J. Mater. Chem. C, 2020, 8, 10568–10586 RSC.
- P. E. Hopkins, J. C. Duda and P. M. Norris, J. Heat Transfer, 2011, 133, 035438 Search PubMed.
- V. J. Murray, E. J. Smoll and T. K. Minton, J. Phys. Chem. C, 2018, 122, 6602–6617 CrossRef CAS.
- F. Rozpłoch, J. M. Skowroński, L. Nowak, J. Patyk and J. Szatkowski, J. Phys. Chem. Solids, 2004, 65, 195–197 CrossRef.
- X. Qian, X. Gu, M. S. Dresselhaus and R. Yang, J. Phys. Chem. Lett., 2016, 7, 4744–4750 CrossRef CAS PubMed.
- Z. Q. Li, C. J. Lu, Z. P. Xia, Y. Zhou and Z. Luo, Carbon, 2007, 45, 1686–1695 CrossRef CAS.
-
H. Marsh and J. Griffiths, New processes and new applications. Ext. Abst. of International Symposium on Carbon, Toyohashi, Japan, 1982, vol. 81 Search PubMed.
- S. Shen, S. Tan, S. Wu, C. Guo, J. Liang, Q. Yang, G. Xu and J. Deng, Energy Convers. Manage., 2018, 157, 41–48 CrossRef CAS.
- Y. Chen, X. Hou, M. Liao, W. Dai, Z. Wang, C. Yan, H. Li, C.-T. Lin, N. Jiang and J. Yu, Chem. Eng. J., 2020, 381, 122690 CrossRef CAS.
- T. Liu, X. He, Q. Liu, L. Zhang, L. Wang, Q. Kang and X. Qu, J. Mater. Eng. Perform., 2013, 22, 1649–1654 CrossRef CAS.
- Z. Jiang, T. Ouyang, Y. Yang, L. Chen, X. Fan, Y. Chen, W. Li and Y. Fei, Mater. Des., 2018, 143, 177–184 CrossRef CAS.
- F. Xu, Y. Cui, D. Bao, D. Lin, S. Yuan, X. Wang, H. Wang and Y. Sun, Chem. Eng. J., 2020, 388, 124287 CrossRef CAS.
- X. Zhang, Y. Xu, M. Wang, E. Liu, N. Zhao, C. Shi, D. Lin, F. Zhu and C. He, Nat. Commun., 2020, 11, 2775 CrossRef CAS PubMed.
- P. Ouzilleau, A. E. Gheribi, P. Chartrand, G. Soucy and M. Monthioux, Carbon, 2019, 149, 419–435 CrossRef CAS.
- E. L. Smith, A. P. Abbott and K. S. Ryder, Chem. Rev., 2014, 114, 11060–11082 CrossRef CAS.
-
P. Atkins, J. de Paula and J. Keeler, Atkins’ physical chemistry, 2022 Search PubMed.
- D. W. Koon and C. J. Knickerbocker, Rev. Sci. Instrum., 1992, 63, 207–210 CrossRef.
- M. Lee, Y. Choi, K. Sugio, K. Matsugi and G. Sasaki, Compos. Sci. Technol., 2014, 97, 1–5 CrossRef CAS.
- C. Hinnen, D. Imbert, J. M. Siffre and P. Marcus, Appl. Surf. Sci., 1994, 78, 219–231 CrossRef CAS.
- A. Serovaiskii and V. Kutcherov, Sci. Rep., 2020, 10, 4559 CrossRef CAS PubMed.
- N. K. Ravichandran and D. Broido, Phys. Rev. X, 2020, 10, 021063 CAS.
- Y. Xie and X. Wang, Green Carbon, 2023, 1, 47–57 CrossRef CAS.
- W. Yi, L. Lu, Z. Dian-lin, Z. W. Pan and S. S. Xie, Phys. Rev. B: Condens. Matter Mater. Phys., 1999, 59, R9015(R) CrossRef.
- J. Hone, B. Batlogg, Z. Benes, A. T. Johnson and J. E. Fischer, Science, 2000, 289, 1730–1733 CrossRef CAS.
- T. Hertel and G. Moos, Phys. Rev. Lett., 2000, 84, 5002–5005 CrossRef CAS.
- M. Liu, H. Wu, Y. Wu, P. Xie, R. A. Pashameah, H. M. Abo-Dief, S. M. El-Bahy, Y. Wei, G. Li, W. Li, G. Liang, C. Liu, K. Sun and R. Fan, Adv. Compos. Hybrid Mater., 2022, 5, 2021–2030 CrossRef CAS.
- K. Sun, L. Wang, Z. Wang, X. Wu, G. Fan, Z. Wang, C. Cheng, R. Fan, M. Dong and Z. Guo, Phys. Chem. Chem. Phys., 2020, 22, 5114–5122 RSC.
- K. Sun, C. Wang, J. Tian, Z. Zhang, N. Zeng, R. Yin, W. Duan, Q. Hou, Y. Zhao, H. Wu and R. Fan, Adv. Funct. Mater., 2024, 34, 2306747 CrossRef CAS.
- P. Xie, Y. Liu, M. Feng, M. Niu, C. Liu, N. Wu, K. Sui, R. Patil, D. Pan, Z. Guo and R. Fan, Adv. Compos. Hybrid Mater., 2021, 4, 173–185 CrossRef CAS.
- N. Li, J. Hao, Y. Zhang, W. Wang, J. Zhao, H. Wu, X. Wang and H. Zhang, Adv. Compos. Hybrid Mater., 2022, 15, 6640 CAS.
|
| This journal is © The Royal Society of Chemistry 2026 |
Click here to see how this site uses Cookies. View our privacy policy here. 
 *a
*a


