DOI:
10.1039/D6RA01346E
(Paper)
RSC Adv., 2026,
16, 14660-14675
Tailoring high-field energy storage and dual-mode electrocaloric response in relaxor ferroelectric thin film
Received
15th February 2026
, Accepted 9th March 2026
First published on 17th March 2026
Abstract
Ferroelectric and antiferroelectric thin and thick films with strong electrocaloric (EC) responses are attractive for solid-state cooling. In this study, 0.75PbMg1/3Nb2/3O3–0.25PbTiO3 (PMN-25PT) relaxor ferroelectric thin films deposited on LSAT substrates by pulsed laser deposition exhibit a giant negative EC effect near 150 °C, with a maximum temperature change of −38.3 K and an entropy change of −29.4 J kg−1 K−1. A large positive EC effect is also observed near 120 °C, yielding ΔT = 33.4 K and ΔS = 27.5 J kg−1 K−1, comparable to the best reported values. The films show nanoscale columnar grains that promote polar nanoregions, leading to high polarization, large dielectric breakdown strength, and a diffuse, frequency-dependent dielectric response. Polarization–electric field loops measured from 30 °C to 190 °C reveal the excellent thermal stability of energy storage, which remains robust after 108 charge–discharge cycles. Moreover, the films demonstrate efficient harvesting of low-grade waste heat, achieving an energy conversion density of ∼18.7 J cm−3 per cycle over 0–2.5 MV cm−1 and a wide temperature range of 30–140 °C, as evaluated using pyroelectric Olsen cycles. These results highlight PMN-25PT thin films as promising candidates for advanced energy storage and electrocaloric cooling applications.
1. Introduction
In recent years, materials that exhibit caloric effects, including magnetocaloric, electrocaloric, elastocaloric, and piezocaloric responses, have become a significant focus of research owing to their promising roles in emerging technological applications.1–5 High-efficiency operation is essential for technologies aimed at removing heat or recovering waste energy in various medical systems, such as memory devices,6 and integrated circuits.7 However, traditional vapor-cycle cooling systems fall short of these requirements because they rely on large, heavy components, such as compressors. This limitation has driven the search for innovative energy-conversion mechanisms that can meet the needs of modern miniaturized electronic platforms. Among the various options, mechanisms based on pyroelectric and electrocaloric effects (ECE) have emerged as promising alternatives for such applications.
The electrocaloric effect (ECE) represents one of the most significant thermodynamic phenomena utilized in solid-state cooling applications.8,9 Extensive research has focused on electrocaloric materials, particularly relaxor ferroelectrics,10,11 inorganic ferroelectrics,12,13 and various organic polymer films. In ferroelectric materials, the electrocaloric effect manifests as a temperature shift (ΔT) resulting from a change in entropy (ΔS) when an electric field is either applied or removed under adiabatic conditions. The largest ΔT values are commonly observed near the first-order phase transition, which typically occurs around the Curie temperature (TC), generally a value much higher than room temperature. For PbZr0.95Ti0.05O3 thin films, Mischenko et al. recorded an entropy change of 8 J K−1 kg−1 and a temperature rise of 12 K at 222 °C, attributed to the ferroelectric-to-paraelectric (FE/PE) phase transition.8 A temperature change of 20.1 K was measured in Pb0.97La0.02(Zr0.65Sn0.3Ti0.05)O3 thin films at the point where the material shifts from an antiferroelectric to a paraelectric phase.14
With continued progress in electrocaloric research, researchers have discovered that, in addition to the well-known positive electrocaloric effect (PECE), some relaxor antiferroelectric and ferroelectrics also exhibit a surprising negative electrocaloric effect (NECE). This phenomenon not only expands the range of electrocaloric response but also offers the possibility of achieving higher cooling efficiency when NECE is strategically combined with PECE in advanced ferroelectric cooling technologies.15 In the case of NBT-BT ceramics, the observed NECE was associated with the switching between the tetragonal ferroelectric (FE) phase and the tetragonal antiferroelectric (AFE) phase.16,17 Geng and co-workers reported that the NECE in PLZT-based systems arises from the electric-field-driven deviation of polarization from a collinear state. When a moderate electric field is applied to FEs to AFEs, it tends to disturb the dipole alignment, increasing the entropy and consequently producing a NECE response.18,19 This behavior is consistent with the theoretical predictions made by I. Ponomareva and S. Lisenkov.20 By employing thermodynamic evaluations together with phase-field modelling, H. H. Wu and co-workers revealed that mechanical compression provides a versatile strategy for generating NECE in perovskite ferroelectric materials.21,22 Moreover, our group found that PbZr0.53Ti0.47O3/CoFe2O4 multilayer nanostructures exhibit a negative electrocaloric effect driven by magnetoelectric coupling.23 Chi et al. further demonstrated that the multilayer thin films exhibit pronounced pyroelectric activity, representing the reverse phenomenon of the electrocaloric effect.24,25 Significant strides have been made in enhancing the positive EC effect, as demonstrated by the ∼45.3 K temperature change in a Pb0.8Ba0.2ZrO3 thin film (about 320 nm) with AFE/FE coexistence and the even larger ∼53.8 K response reported for a 2 µm thick Pb0.97La0.02(Zr0.75Sn0.18Ti0.07)O3 antiferroelectric film.26,27 On the other hand, the development of materials exhibiting a negative EC response has been comparatively slow. Typical examples include ΔT ≈ −5.76 K for Pb0.97La0.02(Zr0.95Ti0.05)O3 in a 650 nm AFE film,28 ΔT ≈ −6.62 K in a 550 nm Pb0.96Eu0.04ZrO3 AFE film, and ΔT ≈ −10.8 K for a 9.2 nm Hf0.5Zr0.5O2 ferroelectric layer.29,30
In this study, we report on strategies designed to enhance the performance of relaxor-ferroelectric thin-film heterostructures for the efficient conversion of low-grade waste heat. The 0.75Pb(Mg0.33Nb0.66)O3–0.25PbTiO3 thin film, near MPB, was synthesized by the Pulsed Laser Deposition technique on (001)LSAT substrate, incorporating LSCO buffer layer, which also acts as a bottom electrode for electrical measurements. The device enabled the investigation of thermal energy harvesting in the heterostructure under periodic temperature fluctuations, while simultaneously correlating the electrocaloric response of the system with its heat-to-electric energy conversion behavior.
2. Method
PMN-25PT epitaxial thin films with LSCO bottom electrodes were prepared on polished (100) LSAT substrate by the PLD method, which utilized a 248 nm KrF laser, as shown in Fig. 1. The laser beams fell on the sintered target at an elevation of 45°, and the substrate was positioned in a parallel configuration with respect to the target at the substrate holder. The LSCO and PMN-25PT targets used in this study were synthesized by solid-state reaction of the respective oxides. The PMN-25PT target was prepared by the columbite precursor route. The constituting oxides were mixed in a stoichiometric ratio with 10% excess lead oxide to compensate for the losses due to heating. The powder obtained by a two-step calcination process was mixed with a PVA binder to form a 1-inch-diameter target, which was then sintered at 1200 °C for 2 hours. The polycrystalline target's density was above 96%. The growth parameters of PMN-25PT/LSCO/LSAT heterostructure are listed in Table 1. The substrate was kept at 600 °C during the growth of PMN-25PT and LSCO at partial oxygen pressures of 150 mTorr and 75 mTorr, respectively. The deposited films were annealed for 30 minutes at 600 °C in a chamber containing pure oxygen, maintained at 300 torr, followed by natural cooling to 25 °C. The film's thickness was measured through a stylus profilometer, and the surface topology was analyzed through atomic force microscopy. The phases and crystal structure were analyzed using GI-XRD. For further electrical measurements, platinum dots with a diameter of 100 µm were deposited as a top electrode via DC sputtering. The dielectric properties, such as dielectric constant and tangent loss, were obtained using a HIOKI-3532 LCR Hitester by varying the frequency from 102 Hz to 106 Hz while varying the temperature from 25 °C to 190 °C. The ferroelectric polarization vs. electric field (P–E) plot and fatigue measurement were performed using the Radiant Precision Multiferroic tester. The temperature-dependent P–E plots for calculating energy density were measured using a lab-made setup comprising a hot plate, a temperature sensor, and a Radiant Precision Multiferroic tester over a temperature range of 25 °C to 190 °C.
 |
| | Fig. 1 Schematic diagram of the film PMN-25PT (PMN-PT)/LSCO/LSAT heterostructure. | |
Table 1 The deposition conditions of PMN-25PT and LSCO thin films on LSAT substrate via PLD
| Parameters |
LSCO |
PMN-25PT |
| Deposition temperature (°C) |
600 |
600 |
| Film thickness (nm) |
40 |
200 |
| Deposition pressure (mTorr) |
75 |
150 |
| Laser energy density (mJ cm−2) |
3 |
3 |
| Target substrate distance (cm) |
4.5 |
4.5 |
3. Results and discussion
Fig. 2a illustrates the GI-XRD patterns of the epitaxial PMN-25PT/LSCO/LSAT thin film. Diffraction data indicate that the PMN-25PT layer is highly aligned with both the LSCO film and the LSAT substrate. There is no signature of misoriented peaks and pyrochlore phase diffraction patterns over a wide range of Bragg angles. Fig. 2b and c show the highlighted (100) and (200) peaks, indicating that the fabricated film is epitaxial and belongs to the perovskite phase of PMN-25PT.
 |
| | Fig. 2 (a) GI-XRD pattern of PMN-25PT/LSCO/LSAT heterostructure, (b) and (c) show (100) and (200) oriented peaks, respectively. | |
Although bulk PMN-25PT ceramics crystallize in a rhombohedral or pseudo-monoclinic structure near the morphotropic phase boundary, the corresponding thin films often exhibit a tetragonal-like symmetry as a consequence of epitaxial strain and substrate clamping. In the present film, the clear splitting of the (200) and (002) reflections in the XRD pattern signifies anisotropic lattice distortion with unequal out-of-plane and in-plane lattice parameters (c ≠ a), which is characteristic of a strain-stabilized tetragonal phase. Such peak splitting is not evident in bulk ceramics due to random grain orientation, domain averaging, and strain relaxation. Strain in thin films from X-ray diffraction (XRD) is usually calculated from the shift or broadening of diffraction peaks compared to a strain-free (bulk) reference using the equation:
where,
dflim = interplanar spacing of film,
dbulk = interplanar spacing of bulk.
Quantitative strain analysis using the (200) peak indicates a tensile out-of-plane strain of about +0.9%, highlighting the sensitivity of different reflections to lattice distortion and strain gradients within the film. The in-plane lattice parameter extracted from the (200) reflection further supports the presence of anisotropic strain imposed by the substrate. These results confirm that the observed tetragonal distortion in the PMN-25PT thin film is not intrinsic to the bulk composition but is induced by epitaxial constraint, leading to modified structural symmetry and strain-driven lattice anisotropy. It is a well-known fact that PMN with 25% PT bulk ceramics shows rhombohedral crystal structure;31 however, the same composition grown as thin films, displayed tetragonal-like structure as observed previously by Urska Trstenjak et al.32 It has also been discovered that PMN-PT near the MPB illustrates relaxor-like properties under small compressive stress (∼−0.5%), which causes the system to become normal ferroelectric after artificially generated large strain (∼−1.5%).33 It suggests that PMN-25PT thin films located near or below the MPB exhibit significantly different physical and chemical properties compared to bulk ceramics, with or without in-built strain. The investigated PMN-25PT thin films also developed a small compressive strain of nearly (−0.02%) compared to the bulk pseudo-cubic/rhombohedral lattice constants.31 Fig. 3 presents the surface morphology and grain size distribution of the film as characterized by atomic force microscopy (AFM). Fig. 3a shows the three-dimensional AFM topography over a scan area of 2 × 2 µm2, which indicates the growth of the nanosized columnar island, which may lead to the formation of short-range nanodomains, revealing a dense and uniformly covered surface composed of closely packed nanoscale grains with no visible cracks or pinholes, with an average RMS roughness of ∼3 nm for 200 nm thin films. The corresponding two-dimensional height image in Fig. 3b further confirms a homogeneous microstructure with well-distributed grains and relatively smooth height variations, suggesting controlled nucleation and growth during film deposition. Fig. 3c displays the statistical grain size distribution extracted from the AFM data, fitted with a Gaussian function.
 |
| | Fig. 3 (a) 3D and (b) 2D AFM images of the PMN-25PT/LSCO/LSAT heterostructure, (c) histograms of the distribution of grain sizes. | |
The distribution is narrow and symmetric, yielding an average grain size of approximately 31 nm, indicating uniform grain growth across the surface. Such nanoscale grain uniformity is beneficial for achieving stable and reproducible electrical and functional properties in ferroelectric thin films. Grain size and distribution extracted from AFM strongly influence dielectric and ferroelectric behavior. Smaller, uniformly distributed grains increase grain boundary density, restricting domain wall motion and leading to reduced remanent polarization (Pr) and coercive field (EC), while improving dielectric stability by suppressing extrinsic contributions. In contrast, larger grains promote easier domain switching, resulting in higher polarization and well-defined P–E hysteresis loops. Surface roughness and topography are equally important, as a smooth and homogeneous surface ensures good electrode-film contact and a uniform electric field distribution, thereby reducing localized field enhancement, leakage current, and distortion of P–E loops. Hence, AFM-derived roughness parameters (RMS roughness, Rq) are critical for reliable dielectric measurements. Additionally, dense grain packing and good film continuity observed in AFM images minimize leakage paths and improve polarization fatigue endurance, leading to stable dielectric and ferroelectric performance. The dielectric properties of the PMN-25PT/LSCO/LSAT thin heterostructure were analysed using an AC signal across a frequency range of 102 Hz to 106 Hz, along with a very small DC bias of 25 mV. The dielectric constant (ε) and tangent loss (tan![[thin space (1/6-em)]](https://www.rsc.org/images/entities/char_2009.gif) δ) with varying frequency and temperature were displayed in Fig. 4a and b, respectively. The in-house temperature measurement setup was developed using a hot plate, a temperature sensor, and a 20 µm probe station under atmospheric conditions, with temperature varied from 25 °C to 200 °C. A wide dispersion in the dielectric maximum temperatures was observed across frequencies ranging from 102 Hz to 106 Hz. The point of maxima of the dielectric constant shifted from 80 °C to 190 °C with an increase in frequency; this large dispersion was also supported by the tangent loss behavior, highlighting the relaxor ferroelectric nature. The Vogel–Fulcher (VF) equation provides the analysis focused on understanding the dynamics of dipole relaxation. The VF law provides a correlation between the temperature at the maximum dielectric constant (Tm) and the Probing frequency signal.34
δ) with varying frequency and temperature were displayed in Fig. 4a and b, respectively. The in-house temperature measurement setup was developed using a hot plate, a temperature sensor, and a 20 µm probe station under atmospheric conditions, with temperature varied from 25 °C to 200 °C. A wide dispersion in the dielectric maximum temperatures was observed across frequencies ranging from 102 Hz to 106 Hz. The point of maxima of the dielectric constant shifted from 80 °C to 190 °C with an increase in frequency; this large dispersion was also supported by the tangent loss behavior, highlighting the relaxor ferroelectric nature. The Vogel–Fulcher (VF) equation provides the analysis focused on understanding the dynamics of dipole relaxation. The VF law provides a correlation between the temperature at the maximum dielectric constant (Tm) and the Probing frequency signal.34
| |
 | (1) |
 |
| | Fig. 4 (a) Dielectric constant, (b) tangent loss and (c) Vogel–Fulture fitting, and the inset shows the degree of diffusiveness (γ) of PMN-25PT/LSCO/LSAT heterostructure, (d) dielectric constant, (e) tangent loss, and (f) polarization vs. electric field loop of bulk PMN-25PT sample. | |
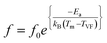
In the equation, f represents the applied probe frequency, f0 denotes the pre-exponential factor, Ea represents the activation energy, kB represents the Boltzmann constant, and TVF refers to the Vogel–Fulcher temperature. The TVF corresponds to the temperature at which the relaxation time diverges and is known as the freezing point of the dipoles. The dielectric data as a function of frequency and temperature fitted well with eqn (1) and was plotted as the natural logarithm of the frequency (lnf) along the y-axis against Tm along the x-axis. The statistically computed goodness of fit is found to be 0.99, as illustrated in Fig. 4c. Through the Vogel–Fulcher fitting process, the parameters obtained are f0, representing the pre-exponential factor, TVF, the freezing temperature, and Ea corresponding to the activation energy, which is determined to be 2.13 GHz, 251.20 K, and 0.154 eV, respectively. For additional investigation of the relaxor behavior, the diffusiveness coefficient γ is determined using the modified Curie–Weiss law:35
| |
 | (2) |
where
ε is the dielectric constant,
εm is the dielectric maxima corresponding to temperature
Tm,
C denotes the Curie constant, and
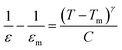
γ signifies the degree of diffusiveness. It is well known that
γ equals unity for pure ferroelectric materials and approaches 2 for relaxor ferroelectric materials. The
γ is calculated through the slope of the plot between (1/
ε − 1/
εm) and (
T −
Tm). From the inset of
Fig. 4c, the value of the diffusiveness coefficient is 1.81, which is clearly towards the relaxor ferroelectric side. In the bulk PMN-25PT polycrystalline sample, the dielectric constant and tangent loss are presented in
Fig. 4d and e, respectively. Unlike the thin-film sample, the dielectric maximum in the bulk sample shows no frequency dispersion and occurs at 132 °C over a frequency range of 10
2 to 10
6 Hz. In the thin film, the dielectric permittivity exhibits a broadened, frequency-dependent maximum, with the peak shifting to higher temperatures as the measurement frequency increases. This strong dispersion indicates relaxor-like behavior, where polarization dynamics are governed by thermally activated dipolar relaxation rather than long-range ferroelectric order. The reduced dielectric magnitude at higher frequencies further suggests the presence of slower polarization mechanisms, such as interfacial (Maxwell–Wagner) polarization and space-charge contributions, which are unable to follow the alternating electric field. In contrast, the bulk sample shows a sharper dielectric peak with comparatively weak frequency dependence and a well-defined transition temperature near ∼132 °C, reflecting more homogeneous polarization switching and long-range ferroelectric correlations. The enhanced dispersion in the thin film can be attributed to substrate-induced strain, increased defect density, and a high density of interfaces and grain boundaries, all of which broaden the phase transition and introduce multiple relaxation processes, leading to a strongly frequency-dispersed dielectric response relative to the bulk material.
36,37 The ferroelectric properties of the bulk sample were examined within a frequency range of 1 Hz to 10 Hz, as shown in
Fig. 4f. The polarization–electric field (P–E) hysteresis loop is well-saturated and square-shaped, demonstrating a high saturation polarization of approximately 42 µC cm
−2 and a high remanent polarization (
Pr) of nearly 35 µC cm
−2. These characteristics suggest that the bulk sample exhibits properties more distinctive of a ferroelectric material than of a relaxor ferroelectric. Due to the relaxor ferroelectric nature of the film, short-range order is present within ferroelectric domains, leading to the formation of polar nanoregions and resulting in high
Ps and low
Pr, making the thin film a prime candidate for energy storage applications.
Fig. 5 illustrates the variation of the real and imaginary components of the electric modulus with frequency across different temperatures. The real (Z′) and imaginary (Z″) components of the complex impedance (Z*) were determined using the following relations: Z′ = Zcosθ and Z″ = Zsinθ. For electrical modulus analysis using eqn (3), the complex impedance is transformed into the corresponding complex electric modulus:38
| | |
M* = iωC0Z* = iωC0(Z′ − iZ″) = M′ + iM″
| (3) |
Here,
M′ =
ωC0Z″ and
M″ =
ωC0Z′,

represents the vacuum capacitance of the measurement cell with an air gap equal to the sample thickness, where
ε0 = 8.854 × 10
−12 F m
−1 is the permittivity of free space,
A is the electrode area,
d is the sample thickness, and
ω denotes the angular frequency.
 |
| | Fig. 5 Frequency dependence of the electric modulus at various temperatures, (a) real part of the electric modulus (M′), and (b) imaginary part of the electric modulus (M′′). | |
As shown in Fig. 5a, the real part (M′) exhibits noticeable dispersion in the mid-frequency region. At both the low- and high-frequency ends, however, the curves corresponding to various temperatures tend to collapse onto a single trajectory, indicating that the material's response in these regions is largely temperature-independent. The mid-frequency dispersion suggests the participation of localized charge carriers whose motion is restricted, causing them to contribute to the relaxation behavior only within a limited frequency band. In Fig. 5b, the imaginary part (M′′) displays clear relaxation peaks. These peaks progressively shift toward higher frequencies as the temperature increases. Such a shift is characteristic of thermally activated relaxation, in which the relaxation time decreases with increasing thermal energy, allowing dipoles or charge carriers to reorient more rapidly. The upward shift of the peak position with increasing temperature therefore confirms that the underlying relaxation mechanism involves thermally assisted hopping or reorientation of charge carriers within the material. Overall, the combined behavior of M′ and M′′ suggests the presence of short-range hopping or localized relaxation processes that are strongly dependent on thermal activation.
The ferroelectric polarization versus electric field hysteresis loops are obtained at 10 kHz at room temperature by driving the top Pt electrode and varying the applied electric field, as depicted in Fig. 6a. The loops obtained are slim and saturated when a high E-field of up to 2.5 MV cm−1 is applied. A large electric field is required to switch the domains in the epitaxial PMN-25PT/LSCO/LSAT heterostructure. The characteristics of the loops correspond to the relaxor ferroelectric behavior. In Fig. 6b, the ratio of saturation polarization and remanent polarization (Ps/Pr), and their difference (Ps − Pr), is plotted with varying electric fields. The difference, Ps − Pr, increases with the increase in the amplitude of the applied electric field, the high difference is desirable for high storage energy density, as indicated by relations (4a and b). As the Ps − Pr corresponds to the non-switchable polarization, a slim hysteresis loop exhibits high non-switchable polarization compared to a squared hysteresis loop, making the relaxor ferroelectric nature preferred for high energy storage applications. The Ps/Pr ratio is calculated and plotted, as it corresponds to the material's efficiency; a high ratio is desirable for achieving high efficiency. When an applied electric field is raised to 2.5 MV cm−1, the saturation polarization increases, but the value of Ps/Pr decreases slightly and is almost constant up to the maximum applied electric field (2.5 MV cm−1). The energy storage-related features were calculated using the polarization versus electric field (P–E) plot. The total energy storage density (Wtotal) in the influence of the applied electric field (E), calculated through the relation,
| |
 | (4a) |
where
Ps is the saturation polarization or maximum polarization. The recoverable energy storage density (
Wrec) is calculated by modifying the above relation
| |
 | (4b) |
where
Pr denotes the remnant polarization. The area enclosed by the
y-axis (representing polarization) and the discharging curve of the P–E plot in the first quadrant represents the recoverable energy storage density, and the energy loss (
Wloss) corresponds to the area enclosed by the P–E plot because of hysteresis in the charging–discharging process of the ferroelectric material, as clearly depicted in
Fig. 6c. Energy storage devices that exhibit negligible hysteresis in PE loops are appropriate for energy storage applications; in this context, classical relaxor ferroelectrics with slim hysteresis are highly suitable. The efficiency (
η) for energy storage is defined as
| |
 | (5) |
 |
| | Fig. 6 (a) Electric field dependent polarization loop, (b) Ps/Pr and Ps − Pr variation (c) represents the schematic diagram highlighting Wrec, Wloss & Wtotal, and (d) energy density and efficiency plot of PMN-25PT/LSCO/LSAT heterostructure. | |
The Wrec can be increased by increasing the difference between Ps and Pr according to eqn (4b), also relaxor ferroelectric materials can be a good choice as they exhibit very low hysteresis, high Ps and low Pr. By using relations (4a), (4b), and (5), the Wrec and efficiency are computed and plotted in Fig. 6d. The Wrec exhibits a linear correlation with the electric field, achieving a maximum value of 32.69 J cm−3 with an η of 50.92% at 2.5 MV cm−1.
For the temperature-dependent study of energy density properties, the P–E loops were measured at 10 kHz with a temperature range from 25 to 190 °C using an in-house open-air heating setup. The first quadrant was utilized for calculations, as shown in Fig. 7a. With increasing temperature, there is a slight decrease in Ps and Pr. From Fig. 7b, the ratio of Ps/Pr initially increases and peaks at 130 °C; however, Ps − Pr decreases slightly with an increase in temperature. The Wrec and efficiency η were plotted in Fig. 7c as a function of temperature up to 190 °C. A high Wrec of 30 J cm−3 was obtained, with an efficiency of around 50% at 10 kHz. The efficiency is highest near 130 °C, which is also supported by the dielectric dispersion maximum at 130 °C at 10 kHz. The Wrec initially decreases with increasing temperature and thereafter remains almost constant up to 190 °C, which remains 91% of its initial value at room temperature, showing excellent thermal stability, which is a key feature in energy storage. However, there are few publications on the high-breakdown electric-field and energy-storage applications of PMN-xPT-based thin films, which warrant further exploration of microstructure-property relations. The PMN-xPT (with x = 0.1 & 0.2) thin film deposited by RF sputtering showed a Wrec of around 31 J cm−3 under a high electric field of about MV cm−3. Recently, a large energy density of 133 J cm−3, with an efficiency over 75% was observed in PMN-xPT epitaxial thin films by post-processing with ion bombardment.39 The doping of rare earth element La3+ in PMN-0.12PT was employed, and a Wrec of 25.2 J cm−3 with an efficiency of 63.2% was attained.40 Li et al. incorporated buffer layers of SrTiO3 and LaAlO3 into PMN-0.07PT and achieved an energy density of approximately 48 J cm−3, with an efficiency approaching 77%.41 It is essential to note that most studies were conducted away from the MPB (x ≈ 0.3) of the PMN-xPT solid solution.
 |
| | Fig. 7 (a) Temperature-dependent polarization loop, (b) Ps/Pr and Ps − Pr variation and (c) energy density and efficiency plot of PMN-25PT/LSCO/LSAT heterostructure. | |
Fig. 8a shows the leakage current behavior of the epitaxial thin film sample at 1 kHz. The applied electric field profile is shown with the help of arrows in Fig. 8a; it starts from 0 to +E and back to 0, and similarly for the negative axis. The Plot is asymmetrical with respect to the x-axis because applying positive and negative electric fields results in different work functions for the top and bottom electrodes. On the positive side, the hysteresis behavior is obtained, which might be occurring due to the polarization-driven resistive switching behavior.42 However, on both sides near 0.5 MV cm−1 electric field, a kink is observed; this might be due to induced polarization near the coercive electric field. The leakage current is of the order of 10−5 Ampere at 1.25 MV cm−1 (half of the breakdown electric field), which denotes the high resistivity of the formed film, which in turn infers toward the high breakdown electric field. To test the film's durability, a fatigue test was performed on the thin-film device by applying charging–discharging stress cycles. A triangular waveform with a 10 kHz frequency was applied, with successive increments in stress time, and polarization parameters were measured. The device exhibits excellent performance, maintaining a stable polarization value up to 108 cycles, as shown in Fig. 8b, and can be utilized in practical energy storage applications. The inset figure shows the results of a Positive–Up–Negative–Down (PUND) pulse measurement performed at 10 kHz to separate intrinsic switchable ferroelectric polarization from non-switching contributions such as leakage and capacitive currents. The x-axis represents the pulse sequence, while the y-axis gives the measured polarization (µC cm−2). In this sequence, the first positive pulse (P*) switches the polarization and therefore includes both the switchable polarization component and non-switching contributions. The second positive pulse (P^) is applied in the same polarity without allowing reversal; hence, it mainly measures the non-switching component. The true positive remanent polarization is calculated by subtracting the non-switching contribution from the total response measured during the first positive pulse using this equation:
 |
| | Fig. 8 (a) Leakage current and (b) fatigue behavior up to 108 stress cycles of the PMN-25PT/LSCO/LSAT heterostructure, with an inset showing polarization versus pulse count (PUND measurements) at 10 kHz. | |
Similarly, during the negative polarity sequence, the first negative pulse (−P*) contains both switching and non-switching contributions, while the second negative pulse (−P^) represents primarily the non-switching response. The negative remanent polarization is therefore calculated as:
The effective switchable polarization (2Pr) can then be expressed as:
The distinct difference between P* and P^ (and between −P* and −P^) confirms that a significant portion of the measured signal arises from genuine ferroelectric domain switching rather than leakage artifacts. The comparable magnitudes of Pr+ and Pr− further indicate symmetric and reversible polarization switching, demonstrating the intrinsic ferroelectric nature of the film. The PUND analysis, which also serves as a fingerprint of intrinsic polarization, indicates a remanent polarization of nearly 4.6 µC cm−2 at 10 kHz. The polarization data are taken at such a high frequency that no mobile charge carriers can follow the PE loops.
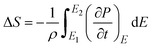
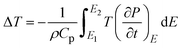
Fig. 9 presents the temperature-dependent polarization behavior and the corresponding electrocaloric response of the material under various electric fields. In Fig. 9a, polarization decreases progressively with increasing temperature across the measured range, indicating a gradual thermal depolarization process without evidence of a sharp phase transition. The observed temperature dependence of polarization shows an initial decrease up to ∼140 °C, followed by a gradual increase at higher temperatures, which can be understood in relation to the dielectric phase transition occurring near ∼130 °C at 10 kHz. Below the transition temperature, the material remains in the ferroelectric state, where increasing temperature enhances thermal disorder and weakens long-range dipolar alignment, leading to a reduction in polarization. As the temperature approaches the ferroelectric–paraelectric phase transition, polarization becomes increasingly unstable and reaches a minimum due to the collapse of spontaneous ferroelectric order. Beyond this temperature, the system enters a paraelectric or transition-dominated regime, where polarization is primarily field-induced rather than domain-driven. In this region, enhanced dielectric permittivity, increased polarizability, and the activation of free charge carriers contribute to the apparent rise in polarization under applied electric fields. The contribution of thermally activated free carriers and space-charge polarization becomes more significant at elevated temperatures, particularly at finite measurement frequencies, resulting in an increase in measured polarization despite the absence of long-range ferroelectric order. Fig. 9b shows the derivative of polarization with respect to temperature (dP/dT), which highlights the regions of rapid polarization change. Distinct peaks and sign reversals are observed, marking the transition between positive and negative electrocaloric regimes. As the applied electric field increases, these peaks become more pronounced and shift toward higher temperatures, reflecting strengthened field-temperature coupling in the material. Electrocaloric effects are examined based on their fundamental principle: when the applied E-field increases from E1 to E2, the material undergoes an isothermal entropy change (ΔS):43 S = S(E1,T) − S(E2,T). Thus, the starting condition of the ECE material at E1 (generally taken as E1 = 0) has a direct influence on the electrocaloric response. This relationship can be described using the Maxwell relation:44 (∂P/∂T)E = (∂S/∂E)T. Maxwell's relations were employed to calculate the electric-field-driven variations in temperature (|ΔT|) and entropy (|ΔS|) associated with the electrocaloric parameters:
| |
 | (7) |
| |
 | (8) |
Here,
S denotes entropy,
p represents polarization,
E is the applied electric field,
ρ represents the material density, which is 7356 kg m
−3.
T is the temperature, and the specific heat
Cp is 0.324 J g
−1 K
−1.
Fig. 9c and d illustrate the electrocaloric temperature change (Δ
T) and entropy change (Δ
S), respectively, derived from the Maxwell relation. In
Fig. 9c, Δ
T shows both positive and negative EC effects at different temperatures. At lower temperatures, a positive Δ
T appears, corresponding to the conventional EC effect where polarization decreases with increasing temperature. Near the transition region, a pronounced negative Δ
T emerges, increasing in magnitude with stronger electric fields, which is characteristic of an inverse EC response associated with field-induced phase behavior. Similarly,
Fig. 9d shows that Δ
S follows the same trend, with entropy increasing in the negative EC region due to enhanced disorder during field-driven polarization changes. The pronounced negative electrocaloric effect (ECE) observed after the ferroelectric–paraelectric phase transition can be attributed to polarization consolidation mechanisms that dominate in the high-temperature regime. Near and above the phase transition, the long-range ferroelectric order collapses and the material enters a paraelectric or transition-dominated state characterized by strong polarization fluctuations and enhanced dielectric susceptibility, application of an electric field in this regime, field-induced dipoles and short-range polar correlations become progressively stabilized, leading to a consolidation or reorganization of polarization rather than conventional disordering.
45 In relaxor ferroelectrics, the electrocaloric effect (ECE) under adiabatic conditions arises from the interaction between an applied electric field and the dynamic polar nano-regions (PNRs) present in the material. When an electric field is applied adiabatically at lower temperatures, the PNRs tend to align along the field direction, thereby decreasing dipolar configurational entropy. Since the process is adiabatic and total entropy must remain constant, the decrease in dipolar entropy is compensated by an increase in lattice entropy, leading to a rise in temperature. This phenomenon is known as the positive electrocaloric effect (+ve ECE), in which the material's temperature increases upon application of an electric field. Mathematically, this occurs when the temperature derivative of polarization (∂
P/∂
T)
E is negative. The ECE changes from positive to negative with rising temperature, at the point where the temperature change is zero. At that point, (∂
P/∂
T)
E tends to zero due to cancellation of both types of ECE. However, near the phase transition region or at higher temperatures, relaxor ferroelectrics exhibit highly dynamic and weakly correlated PNRs. Under these conditions, the application of an electric field can induce structural or dipolar rearrangements that increase dipolar disorder and, thereby, dipolar entropy. To maintain constant total entropy under adiabatic conditions, the lattice entropy decreases, lowering the temperature. This leads to the negative electrocaloric effect (−ve ECE), where the temperature decreases when the electric field is applied, corresponding to a positive value of (∂
P/∂
T)
E. Therefore, the coexistence and temperature-dependent evolution of ordered and disordered polar nano-regions in relaxor ferroelectrics allow both positive and negative electrocaloric responses to occur under an applied electric field (as shown in the schematic diagram,
Fig. 10). The magnitude of the negative ECE increases with electric field due to stronger alignment and stabilization of polar regions, highlighting the critical role of phase-transition-induced polarization dynamics and entropy changes in governing the electrocaloric behavior. The amplification of both Δ
T and Δ
S with increasing electric field indicates that the material exhibits a strong, tuneable electrocaloric effect across a broad temperature range. The device demonstrates a pronounced negative electrocaloric effect, characterized by a maximum entropy change of −29.4 J kg
−1 K
−1 and a peak adiabatic temperature change of −38.3 K at 150 °C under an applied electric field of 2.5 MV cm
−1. Additionally, a positive electrocaloric response is observed around 120 °C, resulting in a temperature change of 33.4 K and an accompanying entropy change of 27.5 J kg
−1 K
−1. The enhancement of Δ
T and Δ
S with increasing electric field indicates strong coupling between polarization behavior and thermal response, demonstrating the potential of these thin films for solid-state refrigeration based on negative electrocaloric cooling. To compare with other ferroelectric materials,
Table 2 summarises the ECE values from this study alongside experimental data from existing literature.
 |
| | Fig. 9 Temperature-dependent polarization behavior and electrocaloric response under various electric fields, (a) polarization (P–T) curves, (b) temperature derivative of polarization (dP/dT), (c) electrocaloric temperature change (ΔT), and (d) entropy change (ΔS) as a function of temperature. | |
 |
| | Fig. 10 Functional mechanism of the PMN-25PT film based on reversible positive and negative electrocaloric effects. | |
Table 2 Comparative summary of electrocaloric effect (ECE) values for certain material compositions
| Material films |
T (°C) |
ΔT (K) |
ΔS (J kg−1 K−1) |
ΔE (kV cm−1) |
|ΔT/ΔE| (K cm kV−1) |
|ΔS/ΔE| (J kg−1 K−1 kV cm−1) |
Ref. |
| PLZT8/65/35 |
45 |
40 |
50 |
1200 |
0.0333 |
0.042 |
56 |
| Hf0.2Zr0.8O2 |
34 |
13.4 |
— |
3260 |
0.004 |
— |
13 |
| BCT-BMT |
163 |
−42.5 |
−29.3 |
1630 |
0.026 |
0.018 |
57 |
| PZT/CFO-L9 |
−68 |
−25 |
−40.16 |
370 |
0.0675 |
0.108 |
58 |
| BKNT15 |
30 |
−16.55 |
−28.83 |
1125 |
0.0159 |
0.026 |
59 |
| NBTWF |
55 |
−17 |
−24 |
2692 |
0.006 |
0.009 |
51 |
| NBTWF |
143 |
56 |
64 |
2692 |
0.021 |
0.024 |
51 |
| PMN-7PT |
25 |
9 |
— |
720 |
0.0125 |
— |
60 |
| PZT95/PZT52 |
125 |
20.5 |
24.8 |
570 |
0.036 |
0.043 |
61 |
| PMN-10PT |
75 |
5 |
— |
895 |
0.0056 |
— |
62 |
| P(VDF-TrFE)55/45 |
80 |
12.6 |
60 |
2090 |
0.006 |
0.029 |
9 |
| PMN-35PT |
140 |
31 |
— |
747 |
0.0415 |
— |
63 |
| NBBST |
40 |
12 |
18 |
1642 |
0.007 |
0.011 |
64 |
| PMN-25PT |
150 |
−38.3 |
−29.4 |
2500 |
0.0153 |
0.012 |
This work |
| PMN-25PT |
120 |
33.4 |
27.5 |
2500 |
0.0134 |
0.011 |
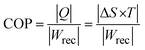
However, it should be emphasized that the observation of a negative ECE derived from the indirect method based on Maxwell relations is well established and widely accepted, even in systems exhibiting unsaturated P–E loops, provided that the polarization data are thermodynamically consistent. Numerous studies have successfully employed Maxwell's relation to evaluate both positive and negative ECE without requiring fully saturated hysteresis loops. Negative ECE has been reliably reported near first-order or diffuse phase transitions, relaxor ferroelectrics, and field-induced phase instability regions, where a positive (∂P/∂T)E naturally occurs due to entropy-driven polarization reconfiguration. In such cases, unsaturated loops do not invalidate the indirect ECE analysis, as the Maxwell approach depends on reversible polarization changes rather than absolute saturation polarization. In the present work, special care was taken to minimize leakage-current contributions by performing measurements under optimized electric fields and temperature ranges where conduction effects are negligible. The smooth temperature evolution of polarization, the absence of anomalous current spikes, and the consistency of the extracted (∂P/∂T)E trends support the intrinsic nature of the observed negative ECE. Similar methodologies and conclusions have been reported for lead-based and lead-free ferroelectrics exhibiting negative ECE using indirect methods. While direct ECE measurements are certainly desirable, it is well recognized that indirect Maxwell-based evaluation remains a valid and widely used approach for identifying negative ECE, particularly when direct calorimetric measurements are experimentally challenging. Therefore, we believe that the negative electrocaloric effect reported in this study is intrinsic and consistent with existing literature rather than an artefact arising from unsaturated P–E loops or leakage currents. Several studies have shown qualitative and even quantitative agreement between indirect and direct measurements of negative ECE in such systems.46–54 The electrocaloric efficiency is commonly quantified by the parameter ηmax = ΔTmax/ΔEmax, where ΔEmax denotes the applied electric-field variation and ΔTmax is the corresponding maximum temperature change. In the present study, a maximum electrocaloric efficiency of 0.0153 cm K kV−1 is achieved. To further assess the overall performance and energy efficiency of the electrocaloric material, the coefficient of performance (COP) is employed, which is defined by the following relation:
| |
 | (9) |
Here,
Q represents the isothermal heat exchanged during the electrocaloric process, whereas
Wrec refers to the recoverable energy density per unit volume, which was evaluated by numerically integrating the area enclosed between the discharge branch of the P–E hysteresis loop and the polarization axis. Under an applied electric field of 2.5 MV cm
−1 at 423 K, the PMN-25PT thin film exhibits a maximum COP of 3.05. Notably, this value exceeds those previously reported for both lead-free and lead-based electrocaloric materials. This value is comparable to that reported for PbZr
0.95Ti
0.05O
3 thin films, which exhibit a COP of approximately 3
8 and a COP of about 1.2 has been reported for doped BaTiO
3-based multilayer thin films.
55 Fig. 10 illustrates a reversible electrocaloric cooling cycle that combines positive and negative electrocaloric effects (ECEs) to enhance the overall cooling capacity of an electrocaloric (EC) film. In the upper section, the positive ECE process is shown. Initially, the EC film is at temperature
T0 and entropy
S0 (stable FE state) with no applied electric field (
E = 0). When an electric field
E1 is applied adiabatically, the dipoles in the ferroelectric material align along the field direction, reducing dipolar entropy while keeping the total entropy constant. As a result, the lattice entropy increases, leading to a temperature rise from
T0 to
T0 + Δ
T1. Subsequently, the system releases heat −
Q1 to the surroundings under an isoelectric condition, which decreases the entropy from
S0 to
S0 − Δ
S1 while maintaining the electric field. When the electric field is then removed adiabatically, the dipoles become disordered again, increasing dipolar entropy and causing the temperature to decrease to
T0 − Δ
T1, thereby completing the positive ECE stage. As the system enters the temperature region where negative ECE dominates, it marks the cooling stage of the electrocaloric cycle. Starting from the state
T0 − Δ
T1,
S0 − Δ
S1 at an applied electric field
E =
E2, the system is already in the temperature region where the negative electrocaloric response dominates. Under these conditions, the dipolar configuration in the electrocaloric film, typically associated with relaxor-like ferroelectric states, is highly dynamic. When the system undergoes an adiabatic field-driven process, the dipoles rearrange to increase the dipolar configurational entropy. Because the process is adiabatic and the total entropy must remain constant, the increase in dipolar entropy is compensated by a decrease in lattice entropy, resulting in a further reduction in temperature from
T0 − Δ
T1 to
T0 − Δ
T1 − Δ
T2. After reaching this lower temperature state, the EC film absorbs heat +
Q2 from the surroundings under constant electric field conditions, which increases the entropy from
S0 − Δ
S1 to
S0 − Δ
S1 + Δ
S2 and slightly raises the temperature from
T0 to
T0 + Δ
T2. Subsequently, during the adiabatic removal of the electric field, the dipoles gradually return toward their initial configuration. Thus, the cross-to-switch pathway represents a continuous negative electrocaloric cooling process, in which entropy redistribution between the dipolar and lattice subsystems leads to a significant temperature reduction, enabling efficient heat absorption from the environment in electrocaloric refrigeration cycles.
51 As shown in
Fig. 9c, two distinct electrocaloric regimes are clearly observed. In the low- to intermediate-temperature region (≈30–135 °C), Δ
T is positive for all applied fields, and its magnitude increases systematically with increasing electric field. This behavior corresponds to a conventional positive electrocaloric effect, where adiabatic application of the electric field reduces dipolar entropy through enhanced polarization ordering, leading to a temperature rise. In contrast, above ∼140 °C, Δ
T changes sign and becomes negative, reaching a pronounced minimum around 150 °C before gradually recovering at higher temperatures. The magnitude of the negative Δ
T also increases with electric field strength, indicating a field-driven negative electrocaloric effect. This sign reversal is associated with field-induced polarization instability and entropy increase near the phase-transition region, where (∂
P/∂
T)
E becomes positive. Importantly, both positive and negative EC effects occur under comparable electric-field amplitudes but in different temperature windows. This coexistence of reversible positive and negative electrocaloric responses enables the proposed two-stage continuous refrigeration mechanism.
Fig. 11 compares the electrocaloric (EC) performance of the PMN-25PT thin film investigated in this work with that of several representative ferroelectric and relaxor-based thin films reported in the literature. The peak electrocaloric temperature change (ΔT, left axis) and the corresponding entropy change (ΔS, right axis) are plotted as functions of the applied electric field (E). For each material system, both positive and negative EC responses are shown where available, reflecting the reversible electrocaloric behavior typically observed near phase-transition or field-induced instability regions. Compared with commonly studied thin films such as PZT-, PLZT-, BNKT-, and BCZT-based systems, the PMN-25PT film exhibits comparatively large magnitudes of both ΔT and ΔS under a similar electric-field range. Notably, the PMN-25PT film exhibits pronounced positive and negative EC effects within the same material, indicating a wide, tunable electrocaloric working window. The data marked as “This work” highlight that PMN-25PT combines strong EC strength with dual-sign reversibility, underscoring its advantage for two-stage or continuous solid-state electrocaloric refrigeration and its competitiveness among state-of-the-art electrocaloric thin films.
 |
| | Fig. 11 Comparison of the electrocaloric properties of the PMN-25PT film with those of representative thin films reported in the literature of the peak values of ΔT and ΔS as a function of applied electric field. | |
The Olsen cycle was originally proposed in the 1980s as a thermodynamic energy-conversion scheme for thermal-fluctuation type-1 (TF-1) ferroelectrics, in which the saturation polarization decreases monotonically with increasing temperature due to enhanced thermal disorder. At that time, ferroelectrics exhibiting thermal-fluctuation type-2 (TF-2) behavior, where polarization increases with temperature as a result of thermally activated dipolar alignment, were scarcely reported, and systematic studies of such materials did not emerge until after 2008. To address this limitation, a modified Olsen cycle specifically tailored for TF-2 ferroelectrics was introduced in 2014. Subsequently, the Olsen cycle concept was generalized to encompass all polar materials that exhibit temperature-dependent polarization, regardless of the sign of the thermal fluctuation behavior.65,66 In the generalized Olsen cycle, electrical energy is harvested through the coupled modulation of temperature and electric field in a pyroelectric or ferroelectric material. The cycle begins by polarizing the material at a low temperature (TL) under a unipolar electric field. The material is then heated at a constant high electric field (EH), during which the polarization changes with temperature decreasing for TF-1 systems and increasing for TF-2 systems, thereby generating electrical work. This step is followed by depolarization at the elevated temperature (TH) through a reduction of the electric field, and finally by isoelectric cooling under a low electric field (EL), which produces additional electrical output. Together, these steps form a closed thermodynamic loop that converts thermal energy into electrical energy through the electrocaloric and pyroelectric effects.67 Fig. 12 illustrates the Olsen cycle for PMN-25PT ceramics, highlighting the conservation and conversion of thermal energy via the electrocaloric effect. The cycle is represented in the polarization–electric field (P–E) plane using hysteresis loops measured at two temperatures: 30 °C (low temperature, yellow curve) and 140 °C (high temperature, blue curve). The closed path M–N–O–P defines the Olsen cycle, which consists of two isothermal processes (M–N and O–P), where the electric field is varied at constant temperature, and two isoelectric processes (N–O and P–M), where the temperature is varied under a constant electric field. Since the polarization of PMN-25PT decreases with increasing temperature, the resulting M–N–O–P loop follows a clockwise direction in the P–E diagram, indicating net electrical energy generation. This thermoelectric cycling strategy significantly enhances both the energy density and power output of pyroelectric devices by exploiting temperature-dependent polarization changes. The electrical energy harvested per cycle is directly proportional to the area enclosed by the Olsen cycle in the P–E hysteresis loop, underscoring the importance of strong polarization response, large thermal sensitivity, and optimized electric-field modulation in achieving high energy-conversion efficiency.
 |
| | Fig. 12 P–E hysteresis loops of PMN-25PT ceramics recorded at low (30 °C) and high (140 °C) temperatures. The inset schematically depicts the Olsen cycle (M–N–O–P), highlighting the isothermal and isoelectric processes. | |
M–N process: isothermal polarization process
In step M → N, the material undergoes an isothermal process at low temperature (TL), where the polarization increases from PM to PN with an applied electric field from EL to EH.
N–O process: isoelectric heating process
In step N → O, the system follows an isoelectric process at high electric field (EH), during which the temperature rises from TL (low) to TH (high), causing polarization to decrease from PN to PO.
O–P process: isothermal depolarization process
Step O → P is an isothermal process at high temperature (TH), where reducing the electric field from EH (high) to EL (low), the polarization slightly decreases from PO to PP.
P–M process: isoelectric cooling process
To conclude in the last step, P → M, the substance goes through an isoelectric process at a low electric field (EL), where cooling from TH back to TL re-establishes the polarization state PM.
The energy converted per unit volume in a single cycle is given by the area circumscribed by the clockwise M–N–O–P loop of the P–E hysteresis curve. The corresponding energy, ND (J L−1 per cycle), is derived from the following relation:68
| |
 | (10) |
Within the temperature range of 30–140 °C and under applied electric fields of 0–2.5 MV cm−1, the system achieves an energy density of ∼18.7 J cm−3 (equivalent to ∼18.7 J L−1 per cycle). Table 3 presents the Olsen-cycle-based energy-harvesting features and the corresponding operating parameters for various thin-film materials reported in the literature.
Table 3 The pyroelectric energy-harvesting performance of various ferroelectric materials reported in the literature can be summarized as follows
| Materials |
Tlow (°C) |
Thigh (°C) |
Elow (kV cm−1) |
Ehigh (kV cm−1) |
ND (J cm−3 cycle) |
Ref. |
| PbZr0.53Ti0.47O3/CoFe2O4 |
−173 |
27 |
0 |
400 |
∼47 |
58 |
| Hf0.2Zr0.8O2 |
25 |
150 |
0 |
3260 |
∼11.5 |
13 |
| Pb0.99Nb0.02(Zr0.55Sn0.40Ti0.05)0.98O3 |
25 |
225 |
218 |
1091 |
∼7.4 |
69 |
| 0.67PbMg1/3Nb2/3O3–0.33PbTiO3 |
30 |
50 |
0 |
600 |
8 |
70 |
| 0.68PbMg1/3Nb2/3O3–0.32PbTiO3 |
25 |
115 |
125 |
392 |
1 |
71 |
| BaZr0.2Ti0.8/Ba0.7Ca0.3TiO3 |
20 |
100 |
436 |
985 |
∼11 |
72 |
| 0.75PbMg1/3Nb2/3O3–0.25PbTiO3 |
30 |
140 |
0 |
2500 |
∼18.7 |
This work |
The enhanced functional performance of the PMN-PT thin film is primarily governed by its relaxor ferroelectric nature, strong (001) crystallographic texturing, and nanoscale polarization dynamics. The tetragonal-like phase and preferential orientation stabilize polarization along the out-of-plane direction, enabling a large field-induced polarization while maintaining a low remanent polarization. This combination is particularly favorable for both high-efficiency energy storage and electrocaloric (EC) applications, as it promotes reversible polarization changes and suppresses hysteresis losses. The columnar microstructure plays a critical role in improving dielectric breakdown strength by limiting lateral charge transport and suppressing leakage pathways. This microstructural advantage enables the film to withstand high electric fields up to 2.5 MV cm−1, directly contributing to the large recoverable energy density achieved in this work. The slim polarization–electric field loops further indicate a highly reversible polarization response, resulting in reduced energy dissipation and enhanced storage efficiency. In addition, the film exhibits excellent thermal stability up to 190 °C, which is essential for reliable operation in high-temperature electronic and power-conditioning environments. The dielectric response of the PMN-PT film is characterized by a broad and diffuse permittivity maximum with pronounced frequency dispersion, confirming its relaxor behavior. This response originates from compositional disorder and the presence of polar nanoregions (PNRs), whose gradual evolution with temperature enables stable dielectric and ferroelectric properties over a wide temperature range. Electric modulus analysis reveals that the dominant relaxation processes arise from thermally activated localized charge carriers or short-range hopping mechanisms, which are closely coupled to the dynamics of PNRs and the diffuse phase transition. A key outcome of this study is the coexistence of large positive and negative EC effects within the same material system. The negative EC response observed at elevated temperatures is attributed to field-induced reconfiguration and destabilization of PNRs near the relaxor-to-paraelectric-like transition, whereas the positive EC effect at lower temperatures arises from conventional field-driven dipolar ordering. The reversible sign change of the EC response enables a broad operational temperature window and highlights the potential of PMN-25PT thin films for multi-stage electrocaloric cooling. Overall, the combination of high energy density, thermal robustness, fatigue resistance, and giant bidirectional EC response underscores the promise of PMN-25PT thin films for advanced solid-state cooling and energy storage technologies.
4. Conclusions
A nanoscale columnar PMN-25PT relaxor thin film was successfully fabricated by pulsed laser deposition, exhibiting highly oriented (100) growth with a tetragonal-like structure. The film shows large saturation polarization, high dielectric breakdown strength, low remanent polarization, and broad frequency- and temperature-dependent dielectric dispersion, making it suitable for energy storage. Electrical modulus analysis reveals thermally activated localized charge dynamics associated with short-range hopping and phase transitions. The recoverable energy density increases with electric field, reaching 32.69 J cm−3 with an efficiency of 50.92%, while maintaining excellent thermal stability up to 190 °C and outstanding fatigue endurance over 108 charge–discharge cycles. The film exhibits a giant negative electrocaloric response near 150 °C with ΔT = −38.3 K and ΔS = −29.4 J kg−1 K−1, along with a strong positive electrocaloric response near 120 °C (ΔT = 33.4 K, ΔS = 27.5 J kg−1 K−1). Operating over a wide temperature range of 30–140 °C and electric fields up to 2.5 MV cm−1, the system achieves a high energy conversion density of ∼18.7 J cm−3 per cycle, highlighting its potential for solid-state cooling and thermal energy harvesting applications.
Author contributions
Charanjeet Singh; conceptualization, methodology, experimental data production, analysis of the obtained results, writing-original draft, Priya Choudhary; conceptualization, methodology, experimental data production, analysis of the obtained results, writing-original draft, M. Asif; conceptualization, methodology, experimental data production, Ashok Kumar; conceptualization, supervision, writing-reviewing and editing.
Conflicts of interest
There are no conflicts to declare.
Data availability
Data will be made available on request.
Acknowledgements
The authors thank the CSIR-NPL director for constant encouragement and infrastructure support. Dr Charanjeet Singh also wants to acknowledge AcSIR for providing an opportunity to pursue the PhD program and UGC for the fellowship during their PhD.
References
- X. Moya, S. Kar-Narayan and N. D. Mathur, Nat. Mater., 2014, 13, 439–450 CrossRef CAS.
- A. M. Tishin, Y. I. Spichkin, V. I. Zverev and P. W. Egolf, Int. J. Refrig., 2016, 68, 177–186 CrossRef CAS.
- E. Defay, R. Faye, G. Despesse, H. Strozyk, D. Sette, S. Crossley, X. Moya and N. D. Mathur, Nat. Commun., 2018, 9, 1827 CrossRef CAS.
- S. Lisenkov, R. Herchig, S. Patel, R. Vaish, J. Cuozzo and I. Ponomareva, Nano Lett., 2016, 16, 7008–7012 CrossRef CAS PubMed.
- S. Lisenkov, B. K. Mani, J. Cuozzo and I. Ponomareva, Phys. Rev. B, 2016, 93, 064108 CrossRef.
- D. S. Holmes, A. L. Ripple and M. A. Manheimer, IEEE Trans. Appl. Supercond., 2013, 23, 1701610 Search PubMed.
- C. R. Bowen, J. Taylor, E. Leboulbar, D. Zabek, A. Chauhan and R. Vaish, Energy Environ. Sci., 2014, 7, 3836–3856 RSC.
- A. S. Mischenko, Q. Zhang, J. F. Scott, R. W. Whatmore and N. D. Mathur, Science, 2006, 311, 1270–1271 CrossRef CAS PubMed.
- B. Neese, B. Chu, S. G. Lu, Y. Wang, E. Furman and Q. M. Zhang, Science, 2008, 321, 821–823 CrossRef CAS.
- A. Gupta, R. Kumar and S. Singh, Scr. Mater., 2018, 143, 5–9 CrossRef CAS.
- Z. Jiang, S. Prokhorenko, S. Prosandeev, Y. Nahas, D. Wang, J. Íñiguez, E. Defay and L. Bellaiche, Phys. Rev. B, 2017, 96, 014114 CrossRef.
- J. Tušek, K. Engelbrecht, R. Millán-Solsona, L. Mañosa, E. Vives, L. P. Mikkelsen and N. Pryds, Adv. Energy Mater., 2015, 5, 1500361 CrossRef.
- M. H. Park, H. J. Kim, Y. J. Kim, T. Moon, K. Do Kim and C. S. Hwang, Nano Energy, 2015, 12, 131–140 CrossRef CAS.
- B. Peng, Q. Zhang, Y. Lyu, L. Liu, X. Lou, C. Shaw, H. Huang and Z. Wang, Nano Energy, 2018, 47, 285–293 CrossRef CAS.
- T. Correia and Q. Zhang, Engineering Materials Electrocaloric Materials, Springer, 2014, vol. 34 Search PubMed.
- Y. Bai, G. P. Zheng and S. Q. Shi, Mater. Res. Bull., 2011, 46, 1866–1869 CrossRef CAS.
- S. Uddin, G. P. Zheng, Y. Iqbal, R. Ubic and J. Yang, J. Appl. Phys., 2013, 114, 213519 CrossRef.
- W. Geng, Y. Liu, X. Meng, L. Bellaiche, J. F. Scott, B. Dkhil and A. Jiang, Adv. Mater., 2015, 27, 3165–3169 CrossRef CAS PubMed.
- F. Zhuo, Q. Li, J. Gao, Y. Wang, Q. Yan, Y. Zhang, X. Xi, X. Chu and W. Cao, Appl. Phys. Lett., 2016, 108, 082904 Search PubMed.
- I. Ponomareva and S. Lisenkov, Phys. Rev. Lett., 2012, 108, 167604 CrossRef CAS PubMed.
- H.
H. Wu, J. Zhu and T. Y. Zhang, Phys. Chem. Chem. Phys., 2015, 17, 23897–23908 Search PubMed.
- H. H. Wu, J. Zhu and T. Y. Zhang, Nano Energy, 2015, 16, 419–427 Search PubMed.
- G. Vats, A. Kumar, N. Ortega, C. R. Bowen and R. S. Katiyar, Energy Environ. Sci., 2016, 9, 1335–1345 RSC.
- Q. Chi, J. Dong, C. Zhang, X. Wang and Q. Lei, J. Mater. Chem. C, 2016, 4, 4442–4450 Search PubMed.
- Q. G. Chi, X. Wang, W. L. Li, W. D. Fei and Q. Q. Lei, Appl. Phys. Lett., 2011, 98, 242903 CrossRef.
- B. Peng, H. Fan and Q. Zhang, Adv. Funct. Mater., 2013, 23, 2987–2992 CrossRef CAS.
- Y. Zhao, X. Hao and Q. Zhang, J. Mater. Chem. C, 2015, 3, 1694–1699 Search PubMed.
- W. Geng, Y. Liu, X. Meng, L. Bellaiche, J. F. Scott, B. Dkhil and A. Jiang, Adv. Mater., 2015, 27, 3165–3169 Search PubMed.
- M. Ye, T. Li, Q. Sun, Z. Liu, B. Peng, C. Huang, P. Lin, S. Ke, X. Zeng, X. Peng, L. Chen and H. Huang, J. Mater. Chem. C, 2016, 4, 3375–3378 Search PubMed.
- M. H. Park, H. J. Kim, Y. J. Kim, T. Moon, K. Do Kim, Y. H. Lee, S. D. Hyun and C. S. Hwang, Adv. Mater., 2016, 28, 7956–7961 CrossRef CAS PubMed.
- C. Singh and A. Kumar, Ceram. Int., 2022, 48, 18278–18285 CrossRef CAS.
- U. Trstenjak, N. Daneu, I. Rafalovskyi, J. Belhadi, D. Vengust, J. Hlinka and M. Spreitzer, Appl. Phys. Lett., 2022, 120, 042901 CrossRef CAS.
- J. Kim, H. Takenaka, Y. Qi, A. R. Damodaran, A. Fernandez, R. Gao, M. R. McCarter, S. Saremi, L. Chung, A. M. Rappe and L. W. Martin, Adv. Mater., 2019, 31, 1901060 Search PubMed.
- A. E. Glazounov and A. K. Tagantsev, Appl. Phys. Lett., 1998, 73, 856–858 Search PubMed.
- S. L. Swartz, T. R. Shrout, W. A. Schulze and L. E. Cross, J. Am. Ceram. Soc., 1984, 67, 311–314 Search PubMed.
- M. Correa, A. Kumar and R. S. Katiyar, J. Am. Ceram. Soc., 2008, 91, 1788–1795 CrossRef CAS.
- R. Martínez V, A. Kumar, D. A. Sanchez, R. Palai and R. S. Katiyar, J. Appl. Phys., 2010, 108, 084105 CrossRef.
- N. Ortega, A. Kumar, P. Bhattacharya, S. B. Majumder and R. S. Katiyar, Phys. Rev. B: Condens. Matter Mater. Phys., 2008, 77, 014111 Search PubMed.
- J. Kim, S. Saremi, M. Acharya, G. Velarde, E. Parsonnet, P. Donahue, A. Qualls, D. Garcia and L. W. Martin, Science, 2020, 369, 81–84 Search PubMed.
- X. Xia, H. Sun, H. Sui, S. Xiao, X. Liu and D. Huang, Surf. Interfaces, 2022, 28, 101670 Search PubMed.
- Y. Li, J. Xu, Z. Xu, Y. Yu, Y. Zhang, L. Lu, W. Zheng, C. Ding, Z. Wen, H. Shi, C. Lu and Z. Wen, Appl. Phys. Lett., 2022, 120, 252901 CrossRef CAS.
- C. Singh, V. N. Thakur and A. Kumar, J. Alloys Compd., 2021, 887, 161345 Search PubMed.
- M. C. Rose and R. E. Cohen, Phys. Rev. Lett., 2012, 109, 187604 CrossRef PubMed.
- M. Valant, L. J. Dunne, A. K. Axelsson, N. M. N. Alford, G. Manos, J. Peräntie, J. Hagberg, H. Jantunen and A. Dabkowski, Phys. Rev. B: Condens. Matter Mater. Phys., 2010, 81, 214110 CrossRef.
- J. Li, J. Li, S. Qin, X. Su, L. Qiao, Y. Wang, T. Lookman and Y. Bai, Phys. Rev. Appl., 2019, 11, 044032 CrossRef CAS.
- Z. Tang, Y. Zhou, B. Yang, J. Chen and S. Zhao, J. Phys. Chem. Solids, 2023, 172, 111054 Search PubMed.
- S. Han, J. Bie, W. Fa, S. Chen, L. Tang, W. Guo, H. Xu, Y. Ma, Y. Liu, X. Liu, Z. Sun and J. Luo, J. Am. Chem. Soc., 2024, 146, 8298–8307 CrossRef CAS.
- M. Ye, T. Li, Q. Sun, Z. Liu, B. Peng, C. Huang, P. Lin, S. Ke, X. Zeng, X. Peng, L. Chen and H. Huang, J. Mater. Chem. C, 2016, 4, 3375–3378 Search PubMed.
- M. Krupska-Klimczak, I. Jankowska-Sumara and S. Sowa, Ceram. Int., 2023, 49, 36807–36815 CrossRef CAS.
- F. Zhuo, Q. Li, Q. Yan, Y. Zhang, H. H. Wu, X. Xi, X. Chu and W. Cao, J. Appl. Phys., 2017, 122, 154101 Search PubMed.
- C. Yang, C. Feng, P. Lv, J. Qian, Y. Han, X. Lin, S. Huang, X. Cheng and Z. Cheng, Nano Energy, 2021, 88, 106222 CrossRef CAS.
- X. Chen, S. Li, X. Jian, Y. Hambal, S. G. Lu, V. V. Shvartsman, D. C. Lupascu and Q. M. Zhang, Appl. Phys. Lett., 2021, 118, 122904 CrossRef CAS.
- R. Kumar, A. Kumar and S. Singh, Sustain. Energy Fuels, 2018, 2, 2698–2704 RSC.
- Y. Bai, G. P. Zheng and S. Q. Shi, Mater. Res. Bull., 2011, 46, 1866–1869 CrossRef CAS.
- E. Defay, S. Crossley, S. Kar-Narayan, X. Moya and N. D. Mathur, Adv. Mater., 2013, 25, 3337–3342 CrossRef CAS.
- S. G. Lu, B. Rožič, Q. M. Zhang, Z. Kutnjak, X. Li, E. Furman, L. J. Gorny, M. Lin, B. Malič, M. Kosec, R. Blinc and R. Pirc, Appl. Phys. Lett., 2010, 97, 162904 CrossRef.
- B. Peng, Q. Zhang, B. Gang, G. J. T. Leighton, C. Shaw, S. J. Milne, B. Zou, W. Sun, H. Huang and Z. Wang, Energy Environ. Sci., 2019, 12, 1708–1717 RSC.
- G. Vats, A. Kumar, N. Ortega, C. R. Bowen and R. S. Katiyar, Energy Environ. Sci., 2016, 9, 1335–1345 RSC.
- J. Chen, Z. Tang, Q. Lu and S. Zhao, J. Alloys Compd., 2018, 756, 62–67 CrossRef CAS.
- T. M. Correia, J. S. Young, R. W. Whatmore, J. F. Scott, N. D. Mathur and Q. Zhang, Appl. Phys. Lett., 2009, 95, 182904 CrossRef.
- T. Zhang, W. Li, W. Cao, Y. Hou, Y. Yu and W. Fei, Appl. Phys. Lett., 2016, 108, 162902 CrossRef.
- A. S. Mischenko, Q. Zhang, R. W. Whatmore, J. F. Scott and N. D. Mathur, Appl. Phys. Lett., 2006, 89, 242912 CrossRef.
- D. Saranya, R. Chaudhuri, J. Parui and S. B. Krupanidhi, Bull. Mater. Sci., 2009, 32, 259–262 CrossRef CAS.
- C. Yang, Y. Han, C. Feng, X. Lin, S. Huang, X. Cheng and Z. Cheng, ACS Appl. Mater. Interfaces, 2020, 12, 6082–6089 CrossRef CAS PubMed.
- G. Vats, A. Kumar, N. Ortega, C. R. Bowen and R. S. Katiyar, Energy Environ. Sci., 2016, 9, 1335–1345 RSC.
- G. Vats, R. Vaish and C. R. Bowen, J. Appl. Phys., 2014, 115, 013505 CrossRef.
- I. M. McKinley, R. Kandilian and L. Pilon, Smart Mater. Struct., 2012, 21, 035015 CrossRef.
- R. B. Olsen, D. A. Bruno and J. M. Briscoe, J. Appl. Phys., 1985, 58, 4709–4716 Search PubMed.
- X. Wang, X. Hao, Q. Zhang, S. An and X. Chou, J. Mater. Sci.: Mater. Electron., 2017, 28, 1438–1448 CrossRef CAS.
- G. Vats, H. S. Kushwaha, R. Vaish, N. A. Madhar, M. Shahabuddin, J. M. Parakkandy and K. M. Batoo, J. Adv. Dielectr., 2014, 04, 1450029 CrossRef CAS.
- S. Pandya, J. Wilbur, J. Kim, R. Gao, A. Dasgupta, C. Dames and L. W. Martin, Nat. Mater., 2018, 17, 432–438 CrossRef CAS PubMed.
- A. P. Sharma, M. K. Behera, D. K. Pradhan, S. K. Pradhan, C. E. Bonner and M. Bahoura, Sci. Rep., 2021, 11, 111 CrossRef CAS PubMed.
Footnote |
| † Charanjeet Singh and Priya Choudhary contributed equally to this work. |
|
| This journal is © The Royal Society of Chemistry 2026 |
Click here to see how this site uses Cookies. View our privacy policy here. 
 Open Access Article
 This Open Access Article is licensed under a Creative Commons Attribution-Non Commercial 3.0 Unported Licence
 ab,
Priya Choudhary†ab,
M. Asifab and
Ashok Kumar
ab,
Priya Choudhary†ab,
M. Asifab and
Ashok Kumar


 represents the vacuum capacitance of the measurement cell with an air gap equal to the sample thickness, where ε0 = 8.854 × 10⁻¹² F m−1 is the permittivity of free space, A is the electrode area, d is the sample thickness, and ω denotes the angular frequency.


