DOI:
10.1039/D5RA07838E
(Paper)
RSC Adv., 2026,
16, 3648-3661
Experimental and theoretical exploration of bismuth oxyhalide (BiOX, X = Cl, Br, I) nanoparticles in thermoelectric, optoelectronic, and photocatalytic applications
Received
13th October 2025
, Accepted 9th January 2026
First published on 16th January 2026
Abstract
Here, we performed first-principles density functional theory (DFT) modeling coupled with the Boltzmann transport equation to explore hydrothermally synthesized bismuth oxyhalides (BiOX, X = Cl, Br, I) nanoparticles. The correlation between BiOX crystallographic and elastic properties was established from the equation of state and elastic tensor simulations. The phonon calculations inferred the dynamical stability and infrared activity of BiOX. The Raman absorptions were reproduced in Raman tensor simulations. The field emission scanning electron microscopy revealed average particle sizes of 154, 221, and 71 nm for BiOCl, BiOBr, and BiOI, respectively. The elemental identification and chemical state analysis were performed with energy-dispersive X-ray spectroscopy and X-ray photoelectron spectroscopy. The diffuse reflectance-derived indirect electronic band gaps of BiOCl (3.54 eV), BiOBr (2.83 eV), and BiOI (1.85 eV) were modeled from the hybrid Heyd–Scuseria–Ernzerhof screened and tuned approach with long-range van der Waals interaction and relativistic spin–orbit coupling. The effective mass analysis revealed that holes in BiOCl and BiOBr are heavier than electrons, whereas the opposite holds in BiOI. High degree of anisotropy was revealed in lattice thermal transport in BiOX. The thermoelectric figure of merit ZT turned out to be 0.51, 0.76, and 1.49 near 990 K in BiOCl, BiOBr, and BiOI, respectively, indicating them as promising thermoelectric materials. The photoluminescence emissions of BiOCl, BiOBr, and BiOI were detected in the opto-electronically favorable visible ranges of 366–521, 335–658, and 393–658 nm, respectively. The theoretical electronic band alignment analysis of BiOX facilitated the straddling of the relevant redox potentials, supporting the photocatalytic degradation of rhodamine B dye. In essence, this work provides comprehensive information on functional properties of BiOX nanoparticles relevant in thermoelectric, optoelectronic, and photocatalytic applications with a combined DFT-experimental approach.
1 Introduction
Energy materials define a critical frontier in the pursuit of a sustainable climate through thermoelectric, photovoltaic, photocatalytic, and photoelectrochemical processes.1–6 The waste heat in the global energy production system can be staggeringly high as 65%.7,8 The eco-friendly waste heat recycling to electricity through thermoelectric means opened up a new arena of sustainable energy generation.9–11 Efficient optoelectronic devices through photoluminescence emission in the visible range offered tremendous promise in curbing the 20% of global energy consumed in lighting.12 Photocatalytic water purification presents a way of combating freshwater scarcity, which is one of the pressing challenges to life sustainability on Earth.13,14
The bismuth oxyhalides (BiOX, X = Cl, Br, and I) have emerged as promising ternary group V–VI–VII p-type materials for green energy harvesting.15–23 The tetragonal phase pure BiOX has been stabilized in many different synthesis routes with diverse morphologies like microflower, microsphere, nano-sized rod, disc, flakes, and sheets.17,24–28 Due to the benign and stable nature, crystallographic anisotropy, van der Waals (vdW) force-coupled layered structure, internal electric field, and superior optoelectronic behavior, BiOX has tremendous potential for use in thermoelectric, nitrogen fixation, optoelectronic, ultraviolet detection, pollutant degradation, solar water splitting, and purification applications.29–31
The functionalities of BiOX materials in various applications have been probed from density functional theory (DFT) as well as experimental investigations. Huang et al. explored the electronic structure of BiOX using Local-Density Approximation (LDA) and Generalized Gradient Approximation of Perdew–Burke–Ernzerhof (GGA-PBE) exchange–correlation functional (XCF).32 The optoelectronic properties of BiOX were reported using ad hoc Hubbard interaction U corrected DFT + U XCF.33,34 Wakjira et al. presented DFT simulations for phonon vibration, infrared (IR) and Raman absorption, and optical properties of BiOX at the GGA-PBE.35 The electronic structure was modeled with the hybrid Heyd–Scuseria–Ernzerhof (HSE06) screened approach without taking into account the long-range vdW and relativistic spin–orbit coupling (SOC) of the heavy Bi atom. Ouhbi et al. used hybrid PBE0(α) with vdW to calculate the polaronic charge localization effects in BiOX.36 Modeling the SOC is essential to optimize practical BiOX energy-harvesting devices.37 Ganose et al. highlighted the importance of the relativistic SOC effect of Bi and its implications on the electronic structure of BiOX.38 Sing et al. explored the impact of SOC on the electronic band structure (BS) and density of states (DOS) of BiOI without considering the vdW interaction.39 Bhachu et al. performed experiments and probed only the electronic structure of BiOX at HSE06 + vdW + SOC level.27
Several studies focusing on the potential of BiOX in thermoelectric applications have been reported. The accurate modeling of the thermoelectric figure of merit ZT = S2σT/(κh + κl) requires reliable estimates for p-type carrier transport parameters: conductivity (σ), Seebeck coefficient (S), electronic (κh) and lattice (κl) contributions to thermal conductivity. Gibson et al. reported the experimentally measured in-plane thermal conductivity of BiOCl to be 1.5 W m−1 K−1.40 Gan et al. considered a monolayer BiOCl and estimated the theoretical thermal conductivity of 3 W m−1 K−1 and a ZT value of 1.8 at room temperature at the GGA-PBE level.41 Yu et al. found the thermal conductivity and ZT of monolayer BiOBr to be 1.87 W m−1 K−1 and 1.84, respectively, using HSE06 without considering vdW and SOC effects.42 Singh et al. incorporated HSE06 + vdW without SOC to predict a ZT value as high as 3.52 for bulk BiOBr.39 Sajjad et al. calculated thermal conductivities for BiOI using HSE06 + vdW without considering SOC. They reported 1.35 (bulk) and 1.44 (monolayer) W m−1 K−1, corresponding to ZT values of 1.51 and 1.61, respectively.43 All these calculations assume constant relaxation time (CRT) approximations during solving the Boltzmann transport equations. Very recently, Latthiwan et al. demonstrated that the importance of polar optical phonon (POP), acoustic deformation potential (ADP), and ionized impurity (IMP) scattering mechanisms are essential for accurately modeling carrier transport in BiOX.21 In addition, Marks et al. revisited the catalytic properties of BiOX using very sophisticated experimentation with DFT simulations, emphasizing the importance of a combined simulation-experimental approach for probing BiOX functional behavior.44
The synergistic combination of DFT-experiment can provide a useful platform to elucidate physical properties of BiOX, from crystallographic structure and vibrational spectra (Raman and IR) to its photocatalytic dye degradation mechanism. The existing HSE06 + vdW + SOC calculations are primarily focused on the electronic structure of BiOX. The optical absorptions of BiOX from diffuse reflectance measurements were rarely modeled using hybrid functional in the presence of vdW and SOC effects in an integrated experiment-DFT framework. In addition, the ZT calculation form detailed carrier transport of BiOX, considering combined POP, ADP, and IMP scattering at the Hartree–Fock exact-exchange αHF tuned PBE-HFαHF% + vdW + SOC level, is hard to find in the existing literature.
Here, we present a comprehensive DFT-experimental exploration of the functional behavior of BiOX nanoparticles. The tetragonal P4/nmm BiOX nanoparticles were synthesized by low-temperature, energy-friendly synthesis methods. The phase purity, surface morphology, elemental purity, and chemical state identifications of the as-synthesized BiOX samples were facilitated by Rietveld refinement of X-ray diffraction (XRD) data, field emission scanning electron microscopy, energy dispersive X-ray spectroscopy, and X-ray photoelectron spectroscopy, respectively. By comparing the equation of state (EoS) and elastic tensor analysis, the relevant crystallographic–elastic correlations were probed at ambient pressure. The room temperature Raman peaks of BiOX were identified from Raman tensor simulations. The harmonic phonon BS confirmed the dynamical stability of BiOX at T = 0 K, whereas the phonon DOS peaks modeled their experimental IR absorptions. The lattice thermal transport of BiOX was simulated by a finite difference supercell method. The PBE-HFαHF% + vdW + SOC XCF was implemented for modeling (i) the experimental indirect electronic band gap, (ii) diffuse reflectance spectroscopic optical absorption, and (iii) photogenerated charge carrier effective mass of BiOX. The thermoelectric figure of merit ZT was estimated from dense PBEαHF% + vdW + SOC derived DOS in terms of relevant transport parameters σ, S, κh, and κl, considering combined POP, ADP, and IMP scattering mechanisms. The multiple photoluminescence peaks of BiOX were detected in the visible range of 366–658 nm. The BiOX photocatalytic degradation of RhB was modeled with the electronic band edge relative to the relevant redox potential. In summary, a combined DFT-experimental approach was taken to reveal the potential functional behavior of BiOX nanoparticles relevant to thermoelectric, optoelectronic, and photocatalytic applications.
2 Results and discussion
2.1 Crystallographic and equation of state analysis
Fig. 1a presents powder XRD (PXRD) data of BiOX (X = Cl, Br, and I) in arbitrary units (au) with Rietveld refined fitting. Phase purity analysis confirmed the tetragonal (space group P4/nmm and point group C74h) structure in all as-synthesized BiOX samples. The refined experimental crystallographic parameters (Fig. S1), along with those of the DFT relaxed structures, were recorded in Tables S1–S3 of SI. The Bragg's planes of tetragonal phase in BiOCl were indexed by JCPDS#06-0249, a = b = 3.8701(3) Å, and c = 7.4349(1) Å with the Rietveld factors Rwp = 5.78%, Rexp = 3.79%, and goodness of fitting χ2 = 2.33. The diffraction planes of BiOBr correspond to JCPDS#03-0733 with a = b = 3.9183(1) Å, c = 8.0898(1) Å, Rwp = 5.65%, Rexp = 3.97%, and χ2 = 2.12. The Bragg's planes in BiOI follow the JCPDS#100445 with crystallographic parameters a = b = 3.9942(3) Å, c = 9.1570(3) Å, Rwp = 9.28%, Rexp = 5.25%, and χ2 = 3.12.
 |
| | Fig. 1 (a) PXRD of BiOX with Rietveld refinement, (b) energy E versus volume V curve of BiOCl, (c) Room temperature Raman spectra, and (d) FTIR spectra of BiOX. | |
The LDA overbinds the atoms (bond length contraction) due to self-interaction error, leading to an underestimation of unit cell volume by 4.45, 4.36, and 8.65% for BiOCl, BiOBr, and BiOI, respectively, relative to that of the experimental crystallographic parameters. Contrarily, GGA-PBE underbinds atoms (bond length expansion), resulting in an overestimation of 9.49 (BiOCl), 14.68 (BiOBr), and 14.68% (BiOI).45,46 While the GGA-PBEsol and vdW corrected GGA-PBE + vdW reduced volume estimation errors, distinct binding effects persisted: the GGA-PBEsol + vdW exhibited atomic overbinding, whereas DFT + Ud + Up displayed underbinding. These volume estimation issues of different XCFs were explicit in energy (E) versus volume (V) curves in Fig. 1b (Fig. S2). The third-order Birch–Murnaghan EoS was used in E–V curve to estimate volume at minimum energy (V0), bulk modulus (B0), and its first pressure derivative  to correlate the structural and elastic properties (Tables S1–S3). The vdW interaction mediates attractive interatomic forces, which reduces the V0. Consequently, this increases the B0, reflecting a corresponding decrease in compressibility.
2.2 Elastic tensor simulation
The elastic properties (EP) were calculated to analyze the mechanical stability of BiOX. The EP are encoded in the stiffness tensor Cij, which was calculated by applying directional perturbative forces to the supercell and observing the response. For the tetragonal (P4/nmm, C74h) BiOX, Cij possesses 6 non-zero elastic constants: C11, C12, C13, C33, C44, and C66. From the Cij and stiffness eigenvalues λi, important elastic properties like bulk-modulus (B), shear modulus (G), Young's modulus (E), Poisson's ratio (ν), and Pugh's ratio (kPugh) were calculated using Voigt (V), Reuss (R), and Hill (H) averaging scheme for different XCFs (Tables S4–S6). It is evident that the Born stability criteria for tetragonal (P4/nmm) BiOX| |
C11 > ![[thin space (1/6-em)]](https://www.rsc.org/images/entities/char_2009.gif) |C12|, C44 > 0, C66 > 0, 2C132 < C33(C11 + C12) |C12|, C44 > 0, C66 > 0, 2C132 < C33(C11 + C12)
| (1) |
were fulfilled, corroborating the BiOX mechanical stability.47,48 All 6 eigenvalues λi (i = 1, …, 6) of Cij tensor were evaluated to be positive at ambient pressure. Due to inherent overbinding nature, the LDA and GGA-PBEsol + vdW inflated the B, E, and G values. The B of BiOI (18.7–68.4 GPa) is lower than that of BiOCl (20.9–76.8 GPa) and comparable to BiOBr (19.2–57.5 GPa), indicating a reduction in incompressibility from Cl to I. The ranges of G for BiOCl (18.9–37.8 GPa), BiOBr (7.4–33.7 GPa), and BiOI (18.7–68.4 GPa) indicate that shear deformation is moderately favored over volume contraction. The values of E for 45.5–97.3 GPa (BiOCl), 30.4–84.5 GPa (BiOBr), and 46.8–177.2 (BiOI) revealed considerable stiffness under longitudinal tensile and compressive loading. This observation is further supported by the fact that both B and G were smaller than E across all BiOX.49 Moreover, the relation B > G in all BiOX implies a preference for shear deformation over volume contraction, rendering a vulnerability to non-hydrostatic stress. For all BiOX samples, the Poisson's ratio stayed below 0.33. A ductile nature was evident in BiOCl and BiOI with Pugh's ratio kPugh exceeding the brittle/ductile threshold value of 1.75. In contrast, the BiOBr displayed brittleness as kPugh < 1.75.
2.3 Raman analysis
The irreducible representation of C74h group with tetragonal (P4/nmm) symmetry of BiOX dictates ΓTetraRaman = 2A1g + B1g + 3Eg vibrational modes to be Raman active.50 The room temperature Raman spectra of BiOX are shown in Fig. 1(c). The Raman mode assignments of as-synthesized BiOX with the corresponding DFT simulations were displayed in Tables S7–S9, respectively. The Raman bands near 123(2), 147(2), and 198(2) cm−1 of BiOCl arose from the internal symmetric stretching mode (ISSM) of Bi–Cl having two A1g and one Eg symmetries, respectively. The Raman peak at 300(2) cm−1 corresponds to the B1g antisymmetric vibration mode (AVM) of the Bi–O bond. The symmetric stretching modes (SMM) of Bi–O with Eg symmetry are detected at 496 and 527 cm−1. In BiOBr, the ISSM Raman modes of Bi–Br appeared at 112 (A1g), 116(2) (A1g), 162(2) (Eg), and 181(2) (Eg) cm−1. The AVM mode of Bi–O with B1g symmetry was detected near 385 cm−1. For BiOI, six distinct Raman bands were detected. The bands near 67(2), 85(2), and 98(2) cm−1 were attributed to ISSM mode of Bi–I with A1g symmetry.26 The peak near 148(2) cm−1 can be assigned to Eg symmetry due to ISSM of Bi–I bond. Two weak bands near 591(2) and 1019(2) cm−1 were ascribed to antisymmetric (B1g) and symmetric (A1g) vibrations of Bi–O bonds. The calculated Raman peak positions at LDA, GGA-PBE, and GGA-PBEsol levels closely resemble the experimental observations, corroborating the reliability of our DFT simulations. Minor discrepancies between experimental and simulated peaks arise as a consequence of employing different XCFs with bond length variations in the DFT-relaxed structures.
2.4 Infrared activity, stability, and thermal transport
The FTIR spectra of BiOX (X = Cl, Br, I) in Fig. 1(d) capture the vibrational phonon in the range of 350–4000 cm−1. The detailed IR mode assignments with corresponding atomic bond vibrations in BiOCl, BiOBr, and BiOI were displayed in Tables S10–S12, respectively. Four distinct bands were present in IR absorption for all three BiOX samples. The IR bands in the 350–1000 cm−1 range can be attributed to Bi–O stretching in [Bi2O2]2+ slab of BiOX crystal.51 Those appearing between 350–1000 cm−1 are ascribed to Bi–X stretching bands.24,52 The bending and stretching vibrations of O–H bonds in surface-adsorbed H2O appeared at 1620 cm−1 and in the 3400–3550 cm−1 region, respectively. The additional IR bands near 1720 cm−1 are attributed to the C![[double bond, length as m-dash]](https://www.rsc.org/images/entities/char_e001.gif) O stretching vibration of atmospheric CO2 adsorbed onto the BiOX sample.
O stretching vibration of atmospheric CO2 adsorbed onto the BiOX sample.
To model the IR absorptions in BiOX, at first, the density functional perturbation theory (DFPT) derived phonon BS and DOS at the GGA-PBE level (Fig. S4) were used. Mode softening of Bi atoms in [Bi2O2]2+ layers leads to negative phonon energies along multiple symmetry points in the Brillouin zone (BZ), indicating a spurious dynamical instability of BiOX at T = 0 K. The mode hardening achieved by 4 × 4 × 4 supercell finite-difference technique eliminated negative energy modes for different XCFs (Fig. S5–S7). As demonstrated in Fig. 2a (Fig. S8), the resulting phonon spectra exhibited no imaginary modes at T = 0, confirming the dynamical stability of the BiOX with the tuned DFT + Up + Ud XCF. Furthermore, the simulated phonon DOS peaks for BiOX obtained for different XCFs closely matched the experimental IR absorption. The vibrations of heavy Bi and X atoms with moderate masses provide dominant contributions in the 0–200 cm−1 range, while the light O atomic motion appeared near 300–500 cm−1. The Born charge of BiOCl (Bi: +5.7, O: −2.8, Cl: −1.8), BiOBr (Bi: +4.5, O: −2.8, Br: −1.7) and BiOI (Bi: +5.1, O: −3.3, I: −1.8) displayed in Tables S13–S15 deviated from the close shell values of Bi (+3), O (−2), and X (−1), stipulating delocalized charge due to the covalent nature of electronic bonds in BiOX.
 |
| | Fig. 2 (a) Phonon BS along A, M, Γ, R, X, and Z and DOS and (b) temperature-dependent lattice thermal conductivity κl of BiOCl with finite difference technique based on 4 × 4 × 4 supercell at DFT + Ud + Up level. | |
Now from Fig. 2b (Fig. S9), the distinct direction-dependent nature of the lattice thermal conductivities (κl) is evident. The inverse proportionality of lattice thermal conductivity with temperature (κl ∝ 1/T) is characteristic of anharmonic phonon–phonon interactions. The κl is high and isotropic within the xy-plane but exhibits significantly lower values along the z-direction, highly desirable for thermoelectric applications. The lattice vibrations along the z direction are suppressed due to weak vdW coupling between adjacent layers. Notably, the κl of 0.35 (BiOCl), 0.21 (BiOBr), and 0.23 W m−1 K−1 (BiOI) along z directions at 600 K are quite low and comparable to that of the best known p-type thermoelectric materials like SnSe (0.2 W m−1 K−1 at 913 K), BiSbTe (0.47 W m−1 K−1 at 400 K), GeTe alloy (0.2 W m−1 K−1 at 825 K), Cu2Se alloy (0.27 W m−1 K−1 at 300 K), and MgAgSb alloy (0.7 W m−1 K−1 at 300 K).53–58
2.5 Morphology, EDX, and chemical state analysis
The surface morphology of BiOX varies significantly with the choice of halide atoms. The decreasing electronegativity and increasing ionic radius and polarizability from Cl to I alter the interlayer bonding and nucleation kinetics. In BiOCl (Fig. 3a), the strong Bi–Cl bonding and high electronegativity promote rapid nucleation, resulting in particle agglomeration with an average size of 157 nm in the presence of high surface energy available in hydrothermal synthesis. The weaker bonding in BiOBr increases the polarizability, facilitating facet-dependent surface energy, producing microplates (Fig. 3b) with an average thickness of 221 nm. The presence of strong polarizability in BiOI promotes facet-selective growth and formation of microspheres with an average diameter of 5.2 µm. The interconnected nanosheets with an average thickness of 71 nm (Fig. 3c) formed the microspheres. The EDX spectra of the BiOX (Fig. S10a–c) exhibited the characteristic peaks of the constituent elements, confirming their purity. The XPS survey spectrum in Fig. 4a–c validated the presence of Bi, O, and X (Cl, Br, I) atoms in the corresponding BiOX samples, respectively. In all BiOX samples (Fig. 4d–f), the 5.3 eV SOC splitting of Bi 4f7/2 and Bi 4f5/2 corroborated the Bi3+ oxidation state. The intense XPS line near ∼530.1 eV (Fig. 4g–i) corresponds to O 1s of lattice O2− in BiOX. The weak satellite XPS lines adjacent to 531.5 and 533.3 eV can be ascribed to lattice O2− present in adsorbed H2O and CO2 in respective BiOX samples. The bimodal XPS lines at 198.2 and 199.8 eV (Fig. 4j) represent 1.6 eV SOC splitting of Cl 2p core level of Cl− in BiOCl. The Br 3d5/2 and Br 3d3/2 of Br− (Fig. 4k) have undergone 1 eV SOC splitting in BiOBr. In case of BiOI (Fig. 4l), the I− oxidation state introduced 11.5 eV SOC splitting between bimodal peaks of I 3d5/2 and I 3d3/2.
 |
| | Fig. 3 FESEM micrographs of (a) BiOCl, (b) BiOBr, and (c) BiOI along with superimposed size histograms. | |
 |
| | Fig. 4 XPS survey spectra of (a) BiOCl, (b) BiOBr, (c) BiOI, XPS core level spectra of Bi 4f in (d) BiOCl, (e) BiOBr, (f) BiOI, XPS core level spectra of O 1s in (g) BiOCl, (h) BiOBr, (i) BiOI, (j) Cl 2p in BiOCl, (k) Br 3d in BiOBr, and (l) I 3d in BiOI. | |
2.6 Optical properties analysis
Optical properties that define the electronic transitions in a material due to photon absorption or emission were modeled by angular frequency ω dependent complex dielectric constant ε(ω) = εreal(ω) + iεimag(ω).59–61 The imaginary εimag(ω) was derived from the dielectric tensor. The causal nature of ε(ω) allows the real part εreal(ω) to be obtained from εimag(ω) with Kramers–Kronig relations.62–66 The optical excitation-mediated polarizability of material is encoded in the real part εreal(ω). The 3 orthogonal polarization averaged εreal(ω) of BiOX (X = Cl, Br, I) were displayed in Fig. 5a (Fig. S11), respectively. Depending on the XCFs, the εreal in the static ω → 0 limit varies over 4.42–6.97 eV (BiOCl), 4.69–7.83 eV (BiOBr), and 6.19–12.61 eV (BiOI). The εreal(0) is defined by the Penn's relation εreal(0) = 1 + (ℏωp2/Eg)2, where ωp stands for electron plasma frequency and Eg represents electronic band gap.67 The εreal(ω) increases with incident photon energy from ω ≈ 0 to its first peak, favoring the electronic polarizability over the ionic one.68 The εreal attained negative values over certain photon energies, originating from total internal reflection of the optical excitation and quasi-metallic behavior due to interband transitions. The dominant first peak position of εreal(ω) in energy varies with XCFs, indicating a change in resonant interband electronic transition energy. The PBE-HFαHF% + vdW + SOC produced the εreal(ω) peaks at 4.70 (BiOCl), 4.89 eV (BiOBr), and 3.6 eV (BiOI), respectively. Fig. 5b (Fig. S12) presents the imaginary part εimag for several XCFs that encodes optical absorption in the material, causing electronic transition. Up to an energy threshold Et, εimag stayed at zero, indicating insufficient energy in the optical field to cause carrier excitation from valence band (VB) to conduction band (CB). Beyond Et, εimag increases steeply due to the optical transition of charge carriers from VB to CB. The Et resembles the electronic band gap Eg and varies over different XCFs. The estimated Et from PBE-HFαHF% + vdW + SOC of 3.51 (BiOCl), 2.81 (BiOBr), and 1.79 eV (BiOI) have close agreement with the corresponding band gaps, corroborating the consistency of the optical properties simulation. The Lorentzian peaks of εimag at different photon energies represent optically induced resonant electronic transitions occurring in BiOX.
 |
| | Fig. 5 Simulated (a) real part εreal, (b) imaginary part εimag of the dielectric constant, and experimental and simulated (c) optical absorption and (d) Tauc plots of BiOCl for different XCFs. | |
Fig. 5c (Fig. S13) display the experimental and simulated optical absorption of BiOX (X = Cl, Br, I), respectively. The Kubelka–Munk function F(R∞) function was used to obtain experimental optical absorption from DRS measurements. The εreal and εimag yield the optical absorbance through 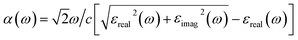 . The experimental absorption range varies over BiOCl (∼200 nm), BiOBr (∼230 nm), and BiOI (300 nm). The widths of the absorption edges were in 200–360, 230–450, and 300–700 nm ranges for BiOCl, BiOBr, and BiOI, respectively. The simulated absorption edges change positions in wavelength for different XCFs. The PBE-HFαHF% + vdW + SOC XCF yields absorption spectra in best agreement with experiment when αHF is tuned to 30% for BiOCl, 22% for BiOBr, and 21% for BiOI. The band gap Eg can be estimated from Tauc's process with the following relation
| | |
[F(R∞)hν]1/γ = A(hν − Eg),
| (2) |
where
h and
ν represent Planck's constant and photon frequency, respectively, and
γ (1/2 or 2) defines the direct/indirect nature of the band gap.
Fig. 5d (Fig. S14) present both experimental and simulated indirect Tauc plots (
γ = 2) of BiOX. The
Eg can be directly determined from the energy axis intercept from the steepest edges of the Tauc plot. The experimental
Eg of 3.54, 2.83, and 1.85 eV were estimated for BiOCl, BiOBr, and BiOI, respectively. In the presence of vdW and SOC, the HSE06 + vdW + SOC produced underestimated 3.36 eV (BiOCl) and overestimated 2.98 (BiOBr) and 1.95 (BiOI) eV. The tuned hybrid PBE-HF
αHF% + vdW + SOC produced
Eg of 3.56 (BiOCl), 2.86 (BiOBr), and 1.82 (BiOI) eV, which are in remarkable agreement with that of the experimental observations.
2.7 Electronic properties analysis
The E–k band dispersions along different crystal symmetries in the electronic BS characterize the nature, i.e., direct or indirect, and the magnitude of the band gap Eg. The electronic BS was calculated along high symmetry A, Γ, M, R, X, and Z points in BZ of BiOX for several XCFs with various computational complexities, see Fig. S18–S20. The estimated Eg from LDA, GGA-PBE, GGA-PBE + vdW, GGA-PBEsol, and GGA-PBEsol + vdW XCFs consistently underestimated the experimental values of BiOCl (3.54 eV), BiOBr (2.83 eV), and BiOI (1.85 eV). The empirically tuned Hubbard parameters Up and Ud enabled the DFT + Ud + Up to achieve Eg of 3.53 (BiOCl), 2.85 (BiOBr), and 1.83 (BiOI) eV (Fig. S21). The HSE06 + vdW + SOC (Fig. S22–S24) yields Eg underestimation for BiOCl (3.36 eV) and overestimations for BiOBr (2.98 eV) and BiOI (1.95 eV). Tuning the αHF to 30, 22, and 21% in PBE-HFαHF% + vdW + SOC (Fig. 6a–c) yields Eg of 3.56 (BiOCl), 2.86 (BiOBr), and 1.82 (BiOI) eV, in excellent agreement with the experiment by the distinct k point locations of the valence band maximum (VBM) (Z) and conduction band minimum (CBM) (Z → R). The orbital compositions of electronic DOS are displayed as total density of states and its projections onto Bi, O, and X (Cl, Br, I) atomic orbitals in Fig. 7. The states near the VBM originate from hybridization of Bi 6s, O 2p, and X np orbitals. The CMB states consist of SOC split-off Bi 6p orbitals. The orbital compositions in DOS were identical for all XCFs, apart from the Eg (Fig. S25–S31). The DOS-derived Eg values are systematically 0.25 eV lower than those from the BS across all XCFs.
 |
| | Fig. 6 Electronic BS along high symmetry A, Γ, M, R, X, and Z points in BZ for (a) BiOCl (αHF = 30%), (b) BiOBr (αHF = 22%), and (c) BiOI (αHF = 21%) with PBE-HFαHF% + vdW + SOC XCF. | |
 |
| | Fig. 7 Density of states (total and projected) of relevant atomic orbitals of Bi, O, and X atoms of (a) BiOCl (αHF = 30%), (b) BiOBr (αHF = 22%), and (c) BiOI (αHF = 21%) with PBE-HFαHF% + vdW + SOC XCF. | |
2.8 Effective mass analysis
The effective masses of electron and hole were evaluated from E–k band dispersion. The parabolic fitting near the band extrema provided the  ,
,  , and
, and  along different spatial directions x, y, and z (Table S18). The carrier effective masses are found to be anisotropic among in-plane and out-of-the-plane directions in BiOX. The BiOX have identical in-plane effective mass components (
 and
and  ), while their out-of-plane components
  are distinct. Notably, the out-of-the-plane
  is larger than both
  and
and  . In the presence of long-range vdW interaction and SOC, the PBE-HFαHF% + vdW + SOC produced the average values of the effective masses 0.53m0 (BiOCl), 3.05m0 (BiOBr), and 1.99m0 (BiOI) for electrons and 1.53m0 (BiOCl), 3.26m0 (BiOBr), and 1.67m0 (BiOI) for holes. This implies the holes in BiOCl and BiOBr are heavier than electrons, indicating more localization near VBM than CBM, whereas the opposite holds in BiOI. The strong hybridization of Bi 6s, O 2p, and X np orbitals near VBM is responsible for the localization. The larger effective mass of the electron in BiOI arises from band flattening near the CBM, effectively reducing the band dispersion of the SOC split-off Bi 6p level.
2.9 Electronic scattering rates analysis
The temperature and carrier concentration dependent scattering rates of BiOX, averaged over k-points and energy derivatives of the Fermi–Dirac functions, were evaluated from the Boltzmann transport equation. The weak temperature dependence of IMP, ADP, and POP scattering exhibits similar trends across all three BiOX (Fig. 8a and S32). The ADP and POP are dominant scattering mechanisms, whereas the IMP scattering has a negligible effect on the total scattering rates. The dependence of scattering rates on carrier concentration exhibits different behavior. The carrier concentration dependence of IMP, ADP, and POP in all BiOX samples displays a similar pattern (Fig. 8b and S33). Although IMP scattering sharply rises with carrier concentration, POP and IMP remain the dominant scattering mechanisms up to carrier concentrations as high as 1 × 1020 cm−3 at 300 K. The ADP scattering is independent of carrier concentrations, whereas POP scattering starts decreasing from a constant value beyond 1 × 1018 cm−3 carrier concentration due to increased electronic screening.
 |
| | Fig. 8 Average (a) temperature-dependent (b) carrier concentration-dependent scattering rates, (c) Seebeck coefficient (S), and (d) electronic contribution to thermal conductivity (κh) as a function of temperature of BiOCl for different carrier concentrations. Scattering rates are averaged over k-points in BZ and Fermi–Dirac distribution derivatives. The S and κh were averaged over spatial directions. | |
2.10 Electronic transport analysis
The temperature dependence of p-type conductivity (σ), mobility (µ), Seebeck coefficient (S), power factor S2σ, and electronic contribution to thermal conductivity (κh) at different carrier concentrations were calculated to analyze the electronic transport in BiOX. Both CRT (BoltzTraP code) and combined ADP, IMP, and POP scattering mechanisms (AMSET code) were considered separately. The observed difference among the σ (Fig. S34) obtained from BoltzTraP and AMSET diminishes with temperature. The estimated σ of BiOCl (487 S cm−1), BiOBr (245 S cm−1), and BiOI (1015 S cm−1) have corresponding µ values of 2.91 cm2 V−1 s−1, 1.55 cm2 V−1 s−1, and 6.20 cm2 V−1 s−1 at 300 K for 1 × 1018 cm−3 p-type carrier concentrations, respectively. The S of all BiOX resulting from BoltzTraP (CRT of 1 × 10¹⁵ s−1) and AMSET were in good agreement with each other (Fig. 8c and S35). The S assumed values of 670 µV K−1 (BiOCl), 722 µV K−1 (BiOBr), and 634 µV K−1 (BiOI) for 1 × 1018 cm−3 at 300 K. The observed discrepancies in S2σ BoltzTraP and AMSET (Fig. S34) gradually decrease with temperature and assumed values of 2.16 × 10⁻⁵ W m−1 K−2 (BiOCl), 1.33 × 10⁻⁵ W m−1 K−2 (BiOBr), and 4.15 × 10⁻⁵ W m−1 K−2 (BiOI). The incremental trend of ADP, IMP, and POP scattering at elevated temperatures reduced the κh with increasing temperature (Fig. 8d and S36). For a fixed T = 300 K, the κh increases from 2.08 × 10⁻⁴, 1.07 × 10⁻⁴, and 4.16 × 10⁻⁴ W m−1 K−1 to 51.71 × 10⁻³, 22.80 × 10⁻³, and 84.48 × 10⁻³ W m−1 K−1 as carrier concentrations rise from 1 × 10¹⁸ to 1 × 1020 cm−3.
The 2D heatmap in Fig. 9a–c presents the simulated temperature and carrier concentration dependence of thermoelectric figure of merit ZT in the presence of combined ADP, IMP, and POP scattering processes. The inflated phonon scattering and carrier transport at high temperature improves the ZT with increasing temperature. The BiOCl, BiOBr, and BiOI exhibit the maximum out-of-plane ZT of roughly 0.51 (2.3 × 1021 cm−3), 0.76 (2.4 × 1021 cm−3), and 1.49 (2.2 × 1021 cm−3) at ∼990 K, respectively. These values are at par with the ZT values of well-known BiSbTe (1.4 at 375 K), Cu2Se (0.9 at 390 K), SrTiO3 (0.22 at 570 K), BaBi2O6 (0.19 at 600 K), and Bi2CrO6 (0.37 at 600 K); indicating BiOX as an attractive candidate for thermoelectric material.4,54,55,57,69,70 The high ZT value is due to low lattice thermal conductivity in the out-of-plane direction, originating from lower phonon group velocities and enhanced vibrational anharmonicity.71
 |
| | Fig. 9 2D heat map of ZT of triclinic (a) BiOCl, (b) BiOBr, and (c) BiOI as a function of temperature and carrier concentration. | |
2.11 Photoluminescence analysis
The steady-state photoluminescence (PL) emission spectra of BiOX (X = Cl, Br, I) excited at λex = 280 nm are presented in Fig. 10. The PL emission deconvolution in Fig. 10(a) suggests six distinct peaks were present in BiOCl centered at 366, 425, 470, 475, and 521 nm. The PL emission peaks of BiOBr in Fig. 10(b) were detected at 335, 393, 428, 468, 480, and 658 nm. In the case of BiOI, four PL emission peaks appeared at 393, 430, 471, and 658 nm. Some of these PL emissions occur due to the transitions from 6p to 6s energy levels of Bi3+.72 The possible 6s2 → 6s1p1 transitions are spin-forbidden 3p0,1,2 → 1s0 and spin-allowed 1p0 → 1s1.73,74 The PL emission at 366 (BiOCL) and 355 (BiOI) nm correspond to 3p1 → 1s0. The emission band near 393 cm−1 in BiOBr and BiOI originates from 3p0 → 1s0 transition. The PL band at ∼425 nm arises from 3p1 → 1s0 transition. The emission bands in the 470–480 nm range are ascribed to oxygen vacancies, a well-known defect-related emission in oxide materials.75 The observed emission near 503–521 nm and 658 nm can be attributed to defect states of BiOX, and Bi-based halide double perovskite materials.76,77
 |
| | Fig. 10 Steady-state PL emission of (a) BiOCl, (b) BiOBr, and (c) BiOI at room temperature. | |
2.12 Photocatalytic performance and band edge analysis
The UV-vis absorption measurements in Fig. 11 were used to evaluate the BiOX photocatalytic performance in degrading RhB dye. The chromophoric structural degradation of RhB was substantiated by the gradual decrease of its λmax peak at 554 nm.78 The BiOCl induced RhB degradation in dark conditions (Fig. 11a) due to the surface adsorption effect. The BiOCl degraded nearly 100% of RhB in 60 min of optical irradiation. The first-order reaction kinetics following ln(C0/C) = kt (inset), where C0 and C denote RhB concentration at initial and some specific time, yields a reaction rate of k = 0.116 min−1. The surface adsorption-induced degradations in dark conditions were nominal for both BiOBr (Fig. 11b) and BiOI (Fig. 11c). BiOBr degraded 80% of the RhB over 150 min (k = 0.01246 min−1), whereas BiOI achieved the same degradation over 240 min (k = 0.0066 min−1). The blueshift of λmax, most pronounced in BiOBr, indicates the selective photocatalytic oxidation of RhB to RhB-110.78–80
 |
| | Fig. 11 The UV-Vis absorption measurements of photocatalytic degradation of (a) BiOCl, (b) BiOBr, and (c) BiOI photocatalysts (1 g L−1) with 10 ppm RhB dye. | |
The band edge analysis helps to unveil the photocatalytic reaction mechanism. The optical energy hν promotes electrons (e−) to the CB, creating holes (h+) in the VB of BiOX. These photo-generated electron–hole pairs induce multiple redox reactions and produce reactive oxygen species, helpful in degrading the RhB dye. The energetic e− in CB creates H2O2 and hydroxyl (·OH) radicals by reducing dissolved O2. The h+ in VB reacts with H2O molecules adsorbed by BiOX surface. The oxidizing ·OH may degrade the BiOX as:
| |
 | (3) |
The VBM and CBM edge energies EVBM and ECBM concerning the normal hydrogen electrode (NHE) can be obtained from the following:
| |
 | (4) |
where free electron energy
Ee = 4.44 eV and
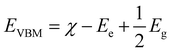
χ stands for Mullikan electronegativity of the BiOX photocatalyst. The
χ of BiOCl (6.43), BiOBr (6.24), and BiOI (6.01) were obtained from the geometric mean of the absolute electronegativities of Bi (4.25), O (7.54), Cl (8.29), Br (7.59), and I (6.76) (Table S19). The redox potentials of relevant photocatalytic reactions at different pH were displayed in Table S20. To illustrate the energetics of photocatalytic reactions,
EVBM and
ECBM band edge positions of BiOX (X= Cl, Br, I) along with O
2/H
2O
2 and H
2O/·OH reaction potentials were shown in
Fig. 12a–c, respectively. The band edges of BiOX straddled the relevant redox potentials, facilitating the RhB dye degrading photocatalytic reactions.
 |
| | Fig. 12 Conduction band ECBM and valence band EVBM band-edges alignment of (a) BiOCl, (b) BiOBr, and (c) BiOI compared to different redox potentials for photocatalytic reactions at pH = 10. | |
3 Conclusion
The Rietveld refined XRD parameters of P4/nmm phase-pure BiOX nanoparticles were benchmarked against the DFT-relaxed crystallographic data. The equation of state and elastic tensor simulations established the mechanical stability and crystallographic–elastic correlations of BiOX. The dynamical stability, infrared, and Raman activity of BiOX were inferred from phonon DOS, BS, and Raman tensor simulations, respectively. The energy-friendly synthesis yields the average nanoparticle dimensions of BiOCl, BiOBr, and BiOI to be 154, 221, and 71 nm, respectively. The DRS-derived indirect 3.54, 2.83, and 1.85 eV electronic band gaps of BiOCl, BiOBr, and BiOI were modeled by PBE-HFαHF% + vdW + SOC XCF. Effective mass estimation revealed holes to be heavier than electrons in BiOCl and BiOBr, and the opposite holds in BiOI. The thermal transport simulations revealed a high degree of anisotropy in lattice thermal conductivity in BiOX. The ZT of 0.51 (BiOCl), 0.76 (BiOBr), and 1.49 (BiOI) near 990 K, with combined ADP, POP, and IMP scattering and at PBE-HFαHF% + vdW + SOC level, demonstrate their potential as p-type thermoelectric materials. The steady-state PL emissions of BiOCl, BiOBr, and BiOI occurred in 366–521, 335–658, and 393–658 nm, respectively, suitable for optoelectronic applications. The PBE-HFαHF% + vdW + SOC derived electronic band edges of BiOX straddled the redox potentials for facilitating the photocatalytic degradation of rhodamine B dye. In summary, this combined DFT-experimental approach may have explored the potential of BiOX nanoparticles in thermoelectric, optoelectronic, and photocatalytic means.
Author contributions
I. A. planned and supervised the entire project, and wrote the original article. I. H. S. prepared all samples and performed all photocatalytic measurements. Q. S. H., S. S. N., S. M. S. I, and I. A. conducted the DFT simulations. M. N. I. K. helped with XRD and FTIR measurements. S. A. J. and U. S. A. facilitated the XPS measurements and data analysis. M. S. B. and S. J. conducted the SEM, EDX, and Raman measurements. D. I. helped with the FESEM measurements. K. S. H. provided DRS measurements support. I. M. S. and M. Z. S. performed the PL measurements. I. H. S., Q. S. H., and I. A. performed the data curation.
Conflicts of interest
The authors declare no competing interests.
Data availability
The data that support the findings of this study are available from the corresponding author upon reasonable request.
Supplementary information: computational methods, materials and sample preparation, photo catalytic sample preparation, XRD with Rietveld refinement, Raman, and FTIR peak analysis with DFT, elastic tensor, phonon DOS and BS, born tensor, EDX analysis, electronic DOS and BS, electronic band gap analysis, optical properties, effective mass analysis, electronic transport, and band edge analysis. See DOI: https://doi.org/10.1039/d5ra07838e.
Acknowledgements
I. A. would like to express his thanks to the Ministry of Science and Technology, Government of the People's Republic of Bangladesh for financial support from Special Allocation for Science and Technology 2024–25 (grant code: SRG-242303). I. A. gratefully acknowledges Bangladesh Research and Education Network (BdREN) for providing excellent high-performance computational resources. I. A. is thankful for experimental support from the Semiconductor Technology Research Centre (STRC), University of Dhaka. I. A. also acknowledges resource-sharing support from Md. Shafiul Alam, University of Dhaka. I. A. would like to thank Malathi Arumugam from Heriot-Watt University, for helpful discussion on BiOI synthesis. K. S. H. acknowledges the support from the International Science Program (ISP), Uppsala University, Sweden. I. H. S. acknowledges a research fellowship from STRC, University of Dhaka.
Notes and references
- F. Temerov, Y. Baghdadi, E. Rattner and S. Eslava, ACS Appl. Energy Mater., 2022, 5, 14605 CrossRef CAS PubMed.
- B. Ouyang, W. Dun, P. Chen, T. Zhang, H. Dong, Y. Qing, W. Liu, Y. He and H. Wang, Desalination, 2025, 118919 CrossRef CAS.
- X. Liu, S. Zhang, S. Guo, B. Cai, S. A. Yang, F. Shan, M. Pumera and H. Zeng, Chem. Soc. Rev., 2020, 49, 263 RSC.
- S. Saroar, S. Sultana, Q. S. Hossain, S. S. Nishat, I. H. Sabuj, S. A. Jahan, M. Khan, U. S. Akhtar, M. Shahriar Bashar and D. Islam, et al., J. Phys. Chem. C, 2025, 129, 11732 CAS.
- M. R. Haq, N. Ehsan, S. S. Nishat, Q. S. Hossain, M. N. I. Khan, M. Shahriar Bashar, U. S. Akhtar, F. Chowdhury, S. Jahan and K. S. Hossain, et al., J. Phys. Chem. C, 2024, 128, 4779 CrossRef CAS.
- T. A. Mahi, I. H. Sabuj, Q. S. Hossain, S. S. Nishat, S. A. Jahan, M. N. I. Khan, U. S. Akhtar, M. Shahriar Bashar, D. Islam and M. Z. Sultan, et al., J. Phys. Chem. C, 2024, 128, 20468 CrossRef CAS.
- D. B. Gingerich and M. S. Mauter, Environ. Sci. Technol., 2015, 49, 8297 CrossRef CAS.
- A. Firth, B. Zhang and A. Yang, Appl. Energy, 2019, 235, 1314 CrossRef.
- X.-L. Shi, J. Zou and Z.-G. Chen, Chem. Rev., 2020, 120, 7399 CrossRef CAS.
- Z. Li, J. Jiang, X. He, C. Wang and Y. Niu, J. Mater. Chem. A, 2024, 12, 13623 RSC.
- J. He and T. M. Tritt, Science, 2017, 357, eaak9997 CrossRef PubMed.
- J. Luo, X. Wang, S. Li, J. Liu, Y. Guo, G. Niu, L. Yao, Y. Fu, L. Gao and Q. Dong, et al., Nature, 2018, 563, 541 CrossRef CAS.
- M. Ansari, G. Moussavi, S. Samoili and S. Giannakis, Sol. RRL, 2024, 8, 2300776 Search PubMed.
- S. Khan, T. Noor, N. Iqbal and L. Yaqoob, ACS Omega, 2024, 9, 21751 CrossRef CAS PubMed.
- S. Lal, M. Righetto, A. M. Ulatowski, S. G. Motti, Z. Sun, J. L. MacManus-Driscoll, R. L. Hoye and L. M. Herz, J. Phys. Chem. Lett., 2023, 14, 6620 CrossRef CAS PubMed.
- Y. Li, H. Jiang, X. Wang, X. Hong and B. Liang, RSC Adv., 2021, 11, 26855 RSC.
- A. Zulkiflee, M. M. Khan and M. H. Harunsani, Mater. Sci. Semicond. Process., 2023, 163, 107547 CrossRef CAS.
- X. Wei, M. U. Akbar, A. Raza and G. Li, Nanoscale Adv., 2021, 3, 3353 RSC.
- J. Li, H. Li, G. Zhan and L. Zhang, Acc. Chem. Res., 2017, 50, 112 CrossRef CAS.
- M. N. Gordon, K. Chatterjee, N. Christudas Beena and S. E. Skrabalak, ACS Sustain. Chem. Eng., 2022, 10, 15622 CrossRef CAS.
- P. Latthiwan, T. Hussain, A. Thongnum, U. Pinsook, S. Nanan, P. Moontragoon, S. Pinitsoontorn and T. Kaewmaraya, ACS Appl. Energy Mater., 2025, 08, 8488 CrossRef CAS.
- M. Tabassum, B. Yang, X. Jia and M. N. Zafar, et al., J. Clean. Prod., 2025, 144868 CrossRef CAS.
- M. Arumugam, T. S. Natarajan, T. Saelee, S. Praserthdam, M. Ashokkumar and P. Praserthdam, Chemosphere, 2021, 282, 131054 CrossRef CAS PubMed.
- W. W. Lee, C.-S. Lu, C.-W. Chuang, Y.-J. Chen, J.-Y. Fu, C.-W. Siao and C.-C. Chen, RSC Adv., 2015, 5, 23450 RSC.
- L. Ding, R. Wei, H. Chen, J. Hu and J. Li, Appl. Catal. B Environ., 2015, 172, 91 Search PubMed.
- A. Chatterjee, P. Kar, D. Wulferding, P. Lemmens and S. K. Pal, ACS Appl. Nano Mater., 2020, 3, 2733 CrossRef CAS.
- D. S. Bhachu, S. J. Moniz, S. Sathasivam, D. O. Scanlon, A. Walsh, S. M. Bawaked, M. Mokhtar, A. Y. Obaid, I. P. Parkin and J. Tang, et al., Chem. Sci., 2016, 7, 4832 RSC.
- Q.-C. Liu, D.-K. Ma, Y.-Y. Hu, Y.-W. Zeng and S.-M. Huang, ACS Appl. Mater. Interfaces, 2013, 5, 11927 Search PubMed.
- Z. Sun and T. Amrillah, Nanoscale, 2024, 16, 5079 RSC.
- M. M. Rana, K. M. Alam, N. Chaulagain, J. Garcia, N. Kumar, D. Vrushabendrakumar, H. Rajashekhar, G. M. Bernard, A. Meldrum and V. K. Michaelis, et al., ACS Appl. Nano Mater., 2024, 7, 6005 CrossRef CAS.
- C.-W. Wu, X. Ren, G. Xie, W.-X. Zhou, G. Zhang and K.-Q. Chen, Phys. Rev. Appl., 2022, 18, 014053 CrossRef CAS.
- W. L. Huang and Q. Zhu, J. Comput. Chem., 2009, 30, 183 CrossRef CAS.
- Z.-Y. Zhao and W.-W. Dai, Inorg. Chem., 2014, 53, 13001 CrossRef CAS PubMed.
- Z.-Y. Zhao, Q.-L. Liu and W.-W. Dai, Sci. Rep., 2016, 6, 31449 CrossRef CAS PubMed.
- T. L. Wakjira, K. Tadele, A. B. Gemta and G. B. Kassahun, Discov. Mater., 2024, 4, 56 CrossRef.
- H. Ouhbi and J. Wiktor, J. Phys. Chem. C, 2022, 126, 19956 CrossRef CAS.
- J. Lu, W. Zhou, X. Zhang and G. Xiang, J. Phys. Chem. Lett., 2020, 11, 1038 CrossRef CAS PubMed.
- A. M. Ganose, M. Cuff, K. T. Butler, A. Walsh and D. O. Scanlon, Chem. Mater., 2016, 28, 1980 CrossRef CAS PubMed.
- D. Singh, M. Sajjad, J. A. Larsson and R. Ahuja, Results Phys., 2020, 19, 103584 CrossRef.
- Q. D. Gibson, T. Zhao, L. M. Daniels, H. C. Walker, R. Daou, S. Hébert, M. Zanella, M. S. Dyer, J. B. Claridge and B. Slater, et al., Science, 2021, 373, 1017 CrossRef CAS.
- Y. Gan, C.-W. Wu, Z.-X. Xie, Y.-X. Deng, Y. Zhang, W.-X. Zhou and X.-K. Chen, Langmuir, 2022, 38, 7733 CrossRef CAS.
- J. Yu, T. Li and Q. Sun, J. Appl. Phys., 2019, 125, 205111 CrossRef.
- M. Sajjad, N. Singh and J. A. Larsson, AIP Adv., 2020, 10, 075309 CrossRef CAS.
- M. J. Marks, C. F. Klysner, S. Frank, N. N. Lange, R. Klemmt, H. S. Jeppesen, M. Ceccato, E. D. Bøjesen, M. G. Goesten and N. Lock, ACS Appl. Nano Mater., 2025, 8, 6301 CrossRef CAS.
- H. Xiao, J. Tahir-Kheli and W. A. Goddard, J. Phys. Chem. Lett., 2011, 2, 212 CrossRef CAS.
- G. I. Csonka, J. P. Perdew, A. Ruzsinszky, P. H. Philipsen, S. Lebègue, J. Paier, O. A. Vydrov and J. G. Ángyán, Phys. Rev. B, 2009, 79, 155107 CrossRef.
- F. Mouhat and F.-X. Coudert, Phys. Rev. B, 2014, 90, 224104 Search PubMed.
- M. Born and K. Huang, Dynamical Theory of Crystal Lattices, Oxford University Press, UK, 1957, pp. 120–140 Search PubMed.
- T. Ouahrani, A. B. Garg, R. Rao, P. Rodriguez-Hernandez, A. Munoz, M. Badawi and D. Errandonea, J. Phys. Chem. C, 2022, 126, 4664 CrossRef CAS.
- F. M. Ascencio-Aguirre, L. Bazán-Díaz, R. Mendoza-Cruz, M. Santana-Vázquez, O. Ovalle-Encinia, A. Gómez-Rodríguez and R. Herrera-Becerra, Appl. Phys. A, 2017, 123, 1 CrossRef CAS.
- Z. Liu, H. Wang, G. Pan, J. Niu and P. Feng, J. Colloid Interface Sci., 2017, 486, 8 CrossRef CAS PubMed.
- W. Li, Y. Zou, X. Geng, F. Xiao, G. An and D. Wang, Mol. Catal., 2017, 438, 19 CrossRef CAS.
- C. Zhou, Y. K. Lee, Y. Yu, S. Byun, Z.-Z. Luo, H. Lee, B. Ge, Y.-L. Lee, X. Chen and J. Y. Lee, et al., Nat. Mater., 2021, 20, 1378 CrossRef CAS.
- B. Poudel, Q. Hao, Y. Ma, Y. Lan, A. Minnich, B. Yu, X. Yan, D. Wang, A. Muto and D. Vashaee, et al., Science, 2008, 320, 634 CrossRef CAS.
- Z. Fan, H. Wang, Y. Wu, X. Liu and Z. Lu, RSC Adv., 2016, 6, 52164 RSC.
- K. S. Bayikadi, S. Imam, W.-S. Tee, S. Kavirajan, C.-Y. Chang, A. Sabbah, F.-Y. Fu, T.-R. Liu, C.-Y. Chiang and D. Shukla, et al., J. Mater. Chem. A, 2024, 12, 30892 RSC.
- J.-Y. Tak, W. H. Nam, C. Lee, S. Kim, Y. S. Lim, K. Ko, S. Lee, W.-S. Seo, H. K. Cho and J.-H. Shim, et al., Chem. Mater., 2018, 30, 3276 CrossRef CAS.
- H. Zhao, J. Sui, Z. Tang, Y. Lan, Q. Jie, D. Kraemer, K. McEnaney, A. Guloy, G. Chen and Z. Ren, Nano Energy, 2014, 7, 97 CrossRef CAS.
- S. Ahmed, S. S. Nishat, A. Kabir, A. S. H. Faysal, T. Hasan, S. Chakraborty and I. Ahmed, Phys. B Condens. Matter, 2021, 615, 413061 CrossRef CAS.
- S. Ahmed, T. Hasan, A. S. H. Faysal, S. S. Nishat, M. N. I. Khan, A. Kabir and I. Ahmed, Comput. Mater. Sci., 2022, 214, 111743 CrossRef CAS.
- R. R. Pela, C.-L. Hsiao, L. Hultman, J. Birch and G. K. Gueorguiev, Phys. Chem. Chem. Phys., 2024, 26, 7504 RSC.
- R. R. Freitas, F. de Brito Mota, R. Rivelino, C. De Castilho, A. Kakanakova-Georgieva and G. K. Gueorguiev, Nanotechnology, 2016, 27, 055704 CrossRef CAS.
- Q. S. Hossain, S. Ahmed, S. S. Nishat, M. Z. Hossain, M. N. I. Khan, T. Hasan, M. S. Bashar, M. Hakim, I. M. Syed and K. S. Hossain, et al., RSC Adv., 2023, 13, 14291 RSC.
- M. Z. Hossain, S. S. Nishat, S. Ahmed, Q. S. Hossain, M. N. Khan, T. Hasan, M. S. Bashar, A. S. H. Faysal, I. M. Syed and K. S. Hossain, et al., RSC Adv., 2023, 13, 5576 RSC.
- Q. S. Hossain, S. S. Nishat, M. Sultana, T. A. Mahi, S. Ahmed, M. N. I. Khan, H. N. Das, M. S. Bashar, U. S. Akhtar and S. Jahan, et al., RSC Adv., 2023, 13, 36130 Search PubMed.
- J. Fardush Tanha, S. Farhad, U. Honey, N. Tanvir, T. Hasan, S. Shahriyar Nishat, A. Kabir, S. Ahmed, M. Hakim and M. N. I. Khan, et al., J. Appl. Phys., 2021, 130, 235107 Search PubMed.
- D. R. Penn, Phys. Rev., 1962, 128, 2093 CrossRef CAS.
- S. Saroar, S. Sultana, S. S. Nishat, Q. S. Hossain, M. Khan, D. Islam, U. S. Akhtar, M. Shahriar Bashar, S. Jahan and K. S. Hossain, et al., ACS Omega, 2024, 9, 36314 CAS.
- K. B. Spooner, A. M. Ganose, W. W. Leung, J. Buckeridge, B. A. Williamson, R. G. Palgrave and D. O. Scanlon, Chem. Mater., 2021, 33, 7441 CrossRef CAS.
- H. Muta, K. Kurosaki and S. Yamanaka, J. Alloys Compd., 2003, 350, 292 Search PubMed.
- M. Einhorn, B. A. Williamson and D. O. Scanlon, J. Mater. Chem. A, 2020, 8, 7914 RSC.
- A. Dash, S. Sarkar, V. N. Adusumalli and V. Mahalingam, Langmuir, 2014, 30, 1401 Search PubMed.
- B. S. Naidu, B. Vishwanadh, V. Sudarsan and R. K. Vatsa, Dalton Trans., 2012, 41, 3194 Search PubMed.
- S. Fang, T. Wang, S. He, T. Han, M. Cai, B. Liu, V. I. Korepanov and T. Lang, Phys. Chem. Chem. Phys., 2022, 24, 9866 RSC.
- D. Hou, X. Hu, Y. Wen, B. Shan, P. Hu, X. Xiong, Y. Qiao and Y. Huang, Phys. Chem. Chem. Phys., 2013, 15, 20698 RSC.
- A. Nag, et al., Chem. Commun., 2018, 54, 5205 RSC.
- K. Li, Y. Liang, J. Yang, Q. Gao, Y. Zhu, S. Liu, R. Xu and X. Wu, J. Alloys Compd., 2017, 695, 238 CrossRef CAS.
- I. H. Sabuj, S. A. Jahan, M. N. I. Khan, U. S. Akhtar, D. Islam, M. S. Bashar, H. Das, S. Jahan, Q. S. Hossain and K. S. Hossain, et al., AIP Adv., 2024, 14, 035146 CrossRef CAS.
- L. Shao, Y. Liu, L. Wang, X. Xia and X. Shen, Appl. Surf. Sci., 2020, 502, 143895 CrossRef CAS.
- Y. Xiao, J. Wu, T. Jia, T. Li, Z. Wang, Y. Qi, Q. Liu, X. Qi and P. He, Colloid Interface Sci. Commun., 2021, 40, 100357 CrossRef CAS.
|
| This journal is © The Royal Society of Chemistry 2026 |
Click here to see how this site uses Cookies. View our privacy policy here. 
 Open Access Article
 This Open Access Article is licensed under a Creative Commons Attribution-Non Commercial 3.0 Unported Licence
 b,
Shirin Akter Jahanc,
M. N. I. Khan
b,
Shirin Akter Jahanc,
M. N. I. Khan
 to correlate the structural and elastic properties (Tables S1–S3). The vdW interaction mediates attractive interatomic forces, which reduces the V0. Consequently, this increases the B0, reflecting a corresponding decrease in compressibility.


 . The experimental absorption range varies over BiOCl (∼200 nm), BiOBr (∼230 nm), and BiOI (300 nm). The widths of the absorption edges were in 200–360, 230–450, and 300–700 nm ranges for BiOCl, BiOBr, and BiOI, respectively. The simulated absorption edges change positions in wavelength for different XCFs. The PBE-HFαHF% + vdW + SOC XCF yields absorption spectra in best agreement with experiment when αHF is tuned to 30% for BiOCl, 22% for BiOBr, and 21% for BiOI. The band gap Eg can be estimated from Tauc's process with the following relation

 ,
,  , and
, and  along different spatial directions x, y, and z (Table S18). The carrier effective masses are found to be anisotropic among in-plane and out-of-the-plane directions in BiOX. The BiOX have identical in-plane effective mass components (
 and
and  ), while their out-of-plane components
  are distinct. Notably, the out-of-the-plane
  is larger than both
  and
and  . In the presence of long-range vdW interaction and SOC, the PBE-HFαHF% + vdW + SOC produced the average values of the effective masses 0.53m0 (BiOCl), 3.05m0 (BiOBr), and 1.99m0 (BiOI) for electrons and 1.53m0 (BiOCl), 3.26m0 (BiOBr), and 1.67m0 (BiOI) for holes. This implies the holes in BiOCl and BiOBr are heavier than electrons, indicating more localization near VBM than CBM, whereas the opposite holds in BiOI. The strong hybridization of Bi 6s, O 2p, and X np orbitals near VBM is responsible for the localization. The larger effective mass of the electron in BiOI arises from band flattening near the CBM, effectively reducing the band dispersion of the SOC split-off Bi 6p level.


