
 Open Access Article
 This Open Access Article is licensed under a Creative Commons Attribution-Non Commercial 3.0 Unported Licence
Moringa oleifera mediated synthesis of SrO2 and SrCO3@GO nanomaterials for energy storage applications
Rabia
Kashif
a,
Shabbir
Hussain
 *a,
Israr
Ahmad
a,
Muhammad
Tariq
b,
Muhammad
Imran
c,
Muhammad
Ibrar
d,
Farhana
Bibi
a,
Khurram Shahzad
Munawar
ef,
Muhammad
Waqas
g and
Sami
Ullah
hi
*a,
Israr
Ahmad
a,
Muhammad
Tariq
b,
Muhammad
Imran
c,
Muhammad
Ibrar
d,
Farhana
Bibi
a,
Khurram Shahzad
Munawar
ef,
Muhammad
Waqas
g and
Sami
Ullah
hi
aInstitute of Chemistry, Khwaja Fareed University of Engineering and Information Technology, Rahim Yar Khan 64200, Pakistan. E-mail: shabbir.hussain@kfueit.edu.pk
bDivision of Inorganic Chemistry, Institute of Chemical Sciences, Bahauddin Zakariya University Multan, Pakistan
cDivision of Inorganic Chemistry, Institute of Chemistry, The Islamia University of Bahawalpur, 63100 Bahawalpur, Pakistan
dUniversity of Science and Technology of China, Hefei Laboratory of Built Environment and Energy Conservation Technology, Guangzhou Institute of Energy Conversion, Chinese Academy of Science, Guangzhou, People's Republic of China
eInstitute of Chemistry, University of Sargodha, 40100, Pakistan
fDepartment of Chemistry, University of Mianwali, 42200, Pakistan
gDepartment of Chemistry, Lahore Garrison University, Lahore, Pakistan
hDepartment of Chemistry, College of Science, King Khalid University, Abha, 61413, Saudi Arabia
iResearch Centre for Advanced Materials Science (RCAMS), King Khalid University, Abha 61413, Saudi Arabia
First published on 28th October 2025
Abstract
We synthesized SrO2(aq) and SrO2(et) nanoparticles (NPs) by treating strontium nitrate with aqueous and ethanolic extracts of Moringa oleifera leaves, respectively. This reaction was also performed in the presence of graphene oxide (GO) to produce SrCO3@GO(aq) and SrCO3@GO(et) nanocomposites (NCs), respectively. The nanomaterials (NMs) were characterized by X-ray diffraction (XRD), Fourier-transform infrared spectroscopy (FTIR), ultraviolet–visible spectroscopy (UV-Vis), scanning electron microscopy (SEM), energy-dispersive X-ray spectroscopy (EDX), and thermogravimetric analysis/differential scanning calorimetry (TGA/DSC). FTIR spectroscopy confirmed the characteristic Sr–O vibrations, along with additional absorption bands arising from GO and phytochemical-derived organic moieties capping the nanoparticle surfaces. The synthesized NMs exhibited crystallite sizes ranging from 2 to 45 nm, particle sizes from 34 to 271 nm, and band gaps between 4.48 and 5.63 eV. EDX analysis verified the presence of Sr, O, and C, confirming their spatial distribution. TGA–DSC analysis confirmed distinct thermal stability profiles for all materials, with SrCO3@GO(et) exhibiting the highest mass loss and enthalpy. The synthesized nanoproducts were evaluated for electrochemical performance using cyclic voltammetry (CV) and galvanostatic charge–discharge (GCD), confirming their suitability as supercapacitor electrodes. The outstanding electrochemical performance of SrCO3@GO(et) (specific capacitance, 292.59 F g−1 at 1 mA) arises from the synergistic effects of M. oleifera ethanolic extract-derived phytochemicals, effective GO decoration, reduced crystallite and particle sizes, and the development of a porous, flower-like nanostructure. Collectively, these features position SrCO3@GO(et) as a highly promising electrode material for next-generation high-performance energy storage devices.
1. Introduction
Strontium-based nanoparticles (NPs) have emerged as promising materials for battery–supercapacitor hybrid devices1 and other advanced energy storage systems.2 They find applications in electrodes, gas sensors, transistors, catalysts, semiconductors, and lithium-ion batteries, while in the biomedical field, they are widely employed in drug delivery, cancer therapy, and gas sensing.3 Owing to their natural abundance, cost-effectiveness, environmental friendliness, and biocompatibility, Sr-based materials are also considered promising candidates for environmental remediation, i.e., the removal of pollutants from air or water, water purification, and corrosion-resistant coatings.4Strontium carbonate (SrCO3) has a low temperature coefficient, high dielectric constant and dispersion frequency constant5 and is important in the glass and electrical industries.6 The SrCO3/SrO system in the presence of various stabilizing additives (MgO, SiO2 and ZrO2) was analyzed for thermochemical energy storage (TCES) at a higher operational temperature of up to 1400 °C. This system was found to be efficient for TCES in a CO2-closed loop, and its energy density was found to be higher compared to other such systems, e.g., CaCO3/CaO, which is one of the most studied TCES due to its high energy density and non-toxicity, as well as the cheaper and common availability of CaCO3 sources (e.g., limestone).7 SrMnO3 in the presence of SrCO3 as an impurity has shown higher electrochemical hydrogen storage potential compared to that of pure perovskites SrMnO3, which is owing to the synergistic interaction between SrMnO3 and SrCO3, high conductivity of the final sample and the availability of more electroactive sites.8 A green hydrothermal route was employed to produce urchin-like SrCO3 from urea and strontium nitrate. The controllable urchin-like morphology resulted in an increase in the specific capacitance of SrCO3 by more than six times due to oxygen diffusion.9 Nanocomposites of SrCO3 and SrNiO3/NiO have shown significant potential for the photocatalytic removal/decomposition of organic pollutants.10 Carbon nanofibers decorated with Co/SrCO3 nanorods have demonstrated high efficiency in catalyzing methanol oxidation in alkaline media, making them promising electrocatalysts for alkaline methanol fuel cells.11 A SrCO3-based nanocomposite containing MgO, CaO, and CaCO3, synthesized using the Pechini sol–gel method at 500 °C and 700 °C, was found to be effective in eliminating crystal violet dye from aqueous solutions. This dye (crystal violet) is associated with numerous environmental and human health concerns, including systemic toxicity, cytotoxicity and carcinogenicity.12
Previous studies have shown that graphene oxide (GO) can be incorporated into metal oxides to form nanocomposites with enhanced properties. The addition of GO improves the uniform distribution of pores, interfacial bond formation and cement hydration process and increases the durability of the cement matrix.13 GO-based NMs have been recognized as highly effective for photoelectrochemical cell applications, supercapacitor technology, and various electrochemical energy storage and conversion systems.14
Numerous physical and chemical methods are currently available for the production of NPs, but they generally involve toxic chemicals and require high pressures and temperatures. However, green synthesis is an environmentally friendly and innovative approach that employs natural or eco-friendly materials, processes, and conditions to produce NPs,15 reducing the need for expensive reagents, toxic chemicals and specialized equipment, and it can produce metal-based NPs in a variety of shapes, sizes, compositions, and other characteristics.16 Plant-mediated synthesis is a safe and one-step protocol; hence, research on plant-based nanomaterials has been expanding rapidly.17 Plant-mediated syntheses of Sr-based NPs were previously reported with Elodea canadensis, Ocimum sanctum, Albizia julibrissin, Vitis vinifera, Cymbopogon citratus18 and Pedalium murex.19 However, to the best of our knowledge, the Moringa oleifera-mediated green synthesis of strontium peroxide NPs has not been previously reported. In fact, only a few studies exist on the plant-mediated synthesis of SrO nanoparticles (NPs). Furthermore, reports on SrCO3@GO hybrid nanocomposites are extremely limited in the current literature. Additionally, previous studies on strontium-based NPs have predominantly focused on applications such as antioxidant activity,19 biomedical and antibacterial potentials, waste-water treatment, and electrocatalytic water-splitting18 of SrO NPs. However, the current study represents the first systematic investigation of plant-mediated SrO2 and SrCO3@GO nanostructures for electrochemical energy storage applications. It also explores the influence of aqueous and ethanolic extracts of Moringa oleifera leaves on the synthesis and structural, morphological, and electrochemical properties of SrO2(aq) and SrO2(et) NPs, as well as their corresponding graphene oxide-decorated composites, SrCO3@GO(aq) and SrCO3@GO(et). The synthesized NMs were characterized by XRD, FTIR, UV-visible spectroscopy, SEM, EDX, and TGA/DSC analyses. They were also evaluated for their electrochemical energy storage potential using cyclic voltammetry (CV) and galvanostatic charging–discharging (GCD) behavior.
2. Experimental
2.1. Materials and methods
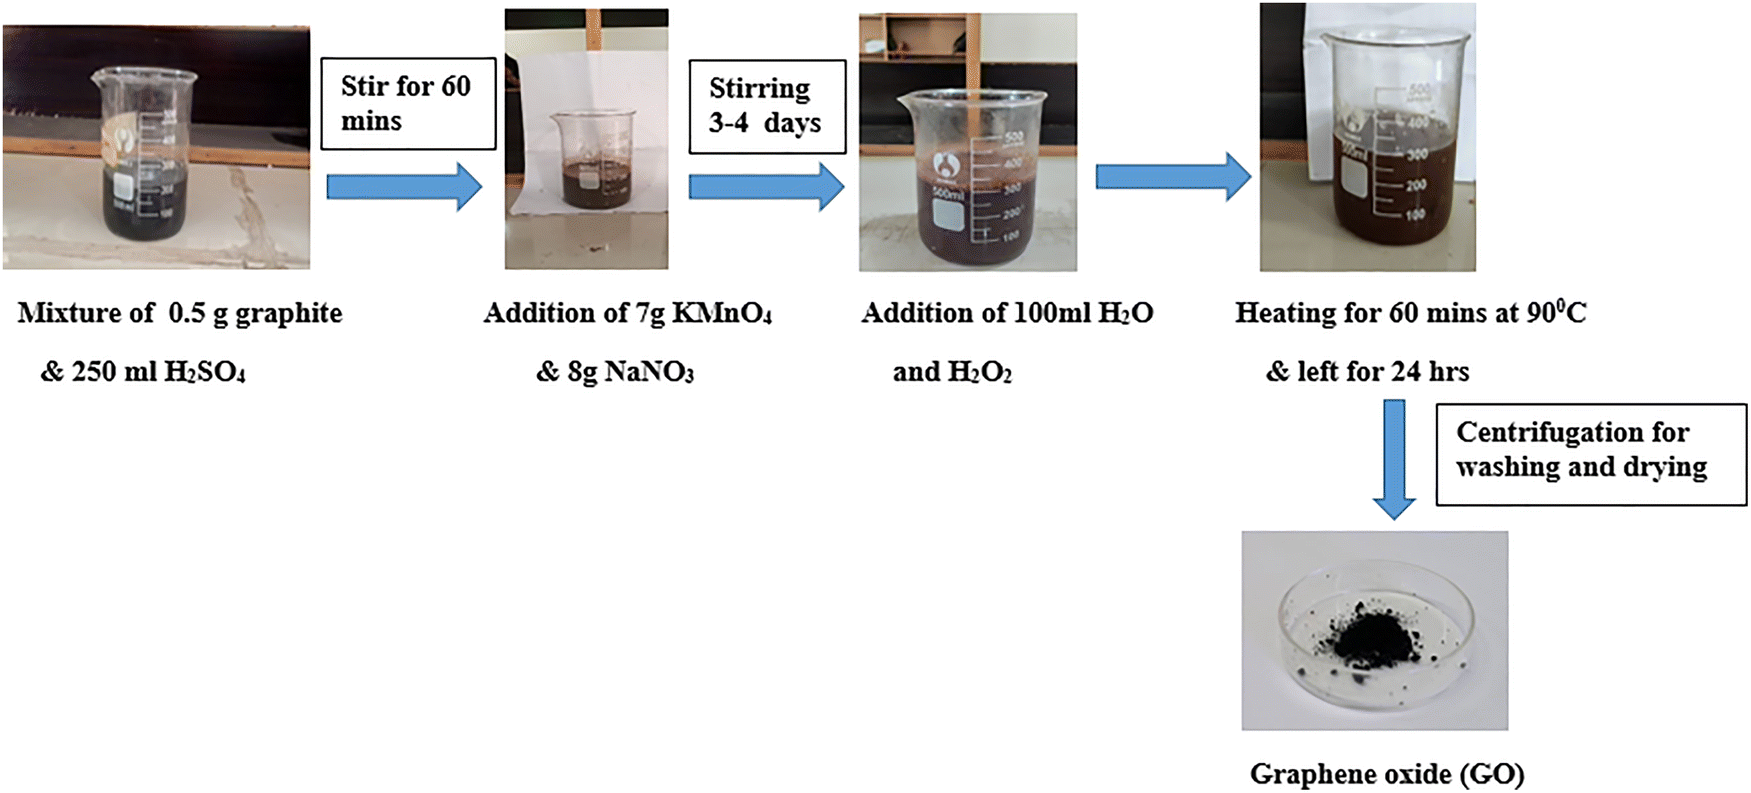
Strontium nitrate (Analytical Grade), ethanol (AnalaR), sodium hydroxide (Sigma Aldrich), distilled water, hotplate, Pyrex origin glassware (beakers, Petri dish, conical flask and funnel), tripod stand, filter paper (Whatman No. 1), oven, dropper and crucible were used during the nano-synthetic processes. Graphene oxide (GO) was freshly prepared by applying a reported procedure.20The crystallinity of the synthesized NMs was determined using a Bruker-D8 X-ray diffractometer (XRD) with CuKα radiation at a scan rate of 5° m−1. An FTIR (8400) spectrometer was utilized to identify the functional groups, and the electronic spectra were recorded using a UV-Visible spectrophotometer (BIOBASE BK-D560 VP). The morphologies of the synthesized NPs were determined using a scanning electron microscope (Zeiss Sigma 500 VP), coupled with energy-dispersive X-ray spectroscopy (EDX). TGA/DSC analyses were performed at 25–1000 °C using a Discovery 650 SDT thermal analyzer (TA Instruments, USA). Electrochemical studies were performed by employing a Galvanostat/Potentiostat of model CS-300.
2.2. Collection of Moringa oleifera leaves
Moringa oleifera leaves were collected from Khanpur, Rahim Yar Khan (Punjab), Pakistan, on 28th July 2022 evening time. The leaves were washed, dried in the shade and ground into a fine powder.2.3. Production of aqueous/ethanolic extracts of M. oleifera leaves
A 15 g powder of M. oleifera leaves was placed in 100 mL of distilled water and heated at 60 °C with stirring for 2 hours. Finally, the mixture was cooled and filtered to produce an aqueous extract (filtrate). The same procedure was adopted to produce the ethanolic extract of M. oleifera leaves using ethanol instead of water as a solvent (Scheme 1). | ||
| Scheme 1 Moringa oleifera-mediated biosynthesis of SrO2(aq) and SrO2(et) NPs. | ||
2.4. Synthesis of nanomaterials
The same method was followed to produce SrO2(et) by stirring M. oleifera leaf extract (50 mL) with 0.1 M strontium nitrate solution (13 mL) at room temperature for 1 hour and subsequently, at 70 °C for 30 minutes. Scheme 1 describes the flow sheet for the M. oleifera-mediated synthesis of SrO2(aq) and SrO2(et) NPs.
 | ||
| Scheme 2 Synthetic route for graphene oxide (GO). | ||
The same procedure was followed to prepare SrCO3@GO(et) using 10 mL ethanolic M. oleifera extract in place of the aqueous extract. Scheme 3 displays the M. oleifera-mediated synthesis of SrCO3@GO(aq) and SrCO3@GO(et) nanocomposites.
 | ||
| Scheme 3 M. oleifera-mediated bio-synthesis of SrCO3@GO(aq) and SrCO3@GO(et) nanocomposites. | ||
2.5. Electrochemical studies
The electrochemical potential of the fabricated electrodes was investigated in terms of cyclic voltammetry (CV) and galvanostatic charge–discharge (GCD) using a 3-electrode system and Galvanostat/Potentiostat of model CS-300. This setup included a working electrode, an Ag/AgCl (saturated KCl) reference electrode, and platinum (Pt) wire as the counter electrode with an electrolyte (6 M KOH) solution. The working electrode was prepared by forming a well-dispersed slurry containing 80 wt% of the active material (0.003 g), 15 wt% carbon black, and 5 wt% PVDF binder mixed in N-methyl-2-pyrrolidone (NMP). This slurry was then uniformly applied onto a nickel (Ni) foam substrate with a geometric area of 1 × 1 cm2. Before deposition, the slurry was vacuum-dried at 80 °C for 24 hours to eliminate impurities. Cyclic voltammetry (CV) measurements were performed at numerous scan rates (10–50 mV s−1) within a fixed potential (0–0.45 V). The specific capacitance (Csp, in F g−1) of each investigated sample was calculated from the CV data using eqn (1):21 | (1) |
 denotes an area enclosed by a CV curve, s (mV s−1) denotes the scan rate, m (g) represents the mass of the active material, and ΔV denotes the potential window. The specific capacitance (Csp), energy density (E), and power density (P) were determined using eqn (2)–(4):22
| Cdsp = (Id × Td)/(m × ΔV), | (2) |
| E = (0.5 × Cdsp × (ΔV)2)/(3.6), | (3) |
| P = E/Δt, | (4) |
3. Results and discussions
Moringa oleifera leaves constitute an appreciable quantity of ascorbic acid, essential amino acids, proteins, β-sitosterol, β-carotene, α-tocopherol, vitamins A and B, and polyphenols (e.g., phenolic acids and flavonoids).23 Their aqueous and ethanolic extracts were employed as reducing, capping, and stabilizing agents for the synthesis of SrO(aq) and SrO(et)NPs, respectively, as well as GO-decorated SrCO3@GO(aq) and SrCO3@GO(et) NCs, respectively. The synthesis of the nanomaterials was carried out multiple times under identical conditions, and the results were found to be reproducible in terms of yield, morphology, and structural features, as confirmed by XRD and SEM analyses. Regarding yield consistency, each batch produced comparable amounts of product (with only minor variations attributed to handling losses). For scalability, since the synthesis utilizes a simple, low-cost, and green approach (Moringa oleifera extracts and mild conditions), the method can potentially be scaled up without significant modifications.We employed water/ethanol solvents during the Moringa oleifera-mediated synthetic pathways. Water is often regarded as the ideal solvent due to its affordability, safety, and abundant availability. Additionally, it is non-toxic, non-flammable, and cost-effective and possesses high boiling and critical points. Ethanol is a renewable source and is also called a green solvent since it shows negligible health and environmental issues and also occurs in nature. Ethanol, as a polar solvent, can effectively solubilize and extract a wide range of polar/semi-polar components. It can also act as a co-solvent with water, thus further expanding the solubility power. Due to their strong extraction efficiency, both ethanol and water are commonly used to isolate phenolic compounds from plants.17
The nanomaterials were characterized by XRD, FTIR, UV-visible spectroscopy, SEM, EDX, and TGA/DSC analyses. They were also subjected to their evaluation of electrochemical energy storage potential using cyclic voltammetry (CV) and galvanostatic charging/discharging (GCD).
3.1. Mechanism for the synthesis of strontium peroxide (SrO2)
The reaction mechanism involves the thermal breakdown of strontium nitrate in the presence of aqueous/ethanolic extract of M. oleifera, which results in the release of nitrogen dioxide (NO2) and oxygen (O2) gases, leaving behind strontium oxide (SrO) NPs.24| 2Sr(NO3)2 → 2SrO + 4NO2 + O2 |
The conversion of SrO to SrO2 likely occurs when atmospheric oxygen reacts with SrO upon heating.25 The driving force for this reaction is the stability of peroxide ions (O2−2) in the basic reaction conditions due to the presence of 0.1 M NaOH in the reaction mixture.26
| 2SrO + O2 → 2SrO2 |
3.2. Mechanism for the synthesis of GO-decorated strontium carbonate (SrCO3@GO)
GO comprises various oxygen-containing functional groups (–COOH, –OH, and –C![[double bond, length as m-dash]](https://www.rsc.org/images/entities/char_e001.gif) O) that can bind to Sr2+ ions from Sr(NO3)2:
O) that can bind to Sr2+ ions from Sr(NO3)2:| GO + Sr(NO3)2 → Sr2+–GO complex + 2NO3−. |
| Sr(NO3)2 + CO2 + H2O → SrCO3 + 2HNO3. |
GO, with its large surface area and functional groups, can adsorb CO2 and facilitate its diffusion in catalytic systems, potentially enhancing the efficiency of CO2-related reactions. The thermal decomposition of strontium nitrate enhances conversion to strontium carbonate by promoting CO2 capture, providing a large reactive surface, and aiding uniform heat distribution. The actual conversion mechanism relies on the intermediate formation of SrO, which reacts with CO2 in the graphene oxide environment to form SrCO3.
3.3. Structural studies by XRD analysis
XRD is primarily used to identify the crystal structures and the average sizes of the crystalline domains. The phase purity and crystalline nature of NPs can be verified by the presence of strong and sharp peaks. The obtained XRD diffractograms of our investigated materials are shown in Fig. 1(a)–(c). | ||
| Fig. 1 (a) XRD patterns of SrO2(aq) and SrO2(et) NPs. (b) XRD patterns of SrCO3@GO(aq) and SrCO3@GO(et). (c) XRD pattern of graphene oxide. | ||
In the XRD pattern of SrO2(aq), most of the reflections closely match those of SrO2(et), indicating that both synthesis routes yield comparable crystalline phases (Fig. 1(a)). SrO2(aq) displayed diffraction peaks at 2θ values of 29.82, 32.92, 37.52, 42.01, 44.58, 51.33, 57.42 and 59.24°, which correspond to Miller indices of (002), (204), (110), (215), (112), (103), (131) and (202), respectively. SrO2(et) showed peaks at 2θ values of 29.82, 36.45, 41.48, 44.26, 50.14 and 59.88°, which correspond to miller indices of (002), (110), (215), (112), (103) and (202), respectively. These diffraction peaks of SrO2(aq) and SrO2(et) show the formation of tetragonal structures (JCPDS No. 65-2652).29 The peaks marked with * in Fig. 1(a) indicate the presence of residual cellulose, Sr(OH)2 and SrO. A prominent peak at 25.53° corresponding to the (202) plane indexed the presence of cubic SrO (JCPDS No. 06-520) as a mixed phase in SrO2(et) (Fig. 1(a)).30 Moreover, the peak detected at 16.52° corresponded to the (020) crystal plane, indicating the presence of Sr(OH)2 (Fig. 1(a))31 in the SrO2(et) sample. The peaks observed at lower angles, corresponding to (1−10), (110) and (200) Miller indices, were attributed to residual cellulose originating from the plant extract used in synthesis.32 The shift of the (1−10) peak from its typical position at ∼14.5° in isolated cellulose I33 to 11.92° in both SrO2(aq) and SrO2(et) indicates significant lattice expansion (d ≈ 7.42 Å vs. ∼6.0 Å). This expansion is likely caused by the interaction between the cellulose residues of Moringa oleifera and Sr-species during green synthesis. The obtained data thus clarify that plant-derived biomolecules remain semi-crystalline and likely function as stabilizing/capping agents during green synthesis.
SrCO3@GO(aq) (Fig. 1(b)) displayed peaks at 2θ values of 23.16, 26.50, 29.63, 32.58, 41.70, 43.76, 51.01 and 57.19°, corresponding to the (110), (111), (002), (012), (220), (221), (113) and (311) Miller indices, respectively. SrCO3@GO(et) exhibited peaks at 2θ values of 23.16, 25.12, 29.53, 32.68, 36.01, 41.50, 44.50, 51.01, and 55.63°, corresponding to the Miller indices of (110), (111), (002), (012), (130), (220), (221), (113) and (311), respectively. The diffraction peaks of SrCO3@GO(aq) and SrCO3@GO(et) evidence the orthorhombic structures corresponding to JCPDS No. 05-0418 for SrCO3.34 Graphene oxide (Fig. 1(c)) exhibited a broad diffraction peak at 2θ = 14.70°, corresponding to the (001) plane, which indicates its layered structure and high interlayer spacing due to oxygen-containing groups.35 Peaks observed at 12.27 and 13.55° in SrCO3@GO(et) and SrCO3@GO(aq) diffractograms, respectively, corresponded to the (001) crystal plane (marked by ♣ in Fig. 1(b)), indicating GO.35 The slight shifting of these peaks (GO) toward a lower angle confirmed the successful incorporation and strong interaction of GO sheets with SrCO3 nanoparticles.36
The average crystalline sizes of NMs were determined using Scherer's eqn (5):
D = Kλ/β![[thin space (1/6-em)]](https://www.rsc.org/images/entities/i_char_2009.gif) cos cos![[thin space (1/6-em)]](https://www.rsc.org/images/entities/char_2009.gif) θ. θ. | (5) |
3.4. FTIR spectroscopy
The vibrational frequencies of the functional groups of the NMs were determined by performing FTIR spectroscopy in a range of 400–4000 cm−1; the obtained spectra are shown in Fig. 2 and 3. | ||
| Fig. 2 FTIR spectra of M. oleifera-mediated SrO(aq) and SrO(et) NPs. | ||
 | ||
| Fig. 3 FTIR spectra of GO, SrCO3@GO(aq) and SrCO3@GO(et). | ||
The FAR-IR region of SrO2(aq) displayed two peaks at 854 and 611 cm−1 corresponding to the stretching and bending vibrations, respectively, of the Sr–O bond. In SrO2(et), these two peaks were observed at 858 and 698 cm−1, respectively (Fig. 2). Strong intensity bands at 1072 and 1125 cm−1 in SrO2(aq) and SrO2(et), respectively, can be attributed to Sr–O–Sr stretching vibrations.37 In addition to the metal oxide stretching vibrations, many additional peaks also appeared in the near-IR region, demonstrating the presence of organic moieties that originated from the aqueous and ethanolic extracts of M. oleifera leaves and were coated on the surfaces of SrO2(aq) and SrO2(et) NPs, respectively, during nano-syntheses. Such peaks were displayed at 3445, 2931, 2846, 2352, 1639 and 1384 corresponding to O–H, C–H (asymmetric), C–H (symmetric), C![[triple bond, length as m-dash]](https://www.rsc.org/images/entities/char_e002.gif) C, CN and C–O, respectively, in SrO2(aq) and were shown at 3462, 2931, 2849, 2358, 1771, 1636 and 1384 for O–H, C–H (asymmetric), C–H (Symmetric), CC, CO, CN and C–O, respectively, in SrO2(et).38 The simultaneous existence of Sr–O vibrations and organic functional groups verifies that the synthesized NPs are coated with organic moieties from plant extracts. The existence of a broad band at 3445 and 3462 cm−1 in SrO2(aq) and SrO2(et) NPs, respectively, depicts the presence of O–H moieties from moisture or interstitial water molecules in the synthesized SrO2 NPs.
C, CN and C–O, respectively, in SrO2(aq) and were shown at 3462, 2931, 2849, 2358, 1771, 1636 and 1384 for O–H, C–H (asymmetric), C–H (Symmetric), CC, CO, CN and C–O, respectively, in SrO2(et).38 The simultaneous existence of Sr–O vibrations and organic functional groups verifies that the synthesized NPs are coated with organic moieties from plant extracts. The existence of a broad band at 3445 and 3462 cm−1 in SrO2(aq) and SrO2(et) NPs, respectively, depicts the presence of O–H moieties from moisture or interstitial water molecules in the synthesized SrO2 NPs.
Graphene oxide (GO) showed FTIR vibrations at 2926, 2862, 2362, 1587, 1386 and 1103 cm−1 (Fig. 3), which were attributed to C–H (asymmetric), C–H (symmetric), CO (terminal), CC, C–O (stretching) and C–O–H, respectively.35 The broad peak observed at 1587 cm−1 in GO is most likely due to the coupling between CC and CO vibrations, with the latter occurring at a slightly higher frequency than the former. The interpretation became clearer upon comparing the FTIR spectrum of GO with those of the GO-decorated SrO nanocomposites, namely SrCO3@GO(aq) and SrCO3@GO(et) (Fig. 3), which exhibited distinct CO bands at 1627 and 1620 cm−1, respectively, along with separate CC bands at 1384 and 1386 cm−1, respectively. The vibration mode of C–O–H at 1103 cm−1 in GO was significantly shifted to 1084 and 1077 cm−1 in SrCO3@GO(aq) and SrCO3@GO(et), respectively. Additionally, the two Sr–O bands (854 and 611 cm−1) of SrO(aq) were shifted to 835 and 608 cm−1 in their respective GO-decorated SrCO3@GO(aq) NC. There was also a significant shift of these bands from 858 and 698 cm−1 of SrO(et) to 840 and 646 cm−1, respectively, in their respective SrCO3@GO(et) NC. The observed FTIR shifts and corresponding data clearly confirm the successful integration of SrO with GO to form SrCO3 nanocomposites. Moreover, the FTIR spectra of SrCO3@GO(aq) and SrCO3@GO(et) are sharper than those of their respective SrO2(aq) and SrO2(et) precursors, respectively, indicating that the SrO-decorated GO nanocomposites contain fewer organic residues.
3.5. UV-visible spectroscopy
UV–visible spectroscopy of the investigated NMs was performed in a range of 200–500 nm. Fig. 4(a) and (b) represents UV-Visible spectra and band gaps of SrO2(aq), SrO2(et), GO, SrCO3@GO(aq) and SrCO3@GO(et). SrO2(aq) and SrO2(et) exhibited narrow and well-defined peaks at 297 and 298 nm, respectively, indicating a uniform distribution of NPs.37 GO exhibited two absorption peaks at 219 and 280 nm, which can be assigned to π–π* transitions of aromatic CC bonds and n–π* transitions of CO bonds, respectively.39 The peaks observed at 207 nm for SrCO3@GO(aq) and 242 nm for SrCO3@GO(et)40 demonstrate the successful integration of strontium oxide nanoparticles with GO, leading to the restoration of electronic conjugation within the GO carbon framework.
 | ||
| Fig. 4 (a) UV-Visible spectra of SrO2(aq), SrO2(et), SrCO3@GO(aq), SrCO3@GO(et) and GO. (b) Band gaps of SrO2(aq), SrO2(et), SrCO3@GO(aq), SrCO3@GO(et) and GO. | ||
From the UV-visible data, we also calculated the band gap energies to evaluate the optical and electronic properties of the synthesized nanomaterials, which are highly relevant owing to their potential application as electrode materials in supercapacitors. The band gap determines charge carrier excitation and influences electrochemical conductivity, electron transfer, and overall energy storage performance. By correlating the band gap values with the electrochemical data (CV and GCD), we were able to better understand the suitability of SrO2 and SrCO3@GO nanocomposites for energy storage applications. Hence, the UV–Vis band gap analysis was performed as a complementary characterization to support electrochemical studies.41 GO had a band gap of 4.6 eV. The band gap values of SrO(aq) and SrO(et) NPs were found to be 5.56 and 5.36 eV, respectively, which decreased to 4.69 and 4.65 eV in the corresponding nanocomposites, SrCO3@GO(aq) and SrCO3@GO(et), respectively. SrCO3@GO(et) exhibited the lowest band gap value (4.65 eV), indicating its superior electrochemical energy storage potential compared to the other three materials, as discussed in Sections 3.9 and 3.10. The band gap of nanomaterials typically decreases with a reduction in particle size primarily due to quantum confinement effects, changes in surface energy, and alterations in the electronic structure at the nanoscale. However, the exact trend depends on the material type and the specific size regime involved.
3.6. Scanning electron microscopy (SEM)
SEM micrographs are helpful for the calculation of sizes, determination of shapes and overall appearance of the particles. A porous and hierarchical structure facilitates ion diffusion and increases charge storage capacity. The SEM picture of SrO2(aq) (Fig. 5(a)) revealed spherical to irregular or elongated shapes. Some particles are fused together, forming clusters and flower-like crystalline structures. The SEM image of SrO2(et) (Fig. 5(b)) showed densely packed, polyhedral nanoparticles with significant aggregation, indicating strong particle–particle interactions characteristic of high-surface-energy oxide systems. The nanoparticles appear well-defined with smooth surfaces although their aggregated nature suggests limited porosity at this scale. Such nanostructured morphologies can still contribute to enhanced surface area, which is beneficial for electrochemical applications, like supercapacitors, where surface-dependent ion diffusion and charge storage play a critical role. The SEM image of GO (Fig. 5(e)) shows thin, wrinkled, and randomly entangled sheets, indicating the disruption of the ordered graphite layers upon oxidation. This morphology is consistent with previously reported SEM observations of GO, which typically exhibit layered, sheet-like structures with surface wrinkles.35 | ||
| Fig. 5 SEM images of (a) SrO2(aq) (b) SrO2(et), (c) SrCO3@GO(aq), (d) SrCO3@GO(et), and (e) GO. | ||
The morphologies of SrO2(aq) and SrO2(et) underwent significant changes upon GO decoration, forming SrCO3@GO(aq) and SrCO3@GO(et) NCs (Fig. 5(a)–(e)). The SEM image of SrCO3@GO(aq) (Fig. 5(c)) showed irregular, plate-like structures with noticeable aggregation. The broad, flat surfaces indicate the formation of micro/nanocrystals with layered arrangements, which is consistent with a crystalline nature. Such plate-like morphologies can provide an enhanced surface area, which may improve catalytic activity. The SEM micrograph of SrCO3@GO(et) (Fig. 5(d)) reveals a highly porous, fluffy morphology, indicating a nanostructured or flower-like growth pattern. The observed surface features consist of densely packed, sharp, needle-like structures that may correspond to nanorods, nanoflakes, or agglomerated NPs. These high-aspect-ratio features contribute significantly to an increased surface area, which is advantageous for catalytic, electrochemical, or sensing applications. The contrast between the bright and dark regions in the image (Fig. 5(d)) reflects variations in local material density and electron scattering, suggesting a heterogeneous distribution of the SrCO3 NPs and graphene oxide (GO) sheets. The intimate interaction between the GO layers and the SrCO3 NPs facilitates uniform dispersion and strong interfacial adhesion likely due to π–π stacking interactions and surface functional groups present on GO. Such a hierarchical nanostructure is expected to promote efficient charge carrier mobility across the composite. Specifically, the GO matrix provides a conductive pathway that supports rapid electron transport between adjacent SrCO3 NPs. This synergistic architecture enhances the separation and migration of photo- or electro-generated charge carriers, thereby improving the overall electronic conductivity and electrochemical performance of the material.42 These attributes make SrCO3@GO(et) a promising candidate for high-performance applications in energy storage. The SEM morphology of strontium peroxide (SrO2) and strontium carbonate (SrCO3) synthesized in different solvent systems—namely aqueous and ethanolic plant extracts—exhibits marked variations that are attributable to differences in reaction kinetics, solvent polarity, nucleation rates, and crystal growth mechanisms. These factors critically influence the resulting particle size, shape, degree of agglomeration, and surface architecture. In aqueous media, faster ion diffusion and higher polarity often promote rapid nucleation and irregular agglomeration, leading to more compact or amorphous structures. In contrast, ethanolic extracts, with their lower polarity and potential for selective interaction with precursor ions or intermediate species, can slow crystal growth and favor the formation of more defined anisotropic nanostructures.43 Such solvent-mediated effects are clearly reflected in the distinct morphological features observed in the SEM micrographs. The average particle sizes of SrO2(aq), SrO2(et) and GO were found to be 223, 271 and 43 nm, respectively. Upon GO decoration, the particle sizes of SrO2(aq) and SrO2(et) were significantly reduced to 203 and 34 nm in the corresponding SrCO3@GO(aq) and SrCO3@GO(et) nanocomposites, respectively. Notably, SrCO3@GO(et) exhibited a much smaller average particle size (34 nm) compared to SrCO3@GO(aq) (203 nm), indicating more effective size confinement in the ethanolic extract-mediated synthesis.
The observed morphological features strongly influence the electrochemical behavior of the nanostructures. The SrO2(et) sample, characterized by its polyhedral morphology, smooth surfaces, and uniform particle distribution, offers an increased electrochemically active surface area and reduced ion diffusion distances, thereby facilitating enhanced charge storage performance. In contrast, SrO2(aq) exhibits larger spherical/elongated particles and partial agglomeration, which hinders efficient ion transport and reduces the electrochemically active surface. Decoration with GO further refines the morphology; the average particle size decreases from 223 nm (SrO2(aq)) to 203 nm (SrCO3@GO(aq)) and dramatically from 271 nm (SrO2(et)) to 34 nm (SrCO3@GO(et)) while simultaneously introducing wrinkled GO sheets that prevent agglomeration and create additional diffusion channels. The highly porous, fluffy, flower-like morphology observed in SrCO3@GO(et), with the smallest particle size of 34 nm, enhances ion accessibility and offers abundant redox-active sites, thereby explaining its superior specific capacitance and rate performance compared to the other materials, as discussed in Sections 3.9 and 3.10. Thus, the SEM-observed morphology, particle size reduction, and GO-induced dispersion correlate directly with the improved electrochemical storage behavior demonstrated in the CV and GCD analyses.
3.7. EDX analysis
EDX analysis (Fig. 6(a)–(e)) was conducted to confirm the presence of Sr, C, and O in the synthesized nanostructures and to compare their elemental ratios between the aqueous and ethanolic synthesis routes. For both SrO2(aq) and SrO2(et) NPs, the spectra were dominated by oxygen signals, with atomic percentages of 79% and 75% accompanied by strontium signals of 20% and 24%, respectively (Fig. 6(a) and (b)). In contrast, the spectra of the SrCO3@GO nanocomposites exhibited an additional strong carbon peak, which is attributed to the graphene oxide matrix. Specifically, the SrCO3@GO(aq) sample showed 65.3% carbon, 27% oxygen, and 7.7% strontium, while the SrCO3@GO(et) composite contained 60.8% carbon, 29.9% oxygen, and 9.3% strontium (Fig. 6(c) and (d)). The increased carbon content in these composites further validates the effective incorporation of graphene oxide into the SrCO3 matrix, while the detectable strontium and oxygen peaks confirm the coexistence of the carbonate phase. Graphene oxide (GO) demonstrated the presence of only carbon (64.4%) and oxygen (34.6%), with negligible amounts of oxygen (0.5%) and sulfur (0.5%) (Fig. 6(c)). Overall, the EDX results corroborate the successful synthesis and compositional integrity of both the oxide nanoparticles and the graphene oxide-based nanocomposites. | ||
| Fig. 6 SEM images of SrO2(aq) (a), SrO2(et) (b), SrCO3@GO(aq) (c), SrCO3@GO(et) (d) and GO (e). | ||
Fig. 7 and 8 display the electron mapping images of SrO2(et) and SrCO3@GO(et), respectively.
 | ||
| Fig. 7 Electron mapping images of SrO2(et) NPs confirming the spatial distribution of strontium (Sr) and oxygen (O). | ||
 | ||
| Fig. 8 Electron mapping images of SrCO3@GO(et) NC confirming the spatial distribution of strontium (Sr), oxygen (O) and carbon (C) atoms. | ||
3.8. TGA/DSC analysis
The thermal properties and phase transitions of the nanomaterials (NMs) were investigated using thermogravimetric analysis (TGA) and differential scanning calorimetry (DSC), and the obtained TGA/DSC curves are shown in Fig. 9(a)–(e). | ||
| Fig. 9 (a) TGA/DSC curves of SrO2(aq). (b) TGA/DSC curves of SrO2(et). (c) TGA/DSC curves of GO. (d) TGA/DSC curves of SrCO3@GO(aq). (e) TGA/DSC curves of SrCO3@GO(et). | ||
The TGA curves of the synthesized materials exhibited multi-stage decomposition, with total mass losses of 14.51, 45.26, 63.10, 61.48 and 99.64% for SrO2(aq), SrO2(et), GO, SrCO3@GO(aq) and SrCO3@GO(et), respectively, up to 1000 °C (Fig. 9). In SrO2(aq) (Fig. 9(a)), the initial mass loss of 4.10% between 19.05 °C and 107.42 °C corresponds to an endothermic loss of adsorbed water molecules and surface OH groups. A subsequent gradual endothermic loss of 3.94% occurred between 107.42 °C and 350.26 °C, which was attributed to the removal of interstitial water and/or residual organic moieties, leaving 91.96% of the material. Beyond 350.26 °C, an exothermic decomposition phase was observed, which was associated with the degradation of plant-derived organic compounds adsorbed on nanoparticle surfaces during synthesis. A slow mass loss continued up to 744.65 °C, followed by a rapid degradation phase of up to 781.66 °C, leaving behind the final residual mass of 85.49%. From 781.66 °C to 1000 °C, the SrO2(aq) material became almost heat resistant with negligible loss of mass, demonstrating the formation of stable metal oxide.44 The thermal decomposition pattern of SrO2(et) (Fig. 9(b)) closely resembles that of SrO2(aq), exhibiting endothermic decomposition below 423.74 °C, followed by exothermic decomposition at higher temperatures. A gradual mass loss of approximately 11.01% was observed up to 661.63 °C primarily due to the removal of moisture and organic residues. Beyond this temperature, a rapid degradation occurred up to 870.01 °C, leaving a residual mass of 54.74%. Overall, SrO2(et) exhibited a significantly higher total mass loss (45.26%) compared to SrO2(aq) (14.51%), indicating a greater content of plant-derived organic moieties. This is attributed to the higher concentration of biomolecules in the ethanolic M. oleifera extract (compared to its aqueous counterpart), which likely contributes to the enhanced electrochemical properties and superior energy storage performance of SrO2(et), as discussed in Sections 3.9 and 3.10.
The TGA/DSC curves of graphene oxide (GO) (Fig. 9(c)) exhibit a three-step decomposition pattern. The first stage (24.02–114.96 °C) involves endothermic loss of residual surface-bound water. The second stage (196–246 °C) corresponds to the rapid exothermic decomposition of oxygen-containing functional groups (carboxylic, hydroxyl, and epoxide), releasing gaseous byproducts such as H2O and CO2. The final stage (533.64–813.73 °C) reflects the gradual oxidative pyrolysis of the carbon skeleton,45 leaving a 26.90% residue.
A comparison of the TGA/DSC curves of the M. oleifera-mediated NMs (Fig. 9(a), (b), (d) and (e)) indicates a significant increase in percentage weight loss upon heating when SrO2(aq) and SrO2(et) are converted to their GO-based nanocomposites, SrCO3@GO(aq) and SrCO3@GO(et). After heating to 1000 °C, SrCO3@GO(aq) and SrCO3@GO(et) showed markedly higher total weight losses of 61.48 and 94.66%, respectively (Fig. 9(d) and (e)), compared to their SrO2(aq) and SrO2(et) precursors, which lost 14.51 and 45.26%, respectively (Fig. 9(a) and (b)). These findings suggest that GO incorporation into SrO2 accelerates the thermal decomposition of NCs, reducing their thermal stability compared to pristine SrO2. In SrCO3@GO(aq), a significant weight loss between 191.66 °C and 266.23 °C is attributed to the removal of oxygen-containing functional groups from the GO sheets, while the subsequent losses from 266.23 °C to 867.52 °C correspond to the thermal decomposition of SrCO3 and the release of volatile species, including CO2, leaving behind 38.52% final residue. The TGA/DSC results of SrCO3@GO(et) are particularly striking, as the material undergoes almost complete decomposition (99.64%) up to ≈850 °C. It exhibited a major weight loss of 63.33% between 175.90 °C and 627.83 °C, attributable to the thermal decomposition of SrCO3 and the removal of GO components. The TGA/DSC data thus strongly indicate the stable incorporation of plant-derived organic moieties and water within all M. oleifera-mediated NMs, which are gradually released as volatile components upon heating to elevated temperatures. The presence of water and organic moieties in the investigated nanomaterials aligns with the FTIR results discussed in Section 3.4, and their release during thermal degradation is further supported by previous studies.44
The DSC-derived enthalpy data provide valuable insights into the thermal behavior of the synthesized NMs. The enthalpies (normalized) of the M. oleifera-mediated NPs decreased in the following order: SrCO3@GO(et) (31511 J g−1) > SrO2(aq) (6443.0 J g−1) > SrCO3@GO(aq) (5667.4 J g−1) > SrO2(et) (3827.4 J g−1) > GO (2899.7 J g−1). Among all the samples, SrCO3@GO(et) exhibited the highest normalized enthalpy (31511 J g−1), indicating its intense thermal activity and complex decomposition behavior, likely arising from the synergistic decomposition of both SrCO3 and GO components. In contrast, GO alone displayed the lowest enthalpy (2899.7 J g−1), consistent with its relatively simple thermal degradation profile. The TGA/DSC results provide useful insight into electrochemical behavior. The initial weight losses below 150 °C correspond to moisture and occur well above the device operating window (<80 °C), confirming operational stability. The higher organic content in SrO2(et) explains its greater mass loss but also provides additional surface functionalities that enhance pseudocapacitance. GO decomposition around 200–250 °C reflects the removal of oxygen groups that, during cycling, can act as redox-active or degradable sites. The nearly complete decomposition of SrCO3@GO(et) indicates its lower ultimate thermal stability and suggests enhanced surface accessibility and electronic coupling, which is consistent with its higher capacitance and cycling stability. Thus, the thermal data clarify how structural robustness and labile functional groups together influence charge storage and long-term electrochemical performance.
3.9. Cyclic voltammetry (CV)
Cyclic voltammetry (CV) plays a crucial role in examining the ion-electron transfer mechanisms of the prepared electrode materials. It can be used to evaluate the energy density, specific capacitance, and cycling stability of the electrode materials. Fig. 10 presents the CV loops of the prepared materials deposited on nickel foam as the working electrode, with scan rates ranging from 0 to 0.45 V (vs. Ag/AgCl). The CV profiles showed that as the scan rate increased, the enclosed current response also increased, indicating a direct proportionality between the voltammetric current and scan rate.46 | ||
| Fig. 10 Cyclic voltammetry spectra of (a) SrO2(aq), (b) SrO2(et), (c) SrCO3@GO(aq), (d) SrCO3@GO(et), and (e) GO. | ||
The CV curves exhibit a semi-rectangular shape, confirming the pseudocapacitive behavior of the synthesized electrode materials. The presence of distinct redox peaks in all CV curves indicates faradaic reactions, which characterize the oxidation–reduction interactions occurring at the electrode–electrolyte interface. Furthermore, as shown in Fig. 10, the faradaic current peaks become more pronounced with increasing scan rates, while the potential difference between the cathodic and anodic peaks also widens. This phenomenon arises due to the dynamic reactions governing current dissipation. For the synthesized materials, the CV loop area increased in the following order: SrO2(aq) < SrO2(et) < SrCO3@GO(aq) < SrCO3@GO(et) < GO.
The GO-decorated nanocomposite material demonstrated a larger CV loop area compared to pristine SrO2, indicating enhanced reversibility, superior rate capability, and improved power delivery, making it efficient for electrochemical applications. The measured specific capacitance (Csp) values for the electrode materials are displayed in Table 1.
| Current density | 10 mVs−1 | 20 mVs−1 | 30 mVs−1 | 40 mVs−1 | 50 mVs−1 |
|---|---|---|---|---|---|
| Specific capacitance (F g−1) | |||||
| SrO2(aq) | 63.64 | 59.46 | 35.26 | 34.2 | 26.08 |
| SrO2(et) | 106.3 | 95.14 | 81.28 | 72.06 | 65.14 |
| SrCO3@GO(aq) | 110.88 | 81.5 | 73.58 | 63.58 | 56.56 |
| SrCO3@GO(et) | 157.82 | 99.96 | 89.28 | 68.28 | 64.02 |
| GO | 307.04 | 3271 | 187.6 | 165.8 | 143.9 |
Table 1 illustrates the relationship between scan rate and Csp, showing that the specific capacitance is enhanced at lower scan rates and decreases at higher scan rates. At low scan rates, the Csp value is maximized due to the sufficient time available for electrolyte ions to undergo complete redox reactions and diffuse into the electrode material. The increased electrochemical activity of the nanocomposite electrode can be due to the improved adsorption of charged particles on its surface and the intercalation/de-intercalation of OH− ions within the SrCO3@GO(et) composite. At a higher scan rate, the Csp value decreases due to limited active sites and an insufficient amount of time for electrolyte ions to adsorb and desorb on the electrode surface, which limits the redox process. SrCO3@GO(et) exhibited the highest specific capacitance, as strong van der Waals interactions within the composite significantly enhance its intrinsic electrical conductivity, facilitating rapid electron transport during electrochemical processes. The unique morphology of SrCO3@GO(et) (as discussed in Section 3.6) offers a high density of active sites, facilitating both capacitive charge storage and ion diffusion. Additionally, the larger enclosed area under the CV curves confirms the dominant charge storage and diffusion-driven mechanisms.
3.10. Galvanic charge–discharge (GCD)
Galvanostatic charge–discharge (GCD) measurements were performed to evaluate the cyclic charge storage capability, energy density, and specific capacitance of the prepared electrodes. Fig. 11 illustrates the CD curves of the SrO2(aq), SrO2(et), SrCO3@GO(aq), SrCO3@GO(et) and GO electrodes at various current densities (1, 2, 3, 4, and 5 mA, respectively) within a voltage window of 0–0.45 V. Fig. 12 displays a graphical comparison between the specific capacitances of all the five investigated nanomaterials. It is well established that GCD curves typically exhibit three distinct regions: (i) an initial fast voltage drop due to internal resistance, (ii) a linear potential-time relationship corresponding to a fast faradaic redox reaction, and (iii) a sloped discharge region indicating pseudocapacitive behavior, which characterizes the electrochemical interactions at the electrode–electrolyte interface. At higher current densities, shorter interaction times during redox reactions result in a decrease in specific capacitance, as reflected in the GCD measurements. GCD profiles also revealed that discharge time was extended at lower current densities, which is attributed to the improved penetration of electrolyte ions into the pores of electrode materials under reduced current conditions.47 | ||
| Fig. 11 Galvanostatic charging and discharging (GCD) behavior of (a) SrO2(aq), (b) SrO2(et), (c) SrCO3@GO(aq), (d) SrCO3@GO(et), and (e) GO. | ||
 | ||
| Fig. 12 Specific capacitance of (a) SrO2(aq), (b) SrO2(et), (c) SrCO3@GO(aq), (d) SrCO3@GO(et), and (e) GO by GCD. | ||
Table 2 displays the specific capacitance (Csp), power density (P.D.), and energy density (E.D.) of the M. oleifera-mediated NMs. The observed correlation between energy density and specific capacitance suggests that the enhanced electrochemical performance of the nanocomposites arises from rapid faradaic redox processes at the electrode–electrolyte interface. It was found that the specific capacitance (Csp, F g−1) of the synthesized materials, measured at current densities of 1, 2, 3, 4, and 5 mA, decreased in the following order (Table 2): SrCO3@GO(et) > SrO2(et) > SrCO3@GO(aq) > SrO2(aq). The obtained results thus confirm that the Csp of both GO-decorated SrCO3@GO(et) and SrCO3@GO(aq) is higher than that of their respective SrO2(et) and SrO2(aq) counterparts. Moreover, the ethanolic extract-based SrCO3@GO(et) and SrO2(et) showed higher performance than their aqueous extract-based SrCO3@GO(aq) and SrO2(aq) counterparts, respectively. The highest specific capacitance (292.59 F g−1) was displayed by the GO-based SrCO3@GO(et) composite, highlighting its potential as a high-performance supercapacitor material compared with the other synthesized samples. Notably, this value (Csp = 292.59 F g−1) is significantly higher than those previously reported for related Sr- and GO-based materials (Csp = 62.4–276.1 F g−1), as summarized in Table 3.
| Current density (mA) | C sp (F g−1) | E.D. (Wh kg−1) | P.D. (kW kg−1) |
|---|---|---|---|
| SrO2(aq) | |||
| 1 mA | 173.33 | 3.12 | 11.23 |
| 2 mA | 145.67 | 2.62 | 9.44 |
| 3 mA | 130.86 | 2.36 | 8.48 |
| 4 mA | 102.10 | 1.84 | 6.62 |
| 5 mA | 85.81 | 1.54 | 5.56 |
| SrO2(et) | |||
| 1 mA | 183.81 | 3.31 | 11.91 |
| 2 mA | 160.95 | 2.90 | 10.43 |
| 3 mA | 137.43 | 2.35 | 8.45 |
| 4 mA | 111.33 | 2.00 | 7.21 |
| 5 mA | 101.90 | 1.83 | 6.60 |
| SrCO3@GO(aq) | |||
| 1 mA | 180.59 | 3.25 | 11.70 |
| 2 mA | 150.52 | 2.71 | 9.76 |
| 3 mA | 137.63 | 2.48 | 8.93 |
| 4 mA | 120.04 | 2.16 | 7.78 |
| 5 mA | 100.15 | 1.80 | 6.48 |
| SrCO3@GO(et) | |||
| 1 mA | 292.59 | 5.26 | 18.94 |
| 2 mA | 268.52 | 3.03 | 10.91 |
| 3 mA | 152.63 | 2.75 | 9.90 |
| 4 mA | 137.04 | 2.47 | 8.89 |
| 5 mA | 123.15 | 2.22 | 7.99 |
| GO | |||
| 1 mA | 329.43 | 5.93 | 21.35 |
| 2 mA | 292.95 | 5.27 | 18.98 |
| 3 mA | 237.14 | 4.27 | 15.37 |
| 4 mA | 138.10 | 2.49 | 8.95 |
| 5 mA | 123.81 | 2.23 | 8.02 |
| Electrode material | Synthetic method | Morphology | Electrolyte | C sp (F g−1) | Ref. |
|---|---|---|---|---|---|
| SrO-polyaniline | Blending | Nanorods | 1 M KOH | 258 | 48 |
| SrRuO3-rGO | Mixing | SrRuO3 particles covered with rGO sheets | 1 M KOH | 160 | 49 |
| 1 M NaNO3 | 62.4 | ||||
| 1 M H3PO4 | 101 | ||||
| SrFeO3 perovskite | Sol–gel method | Rough and highly porous | 1 M KOH | 101.69 | 50 |
| SrCoO3 | Sol–gel method | Porous | 1 M KOH | 68.639 | 50 |
| Sr2Ni2O5@15%rGO | Solvothermal | Spherical | 2 M KOH | 148.09 | 51 |
| rGO/SrO | Hydrothermal | Nanorods | 6 M KOH | 271 | 52 |
| rGO@Co3O4/CoO | Solvothermal | Co3O4/CoO NPs uniformly distributed inside rGO nanosheets | 0.1 M KOH | 276.1 | 53 |
| La0.85Sr0.15MnO3 | Sol–gel | Nano sphere | 3 M KOH | 248 | 54 |
| SrTiO3 | Microwave | Nano cube | 1 M KCl | 208.47 | 55 |
| SrO–RuO2/PVA | Hydrothermal | Nanofibers | 1 M KOH | 192 | 56 |
| SrCO3@GO(et) | M. oleifera-mediated | Porous, fluffy, and flower-like | 6 M KOH | 292.59 | This work |
To further evaluate the practical energy storage capability, the energy and power densities of all electrode materials were calculated from the GCD data and represented in Ragone plots (Fig. 13). The SrCO3@GO(et) nanocomposite shows the best balance, delivering higher energy density at a given power density compared to the remaining M. oleifera-mediated nanomaterials. In contrast, SrO2(aq) and SrO2(et) electrodes exhibited lower energy densities, which are consistent with their lower Csp values. These results confirm that GO decoration and optimized morphology significantly enhance the energy–power characteristics of the electrodes, making them competitive with other reported supercapacitor materials.
 | ||
| Fig. 13 Ragone plot of M. oleifera-mediated materials. | ||
4. Conclusions
We successfully synthesized SrO2(aq) and SrO2(et) NPs and their GO-decorated SrCO3@GO(aq) and SrCO3@GO(et) NCs using aqueous and ethanolic extracts of Moringa oleifera leaves as reducing, capping and stabilizing agents. The XRD analysis confirmed well-defined crystalline structures, with GO incorporation reducing crystallite sizes. FTIR analysis confirmed Sr–O vibrations and the presence of GO and phytochemical-derived organic moieties capping the NPs. SEM analysis revealed that SrO2(aq) and SrO2(et) exhibit distinct morphologies influenced by solvent systems, with SrO2(et) forming well-defined polyhedral nanoparticles and SrO2(aq) showing larger, partially aggregated particles. GO decoration significantly reduced particle sizes and introduced wrinkled, porous structures in SrCO3@GO(aq) and SrCO3@GO(et), with SrCO3@GO(et) displaying a highly porous, flower-like morphology. EDX analysis verified the presence of Sr, O and C atoms in the NMs. The average crystallite and particle sizes were decreased when moving from SrO2(aq) and SrO2(et) to their respective SrCO3@GO(aq) and SrCO3@GO(et) NCs. UV-Vis analysis confirmed the successful integration of SrO2 NPs with GO, with SrCO3@GO(et) showing the lowest band gap (4.65 eV). TGA-DSC analysis (up to 1000 °C) revealed multi-stage decomposition with total mass losses of 14.51, 45.26, 63.10, 61.48 and 99.64% for SrO2(aq), SrO2(et), GO, SrCO3@GO(aq) and SrCO3@GO(et), with corresponding enthalpies (normalized) of 6443.0, 3827.4, 2899.7, 5667.4, and 31511 J g−1, respectively, indicating distinct thermal stability profiles. CV analysis confirmed the pseudocapacitive behavior of all materials, with SrCO3@GO(et) exhibiting the largest CV loop area and highest specific capacitance, owing to its enhanced electrical conductivity and abundant active sites. GCD measurements further demonstrated that SrCO3@GO(et) delivered the highest specific capacitance (292.59 F g−1) and exceptional energy–power characteristics among all samples. The synergistic effects of M. oleifera ethanolic extract–derived phytochemicals, effective GO decoration, reduced crystallite and particle sizes, and the formation of a porous, flower-like nanostructure underpin the outstanding electrochemical performance of SrCO3@GO(et), establishing it as a highly promising electrode material for advanced energy storage applications. Nevertheless, Sr-based phases may undergo surface reactions in alkaline electrolytes, and device-level translation requires further optimization of parameters such as mass loading, binders, and current collectors. Although full device integration was not performed, the stable CV/GCD behavior, robust TGA/DSC profiles, and GO-stabilized morphology suggest good electrochemical resilience under test conditions. Future studies should address device engineering and targeted stability studies to confirm long-term performance. This study can be extended to the evaluation of M. oleifera-mediated Sr-based NMs for other energy storage devices, solar cells and testing of their electrocatalytic water splitting potential.
Conflicts of interest
There are no conflicts to declare.Data availability
All the data will be provided upon request.Acknowledgements
The authors extend their appreciation to the University Higher Education Fund for funding this research work under Research Support Program for Central labs at King Khalid University through the project number CL/PRI/A/5.References
- M. Z. Iqbal, U. Aziz, M. W. Khan, S. Siddique, M. Alzaid and S. Aftab, Strategies to enhance the electrochemical performance of strontium-based electrode materials for battery-supercapacitor applications, J. Electroanal. Chem., 2022, 924, 116868 CrossRef CAS.
- P. Agale, V. Salve, S. Arade, S. Balgude and P. More, Tailoring structural and chemical properties of ZnO@g-C3N4 nanocomposites through Sr doping: Insights from Multi technique characterization, Solid State Sci., 2025, 107960 CrossRef CAS.
- S. Mukherjee and M. Mishra, Application of strontium-based nanoparticles in medicine and environmental sciences, Nanotechnol. Environ. Eng., 2021, 6, 25 CrossRef CAS.
- A. Saravanan, P. S. Kumar, R. Hemavathy, S. Jeevanantham, P. Harikumar, G. Priyanka and D. R. A. Devakirubai, A comprehensive review on sources, analysis and toxicity of environmental pollutants and its removal methods from water environment, Sci. Total Environ., 2022, 812, 152456 CrossRef CAS PubMed.
- A. Márquez-Herrera, V. M. Ovando-Medina, B. E. Castillo-Reyes, M. Meléndez-Lira, M. Zapata-Torres and N. Saldaña, A novel synthesis of SrCO3–SrTiO3 nanocomposites with high photocatalytic activity, J. Nanopart. Res., 2014, 16, 1–10 CrossRef.
- M. A. Alavi and A. Morsali, Syntheses and characterization of Sr(OH)2 and SrCO3 nanostructures by ultrasonic method, Ultrason. Sonochem., 2010, 17, 132–138 CrossRef CAS PubMed.
- N. Amghar, C. Ortiz, A. Perejón, J. M. Valverde, L. P. Maqueda and P. E. S. Jiménez, The SrCO3/SrO system for thermochemical energy storage at ultra-high temperature, Sol. Energy Mater. Sol. Cells, 2022, 238, 111632 CrossRef CAS.
- S. A. Ehsanizadeh, A. S. Abbas, F. S. Razavi, E. A. Dawi, A. M. Ibrahim and M. Salavati-Niasari, Facile synthesis and characterization of SrMnO3/SrCO3 nanocomposites by Pechini sol-gel method as efficient and innovated active materials for electrochemical hydrogen storage application, Int. J. Hydrogen Energy, 2024, 60, 392–401 CrossRef CAS.
- Z. Wang, G. He, H. Yin, W. Bai and D. Ding, Evolution of controllable urchin-like SrCO3 with enhanced electrochemical performance via an alternative processing, Appl. Surf. Sci., 2017, 411, 197–204 CrossRef CAS.
- S. A. Ehsanizadeh, M. Goudarzi, E. A. Dawi, F. H. Alsultany, A. M. Aljeboree and M. Salavati-Niasari, Green auto-combustion synthesis of SrNiO3/NiO/SrCO3 ferromagnetic-nanocomposites in the presence carbohydrate sugars and their application as photocatalyst for degradation of water-soluble organic-pollutants, Alexandria Eng. J., 2024, 108, 206–220 CrossRef.
- Z. K. Ghouri, N. A. Barakat, M. Park, B.-S. Kim and H. Y. Kim, Synthesis and characterization of Co/SrCO3 nanorods-decorated carbon nanofibers as novel electrocatalyst for methanol oxidation in alkaline medium, Ceram. Int., 2015, 41, 6575–6582 CrossRef CAS.
- E. A. Abdelrahman and M. T. Basha, Facile Synthesis and Characterization of SrCO3/MgO/CaO/CaCO3 Novel Nanocomposite for Efficient Removal of Crystal Violet Dye from Aqueous Media, Inorganics, 2025, 13, 112 CrossRef CAS.
- A. Anwar, B. S. Mohammed, M. A. Wahab and M. Liew, Enhanced properties of cementitious composite tailored with graphene oxide nanomaterial-A review, Dev. Built Environ., 2020, 1, 100002 CrossRef.
- Z. Ansari, S. Kadam, S. Kasabe, J. Tripathi, P. Agale, S. Patange and P. More, Optimized Mn doped ZnO@rGO nanocomposites: a breakthrough for advanced energy storage and PEC systems, Ionics, 2025, 1–22 Search PubMed.
- S. Hussain, W. Nazar, A. Tajammal, Z. Nasreen, T. Ahmad, A. Asghar, Z. Mustafa, M. Shahid, K. M. Batoo and S. Hussain, Green Synthesis of TiO2 Nanoparticle in Morus nigra Leaves; Characterization and Biological Potential, Pol. J. Environ. Stud., 2024, 33, 2707–2714 CrossRef CAS PubMed.
- S. Hussain, M. Ali Muazzam, M. Ahmed, M. Ahmad, Z. Mustafa, S. Murtaza, J. Ali, M. Ibrar, M. Shahid and M. Imran, Green synthesis of nickel oxide nanoparticles using Acacia nilotica leaf extracts and investigation of their electrochemical and biological properties, J. Taibah Univ. Sci., 2023, 17, 2170162 CrossRef.
- G. Yasmeen, S. Hussain, A. Tajammal, Z. Mustafa, M. Sagir, M. Shahid, M. Ibrar, Z. M. Elqahtani and M. Iqbal, Green Synthesis of Cr2O3 Nanoparticles by Cassia Fistula, their Electrochemical and Antibacterial Potential, Arabian J. Chem., 2023, 16, 104912 CrossRef CAS.
- A. Murad, M. Sagir, S. Massey, Z. Nasreen, A. Amanullah, T. Ahmad, S. Hussain, A. Kiran, K. M. Al-Anazi and M. A. Farah, Electrocatalytic Water Splitting Potential of Cymbopogon citratus-Mediated Biosynthesized Strontium Oxide Nanoparticles, Pol. J. Environ. Stud., 2025 DOI:10.15244/pjoes/206956.
- N. Pandiyan, B. Murugesan, J. Sonamuthu, S. Samayanan and S. Mahalingam, [BMIM] PF6 ionic liquid mediated green synthesis of ceramic SrO/CeO2 nanostructure using Pedalium murex leaf extract and their antioxidant and antibacterial activities, Ceram. Int., 2019, 45, 12138–12148 CrossRef CAS.
- Y. Hou, S. Lv, L. Liu and X. Liu, High-quality preparation of graphene oxide via the Hummers' method: understanding the roles of the intercalator, oxidant, and graphite particle size, Ceram. Int., 2020, 46, 2392–2402 CrossRef CAS.
- M. Ahsan, S. Shukrullah, A. Hamza, T. Kareri, S. Rahman, M. S. Akond and M. Irfan, Microwave-assisted synthesis and testing of La-doped Mn3O4 nanocomposites for high-performance supercapacitor electrodes, AIP Adv., 2025, 15, 115226 CrossRef.
- T. Munawar, S. Fatima, F. Iqbal, A. Bashir, M. Rafaqat, Z. Tu, L. Shen, S. A. Khan, M. Koc and C.-F. Yan, Enhanced electrochemical performance of ZrTe-Mn2O3 nanocomposite electrocatalyst for HER and OER in alkaline medium, Fuel, 2025, 381, 133197 CrossRef CAS.
- P. Virk, M. A. Awad, S. S. A.-L. Alsaif, A. A. Hendi, M. Elobeid, K. Ortashi, R. Qindeel, M. F. El-Khadragy, H. M. Yehia and M. F. S. El-Din, Green synthesis of Moringa oleifera leaf nanoparticles and an assessment of their therapeutic potential, J. King Saud Univ., Sci., 2023, 35, 102576 CrossRef.
- S. Culas, A. Surendran and J. Samuel, Kinetic studies of the non-isothermal decomposition of strontium nitrate, Asian J. Chem., 2013, 25, 3855 CrossRef CAS.
- D. Harikaran and R. Vijayaraghavan, Strontium peroxide as a potential photocatalyst: rapid degradation of organic and pharmaceutical pollutants, New J. Chem., 2023, 47, 20733–20743 RSC.
- W. A. Halim and A. S. Shalabi, The stability of peroxide ion O22− at (110),(210) and (001) surfaces of MgO, CaO and SrO periodic ab initio calculations, Solid State Commun., 2002, 124, 67–72 CrossRef.
- M. Isah, R. Lawal and S. A. Onaizi, CO2 capture and conversion using graphene-based materials: a review on recent progresses and future outlooks, Green Chem. Eng., 2025, 6, 305–334 CrossRef CAS.
- B. E. Arango Hoyos, H. F. Osorio, E. Valencia Gómez, J. Guerrero Sánchez, A. Del Canto Palominos, F. A. Larrain and J. Prías Barragán, Exploring the capture and desorption of CO2 on graphene oxide foams supported by computational calculations, Sci. Rep., 2023, 13, 14476 CrossRef CAS PubMed.
- S. Kavitha, K. Mohan, K. Deepika, P. Janani, B. Kamali and S. Bhavadharani, The Impact of Zn doping on structural and optical behavior of SrO2 NPs and Anti-Microbial activities for Zn@SrO2 NPs, Mater. Today: Proc., 2023, 94, 1–12 CAS.
- G. Anandhakumari, P. Jayabal, A. Balasankar, S. Ramasundaram, T. H. Oh, K. Aruchamy, P. Kallem and V. Polisetti, Synthesis of strontium oxide-zinc oxide nanocomposites by Co-precipitation method and its application for degradation of malachite green dye under direct sunlight, Heliyon, 2023, 9, e20824 CrossRef CAS PubMed.
- E. Ciliberto, G. Condorelli, S. La Delfa and E. Viscuso, Nanoparticles of Sr(OH)2: synthesis in homogeneous phase at low temperature and application for cultural heritage artefacts, Appl. Phys. A: Mater. Sci. Process., 2008, 92, 137–141 CrossRef CAS.
- G. Kandhola, A. Djioleu, K. Rajan, N. Labbé, J. Sakon, D. J. Carrier and J.-W. Kim, Maximizing production of cellulose nanocrystals and nanofibers from pre-extracted loblolly pine kraft pulp: a response surface approach, Bioresour. Bioprocess., 2020, 7, 19 CrossRef.
- A. D. French, Idealized powder diffraction patterns for cellulose polymorphs, Cellulose, 2014, 21, 885–896 CrossRef CAS.
- S. Ni, X. Yang and T. Li, Hydrothermal synthesis and photoluminescence properties of SrCO3, Mater. Lett., 2011, 65, 766–768 CrossRef CAS.
- W. Gul and H. Alrobei, Effect of graphene oxide nanoparticles on the physical and mechanical properties of medium density fiberboard, Polymers, 2021, 13, 1818 CrossRef CAS PubMed.
- S. Hegazy, N. A. Abdelwahab, A. M. Ramadan and S. K. J. N. M. Mohamed, Magnetic Fe3O4-grafted cellulose/graphene oxide nanocomposite for methylene blue removal from aqueous solutions: Synthesis and characterization, Next Mater., 2024, 3, 100064 CrossRef.
- M. M. Rahman, M. M. Hussain and A. M. Asiri, A novel approach towards hydrazine sensor development using SrO· CNT nanocomposites, RSC Adv., 2016, 6, 65338–65348 RSC.
- D. Pavia, G. Lampman, G. Kriz and J. Vyvyan, Introduction to spectroscopy 4th edition, Cram 101 Learning system, 2012, pp. 15–85 Search PubMed.
- C. Bulin, R. Zheng, J. Song, J. Bao, G. Xin and B. Zhang, Magnetic graphene oxide-chitosan nanohybrid for efficient removal of aqueous Hg(Π) and the interaction mechanism, J. Mol. Liq., 2023, 370, 121050 CrossRef CAS.
- M. Handayani, K. A. A. Kepakisan, I. Anshori, N. Darsono and Y. T. Nugraha, Graphene oxide based nanocomposite modified screen printed carbon electrode for qualitative cefixime detection, in AIP Conference Proceedings, AIP Publishing LLC, 2021, vol. 2382, no. 1, p. 040005 Search PubMed.
- K. Brijesh and H. J. J. o E. M. Nagaraja, Lower band gap Sb/ZnWO4/r-GO nanocomposite based supercapacitor electrodes, J. Electron. Mater., 2019, 48, 4188–4195 CrossRef CAS.
- F. El-Sayed, M. S. Hussien, T. AlAbdulaal, A.-H. Abdel-Aty, H. Zahran, I. Yahia, M. S. Abdel-wahab, E. H. Ibrahim, M. A. Ibrahim and H. Elhaes, Study of catalytic activity of G-SrO nanoparticles for degradation of cationic and anionic dye and comparative study photocatalytic and electro & photo-electrocatalytic of anionic dye degradation, J. Mater. Res. Technol., 2022, 20, 959–975 CrossRef CAS.
- P. G. Trejo-Flores, Y. Sánchez-Roque, H. Vilchis-Bravo, Y. D. C. Pérez-Luna, P. E. Velázquez-Jiménez, F. Ramírez-González, K. M. Soto Martínez, P. López de Paz, S. Saldaña-Trinidad and R. Berrones-Hernández, Evaluation of Aqueous and Ethanolic Extracts for the Green Synthesis of Zinc Oxide Nanoparticles from Tradescantia spathacea, Nanomaterials, 2025, 15, 1126 CrossRef CAS.
- V. Salve, P. Agale, S. Balgude, S. Mardikar, S. Dhotre and P. More, Enhanced photocatalytic activity of SnO2@gC3N4 heterojunctions for methylene blue and bisphenol-A degradation: effect of interface structure and porous nature, RSC Adv., 2025, 15, 15651–15669 RSC.
- A. Bouibed, R. Doufnoune and M. Ponçot, An easy and innovative one-step in situ synthesis strategy of silica nanoparticles decorated by graphene oxide particles through covalent linkages, Mater. Res. Express, 2020, 6, 1250–1254 CrossRef.
- P. Agale, V. Salve, K. Patil, S. Mardikar, S. Uke, S. Patange and P. More, Synthesis, characterization, and supercapacitor applications of Ni-doped CuMnFeO4 nano Ferrite, Ceram. Int., 2023, 49, 27003–27014 CrossRef CAS.
- V. Salve, P. Agale, A. Rokade, M. Kamble, S. Patange and P. More, Zn1−xCoxMn1−xFexCrO4 ferrichromate: an efficient material for high performance supercapacitor applications, New J. Chem., 2023, 47, 20653–20667 RSC.
- M. Z. Iqbal, S. Alam, A. M. Afzal, M. J. Iqbal, K. Yaqoob, M. A. Kamran, M. R. A. Karim and T. Alherbi, Binary composites of strontium oxide/polyaniline for high performance supercapattery devices, Solid State Ionics, 2020, 347, 115276 CrossRef CAS.
- A. Galal, H. K. Hassan, T. Jacob and N. F. Atta, Enhancing the specific capacitance of SrRuO3 and reduced graphene oxide in NaNO3, H3PO4 and KOH electrolytes, Electrochim. Acta, 2018, 260, 738–747 CrossRef CAS.
- M. Ahangari, E. Mahmoodi, N. Delibaş, J. Mostafaei, E. Asghari and A. Niaei, Application of SrFeO3 perovskite as electrode material for supercapacitor and investigation of Co-doping effect on the B-site, Turk. J. Chem., 2022, 46, 1723–1732 CrossRef CAS.
- F. Ahmad, M. A. Khan, U. Waqas, S. M. Ramay and S. Atiq, Elucidating an efficient super-capacitive response of a Sr2Ni2O5/rGO composite as an electrode material in supercapacitors, RSC Adv., 2023, 13, 25316–25326 RSC.
- S. K. Godlaveeti, A. R. Somala and R. R. Nagireddy, Efficient electrochemical performance of the RGO/SrO nanorods prepared by the hydrothermal method, Appl. Phys. A: Mater. Sci. Process., 2023, 129, 303 CrossRef CAS.
- R. Kumar, S. Sahoo, W. K. Tan, G. Kawamura, A. Matsuda and K. K. Kar, Microwave-assisted thin reduced graphene oxide-cobalt oxide nanoparticles as hybrids for electrode materials in supercapacitor, J. Energy Storage, 2021, 40, 102724 CrossRef.
- J. Zheng, H. Zhao, X. Guo, X. Jin, L. Wang, S. Dong and J. Chen, Enhanced electrochemical performance of LaMnO3 nanoparticles by Ca/Sr doping, Coatings, 2023, 14, 20 CrossRef CAS.
- V. Deshmukh, C. Ravikumar, M. A. Kumar, S. Ghotekar, A. N. Kumar, A. Jahagirdar and H. A. Murthy, Structure, morphology and electrochemical properties of SrTiO3 perovskite: Photocatalytic and supercapacitor applications, Environ. Chem. Ecotoxicol., 2021, 3, 241–248 CrossRef CAS.
- T.-S. Hyun, H.-G. Kim and I.-D. Kim, Facile synthesis and electrochemical properties of conducting SrRuO3–RuO2 composite nanofibre mats, J. Power Sources, 2010, 195, 1522–1528 CrossRef CAS.
| This journal is © The Royal Society of Chemistry 2026 |