
 Open Access Article
 This Open Access Article is licensed under a
 Creative Commons Attribution 3.0 Unported Licence
Life cycle carbon accounting and waste valorisation in litchi supply chains for climate-resilient food systems
Neha
Singh
a,
Rohit
Biswas
b and
Mamoni
Banerjee
 *a
*a
aRajendra Mishra School of Engineering Entrepreneurship, Indian Institute of Technology Kharagpur, Kharagpur, WB-721302, India. E-mail: mamoni@see.iitkgp.ac.in; Tel: +91-3222-2304890
bAgricultural & Food Engineering, Indian Institute of Technology Kharagpur, Kharagpur, WB-721302, India
First published on 28th November 2025
Abstract
The growing environmental concerns necessitate sustainability assessment in agricultural food systems. The present study quantified carbon emissions in litchi supply chains using a circular tiered hybrid-life cycle assessment (CrTH-LCA) framework, accompanied by carbon emission forecasting, using statistical (ARIMA and Prophet) and deep learning (LSTM and GRU) models, along with an economic feasibility assessment of waste valorisation. This study estimated a total carbon footprint of 7305.17 kgCO2-e ha−1, with household waste (40.44%) and cultivation (31.96%) identified as the major contributors. Carbon absorption and waste valorisation contributed to mitigation strategies, offering an economic potential of $2607.02 per hectare, with waste valorisation alone accounting for 63.06% of the total carbon emissions offset. The Monte Carlo simulation confirmed fertilizer and household wastages as the key uncertainty drivers. Forecasting using deep learning (LSTM) models achieved a high predictive accuracy (MAE = 34.92; RMSE = 35.62), projecting an upward trend in future emissions and emphasizing the need for adaptive mitigation strategies. Based on the six-year forecast trend, a community-based biogas model at the farmer-level demonstrated strong financial feasibility, achieving a high return on investment of 164.01% with a payback period of 28 months. Overall, the study offers a replicable and data-driven framework, linking life cycle assessment, circular waste management, and forecasting for a climate resilient decision-making. Aligning with SDGs 2, 12, and 13, the findings emphasize policy shifts via strengthening carbon crediting and targeted financial incentives, such as leveraging government subsidies and carbon finance, to enhance farmers' income, promote waste-to-energy valorisation, and accelerate India's transition to a low-carbon, circular agri-food system.
Sustainability spotlightThis study advances sustainable food systems by developing a circular tiered hybrid life cycle assessment (CrTH-LCA) framework to evaluate and reduce carbon emissions in the litchi supply chain. By integrating circular economy strategies, such as waste valorisation into biofuel and compost, alongside the carbon sequestration potential of orchards, this approach identifies mitigation pathways that could reduce emissions by over 60%. The study also applies AI-driven forecasting models (LSTM and GRU) to predict emissions under changing production and climate conditions. The findings provide actionable insights for reducing the environmental impacts by enhancing the resource efficiency and creating carbon credit opportunities, thereby directly contributing to SDG 12 (responsible consumption and production) and SDG 13 (climate action). |
1. Introduction
Litchi (Litchi chinensis Sonn.) is a high-value fruit in India's horticultural sector, with Bihar accounting for approximately 45% of its national production.1 The geographical indication (GI)-tagged Shahi litchi of Muzaffarpur district offers significant export and economic values with supply to major cities through a perishable supply chain that spans from farmers to consumers, making way through wholesalers and retailers. Despite its economic importance, the litchi supply chain faces sustainability challenges like shorter shelf life, high perishability, and reliance on non-refrigerated vehicles that exacerbates post-harvest losses.2 The losses are further aggravated due to inadequate handling, microbial spoilage, and environmental stress, leading to carbon emissions (CEs).1,2 The carbon footprint of agricultural supply chain (ASC) accounts for over 24% of the global green-house gas (GHG) emissions3 and nearly 30% of global energy consumption.4 Thus, evaluation of carbon footprint (CF) is necessary toward designing low-emission, climate-resilient food systems.Life cycle assessment (LCA), particularly the process-based approach, is a widely accepted systematic method for quantifying the environmental impacts of a product throughout its life cycle, from raw material sourcing to its final disposal. In process-based LCA, individual processes involved in the product system (e.g., cultivation, packaging, and transport) are modelled using detailed, site-specific input–output data. The LCA bottom-up method offers high resolution and accuracy, making it especially useful for analysing litchi supply chains.5 The limitations of current environmental modelling approaches, from LCA to emission prediction, reveal a critical gap: the inability to integrate macro-scale economic models with high-resolution, micro-level operational and climatic data. Traditional LCAs partially address the truncation errors of process-based models,6 but remain too coarse to capture the demands of the circular economy (CrE) systems.7 Furthermore, conventional hybrid models struggle to effectively integrate detailed, site-specific process data such as specific irrigation energy or fertilizer application rates with macro-level upstream data.8 In agricultural supply chains, critical flows like emissions from fruit respiration and the proper allocation of environmental credits/burdens from diverting post-harvest losses (e.g., to composting or biogas) are often overlooked, leading to incomplete assessments. Similarly, emission studies rely heavily on macro-scale economic models,9,10 failing to capture micro-level agricultural variations due to insufficient integration of climatic factors like temperature and rainfall.11,12 Few studies employ advanced deep learning models (LSTM and GRU) for micro-scale agricultural carbon emission (ACE) prediction that explicitly incorporate climatic and area-specific variables.13 This highlights the need for a refined framework bridging traditional macro-scale approaches with localised, climate-sensitive ACE forecasting.
Despite a substantial body of research on ASCs and its associated CEs, several critical gaps persist that constrain the advancement of robust predictive and decision-support frameworks:
• The interlinkage between post-harvest losses and lifecycle CEs remains inadequately addressed, despite such losses constituting a significant share of total emissions.
• The carbon offset potential of waste valorisation pathways (composting, biogas generation, and nutrient recycling) has not been systematically integrated into lifecycle assessments.
• The role of carbon credit mechanisms and related financial instruments in fostering sustainable adoption among stakeholders is largely unexplored.
• Existing forecasting studies predominantly employ univariate approaches, overlooking essential multivariate drivers (e.g., cultivated area, climatic variability, and input intensity) that critically influence both productivity and emissions.
The present study addresses these critical gaps with a novel circular tiered hybrid life cycle assessment (CrTH-LCA) framework combined with a univariate/multivariate forecasting approach for carbon emission estimation. The proposed framework overcomes the existing gaps through a dynamically tiered hybrid structure. The framework ensures the system boundary completeness while explicitly integrating circularity metrics and high-resolution technical data into the process-LCA foreground. The CrTH-LCA framework has linked physical and environmental flows with technical performance, enabling precise, quantitative evaluation of circular supply chain strategies along with waste recyclability and disposal achieving a level of granularity and coverage not attained by existing hybrid models. Complementing this, the multivariate forecasting framework of statistical (ARIMA, Prophet) and deep learning (LSTM, GRU) models enables accurate, context-specific predictions by capturing nonlinear patterns, temporal dependencies, and interactions among multiple influencing factors. The present study combined approach bridges macro-scale forecasting with localized, climate-sensitive ACE predictions. In supply chains, spoiled or damaged produce are often subjected to composting, biogas generation, or animal feed production further adding toll to the overall CF.
The primary objectives of the study are:
• Quantify stage-wise CEs using CrTH-LCA and assess the carbon offset potential from CrE strategies, including composting and biogas generation.
• Explore the feasibility of carbon credit mechanism towards incentivizing sustainable practices in the horticulture supply chain.
• Forecast CEs using time series-based statistical and deep learning models incorporating both production and climatic variables (e.g., area, temperature, and rainfall) as input variables to improve the prediction accuracy.
The integrative approach advances the methodological rigor of carbon assessment in horticultural systems and provides scalable insights for sustainable supply chain design. The study also supports policy alignment with global sustainability goals, particularly SDG 12 (responsible consumption and production) and SDG 13 (climate action). Following the introduction, which establishes the context of carbon emissions, life cycle assessment, and forecasting. Section 2 provides a detailed literature review covering carbon emissions, life cycle assessment approaches, circular economy perspectives, and forecasting models. Section 3 outlines the comprehensive methodology adopted for estimating and forecasting carbon emissions across the supply chain. Section 4 presents and critically discusses the empirical results, including the identification of carbon emission hotspots and forecasting outcomes. Finally, Section 5 summarizes the key conclusions and highlights the theoretical contributions as well as policy implications of the study.
2. State of the art
The increasing global demand for food, coupled with the urgency of mitigating climate change, has spurred extensive research into the environmental impacts on agrifood systems.14 Within this domain, fresh produce supply chains are of particular interest due to their essential role in nutrition, complexity, and often globalized nature.12,15 The literature review synthesizes current insights into CEs in fresh produce supply chains, focusing on LCA, emission hotspots, influencing factors, mitigation strategies, and predictive modelling.2.1. Carbon emissions in fresh produce supply chains
CFs of fresh fruits vary considerably due to differences in nutrient requirements, farming practices, fertilizer use, climatic conditions, and system boundaries.12,16 Although fruits and vegetables generally exert a lower environmental impact than dairy, meat, and fish products,7 their footprints vary substantially across production systems (conventional vs. organic), geographic origins, and transport distances. Table 1 synthesizes the key studies assessing the CFs of agri-food, emphasizing variations across production methods, regions, and supply chain stages.| Study | Key findings | Gaps/limitations | References |
|---|---|---|---|
| Systematic review and meta-analysis of 369 LCA studies of 168 varieties of fresh produce; at regional distribution centre (RDC) | Grains, fruit, and vegetables had the lowest impact | LCA excluded most end-of-life activities (food storage, disposal) | Clune et al.17 and Martin-Gorriz et al.18 |
| Systematic review using PA-LCA of fruits, predominantly cradle-to-farm-gate | Production stage is the primary hotspot | Whole-of-life CF under-represented; carbon sequestration largely ignored | Subedi et al.14 |
| Analysis of production technology of frozen vegetable-based products; field-to-gate basis | Freezing fruits and vegetables is energy-intensive; refrigeration is the main source of CO2-e emissions in frozen products | Limited systemic transitioning to low-emission food production using CO2-e metrics | Liu et al.19 and Wróbel-Jędrzejewska and Polak20 |
| Cradle-to-farm-gate emission factors of fresh fruit and vegetables | Quantified the substantial embedded emissions arising from avoidable food losses due to cosmetic standards | Emissions from beyond farm supply chain stages omitted | Porter et al.21 and Porter et al.22 |
| Multilinear regression and stochastic frontier analysis of imported fruits and vegetables were applied on cradle-to-consumer/disposal | Transportation and sales/distribution are the two key factors of CO2-e. Transportation increases CO2 emissions by 10 tonnes per tonne of imported F&V | Food waste and packaging excluded from redefined LCA due to data gaps and complexity | Ferguson Aikins and ramanathan23 |
| Integrated framework of ecologically based life cycle assessment and linear programming (DEA) for ecological performance assessment of 54 agricultural and food industries sectors | Grain farming, dairy food, and animal production-related sectors had the greatest shares in environmental impact | LCA limited by inconsistent impact indicators and high uncertainty; cradle-to-grave boundaries needed to include use and EoL phases | Park et al.24 |
2.2. Circular life cycle assessment
LCA has emerged as a fundamental methodology for evaluating environmental impacts on fruit production, with its application increasing significantly since 2005.15 The integration of LCA with sensitivity analysis enhances analytical robustness by offering comprehensive insights into system-wide emissions and enabling more transparent sustainability evaluations.14,15,25 Furthermore, embedding the circular economy (CrE) perspective within LCA frameworks strengthens sustainability outcomes by promoting the valorisation of post-harvest waste in fruit supply chains.26Table 2 presents the key studies that have applied circular life cycle assessment (circular LCA) in agri-food systems, highlighting methodological advancements and sustainability implications.| Study | Key findings | Gaps/limitations | References |
|---|---|---|---|
| Critical comparison of LCA case studies highly heterogeneous, cradle-to-gate with system expansion of olive oil | Major hotspots: agricultural phase (fertilization/pesticides). Transport and energy in husk processing | Lack of data on circular processes | Arzoumanidis et al.7 |
| Process-based LCA (farm-to-shelf) of fresh pineapple | Farming stage constitutes 60% of CF; and N2O emissions occur from fertilizer application | The study did not include any evaluation of waste valorisation | Ingwersen27 |
| Consequential LCA (C-LCA) of wine supply chain | Packaging and transportation were identified as major hotspots | The end-of-life phase is often omitted, excluding assessment of recyclability | Arzoumanidis et al.7 |
| Bibliometric analysis combined with network and content analyses. Classified papers by TBL pillar and supply chain phase of agrifood supply chain | The environmental pillar received greater attention compared to the economic and social pillars | Few studies address the post-consumption phase of agri-food supply chains and lack circular economy | Agnusdei and Coluccia28 |
| Hybrid LCA (integrated process-based LCA with input-output analysis (IOA)) of pasta | Focused on inventory refinement for impacts due to fertilizers and pesticides | Hybrid approach avoids closed-loop incompleteness; IO-LCA works best with traditional LCA to prevent missing data or errors | Arzoumanidis et al.7 |
2.3. Carbon emission prediction models
For proactive climate planning, predictive models are essential to anticipate future emissions. Impact factor models such as IPAT, Kaya, and STIRPAT help identify major emission drivers but are often constrained by data subjectivity and limited analytical scope. In contrast, time series models like ARIMA and advanced deep learning techniques such as SVM, LSTM, and GRU are increasingly utilized for their ability to capture complex nonlinear patterns in historical emission data.10Table 3 summarizes the recent studies employing these predictive modelling approaches, highlighting their methodologies, data requirements, and forecasting accuracy in emission analysis.| Study | Key findings | Gaps | References |
|---|---|---|---|
| Utilizes machine learning (ML) and deep learning (DL) techniques in forecasting models in agri-fresh supply chains | ML and DL improve demand forecasting, reducing supply-demand mismatches and high inventory or transport costs | ML and DL enhance demand prediction, reducing supply-demand mismatches and inventory or transport costs | Kumar and Agrawal29 |
| Deep learning approach: LSTM neural network optimized using tree-structured Parzen estimator Bayesian optimization in agricultural carbon emissions | TPEBO-LSTM achieved high performance; LSTM effectively handles multiple time-variable inputs with superior accuracy and stability over traditional ML models | Need to analyze micro-scale data to refine forecasts | Xie et al.13 |
| Comparative univariate time series modeling using SARIMA, LSTM, and GRU in global sulfur hexafluoride emissions | LSTM showed the best performance; and GRU was preferred for faster, and more efficient computation | All unexpected or sudden external factors constitute an important limitation for forecast models | Tuğba Önder30 |
| Comparative univariate time series modelling using SARIMA, LSTM, and GRU global methane emission | SARIMA performed best; with GRU offering faster results using fewer parameters | Models use only historical data (univariate modelling) | Önder31 |
| Comparative analysis of ARIMA and Prophet forecasting model. Performance assessed in strawberry-cultivating greenhouse | The ARIMA model outperformed the Prophet model across all data collection intervals | Integration of other variables (e.g., temperature, humidity, ventilation) into the prediction models is lacking | Shin et al.32 |
3. Methodology
The present research employs a circular tiered hybrid life cycle assessment (CrTH-LCA) framework to evaluate CEs across the supply chain. The methodological integrates life cycle inventory modelling, circular economy interventions with carbon credit adjustment mechanism, and time-series forecasting, to enable a comprehensive and forward-looking carbon mapping approach. Fig. 1 illustrates the overall research framework and methodological flow adopted in this study. | ||
| Fig. 1 Flowchart illustrating the research methodology for quantifying carbon emissions in litchi supply chains. | ||
3.1. Supply chain mapping and system boundary definition
The present study analyses the flow of litchi through the designated supply chain from farm to consumer, integrating various operations required for the movement. The study included certain assumptions, which are listed as follows:(i) The land area used for estimation was one hectare with one hundred trees.
(ii) Total yield of litchi per hectare was taken as 7754 kg.33
(iii) Muzaffarpur was taken as source location for farm.
(iv) Delhi was taken as destination location with a total travel time of 35 h.
(v) Non-refrigerated truck was considered for transportation.1
(vi) No loss is considered during the packaging and transportation stages, as losses are accounted during the cultivation and distribution stage only.
The data used in this study were based on secondary data sources. The data were systematically sourced mainly from peer-reviewed scientific publications indexed within the Scopus or Web of Science database, official government reports, and statistical releases from national and international agencies.
Based on these assumptions, a comprehensive assessment on the sustainability of the litchi supply chain from Muzaffarpur to Azadpur mandi in Delhi (∼1000 km) was done by analysing CEs and energy use across six interconnected stages: input application, cultivation and harvesting, post-harvest handling, transportation, distribution, and end-of-life management (composting organic waste and reusing packaging), as shown in Fig. 2. This study adopts the internationally recognized framework established by the Society of Environmental Toxicology and Chemistry (SETAC), IPCC tier 3 model, and the ISO, particularly the principles and framework outlined in ISO 14040 (Environmental Management-LCA-Principles and Frameworks), which builds upon the SETAC framework.34 Using a CrTH-oriented, process-based LCA framework, the research identifies emission hotspots and explores opportunities for resource recovery and waste valorisation.
 | ||
| Fig. 2 Production of litchi and its flow through the supply chain. | ||
The system boundary adopts a cradle-to-circular reintegration perspective with a circularity of outputs back into the system, integrating both material and energy flows. Energy inputs such as diesel, electricity, and fuel are traced throughout the chain, providing a comprehensive estimate of direct and indirect CO2 emissions. To ensure consistent evaluation of CEs and energy consumption, the functional unit is defined kilogram of litchi or litchi produced per hectare delivered from the farm to the market. The weight-based approach facilitates comparisons across various stages and systems, aligning with market standards and circular economy objectives.
3.2. Carbon emission accounting approach
 | (1) |
| Component | Emission factor | Reference |
|---|---|---|
| Urea (εf,U) | 2.02 kgCO2-e per kg urea | Kumar et al.36 |
| Diammonium phosphate (DAP) (εf,D) | 1.84 kgCO2-e per kg DAP | |
| Muriate of potash (MAP) (εf,M) | 0.25 kgCO2-e per kg MAP | |
| Farmyard manure (FYM) (εf,FY) | 0.89 kgCO2-e per kg FYM | Mori37 |
| Surface water irrigation (εi,su) | 0.0585 kgCO2-e per m3 water | Qin et al.38 |
| Sprinkler water irrigation (εi,sp) | 0.1884 kgCO2-e per m3 water | |
| Pesticide (εp) | 5.1 kgCO2-e per kg pesticide | Cech et al.39 |
| Wooden crate (WC) (εPk,wo) | 0.47 kgCO2-e kg−1 | Del Borghi et al.40 |
| Plastic crate (PC) (εPk,pl) | 2.65 kgCO2-e kg−1 | |
| Corrugated cardboard box (CCB) (εPk,ccb) | 1.19 kgCO2-e kg−1 | |
| Diesel (εd) | 2.7 kgCO2-e L−1 | Jakhrani et al.41 |
3.2.2.1. Cultivation. The carbon emissions during the litchi cultivation stage (CEc) were calculated using eqn (2), which integrates emissions from on-farm activities. Emissions from fertilizers (urea, DAP, MOP, FYM) and pesticides were estimated using standard emission factors, as given in Table 1. Irrigation-related emissions were calculated based on 80% surface and 20% sprinkler irrigation use accounting for differences in energy and emission intensities, as shown in Table 5. Additionally, post-harvest respiration emissions for a period of 6 h during cultivation stage were considered. The CO2 mitigation via photosynthesis throughout the year was also considered in the final emission balance.
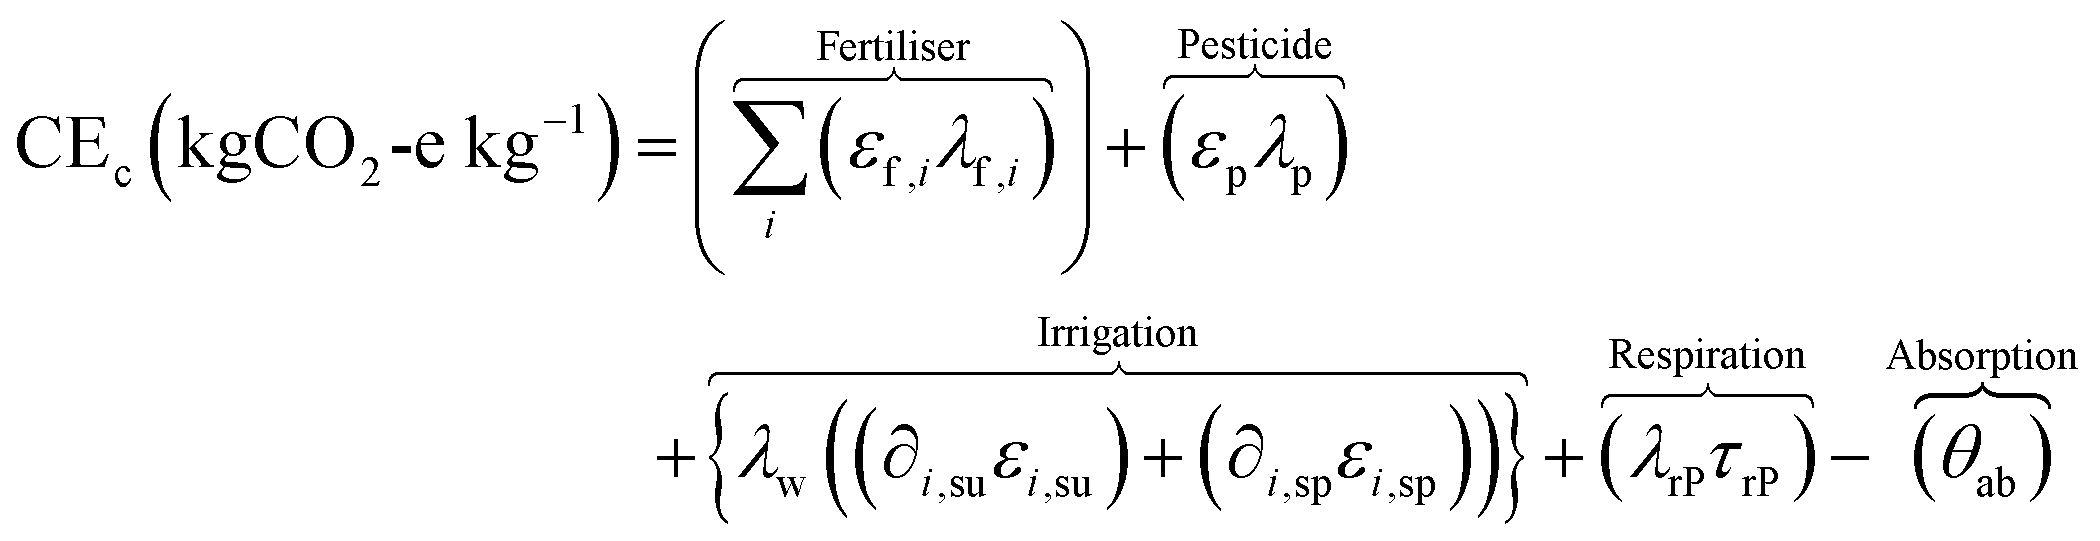 | (2) |
| Component | Value | Reference |
|---|---|---|
| Urea input rate (λf,U) | 0.0128 kg urea per kg | Yadav and Shalendra42 |
| DAP input rate (λf,D) | 0.0193 kg DAP per kg | |
| MOP input rate (λf,M) | 0.0064 kg MOP per kg | |
| FYM input rate (λf,FY) | 0.2579 kg FYM per kg | |
| Pesticide input rate (λp) | 0.0096 kg pest per kg | |
| Water consumption rate (λw) | 0.2594 m3 kg−1 | Pandey43 |
| Proportion of surface irrigation (∂i,su) | 80% | |
| Proportion of sprinkler irrigation (∂i,sp) | 20% | |
| Respiratory CO2 rate (λrP) | 0.0002 kgCO2 kg−1 h−1 | Kumar et al.1 |
| Respiration time (τrP) | 6 h | |
| Absorption rate (θab) | 0.13 kgCO2 kg−1 | Liu et al.19 |
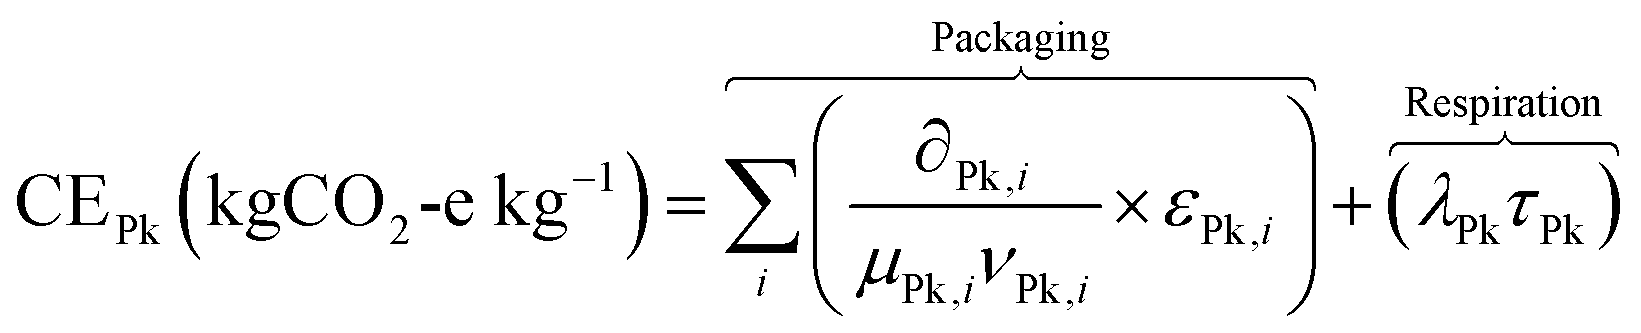
3.2.2.2. Packaging. The carbon emissions during the packaging stage (CEPk) of the supply chain were calculated using eqn (3), which incorporates emissions from three commonly used packaging types: wooden, plastic crate, and CCB. Emissions were estimated based on each packaging usage share, service life, and fruit-holding capacity, with wooden and plastic crates evaluated over multiple cycles and CCB treated as single use. In addition, emissions from fruit respiration during the holding period between loading and departure were included. The packaging characteristics and parameter values used in the calculation are summarized in Table 6.
 | (3) |
| Component | Value | Reference |
|---|---|---|
| Wooden crate percentage (∂Pk,wo) | 92% | MoFPI44 |
| Plastic crate percentage (∂Pk,pl) | 6% | |
| CCB percentage (∂Pk,pl) | 2% | Ketkale et al.45 |
| Wooden crate reusability (µPk,wo) | 20 times | Del Borghi et al.40 |
| Plastic crate reusability (µPk,pl) | 66 times | |
| CCB reusability (µPk,ccb) | 1 time | |
| Wooden crate capacity (νPk,wo) | 18 kg | Purbey et al.46 |
| Plastic crate capacity (νPk,pl) | 15 kg | Ribal et al.47 |
| CCB capacity (νPk,ccb) | 15 kg | |
| Respiratory CO2 production rate (λPk) | 0.0002 kgCO2 kg−1 h−1 | Kumar et al.1 |
| Respiration time (τPk) | 4 h |
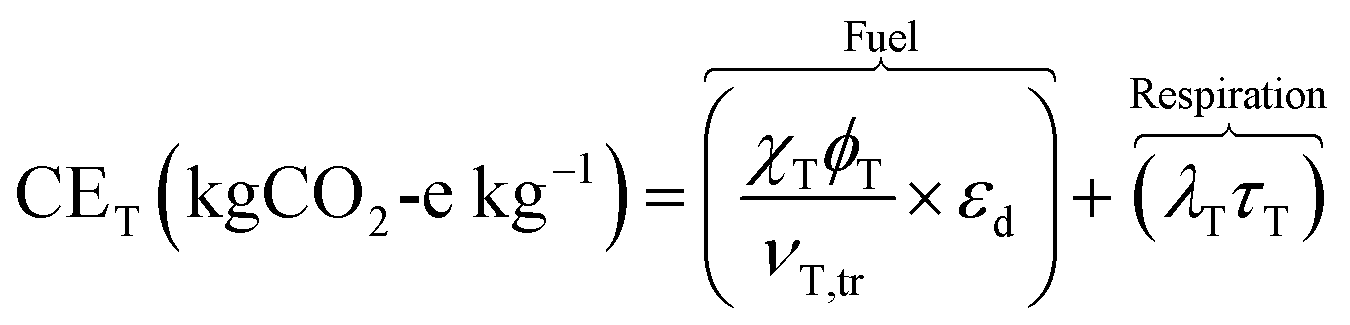
3.2.2.3. Transportation. Carbon emissions from transportation (CET) were estimated using eqn (4) by considering fuel-based emissions and fruit respiration during transit. Fuel emissions were assessed based on the travel distance, vehicle fuel consumption, and non-refrigerated truck holding capacity, combined with the diesel emission factor, as shown in Table 7, along with respiration emissions during the transit period.
 | (4) |
| Component | Value (unit) | Reference |
|---|---|---|
| Distance travelled (χT) | 1000 km | Kumar et al.1 |
| Fuel mileage (ϕT) | 0.39 L km−1 | |
| Truck holding capacity (νT,tr) | 10![[thin space (1/6-em)]](https://www.rsc.org/images/entities/char_2009.gif) 000 kg 000 kg |
MoFPI44 |
| Respiratory CO2 production rate (λT) (24 h) | 0.0003 kgCO2 kg−1 h−1 | Kumar et al.1 |
| Respiratory CO2 production rate (λT) (11 h) | 0.0002 kgCO2 kg−1 h−1 | |
| Respiration time (τT) | 35 h |
3.2.2.4. Distribution. Carbon emissions at the distribution stage (CED) were estimated using eqn (5), which considers the respiratory activity of fruits during a holding period of 24 h (λD) at a respiration rate of 0.0002 kgCO2 kg−1 h−1 (τD).
 | (5) |
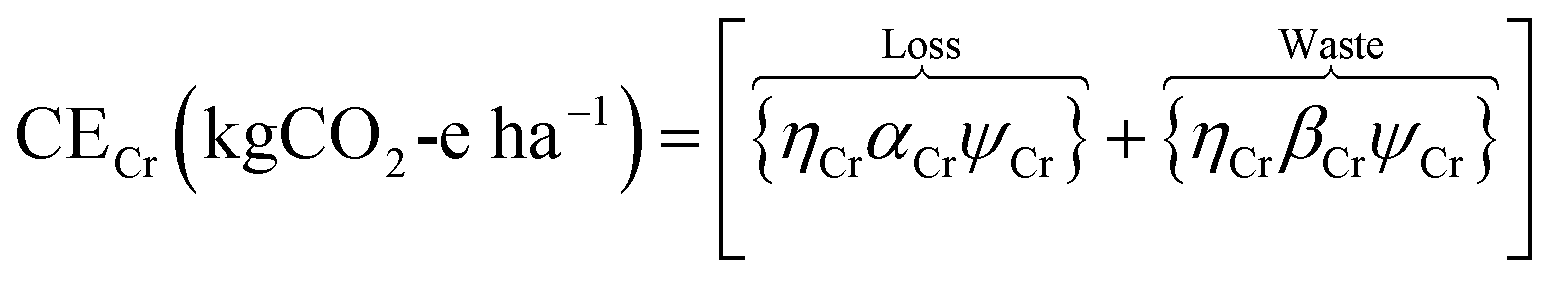 | (6) |
| Component | Value (unit) | Reference |
|---|---|---|
| Methane production (ηCr) | 0.11 kg per kg dry weight | Dach et al.48 |
| Whole fruit loss (cultivation, transportation, wholesale, and retail) (γCr) | 2988.83 kg ha−1 | Kumar et al.1 |
| Household waste (seed and peel) (δCr) | 1667.80 kg ha−1 | Bangar et al.49 |
| Whole fruit dry weight (αCr) | 537.98 kg | Janjai et al.50 |
| Seed and peel dry weight (βCr) | 961.08 kg | Ray et al.51 |
| Global warming potential for methane (100 year horizon) (ψCr) | 27.9 CO2-e | Xu et al.52 |
3.3. Carbon valuation and credit potential assessment
Carbon crediting incentivizes emission reductions and encourages the adoption of more sustainable practices. The study estimates the CE cost (CCE,c) by applying an illustrative carbon price of $100 USD per tCO2-e to LCA-derived CE per hectare using eqn (7).52The carbon emission value serves to highlight potential financial liabilities associated with existing emissions and reinforces the economic rationale for mitigation. Subsequently, avenues for generating carbon credits are conceptually explored for the litchi supply chain via two primary pathways:
(i) Orchard carbon sequestration: the annual CO2-e sequestered per hectare by litchi orchards, as calculated from the LCA yield data and established sequestration factors, is converted into potential carbon credits (where 1 credit = 1 tCO2-e).
(ii) Waste valorisation: it shows the potential for carbon credits from circular economy interventions, such as biogas production from litchi waste or compost production:
| Carbon credit = CCE,c × tCO2-e | (7) |
3.4. Sensitivity analysis
Sensitivity analysis enables the comparison of how several factors influence the litchi supply chain CE across its entire life cycle, providing valuable guidance for implementing effective carbon reduction measures throughout the process.25 Sensitivity coefficients as estimated using eqn (8) quantify how variations in specific factors affect overall carbon emissions.53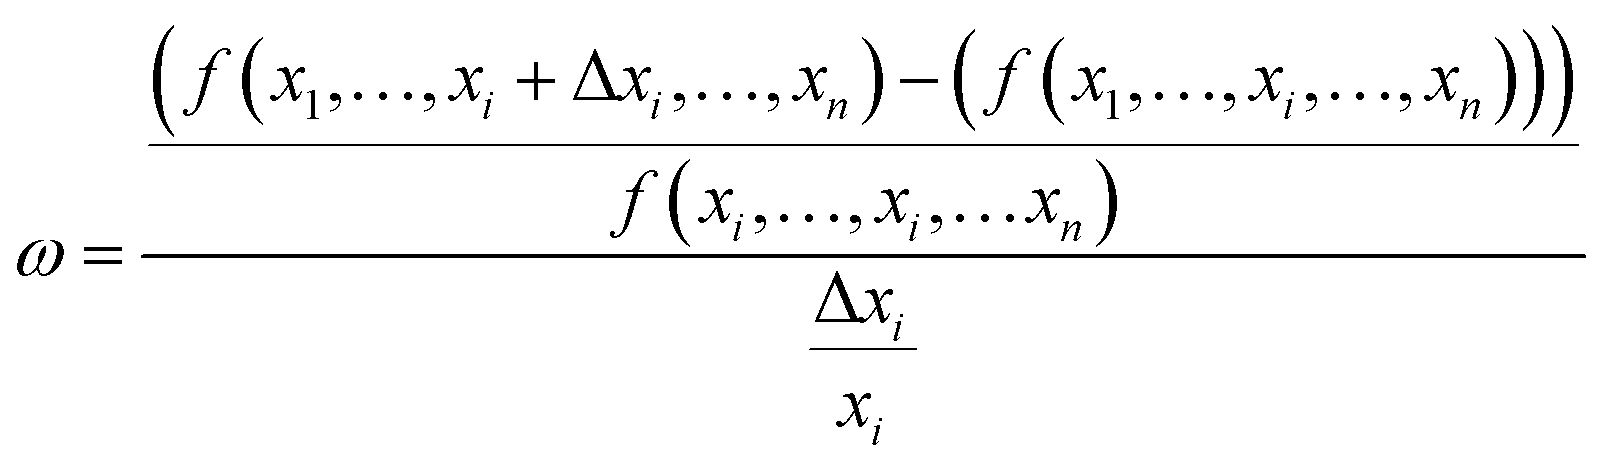 | (8) |
However, conventional sensitivity analysis, being deterministic, captures only the directional influence of parameters and assumes fixed input values, limiting its ability to reflect real-world variability and uncertainty in agricultural systems. Such simplifications may result in biased or incomplete interpretations of emission behaviour, especially in dynamic supply chains affected by climatic and operational fluctuations. To address this, the Monte Carlo simulation was applied to introduce stochastic variations in key parameters. The model performed 20000 iterations using a log-normal distribution to capture variability in each sub-criterion (e.g., fertilizers, pesticides, and truck fuels), defined by their mean and coefficient of variation (CV) to represent uncertainty in carbon emissions (kgCO2-e per functional unit). This probabilistic approach quantifies uncertainty through repeated random sampling, providing confidence intervals and a more robust understanding of emission variability across the litchi supply chain.54
3.5. Emission forecasting framework models
Forecasting models provide insights into future carbon emissions, enabling the development of more targeted strategies to address emerging sustainability demands. The historical data for production, cultivation area, temperature, and rainfall were taken from 1992 to 2024, as given in SI Table S1. Univariate forecasting of CEs was conducted using ARIMA, Prophet, LSTM, and GRU models based on historical litchi production data. For multivariate forecasting, Prophet, LSTM, and GRU models were employed with production data, area, temperature, and rainfall as input variables to enhance the accuracy by capturing the environmental effect on the litchi production. The data partitioning involved an 80% training and 20% testing split to evaluate the accuracy of predictions for litchi production. This robust forecasting of litchi production, in turn, will serve as a crucial input for the subsequent forecasting of associated CEs.3.5.1.1. ARIMA model. The ARIMA model was applied to forecast CO2 emissions by capturing linear trends and autocorrelations in the supply chain data using eqn (9). Stationarity was assessed using the Augmented Dickey-Fuller (ADF) method using eqn (10):9
 | (9) |
 | (10) |
3.5.1.2. Prophet model. Facebook's Prophet model was used for both univariate and multivariate CO2 emission forecasting. The univariate prophet model includes three main components, namely, trends, seasonality, and holiday for forecasting the seasonal effects and holidays, as given in eqn (11). The model operates by decomposing time series data into several additive components. For multivariate forecasting, external regressors are incorporated as linear additive terms to the model.55
 | (11) |
 on y(t) during model fitting.
 | (12) |
3.5.2.1. LSTM model. The LSTM model excels with sequential data by learning long-term dependencies, crucial for modelling how past agricultural practices influence future emissions. LSTM's ability to retain memory allowed it to capture nonlinear fluctuations and trend shifts, including delayed effects of interventions like circular practices. LSTM uses memory cells that manage information flow through forget (ft), input (it), and output gates (ot) using eqn (13), (14) and (17). The candidate cell state (
![[c with combining tilde]](https://www.rsc.org/images/entities/i_char_0063_0303.gif) t), cell state update (ct) and hidden state update (ht) are determined using eqn (15), (16) and (18). The univariate and multivariate forecasting models for LSTM differ in the input dimensionality, as shown in eqn (19).56
t), cell state update (ct) and hidden state update (ht) are determined using eqn (15), (16) and (18). The univariate and multivariate forecasting models for LSTM differ in the input dimensionality, as shown in eqn (19).56| ft = σ(Wfxt + Ufht−1 + bf) | (13) |
| it = σ(Wixi + Uiht−1 + bi) | (14) |
| t = tanh(Wcxt + Ucht−1 + bc) | (15) |
| ct = ft ⊙ ct−1 + it ⊙ t | (16) |
| ot = σ(Woxt + Uoht−1 + bo) | (17) |
| ht = ot ⊙ tanh(ct) | (18) |
 | (19) |
 is the input feature.
3.5.2.2. GRU model. The GRU model, a computationally efficient alternative to LSTM, was also used to forecast CEs in the supply chain. GRU's simplified structure allows for faster training while effectively capturing both short- and long-term dependencies in emission data.57 For a given normalized CE data input sequence, X = {x1, x2, …, xn}, the model parameters were iteratively trained using eqn (20)–(23). The univariate and multivariate function for the model is also governed using eqn (19).
| zt = σ(Wzxt + Uzht−1 + bz) | (20) |
| rt = σ(Wrxt + Urht−1 + br) | (21) |
![[h with combining tilde]](https://www.rsc.org/images/entities/i_char_0068_0303.gif) t = tanh(Whxt + Uh(rt ⊙ht−1) + bh t = tanh(Whxt + Uh(rt ⊙ht−1) + bh | (22) |
| ht = (1−zt) ⊙ ht−1 + zt ⊙ t | (23) |
t is the candidate hidden state, σ is used in update and reset gates to control information flow, while tanh generates the candidate hidden state. Element-wise multiplication ⊙ helps regulate retained information. The weights W and biases b are trained for the update, reset, and candidate components.
 | (24) |
 | (25) |
 | (26) |
The future carbon emission (CEF) for the predicted data was estimated using litchi production forecast (Fp [kg]) and carbon emission factor (CET [kgCO2-e kg−1]), as given in eqn (27):
| CEFc = Fp × CET | (27) |
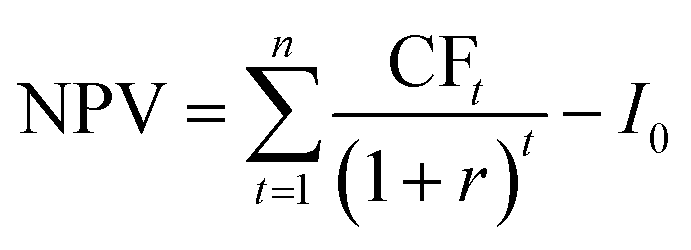
3.6. Cost economics
The cost-economic analysis of waste valorisation and the potential income generated from methane production were conducted to evaluate the potential financial incentives that waste valorisation or bio composting could generate. The initial cost of the biogas plant was estimated at $1626.41,58 designed to generate 1.57 m3 of methane, with a selling price of $2.10 per kg of methane.59 The project's return on investment (ROI), net present value (NPV), internal rate of return (IRR), and payback period were evaluated using eqn (28)–(31):60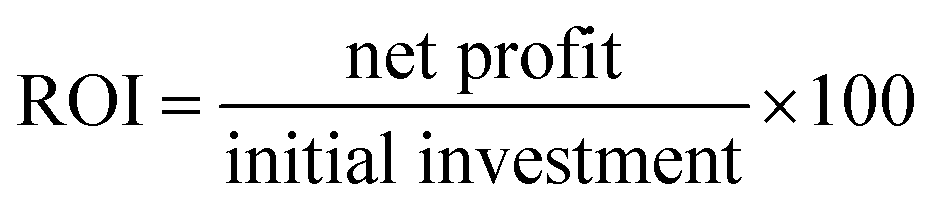 | (28) |
 | (29) |
 | (30) |
 | (31) |
4. Empirical results and discussion
4.1. Identifying the carbon emitting hotspots and pathways for decarbonization
Fig. 3 shows the flow of carbon emission throughout the supply chain. Litchi's supply chain possesses a complex CF from orchard to outlet. The CrTH-LCA framework reveals a total environmental imprint of 7305.16 kgCO2-e ha−1, with 1008.02 kgCO2-e ha−1 of carbon sequestration. Table 9 shows household waste (seed and peel) as the dominant carbon hotspot, with 40.44% of the total CEs. The carbon emission of cultivation (31.96%) and transportation stage (10.80%) contribute to a total of 42.76% of the total CEs. Even in broader F&V studies, the traditionally scrutinized stages of farming and transportation together account for 36% to 60% of emissions.19,23,61 The household waste in litchi supply chain as a hotspot of comparable magnitude truly underscores its critical, and perhaps often underestimated, role. Such carbon intensity from post-consumption waste is largely due to litchi's substantial inedible fraction, which ends up in landfilling, leading to methane (CH4) emissions.19 | ||
| Fig. 3 Detailed diagram illustrating CO2-e emissions and losses across the litchi supply chain. | ||
| Emission location | Carbon emission (kgCO2-e ha−1) | Percentage (%) |
|---|---|---|
| Household waste | 2953.63 | 40.44 |
| Fertiliser | 2270.50 | 31.08 |
| Fuel (vehicle) | 719.33 | 9.85 |
| Loss retail | 679.73 | 9.31 |
| Loss at farm | 510.44 | 6.99 |
| Loss (transportation and distribution) | 463.21 | 6.34 |
| Pesticides | 382.50 | 5.24 |
| Irrigation | 169.97 | 2.33 |
| Transportation respiration | 69.94 | 0.96 |
| Distribution respiration | 40.40 | 0.55 |
| Retail respiration | 17.73 | 0.24 |
| CCB | 11.77 | 0.16 |
| Cultivation respiration | 9.09 | 0.12 |
| Wooden box | 7.38 | 0.10 |
| Packaging respiration | 5.34 | 0.07 |
| Plastic crate | 2.19 | 0.03 |
| Carbon sequestration | −1008.02 | −13.80 |
| Total | 7305.16 | 100 |
Turning upstream, cultivation is the second-largest contributor (31.96%), primarily driven by fertilizer application (31.08%), followed by farm loss (6.99%), pesticides (5.24%), irrigation (2.33%), and field-level respiration (0.12%). The fertilizer hotspot is driven by energy-intensive nitrogen fertilizer (urea, DAP) production and potent nitrous oxide (N2O) field emissions, making its management critical while field-level respiration acknowledges baseline fruit metabolism.
Mitigating cultivation emissions involves sustainable practices: for fertilization, reusing treated wastewater enhances nutrient cycling.15 Broader on-farm strategies include organic agriculture, zero tillage, and crop residue farming, improving soil health by reducing greenhouse gas emission.11 These practices can also enhance soil carbon sequestration, potentially contributing to carbon credit generation under specific agricultural carbon programs. Pest management can shift towards organic principles, such as the application of species-specific pheromones or integrated pest management.62 Balancing vegetative growth with fruit production is also key for resource efficiency.11,12 Regarding irrigation energy (influenced by climate, water source, crop demand, and system type), decarbonization is possible via solar-powered pumps.61 Broader integration of renewables like biogas, wind, or hydrogen fuel cells across farm and supply chain stages, alongside biomass-fired boilers or waste-to-energy systems from agricultural materials, offers further footprint reduction.14,15,61 While cultivation causes notable emissions, litchi orchards provide a natural offset through carbon sequestration, estimated at approximately 1008.02 kgCO2-e ha−1.33
The transportation segment contributes 10.80% to total CO2 emission. Fuel consumption is the principal driver (9.85%), mainly from diesel-powered logistics. Refrigerated transport, vital for litchi quality, intensifies this by increasing fuel for cooling and overall transport emissions.19 Respiration during transport adds another 0.96%, accelerated due to poor handling and inconsistent cooling exacerbating these emissions.63
For routes like Muzaffarpur–Delhi, a modal shift from road to energy-efficient rail can reduce carbon emissions.14 Additional approaches include using hybrid electric vehicles (HEVs), other low-emission alternatives, or sustainably sourced biodiesel;64 enhancing operational efficiency through fuel-efficient driving and driver training; and adopting comprehensive logistics decarbonisation strategies such as rerouting, network optimisation, and setting carbon reduction targets.14,63
Litchi's non-climacteric nature makes it prone to rapid post-harvest degradation and losses across the supply chain; particularly, under ambient conditions, it contributes to a large segment in CE. Farm-level loss contributes to 6.99% emission from market gluts, labour shortages, and inadequate on-farm storage, compounded by field delays.65,66 Losses at distribution stage (6.34%) are mainly generated due to poor packaging, rough handling, and lack of refrigerated logistics, leading to accelerated pericarp browning. At retail (9.31%) losses accumulate due to microbial decay, worsened by slow turnover and poor demand forecasting, contributing to emissions from unconsumed fruit.
Cold chain circulation (CCC), though it may consume more energy, significantly reduces fruit loss and waste (FLW), resulting in a 34.84% lower CE per effective unit compared to room-temperature circulation, thereby enhancing the overall carbon efficiency.19 Distribution-stage and retail-stage respiration adds a further 0.55 and 0.07%, respectively, reflecting ongoing metabolism.
Packaging-related emissions were relatively minor with 0.29% from packaging materials used and 0.07% from post-harvest packaging respiration. Reusable packaging (wooden/plastic crates) significantly reduces per-use emissions compared to single-use CCBs, highlighting their environmental advantage over non-biodegradable or single-use options. For litchi transported without refrigeration, corrugated fibre board (CFB) are better than wooden crates. They reduce browning and weight loss by half, cause less damage, keep moisture in, slow down spoilage and ripening, while also costing less.1 A four-pronged strategy can cut litchi's postharvest packaging CF: (1) bio-based polymers,67 (2) active/intelligent featuring (O2/ethylene scavengers with ACC (1-aminocyclopropane-1-carboxylic acid) deaminase, antimicrobial coatings, and RFID (radio-frequency identification) thermo-humidity sensors in CFB cartons) preserve quality and cold-chain integrity, minimizing spoilage emissions,46 (3) lightweight, reusable RPCs (reusable plastic crate) or ventilated, cushioning-compatible CFB/punnet systems tailored to reduce single-use waste and streamline transport of litchi40 and (4) compostable cushioning and renewable, edible coatings enhance circularity by replacing synthetics and turning end-of-life packaging into nutrients.46,68
4.2. Circular economy for loss and waste
The dominant household waste hotspot is best addressed by valorising all litchi waste streams (including fruit losses, peel, and seed), which collectively amount to approximately 2953.89 kg per hectare, presenting a significant resource. The litchi supply chain releases a total of 165.13 kgCH4 ha−1 which translate to 4607.03 kgCO2-e ha−1 over a 100 year period. The combined CE from waste and loss leads to 63.06% of the total CE. The waste and loss generated from the litchi supply chain can be composted to methane and compost materials, which can be used as biofuels and organic manure, respectively, as shown in Fig. 4. The biocomposting of waste leads to 27.9 times reduction in overall CE with just 165.12 kgCO2-e ha−1. The organic compost can also help regenerate the soil nutrient, further leading to a lower requirement of fertilisers, which also contributes to 24.37% of total CEs.11,15,69 These circular economy strategies significantly reduce methane emissions from landfilling, mitigate overall CEs, and hold potential for generating carbon credits. | ||
| Fig. 4 Potential solution for the loss and waste generated in litchi supply chains. | ||
Therefore, implementing such systemic interventions, potentially supported by carbon financing, is essential for effectively leveraging this biomass and tackling distributed carbon hotspots within the litchi supply chain. The total carbon cost of the litchi supply chain stands at $730.51 per hectare with $100.8 per hectare generated as carbon credit due to CO2 sequestration.70 Furthermore, bio-composting of losses and waste generated across the litchi supply chain has the potential to yield carbon credits valued at approximately $444.19. The compost produced can further offset the fertilizer demand in the litchi supply chain, generating additional carbon credits through the retrospective substitution of synthetic fertilizers. Integrating such carbon credit mechanisms can provide tangible financial incentives, accelerating the adoption of sustainable, low-carbon practices throughout the supply chain.4,11,71
4.3. Sensitivity analysis
Table 10 shows the sensitivity analysis for the LCA assessment of litchi supply chain. The sensitivity analysis for litchi supply chain was considered at ±20%. The sensitivity analysis revealed that household waste change can lead to an overall CO2-e change of ±64.10, which is humongous in term of total CE. The potential mitigation can be a hybrid variety of litchi that has smaller seeds, leading to lower waste at household stage, which further clubbed with biocomposting can help reduce CO2-e emission by 27.9 times. Loss at various stages also leads to a higher variation in the overall CE, which could be controlled with improved transportation and packaging conditions.19| Input variables | Change rate | CO2 decline rate | Sensitivity coefficient |
|---|---|---|---|
| Cultivation | ±20% | ±11.08 | 0.0055 |
| Fertiliser | ±20% | ±6.36 × 10⁻⁵ | 0.000003178 |
| Pesticides | ±20% | ±1.07 × 10⁻⁵ | 0.000000535 |
| Irrigation | ±20% | ±4.76 × 10⁻⁶ | 0.000000238 |
| Respiration | ±20% | ±2.54 × 10⁻⁷ | 0.000000013 |
| Loss at farm | ±20% | ±11.07 | 0.0055 |
| Packaging | ±20% | ±7.47 × 10⁻⁷ | 0.000000037 |
| Wooden box | ±20% | ±2.09 × 10⁻⁷ | 0.000000010 |
| Plastic crate | ±20% | ±2.42 × 10⁻⁸ | 0.000000001 |
| CCB | ±20% | ±3.44 × 10⁻⁷ | 0.000000017 |
| Packaging respiration | ±20% | ±1.7 × 10⁻⁷ | 0.000000008 |
| Transportation | ±20% | ±10.05 | 0.0050 |
| Fuel | ±20% | ±2.29 × 10⁻⁵ | 0.000001143 |
| Transportation respiration | ±20% | ±2.38 × 10⁻⁶ | 0.000000119 |
| Loss | ±20% | ±10.05 | 0.0050 |
| Distribution | ±20% | ±14.75 | 0.0074 |
| Distribution respiration | ±20% | ±1.28 × 10⁻⁶ | 0.000000064 |
| Loss retail | ±20% | ±14.75 | 0.0074 |
| Household waste | ±20% | ±64.10 | 0.0321 |
The Monte Carlo simulation provides a probabilistic assessment of carbon emissions across the litchi supply chain, capturing variability in each sub-process and overcoming the limitations of deterministic sensitivity analysis. Total emissions across 20000 simulations are typically right-skewed due to high variability in sub-stages such as fertilizer use, with the median slightly lower than the mean, offering an expected carbon footprint per functional unit. Sub-stages and stage-level boxplots reveal emission ranges and dominant contributors, with fertilizer application, household wastage, and truck fuel consistently exhibiting the largest impacts, while cultivation shows the widest stage-level variability, followed by household, and packaging and distribution demonstrate lower variability (Fig. 5(c and d)).
 | ||
| Fig. 5 (a) Sensitivity analysis of stages, (b) sensitivity analysis of sub-stages, (c) carbon emission variation of stages, and (d) carbon emission variation of sub-stages. | ||
The Spearman rank correlation-based sensitivity analysis identifies sub-processes and stages that strongly influence total emissions: high positive correlations for fertilizer and wastage increase emissions, whereas absorption processes reduce them, with stage-level ranking typically following cultivation > household > transport > retail > packaging > distribution (Fig. 5(a and b)). This integrated approach combining probabilistic simulation, variability analysis, and sensitivity quantification provides a robust framework for pinpointing high-impact sub-processes and stages, enabling targeted mitigation strategies and supporting sustainable supply chain management.54
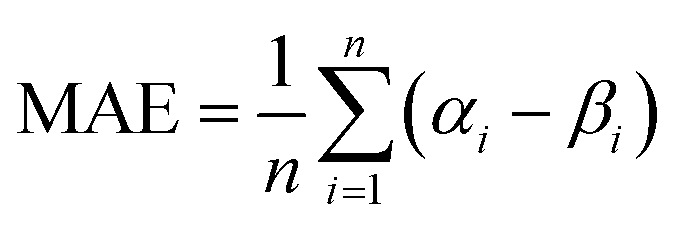
4.4. Litchi production forecasting: model performance and selection
Table 11 indicates that the multivariate LSTM model demonstrated the strongest overall performance for litchi production forecasting.56 It yielded the lowest MAE (34.92) and RMSE (35.62) compared to other models. The superior performance suggests that the LSTM architecture, when augmented with relevant exogenous variables (area, temperature, rainfall), was exceptionally well suited for capturing the complex, non-linear patterns, and temporal dependencies inherent in the litchi production. Fig. 6 shows the model's predictions, which adequately captured the recent dynamic shifts in production during the test phase, unlike some models that produced flatter or more lagging forecasts like ARIMA and Prophet. Comparing across frameworks, the multivariate LSTM significantly outperformed its univariate counterpart (RMSE 35.62 vs. 74.27). The multivariate GRU model also showed improved performance with external variables (RMSE 51.08) compared to its univariate version (RMSE 93.36), positioning it as a strong multivariate approach, though second to multivariate LSTM.| Model | Error metric | MAE | MSE | RMSE |
|---|---|---|---|---|
| ARIMA | Univariate | 15.38 | 360.25 | 18.98 |
| Prophet | Univariate | 77.32 | 6048.01 | 77.76 |
| Multivariate | 86.67 | 7621.95 | 87.3 | |
| LSTM | Univariate | 72.18 | 5515.98 | 74.26 |
| Multivariate | 34.92 | 1268.96 | 35.62 | |
| GRU | Univariate | 92.72 | 8715.52 | 93.3 |
| Multivariate | 50.15 | 2609.52 | 51.08 |
 | ||
| Fig. 6 Forecast of litchi production using (a) univariate and (b) multivariate time series methods. | ||
The univariate ARIMA model was robust, with an MAE value of 15.38 and a competitive RMSE value of 18.98. Notably, it consistently predicted 721 tonnes during the 2020–2024 test period, even as actual production rose from 726 to 750.8 tonnes. This flat predictive output indicates that ARIMA captured a stable baseline from training data but missed recent upward trends and yearly variations, offering robustness for noisy series but implying less responsiveness to dynamic shifts. The Prophet model, in both configurations, generally exhibited higher errors. When considering Prophet's utility, its performance was primarily assessed on the test set, as its longer-term future forecast stability was less reliable for this specific application. Thus, the multivariate LSTM model was found as the most accurate and appropriate for subsequent CE projections due to its superior ability to learn from historical patterns, integrate external factors, and model dynamic production trends.
Leveraging the litchi production forecasts using the multivariate LSTM model, the associated total CEs from the supply chain were subsequently projected. This translation relies on the comprehensive CF intensity established from the LCA data, where the emission intensity is approximately 0.94 kg CO2-e kg−1 of litchi produced. Using the production forecasts from the multivariate LSTM model, the anticipated annual CEs were found to be approximately 7205.52, 7422.62, 7686.12, 7746.35, and 7809.77 kgCO2-e ha−1 for 2025, 2026, 2027, 2028, and 2029, respectively.
Linked to the multivariate LSTM model's forecasted litchi production growth, these projected CEs signal an escalating environmental burden, challenging climate targets if current emission intensities persist. This highlights the urgent need for the earlier mentioned decarbonization strategies, especially strong actions to reduce emission intensity (EI) as litchi production continues. The CrTH-LCA-based projections offer a crucial baseline for policymakers to set targeted emission reduction goals and prioritize mitigation investments in the litchi sector.
4.5. Economic assessment of waste valorisation
The economic feasibility of waste valorisation in the litchi supply chain was assessed at two levels: farmer and whole supply chain. The analysis used forecasted production data over five years combined with the current year, representing a six-year project lifespan. The evaluation considered potential financial incentives from methane generation and composted farmyard manure (FYM). Due to the high initial investment for biogas plants, a community-based investment covering a cumulative 10 hectares was assumed. Table 12 shows the economic performance assessed using ROI, IRR, NPV, payback period, and cumulative revenue per hectare.| Parameter | Farmer level | Entire supply chain |
|---|---|---|
| ROI (%) | 164.01 | 1232.22 |
| IRR (%) | 84 | 288 |
| NPV (USD) | 1472.19 | 13997.62 |
| Payback period (months) | 28 | 5.6 |
| Cumulative revenue per hectare (USD) | 428.60 | 2162.83 |
The study also highlights that, at the farmer level, methane production alone generated a cumulative revenue of $428.60 per hectare, with an ROI value of 164.01% and a payback period of 28 months. At the whole supply chain level, financial returns were substantially higher, with an ROI value of 1232.22% and a cumulative revenue of $2162.83 per hectare, emphasizing the economic advantage of a community-based biogas plant strategy. The additional revenue from composted FYM further enhances the financial incentives at both levels. These findings underscore the importance of government support through subsidies, infrastructure development, and farmer training to facilitate efficient waste collection and biogas adoption. Implementing such measures can significantly improve the financial viability for farmers and other stakeholders while promoting sustainable waste management and circular economy practices within the litchi supply chain.
The economic feasibility of farm- and community-level waste valorisation is mainly influenced by initial investment, scale, and market access. High upfront costs often limit smallholder adoption, even for profitable technologies which require government policy modification and community-based development. Optimized pyrolysis of vegetable waste can yield an ROI value of 29% with a payback period of 3.4 years under ideal conditions, though high-moisture fruits like litchi reduce the ROI value to below 10% and extend payback periods beyond ten years without costly pre-drying, as observed in the present study.72 Post-harvest loss reduction through improved handling and cold chain infrastructure offers higher returns, reducing losses of up to 30% at the farmer level and 35–44% across the supply chain.73 Low-cost, small-scale processing of rejected litchi into juice, jams, wine, canned fruit, or dried pulp provides positive ROI and a short payback period, indicating economic viability. The economic performance improves further with operational efficiency, diversified revenue streams, shared infrastructure, and government support, including subsidies and technical assistance.74 Context-appropriate interventions combining loss prevention, processing, and cooperative action can make litchi waste valorisation profitable while promoting sustainable horticultural practices. Thus, the hybrid CrTH-LCA framework, combined with advanced forecasting methods, not only projects future carbon emissions but also informs policy frameworks, strengthens the economic viability of farmers, and encourages adoption of sustainable waste management practices by providing data-driven insights for targeted interventions.
5. Conclusion
The study evaluated an innovative circular tiered hybrid life cycle assessment (CrTH-LCA) framework, combined with deep learning-based time series forecasting techniques, to comprehensively assess the litchi supply chain's CF and future emission trajectories. The key findings identified household waste (40.44% of total CEs) and cultivation (31.96%, primarily from fertilizers) as the most significant CE hotspots, with a total supply chain footprint of 7305.17 kgCO2-e ha−1 and an emission intensity of approximately 0.94 kgCO2-e kg−1. The Monte Carlo simulation further revealed the variability in emissions across sub-processes, highlighting fertilizer use, household waste, and transport as consistently high-impact contributors, while absorption and composting processes help mitigate total emissions. This probabilistic assessment provided robust insights for targeting interventions at both sub-process and stage levels.The research demonstrated substantial mitigation potential through circular economy (CrE) strategies, particularly valorising the 4656.37 kg ha−1 available litchi waste biomass into biofuel and biocompost, alongside 1008.02 kgCO2-e ha−1 year−1 from orchard sequestration, with conceptual pathways for carbon credits. Economic assessment of waste valorisation at the farmer and supply chain levels underscores the financial viability of such strategies: community-based biogas plants yield high ROI (164.01% at the farmer level; 1232.22% at the supply chain level), short payback periods, and additional revenue from composted FYM. Post-harvest loss reduction, small-scale processing of rejected fruits, and operational efficiency further enhance the economic outcomes. The multivariate LSTM model proved most accurate for litchi production forecasting. Based on LSTM projections, gross CEs are forecasted to rise significantly, while net emissions remain substantial.
The study provides a robust integrated methodology for carbon management in ASC, offering data-driven insights for interventions. Crucially, the modular CrTH-LCA frameworks and sector-agnostic design are applicable to supply chains of agriculture,75 vegetables and fruits,76 and grains,77 systematically analysing cultivation, post-harvest, transportation, distribution, and consumption waste streams, enabling its adaptation to other supply chains and supporting broader scalability in CF assessment and predictive modelling across the global fruit sector.
Achieving a sustainable transition requires concerted efforts: farmers and cooperatives should adopt integrated nutrient management, improve post-harvest handling, and engage in waste valorisation; supply chain intermediaries must invest in efficient logistics and sustainable packaging, while consumer awareness on responsible consumption and waste management is vital. Complementing these actions, supportive policy frameworks and market-based mechanisms such as clean development mechanism (CDM)78 allow investments in emission-reducing projects, though agricultural participation remains limited. National and regional systems such as Canada's Alberta Emission Offset System, the EU Carbon Farming Initiative, Australia's Emission Reduction Fund,79 and India's Carbon Credit Cell80 enable farmers to generate credits through practices like conservation cropping, organic farming, agroforestry, and micro-irrigation.74,79 Financial incentives including subsidies, tax benefits, and blended finance encourage adoption of climate-smart practices, while carbon valuation at global market prices provides measurable outcomes.81,82 Digital platforms, blockchain systems, and tools like the Cool Farm Tool and COMET-Farm improve transparency, traceability, and verification of emission reductions.83,84 Despite these efforts, challenges such as high transaction costs, regulatory uncertainty, low adoption, and carbon leakage persist.84 Overall, integrated policies, market mechanisms, and technological platforms are essential to reduce emissions, incentivize sustainable practices, and support climate resilience in agriculture. The actions will aid in aligning the litchi sector with national and global climate action goals (SDGs 2, 12, and 13).
Future research should prioritize economic feasibility studies for valorisation pathways, developing dynamic emission intensity models, expanding the CrTH-LCA to include socio-economic indicators, investigating consumer behaviour, and further refining advanced forecasting techniques.
Overall, this study provides a replicable data-driven framework for carbon management that can guide sustainable practices and policy interventions across fruit supply chains, supporting the transition toward low-carbon and circular agricultural systems.
6. Implications of the study: practical and policy framework
The present research advances theoretical understanding in environmental science and agricultural sustainability while providing actionable insights for policy and practice aimed at decarbonizing the litchi supply chain and supporting key SDGs. The study makes several theoretical contributions: it develops a novel circular tiered hybrid life cycle assessment (CrTH-LCA) framework that integrates tiered emission sources from cultivation to post-consumption with circular economy loops, providing a robust and replicable tool as compared to the previous existing circular LCA framework.27 A comparison of statistical and deep learning models ARIMA, Prophet, LSTM, and GRU was performed, followed by validation highlighting that multivariate LSTM models with exogenous variables provide more dynamic and adaptable emission projections. The framework also aids toward fulfilment of SDGs 2 (food security planning), 12 (responsible consumption and production) and 13 (climate action). The empirical finding that post-consumption household waste accounts for 40.44% of total CE challenging conventional production-centric views and emphasizes the importance of consumption-based circular strategies. Linking LCA data with predictive forecasts enhances anticipatory environmental management, while the conceptual exploration of carbon credits from waste valorisation and sequestration form the ground for circular bioeconomy. Below are the practices and policy frameworks across different stages of the supply chain, focusing on waste reduction and resource recovery.6.1. Farm-level practices (SDGs 2, 12, and 13)
Adoption of soil health practices, improved post-harvest handling, and collective waste valorisation, supported by training, financing, and micro-leasing of low-cost equipment, helps reduce losses and overcome financial barriers.806.2. Supply chain interventions
Investment in energy-efficient transport, cold chains, sustainable packaging, and optimized inventory, along with crop loss and valorisation (CLV) centres, mobile cold storage, and cooperative waste-to-energy or composting units, enables waste reduction and resource recovery.736.3. Consumer engagement
Promotion of responsible consumption patterns and household food waste management, including proper disposal or composting, is complemented by digital/IoT-enabled inventory tracking platforms to minimize spoilage and losses.856.4. Policy and governance
Integration of climate projections into agricultural planning, incentivization of circular packaging through fiscal measures and R&D support, and adoption of life cycle perspectives are necessary. Subsidized or bundled climate insurance schemes can reward smallholders who adopt high-impact practices (e.g., integrated nutrient management), mitigating financial and climate-related risks.86,87By explicitly addressing feasibility constraints, financial barriers, and technical limitations, this study provides actionable context-sensitive pathways for smallholder adoption and system-wide decarbonization. The integration of LCA with predictive forecasting outputs ensures interventions that are data-driven, targeted, and capable of supporting scalable, sustainable transformations in horticultural supply chains globally.
Abbreviations
| ACC | 1-Aminocyclopropane-1-carboxylic acid |
| ADF | Augmented dickey fuller |
| AR | Autoregressive |
| ARIMA | Autoregressive moving average |
| ASC | Agricultural supply chain |
| BCR | Benefit-cost-ratio |
| CCB | Corrugated cardboard |
| CCC | Cold chain circulation |
| CDM | Clean development mechanism |
| CE | Carbon emission |
| CF | Carbon footprint |
| CFB | Corrugated fibre board |
| CH4 | Methane |
| CO2 | Carbon dioxide |
| CO2-e | Carbon dioxide-equivalent |
| CrE | Circular economy |
| CrTH-LCA | Circular tiered hybrid life cycle assessment |
| CV | Coefficient of variation |
| DAP | Diammonium phosphate |
| EU | European union |
| F&V | Fruit and vegetable |
| FLW | Food loss and waste |
| FU | Functional unit |
| FYM | Farm yard manure |
| GHG | Green-house gas |
| GI | Geographical indication |
| GRU | Gated recurrent unit |
| h | Hour |
| HEV | Hybrid electric vehicles |
| IPCC | Intergovernmental panel on climate change |
| ISO | International standard organisation |
| kg | Kilogram |
| LCA | Life cycle assessment |
| LSTM | Long short-term memory |
| MA | Moving average |
| MAE | Mean absolute error |
| MJ | Mega joule |
| MLP | Machine learning program |
| MOP | Muriate of potash |
| MSE | Mean squared error |
| N2O | Nitrous oxide |
| O2 | Oxygen |
| PB | Payback period |
| PC | Plastic crate |
| RFID | Radio-frequency identification |
| RMSE | Root mean square error |
| RNN | Recurrent neural network |
| ROI | Return on investment |
| RPC | Reusable plastic crate |
| SDG | Sustainable development goals |
| SETAC | Society of environmental toxicology |
| SVM | Support vector machine |
| t | Tonnes |
| WC | Wooden crate |
Conflicts of interest
There are no conflicts to declare.Data availability
No new data were generated in this study. All data analysed were obtained from previously published sources, which are cited in the reference list.Supplementary information (SI): the historical datasets used for training the time-series forecasting models. See DOI: https://doi.org/10.1039/d5fb00519a.
References
- V. Kumar, S. K. Purbey and A. K. D. Anal, Crop Prot., 2016, 79, 97–104 Search PubMed.
- N. Singh, R. Biswas and M. Banerjee, J. Agribus. Dev. Emerg. Econ., 2024, 14, 1195–1217 CrossRef.
- L. Rasines, S. Morera, G. S. Miguel, F. Artés-Hernández and E. Aguayo, Sci. Total Environ., 2023, 872, 162169 Search PubMed.
- A. Ibrahim, A. Amer, I. Elsebaee, A. Sabahe and M. A. Amer, Front. Bioeng. Biotechnol., 2024, 12, 1355133 CrossRef.
- F. Al-Mansour and V. Jejcic, Energy, 2017, 136, 7–15 CrossRef.
- X. Zhang and F. Wang, Build. Environ., 2016, 104, 188–197 CrossRef.
- I. Arzoumanidis, L. Petti, A. Raggi and A. Zamagni, in Product-Oriented Environmental Management Systems (POEMS): Improving Sustainability and Competitiveness in the Agri-Food Chain with Innovative Environmental Management Tools, eds. R. Salomone, M. T. Clasadonte, M. Proto and A. Raggi, Springer Netherlands, Dordrecht, 2013, pp. 105–122 Search PubMed.
- V. S. Yadav, A. R. Singh, A. Gunasekaran, R. D. Raut and B. E. Narkhede, Sustain. Prod. Consum., 2022, 29, 685–704 CrossRef.
- L. Ye, P. Du and S. Wang, J. Clean. Prod., 2024, 434, 140010 CrossRef.
- H. Wang, Z. Wei, T. Fang, Q. Xie, R. Li and D. Fang, J. Clean. Prod., 2024, 445, 141340 CrossRef.
- B. Jaiswal and M. Agrawal, Environmental Footprints and Eco-Design of Products and Processes, 2020, 81–99 Search PubMed.
- R. Parajuli, G. Thoma and M. D. Matlock, Sci. Total Environ., 2019, 650, 2863–2879 CrossRef.
- T. Xie, Z. Huang, T. Tan and Y. Chen, Ecol. Inform., 2024, 82, 102661 CrossRef.
- S. Subedi, B. Dent and R. Adhikari, Sustain. Prod. Consum., 2024, 52, 12–28 Search PubMed.
- B. Notarnicola, R. Salomone, L. Petti, P. A. Renzulli, R. Roma and A. K. Cerutti, Life Cycle Assessment in the Agri-Food Sector: Case Studies, Methodological Issues and Best Practices, Springer, 2015 Search PubMed.
- R. L. Desjardins, D. E. Worth, J. A. Dyer, X. P. C. Vergé and B. G. McConkey, Environmental Footprints and Eco-Design of Products and Processes, 2020, pp. 1–34 Search PubMed.
- S. Clune, E. Crossin and K. Verghese, J. Clean. Prod., 2017, 140, 766–783 CrossRef.
- B. Martin-Gorriz, B. Gallego-Elvira, V. Martínez-Alvarez and J. F. Maestre-Valero, J. Clean. Prod., 2020, 265, 121656 CrossRef.
- G. Liu, Z. Kuang, J. Tang, S. Kuang, Q. Tian, Y. Zou and Q. Li, J. Clean. Prod., 2024, 434, 140013 CrossRef.
- M. Wróbel-Jędrzejewska and E. Polak, J. Food Eng., 2022, 322, 110974 CrossRef.
- S. D. Porter, D. S. Reay, P. Higgins and E. Bomberg, Sci. Total Environ., 2016, 571, 721–729 CrossRef PubMed.
- S. D. Porter, D. S. Reay, E. Bomberg and P. Higgins, J. Clean. Prod., 2018, 201, 869–878 CrossRef.
- E. Ferguson Aikins and U. Ramanathan, Int. J. Oper. Prod. Manag., 2020, 40, 945–970 CrossRef.
- Y. S. Park, G. Egilmez and M. Kucukvar, Ecol. Indic., 2016, 62, 117–137 CrossRef.
- A. Reisinger, S. F. Ledgard and S. J. Falconer, Ecol. Indic., 2017, 81, 74–82 CrossRef.
- S. Iqbal, Z. Qingyu and M. Chang, Energy, 2025, 135597 CrossRef.
- W. W. Ingwersen, J. Clean. Prod., 2012, 35, 152–163 CrossRef.
- G. P. Agnusdei and B. Coluccia, Sci. Total Environ., 2022, 824, 153704 CrossRef.
- A. Kumar and S. Agrawal, Comput. Electron. Agric., 2023, 212, 108161 CrossRef.
- G. Tuğba Önder, J. Atmos. Sol. Terr. Phys., 2024, 265, 106393 CrossRef.
- G. T. Önder, J. Atmos. Sol.-Terr. Phys., 2014, 265, 106393 CrossRef.
- S. H. Shin, N. C. Deb, E. Arulmozhi, N. Tamrakar, O. M. Ogundele, J. Kook, D. H. Kim and H. T. Kim, Agriculture, 2024, 14, 1895 CrossRef.
- Indiastat.com.
- G. Du, Z. Liu, J. Wang, Q. Wei and S. Yan, Energy Rep., 2024, 12, 3437–3450 CrossRef.
- X. Jiangbo, W. Xiong, Q. Wei, W. Shaowei, S. Sheng, Z. Danni and C. Xinyu, J. Clean. Prod., 2025, 497, 145174 CrossRef.
- R. Kumar, S. Karmakar, A. Minz, J. Singh, A. Kumar and A. Kumar, Front. Environ. Sci., 2021, 9, 710108 CrossRef.
- A. Mori, Atmosphere, 2018, 9(7), 261 CrossRef.
- J. Qin, W. Duan, S. Zou, Y. Chen, W. Huang and L. Rosa, Nat. Commun., 2024, 15, 3084 CrossRef PubMed.
- R. Cech, F. Leisch and J. G. Zaller, Agriculture, 2022, 12, 879 CrossRef.
- A. Del Borghi, S. Parodi, L. Moreschi and M. Gallo, Int. J. Life Cycle Assess., 2021, 26, 753–766 CrossRef.
- A. Q. Jakhrani, A. R. H. Rigit, A. K. Othman, S. R. Samo and S. A. Kamboh, Proceedings of the 2012 International Conference in Green and Ubiquitous Technology, GUT, 2012, vol. 2012, pp. 78–81 Search PubMed.
- H. Yadav and Shalendra, Litchi Value Chain Analysis and Market Assessment for Muzaffarpur District, Bihar, 2018 Search PubMed.
- G. Singh, V. Nath, S. D. Pandey, P. K. Ray and H. S. Singh, in The Licthi, Food and agriculture organization of the United Nations, New Delhi, India, 2012, https://nrclitchi.icar.gov.in/uploads/books/Chap-10-water-requirement-and-irrigation.pdf Search PubMed.
- G. MoFPI, Development of Potential Value Chain, 2021 Search PubMed.
- H. Ketkale and S. Simske, Resources, 2023, 12, 22 CrossRef.
- S. K. Purbey, A. Pongener, E. S. Marboh and N. Lal, Curr. J. Appl. Sci. Technol., 2019, 38, 1–11 Search PubMed.
- J. Ribal, V. Estruch, G. Clemente, M. L. Fenollosa and N. Sanjuán, Int. J. Life Cycle Assess., 2019, 24, 1515–1532 CrossRef.
- J. Dach, K. Koszela, P. Boniecki, M. Zaborowicz, A. Lewicki, W. Czekała, J. Skwarcz, W. Qiao, H. Piekarska-Boniecka and I. Białobrzewski, Renew. Sustain. Energy Rev., 2016, 56, 603–610 CrossRef.
- S. P. Bangar, M. Kumar, W. S. Whiteside, M. Tomar and J. F. Kennedy, Carbohydr. Polym. Technol. Appl., 2021, 2, 100080 Search PubMed.
- S. Janjai, B. Mahayothee, N. Lamlert, B. K. Bala, M. Precoppe, M. Nagle and J. Müller, J. Food Eng., 2010, 96, 214–221 CrossRef.
- P. K. Ray and S. B. Sharma, Sci. Hortic., 1987, 33, 213–221 CrossRef.
- Z. Xu, X. Li, P. Tian, Y. Huang, Q. Zhu, H. Zou, Y. Huang, Z. Zhang, S. Zhang, M. Chen and Y. Chen, J. Geophys. Res.:Biogeosci., 2024, 129, e2023JG007924 CrossRef CAS.
- X. Song, S. Du, C. Deng, P. Shen, M. Xie, C. Zhao, C. Chen and X. Liu, J. Environ. Sci., 2025, 148, 650–664 CrossRef PubMed.
- M. Kaddoura, G. Majeau-Bettez, B. Amor and M. Margni, Sci. Total Environ., 2025, 975, 179269 CrossRef CAS.
- H. Weytjens, E. Lohmann and M. Kleinsteuber, Electron. Commer. Res., 2021, 21, 371–391 CrossRef.
- Y. Huang, L. Shen and H. Liu, J. Clean. Prod., 2019, 209, 415–423 CrossRef.
- H. Zhi-Wen, D. Qian-Bin and C. Xiao-Long, Energy Rep., 2024, 12, 5747–5756 CrossRef.
- K. C. Obileke, G. Makaka, N. Nwokolo, E. L. Meyer and P. Mukumba, ChemEngineering, 2022, 6, 67 CrossRef CAS.
- M. Al-Breiki and Y. Bicer, Chem. Eng. J., 2023, 471, 144725 CrossRef.
- C. Czipf, Discov. Sustain., 2025, 6, 1–19 CrossRef.
- C. Adewale, S. Higgins, D. Granatstein, C. O. Stöckle, B. R. Carlson, U. E. Zaher and L. Carpenter-Boggs, Agric. Syst., 2016, 149, 112–121 CrossRef.
- L. Rasines Elena, G. San Miguel Alfaro, Á. Molina García, F. D. A. Artés Hernández, E. Hontoria Hernández and E. P. Aguayo Giménez, Environmental LCA and carbon footprint of cauliflower as produced in Southeast Spain, 2021, DOI:10.30955/gnc2021.00564.
- X. Zhang, D. Jiang, J. Li, Q. Zhao and M. Zhang, J. Clean. Prod., 2024, 439, 140727 CrossRef.
- H. Duan, M. Hu, Y. Zhang, J. Wang, W. Jiang, Q. Huang and J. Li, J. Clean. Prod., 2015, 95, 109–116 CrossRef.
- F. Goodarzian, V. Kumar and P. Ghasemi, Ann. Oper. Res., 2022, 1–57 Search PubMed.
- E. Roghanian and A. Cheraghalipour, J. Clean. Prod., 2019, 239, 118081 CrossRef.
- H. Nabipour Afrouzi, J. Ahmed, B. Mobin Siddique, N. Khairuddin and A. Hassan, Results Eng., 2023, 18, 101054 CrossRef.
- J. V. Oliver-Villanueva, B. Armengot-Carbó, E. Lorenzo-Saéz and V. Lerma-Arce, Sustainability, 2025, 17, 557 CrossRef.
- S. S. Muthu, Environmental Footprints and Eco-Design of Products and Processes, Springer, 2016 Search PubMed.
- K. L. Christiansen, Environ. Plan. A Econ. Space, 2025, 57(8), 1190–1205 CrossRef.
- P. Li, B. Chen and Q. Cui, J. Clean. Prod., 2023, 427, 139164 CrossRef.
- M. Alherbawi, P. Parthasarathy, S. Elkhalifa, T. Al-Ansari and G. McKay, Heliyon, 2024, 10, e27713 CrossRef PubMed.
- UNEP and FAO, Sustainable Food Cold Chains: Opportunities, Challenges and the Way Forward, FAO, Nairobi, UNEP and Rome, 2022 Search PubMed.
- NFWPIS, Annual Report 2023-24, Delhi, India, 2024.
- S. Despoudi, Ind. Mark. Manag., 2021, 93, 520–532 CrossRef.
- S. Lu, G. Cheng, T. Li, L. Xue, X. Liu, J. Huang and G. Liu, Resour. Conserv. Recycl., 2022, 177, 106006 CrossRef.
- D. Kumar and P. Kalita, Foods, 2017, 6, 8 CrossRef PubMed.
- T. Garnett, Cooking up a Storm: Food, Greenhouse Gas Emissions and Our Changing Climate, Food Climate Research Network, Centre for Environmental Strategy, University, 2008 Search PubMed.
- N. Lokuge and S. Anders, Carbon-Credit Systems in Agriculture: A Review of Literature (April 2022), The School of Public Policy Publications, 2022, vol. 15:12, https://papers.ssrn.com/abstract=4096174 Search PubMed.
- DAC&FW, Annual Report 2020-21, New Delhi, 2021.
- X. Xi and Y. Zhang, Chaos Solitons Fractals, 2021, 152, 111358 CrossRef.
- A. Khatri-Chhetri, A. Pant, P. K. Aggarwal, V. V. Vasireddy and A. Yadav, Agric. Syst., 2019, 174, 23–31 CrossRef.
- A. J. Sykes, C. F. E. Topp, R. M. Wilson, G. Reid and R. M. Rees, J. Clean. Prod., 2017, 164, 398–409 CrossRef.
- B. R. Carlson, L. A. Carpenter-Boggs, S. S. Higgins, R. Nelson, C. O. Stöckle and J. Weddell, Comput. Electron. Agric., 2017, 142, 211–223 CrossRef.
- C. Malefors, A. Sjölund and N. Sundin, Sustain. Prod. Consum., 2025, 54, 441–451 CrossRef.
- S. Singh, Ecol. Indic., 2020, 116, 106475 CrossRef.
- L. Rasines, S. Morera, G. S. Miguel, F. Artés-Hernández and E. Aguayo, Sci. Total Environ., 2023, 872, 162169 CrossRef PubMed.
| This journal is © The Royal Society of Chemistry 2026 |